A Comlensatbn of MEASURED EFFICIENCY OF HIGH EFFICIENCY AND STANDARD INDUCTION MOTORS by Roy S. Colby and Denise L. Flora INTRODUCTION Approximately 35 percent of the electricity generated in North Car- olina is used by the industrial sector, and about 75 percent of that goes to power motors and their loads. North Carolina indus- try spends about $800 million per year in energy costs to operate motors. North Carolina Alternative Energy Corporation (AEC) tested induction motor efficiencies to form a factual basis for recom- mending high-efficiency motors to North Carolina industry The goals were twofold: to compare high- efficiency motors with standard motors, and to compare new motors with rewound motors. Tests were performed on a small sample of four pole, 460 y three-phase, TEFC (totally enclosed, fan-cooled) induction motors in 5-, lo-, and 100-horse- power sizes. The efficiencytests were performed according to IEEE Standard 112 2 . The results of the tests indicate that the high-efficiency motors are indeed more efficient than the standard designs at full load. In addition, the high-efficiency motors operate closer to their peak efficiency over a wider range of loads than do the standard motors. The effect of motor rewind on efficiency was evaluated by rewinding four of the new 5- and 10-horsepower motors, and retesting them. The tests found only minor degradation in perfor- mance due to rewind. TEST RESULTS Full-Load Efflclency The first goal of the tests was to compare the measured efficiency of high-efficiency motors with standard motors. New 5-,lo- and 100-horsepower motors were tested, each from 25 percent to 150 percent of full load. The meas- ured full-load efficiency of each motor was compared with the value indicated on its nameplate, and the full-load efficiencies of the standard motors were compared with those of the high-efficiency motors. The measured efficien- cies presented in the paper are derived from the test data by cor- recting to an assumed operating temperature of 100 degrees Celsius. The full-load efficiency indicated on the motor nameplate is in most cases the nominal efficiency specified by the National Electri- cal Manufacturers Association (NEMA). This value is the average full-load efficiency that would be epcpected for a large population of motors of the same design. Some nameplates carry the NEMA- specified minimum value of full- load efficiency, which is the effi- ciency that should be attained by every motor of that design.
Transcript
A Comlensatbn of MEASURED EFFICIENCY OF HIGH EFFICIENCY AND STANDARD INDUCTION MOTORS by Roy S. Colby and Denise L. Flora
INTRODUCTION Approximately 35 percent of the
electricity generated in North Car- olina is used by the industrial sector, and about 75 percent of that goes to power motors and their loads. North Carolina indus- try spends about $800 million per year in energy costs to operate motors.
North Carolina Alternative Energy Corporation (AEC) tested induction motor efficiencies to form a factual basis for recom- mending high-efficiency motors to North Carolina industry The goals were twofold: to compare high- efficiency motors with standard motors, and to compare new motors with rewound motors.
Tests were performed on a small sample of four pole, 460 y three-phase, TEFC (totally enclosed, fan-cooled) induction motors in 5-, lo-, and 100-horse- power sizes. The efficiency tests were performed according to IEEE Standard 112 2 .
The results of the tests indicate that the high-eff iciency motors are indeed more efficient than the standard designs at full load. In addition, the high-efficiency motors operate closer to their peak efficiency over a wider range of loads than do the standard motors.
The effect of motor rewind on efficiency was evaluated by rewinding four of the new 5- and 10-horsepower motors, and
retesting them. The tests found only minor degradation in perfor- mance due to rewind.
TEST RESULTS Full-Load Efflclency
The first goal of the tests was to compare the measured efficiency of high-eff iciency motors with standard motors. New 5-,lo- and 100-horsepower motors were tested, each from 25 percent to 150 percent of full load. The meas- ured full-load efficiency of each motor was compared with the value indicated on its nameplate, and the full-load efficiencies of the standard motors were compared with those of the high-efficiency motors. The measured eff icien- cies presented in the paper are derived from the test data by cor- recting to an assumed operating temperature of 100 degrees Celsius.
The full-load efficiency indicated on the motor nameplate is in most cases the nominal efficiency specified by the National Electri- cal Manufacturers Association (NEMA). This value is the average full-load efficiency that would be epcpected for a large population of motors of the same design. Some nameplates carry the NEMA- specified minimum value of full- load efficiency, which is the effi- ciency that should be attained by every motor of that design.
M Standard
" _ . . . 88 68 90 92 94 96 98 100
Nameolate
95
90
3 - P " d E
80
7 5 t . ' . . I . . . . I ' . . . 0 50 100 151
Percent of Full Load
w -
".
0 Standard 8 0 - d High EHiciency
754 . I
0 50 100 150
Percent Full Load
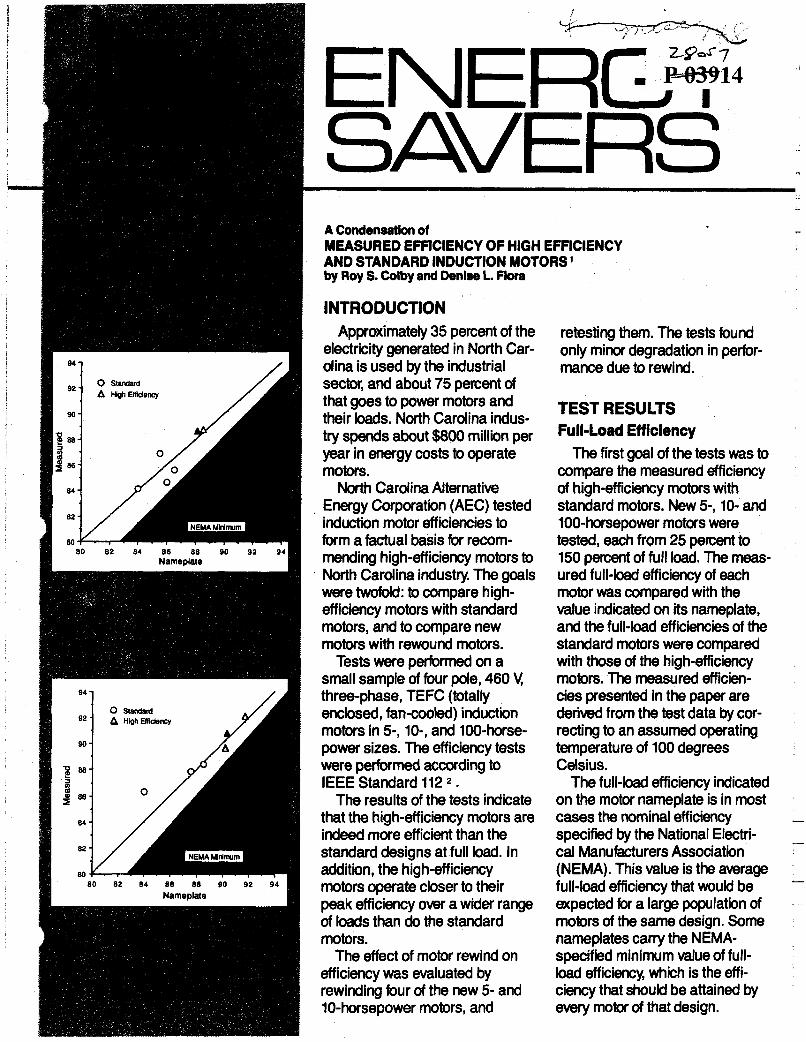
Seven new 5-horsepower motors were tested - three high- efficiency and four standard designs. Figure 1 shows the measured full-load efficiency of these motors plotted against their nameplate values. The solid trian- gle indicates a motor whose nameplate specified a minimum efficiency instead of a nominal value.
The upper straight line in Fig- ure 1 represents the NEMA nominal efficiency line; data points above this line indicate that the measured efficiency is greater than the nameplate value. The lower line, the NEMA minimum line, shows the minimum value that all motors should attain for a specified nominal efficiency. All data points should lie above this line.
The results in Figure 1 show that two of the energy-efficient motors were significantly more efficient than the best of the stan- dard designs, by more than 1.7 percentage points. This difference corresponds to about 65 Watts at full load.
Seven new 10-horsepower motors were tested -four energy- efficient and three standard designs (see Figure 2). Again, the energy-eff icient designs are more efficient than the standard designs at full load, with the best energy-efficient motor for this sample being about 3.7 percent- age points more efficient than the best standard motor. This difference corresponds to approximately 275 Watts at full load.
Six new 100-horsepower motors were tested - three energy-eff icient designs and three standard designs (see Figure 3). The least efficient high-eff iciency motor is about 1.0 percentage points more efficient than the
most efficient standard motor. The difference between the most and least efficient motors is 3.2 per- centage points, corresponding to about 2390 Watts at full load.
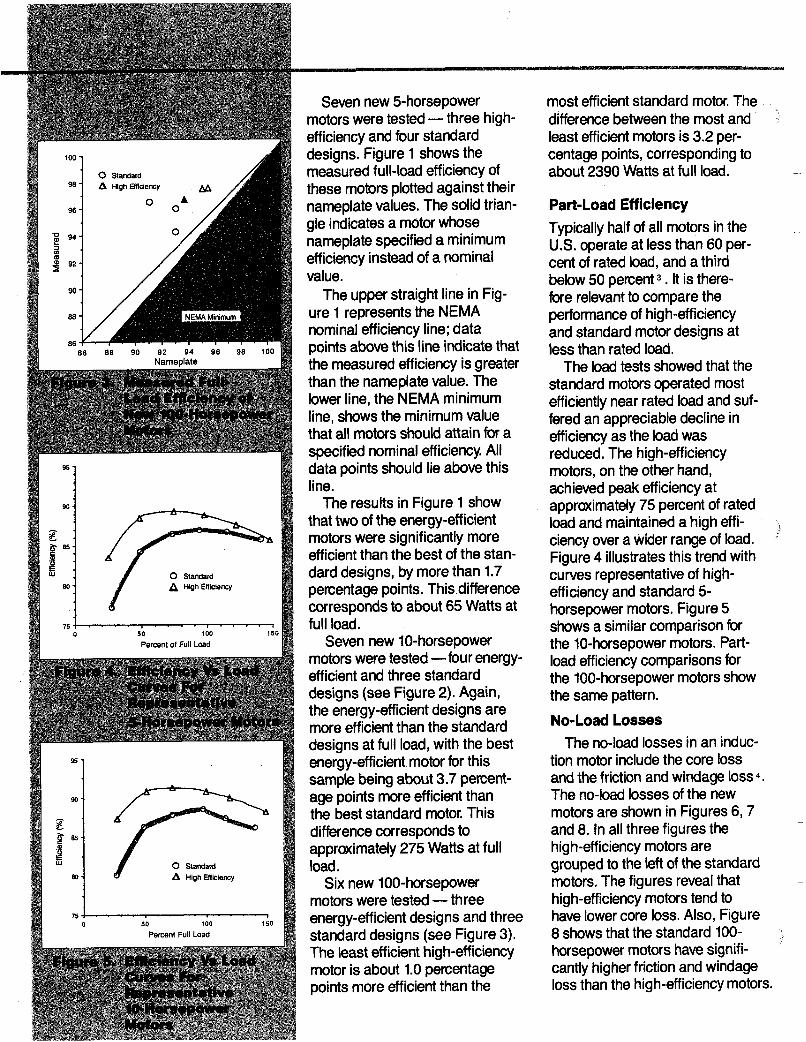
Part-Load Efficiency Typically half of all motors in the U.S. operate at less than 60 per- cent of rated load, and a third below 50 percent 3 . It is there- fore relevant to compare the performance of hig h-eff iciency and standard motor designs at less than rated load.
The load tests showed that the standard motors operated most efficiently near rated load and suf- fered an appreciable decline in efficiency as the load was reduced. The high-eff iciency motors, on the other hand, achieved peak efficiency at approximately 75 percent of rated load and maintained a high effi- ciency over a wider range of load. Figure 4 illustrates this trend with curves representative of high- efficiency and standard 5- horsepower motors. Figure 5 shows a similar comparison for the 10-horsepower motors. Part- load efficiency comparisons for the 100-horsepower motors show the same pattern.
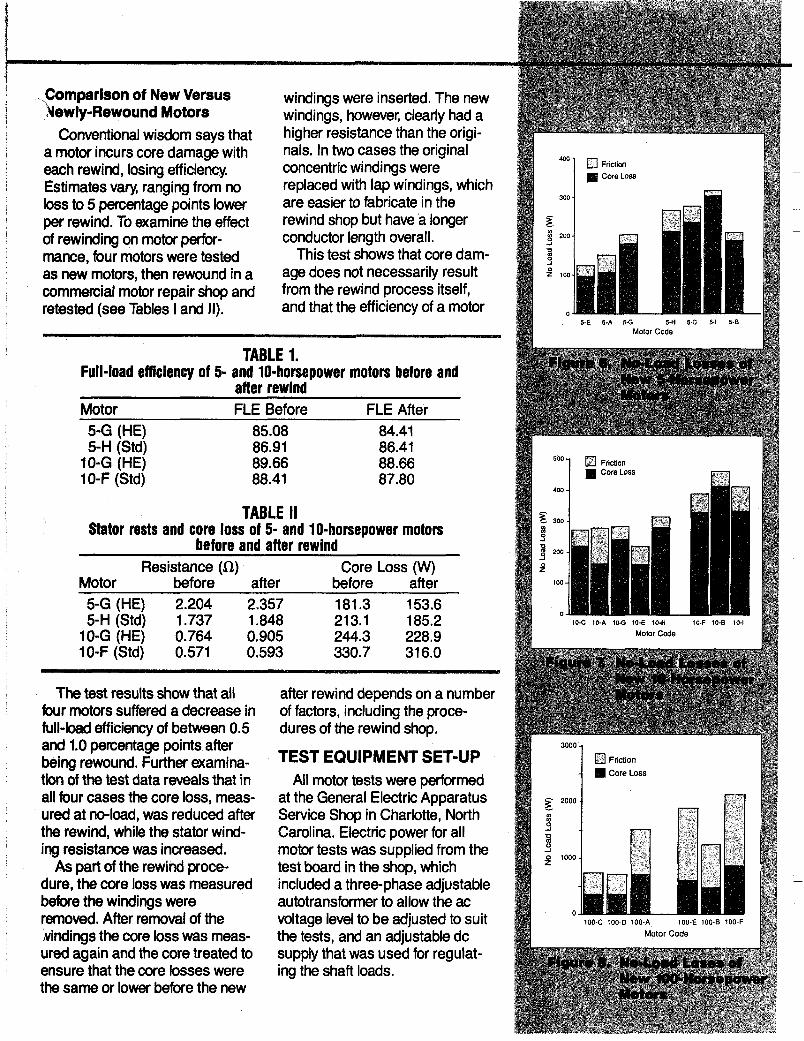
No-Load Losses The no-load losses in an induc-
tion motor include the core loss and the friction and windage loss4. The no-load losses of the new motors are shown in Figures 6,7 and 8. In all three figures the high-eff iciency motors are grouped to the left of the standard motors. The figures reveal that high-efficiency motors tend to have lower core loss. Also, Figure 8 shows that the standard 100- horsepower motors have signifi- cantly higher friction and windage loss than the high-eff iciency motors.
-
-
3 insertori Thp now Comparison of New Versus Newly-Rewound Motors
windings werc .. .__. ._-. . . . ._ .. windings, however, clearly had a higher resistance than the origi- Conventional wisdom says that
a motor incurs core damage with each rewind, losing efficiency. Estimates vary, ranging from no loss to 5 percentage points lower per rewind. To examine the effect of rewinding on motor perfor- mance, four motors were tested as new motors, then rewound in a commercial motor repair shop and retested (see Tables I and 11).
nals. In two cases the original concentric windings were replaced with lap windings, which are easier to fabricate in the rewind shop but have a longer conductor length overall.
age does not necessarily result from the rewind process itself, and that the efficiency of a motor
This test shows that core dam-
300
z 200
J P 0 -I
P 100
n 5-H 5-C 51 5-0 5-E 5.A 5 0
Motor Code
TABLE 1. Full-load efficiency of 5- and 10-horsepower motors before and
after rewind Motor FLE Before FLE After 5-G (HE) 85.08 84.41 5-H (Std) 86.91 86.41
10-G (HE) 89.66 88.66 10-F (Std) 88.41 87.80
TABLE II Stator rests and core loss of 5- and 10-horsepower motors
before and after rewind Resistance (a) Core Loss (W)
The test results show that all four motors suffered a decrease in full-load efficiency of between 0.5
after rewind depends on a number of factors, including the proce- dures of the rewind shop.
and 1.0 percentage points after being rewound. Further examina- tion of the test data reveals that in all four cases the core loss, meas- ured at no-load, was reduced after the rewind, while the stator wind- ing resistance was increased.
As part of the rewind proce- dure, the core loss was measured before the windings were removed. After removal of the Andings the core loss was meas- ured again and the core treated to ensure that the core losses were the same or lower before the new
TEST EQUIPMENT SET-UP All motor tests were performed
at the General Electric Apparatus Service Shop in Charlotte, North Carolina. Electric power for all motor tests was supplied from the test board in the shop, which included a three-phase adjustable autotransformer to allow the ac voltage level to be adjusted to suit the tests, and an adjustable dc supply that was used for regulat- ing the shaft loads.
4w v 60 Hz 3-0
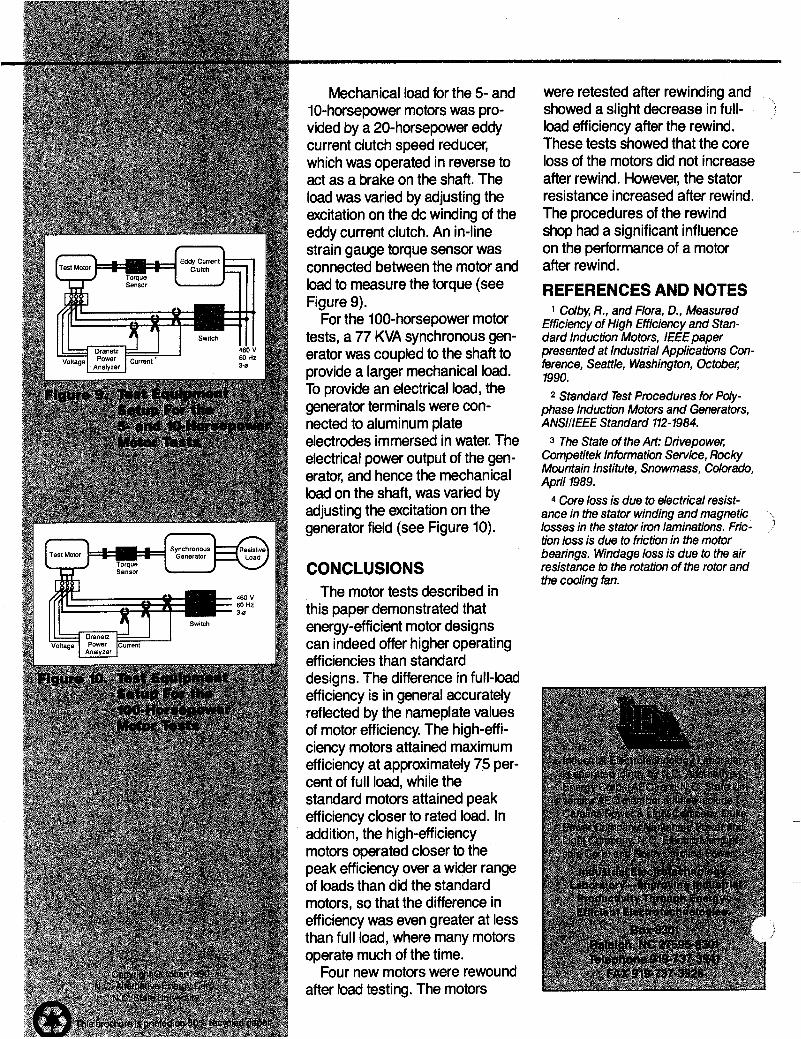
Mechanical load for the 5- and 1 0-horsepower motors was pro- vided by a 20- horsepower eddy current clutch speed reducer, which was operated in reverse to act as a brake on the shaft. The load was varied by adjusting the excitation on the dc winding of the eddy current clutch. An in-line strain gauge torque sensor was connected between the motor and load to measure the torque (see Figure 9).
For the 100-horsepower motor tests, a 77 KVA synchronous gen- erator was coupled to the shaft to provide a larger mechanical load. To provide an electrical load, the generator terminals were con- nected to aluminum plate electrodes immersed in water. The electrical power output of the gen- erator, and hence the mechanical load on the shaft, was varied by adjusting the excitation on the generator field (see Figure 10).
CONCLUSIONS The motor tests described in
this paper demonstrated that energy-eff icient motor designs can indeed offer higher operating efficiencies than standard designs. The difference in full-load efficiency is in general accurately reflected by the nameplate values of motor efficiency, The high-eff i- ciency motors attained maximum efficiency at approximately 75 per- cent of full load, while the standard motors attained peak efficiency closer to rated load. In addition , the hig h-eff iciency motors operated closer to the peak efficiency over a wider range of loads than did the standard motors, so that the difference in efficiency was even greater at less than full load, where many motors operate much of the time.
Four new motors were rewound after load testing. The motors
were retested after rewinding and showed a slight decrease in full- load efficiency after the rewind. These tests showed that the core loss of the motors did not increase after rewind. However, the stator resistance increased after rewind. The procedures of the rewind
on the performance of a motor after rewind.
REFERENCES AND NOTES 1 Cdby, R., and Flora, D., Measured
Efficiency of High Efficiency and Stan- dard Induction Motors, IEEE paper presented at Industrial Applications Con- ference, Seattle, Washington, October; 1990.
2 Standard Test Procedures for Poly- phase Induction Motors and Generators, ANSIIIEEE Standard 112-1984.
3 The State of the Art: Drivepower; Competitek Information Service, Rocky Mountain Institute, Snowmass, Colorado, April 1989.
4 Core loss is due to electrical resist- ance in the stator winding and magnetic losses in the stator iron laminations. Fric- tion loss is due to friction in the motor bearings. Windage loss is due to the air resistance to the rotation of the rotor and the coding fan.