27
Investor Presentation June 18, 2014 TE CONNECTIVITY ACQUIRES MEASUREMENT SPECIALTIES
| Date post: | 12-May-2018 |
| Category: |
Documents |
| Upload: | hoangthien |
| View: | 215 times |
| Download: | 0 times |

Investor PresentationJune 18, 2014
TE CONNECTIVITY ACQUIRES MEASUREMENT SPECIALTIES
Forward Looking StatementsThis presentation contains certain “forward-looking statements” within the meaning of the U.S. Private Securities Litigation Reform Act of 1995. These statements are based on management’s current expectations and are subject to risks, uncertainty and changes in circumstances, which may cause actual results, performance, financial condition or achievements to differ materially from anticipated results, performance, financial condition or achievements. All statements contained herein that are not clearly historical in nature are forward-looking and the words “anticipate,” “believe,” “expect,” “estimate,” “plan,” and similar expressions are generally intended to identify forward-looking statements. We have no intention and are under no obligation to update or alter (and expressly disclaim any such intention or obligation to do so) our forward-looking statements whether as a result of new information, future events or otherwise, except to the extent required by law. The forward-looking statements in this presentation include statements addressing our future financial condition and operating results; our ability to fund and consummate the transaction, including the entry into financing arrangements and the receipt of regulatory approvals; and our ability to realize projected financial impacts of and to integrate the acquisition. Examples of factors that could cause actual results to differ materially from those described in the forward-looking statements include, among others, business, economic, competitive and regulatory risks, such as conditions affecting demand for products, particularly in the automotive industry and the telecommunications networks and consumer devices industries; competition and pricing pressure; fluctuations in foreign currency exchange rates and commodity prices; natural disasters and political, economic and military instability in countries in which we operate; developments in the credit markets; future goodwill impairment; compliance with current and future environmental and other laws and regulations; the possible effects on us of changes in tax laws, tax treaties and other legislation; the risk that the transaction may not be consummated; the risk that a regulatory approval that may be required for the transaction is not obtained or is obtained subject to conditions that are not anticipated; the risk that Measurement Specialties’ operations will not be successfully integrated into ours; and the risk that revenue opportunities, cost savings and other anticipated synergies from the transaction may not be fully realized or may take longer torealize than expected. More detailed information about these and other factors is set forth in TE Connectivity Ltd.’s Annual Report on Form 10-K for the fiscal year ended Sept. 27, 2013 as well as in our Quarterly Reports on Form 10-Q, Current Reports on Form 8-K, and other reports filed by us with the U.S. Securities and Exchange Commission.
Forward-Looking Statements
2

Additional Information and Where to Find It -- This communication is for informational purposes only and does not constitute an offer to purchase or a solicitation of any proxy, vote or approval. In connection with the proposed merger, Measurement Specialties, Inc. (MEAS) intends to file a proxy statement and related documents with the U.S. Securities and Exchange Commission (“SEC”). The definitive proxy statement will be mailed to MEAS shareholders. INVESTORS AND SECURITY HOLDERS ARE URGED TO READ THE PROXY STATEMENT AND ANY OTHER RELEVANT MATERIALS WHEN THEY BECOME AVAILABLE BECAUSE THEY WILL CONTAIN IMPORTANT INFORMATION. Investors and security holders may obtain a free copy of the proxy statement and other relevant documents (in each case when available) filed by MEAS and TE Connectivity Ltd. with the SEC at the website maintained by the SEC at www.sec.gov. Copies of the documents filed by MEAS with the SEC will be available free of charge at the website maintained by MEAS at www.meas-spec.com. Copies of the documents filed by TE Connectivity Ltd. with the SEC will be available free of charge at the website maintained by TE Connectivity Ltd. at www.te.com. MEAS and its directors, executive officers and certain other employees may be deemed to be participants in the solicitation of proxies from MEAS’ shareholders with respect to the proposed merger. Information about MEAS’ directors and executive officers and their ownership of MEAS’ common stock is set forth in the proxy statement for MEAS’ 2013 Annual Meeting of Stockholders, which was filed with the SEC on July 29, 2013, and MEAS’ Annual Report on Form 10-K for the fiscal year ended March 31, 2014, which was filed with the SEC on June 3, 2014. Additional information regarding persons who may be deemed to be participants in the solicitation of proxies in respect of the proposed merger will be contained in the proxy statement to be filed by MEAS with the SEC.
Non-Solicitation
3

Provides customers with the broadest portfolio of connectivity and sensing solutions
Leverages TE scale into the attractive,fragmented sensor market
Provides significant opportunity for growth
and TAM expansion
Creates significant shareholder value
Combination Creates Unrivaled Leader in Connectors and Sensors
4
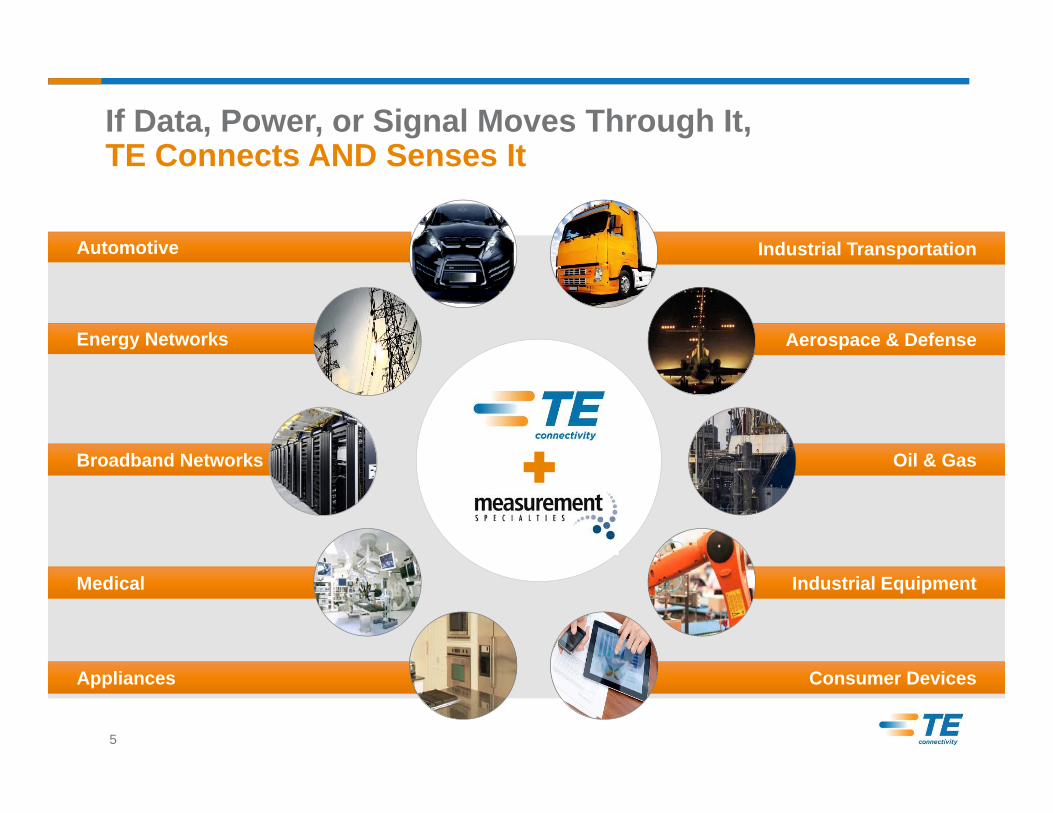
Industrial Transportation
Consumer Devices
Industrial Equipment
Oil & Gas
Aerospace & Defense
Automotive
If Data, Power, or Signal Moves Through It, TE Connects AND Senses It
5
Appliances
Medical
Broadband Networks
Energy Networks
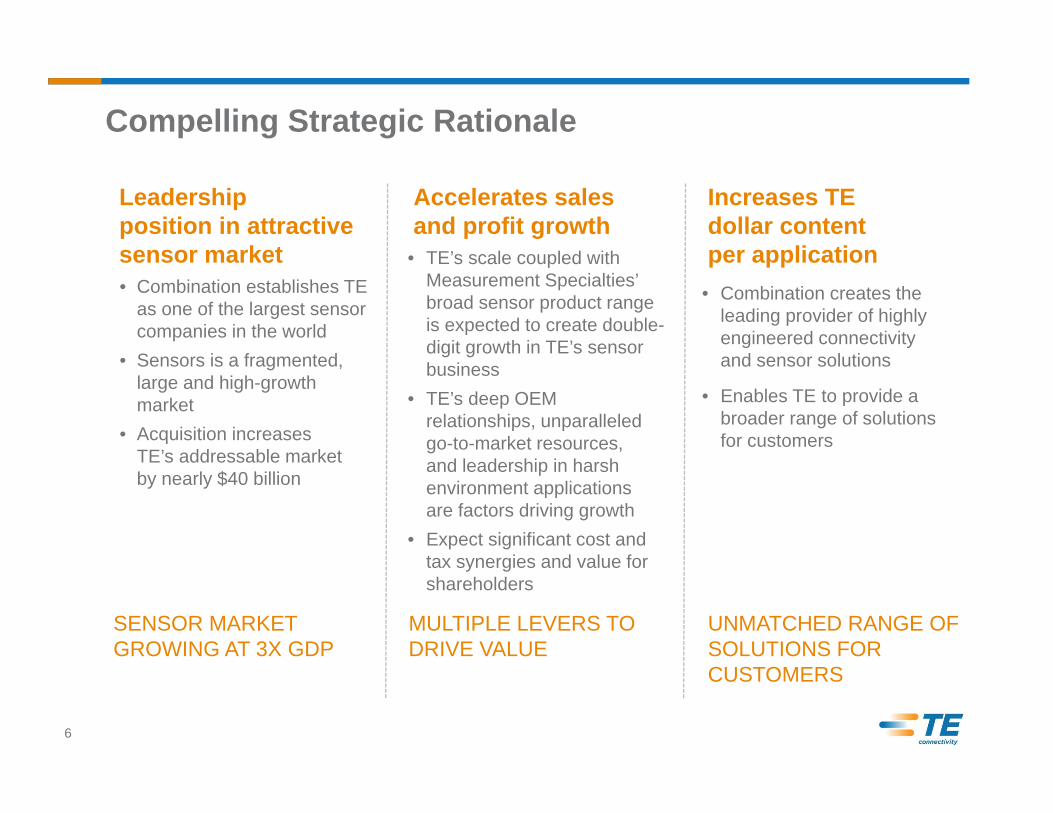
Leadership position in attractive sensor market• Combination establishes TE
as one of the largest sensor companies in the world
• Sensors is a fragmented,large and high-growth market
• Acquisition increases TE’s addressable market by nearly $40 billion
Compelling Strategic Rationale
Accelerates sales and profit growth
• TE’s scale coupled with Measurement Specialties’ broad sensor product range is expected to create double-digit growth in TE’s sensor business
• TE’s deep OEM relationships, unparalleled go-to-market resources, and leadership in harsh environment applications are factors driving growth
• Expect significant cost and tax synergies and value for shareholders
Increases TE dollar content per application
• Combination creates the leading provider of highly engineered connectivity and sensor solutions
• Enables TE to provide a broader range of solutions for customers
SENSOR MARKET GROWING AT 3X GDP
MULTIPLE LEVERS TO DRIVE VALUE
UNMATCHED RANGE OF SOLUTIONS FOR CUSTOMERS
6

Global Sensor Market
Sources: BCC Research, Strategic Analytics, TE Analysis(1) FY2013 sales for TE
$116B
$80B
2019
+8%
2014
The global sensor market is large, profitable and high growth
Sensors and connectors have common end market-segments, and a common customer base
Global trends of Green, Safe, Connected, and Reliable systems are driving sensor and connector content growth
Similar to connectors, high value-to-cost ratio, customized design, high-touch go-to-market, and long design cycle make sensor profit pools attractive
The sensor market is highly fragmented with few large incumbents
A position in both sensors and connectors enables TE to lead in providing system-level solutions
Acquisition builds upon TE’s successful and growing sensor business, which has doubled to ~$200M since 2010
7
Sensors – An Attractive Growth Market
5%
37%
21%
19%
12%
6%Other
Industrial
Transportation
ADM
Consumer
Medical
Global Sensor Market TE Sales1
1.5%
14%
41%11%1.5%
8%
23%
Other
ADM
Medical
Industrial
Transportation
Networks
TE’s Scale in Connectors Will Accelerate Growth In Sensors
TEOA Operations Excellence
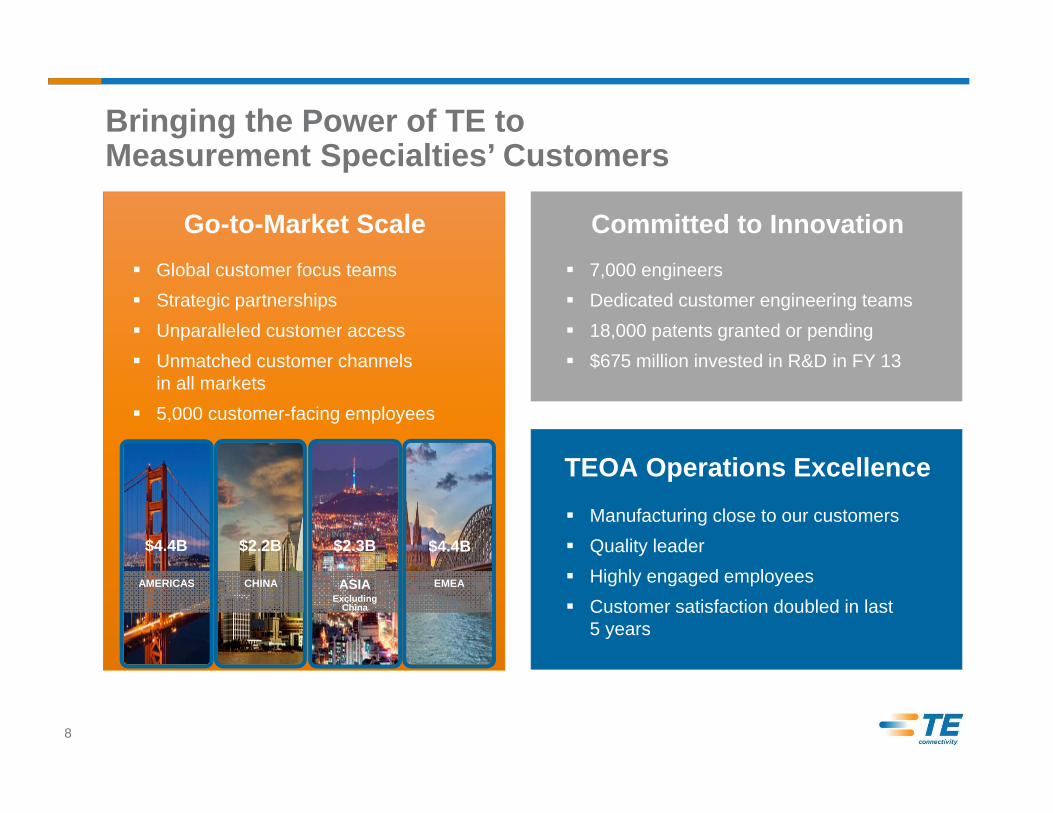
Committed to Innovation Global customer focus teams Strategic partnerships Unparalleled customer access Unmatched customer channels
in all markets 5,000 customer-facing employees
7,000 engineers Dedicated customer engineering teams 18,000 patents granted or pending $675 million invested in R&D in FY 13
Manufacturing close to our customers Quality leader Highly engaged employees Customer satisfaction doubled in last
5 years
Bringing the Power of TE to Measurement Specialties’ Customers
Go-to-Market Scale
$4.4B
AMERICAS CHINA ASIA EMEAExcluding
China
$2.2B $2.3B $4.4B
8
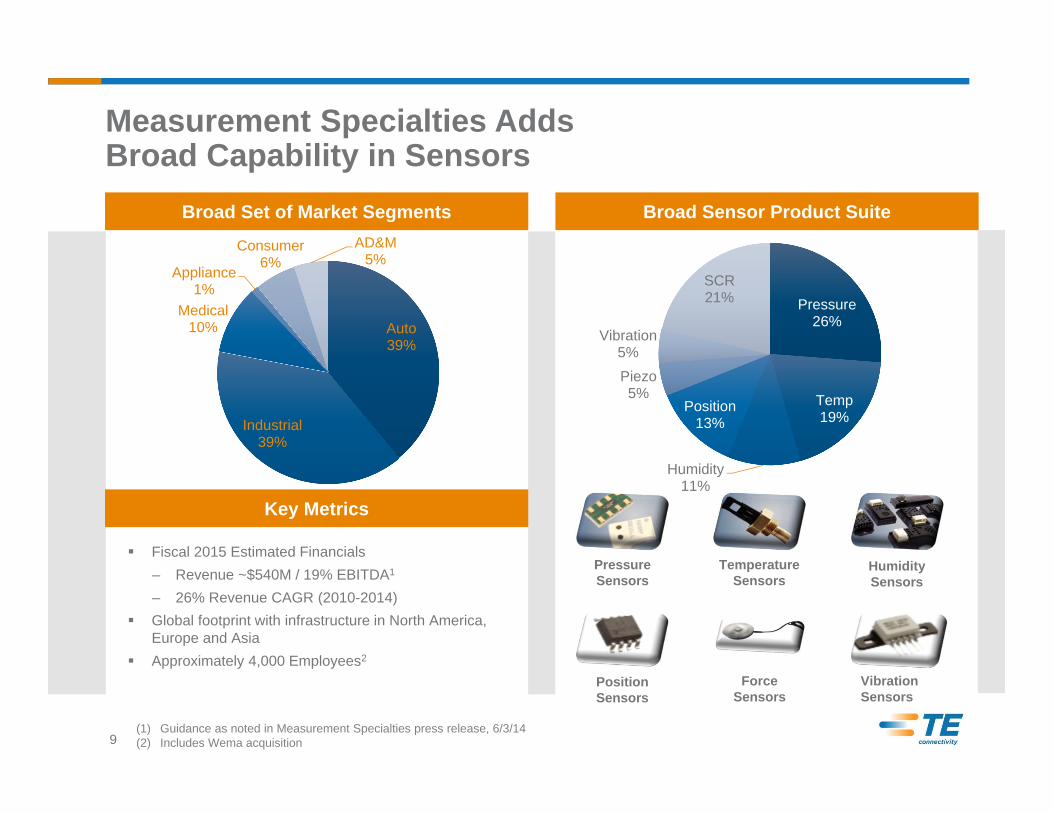
Broad Set of Market Segments
VibrationSensors
ForceSensors
HumiditySensors
PressureSensors
PositionSensors
TemperatureSensors
Key Metrics
Fiscal 2015 Estimated Financials– Revenue ~$540M / 19% EBITDA1
– 26% Revenue CAGR (2010-2014) Global footprint with infrastructure in North America,
Europe and Asia Approximately 4,000 Employees2
(1) Guidance as noted in Measurement Specialties press release, 6/3/14(2) Includes Wema acquisition9
Broad Sensor Product Suite
Measurement Specialties Adds Broad Capability in Sensors
Pressure26%
Temp19%
Humidity11%
Position13%
Piezo5%
Vibration5%
SCR21%
Auto39%
Industrial39%
Medical10%
Appliance1%
Consumer6%
AD&M5%

10
Automotive Industrial Transportation Industrial AD&M Medical Appliance/
Consumer
SEN
SOR
TYP
ES
Temperature
Pressure
Position Position~$200MTE SENSOR BUSINESS
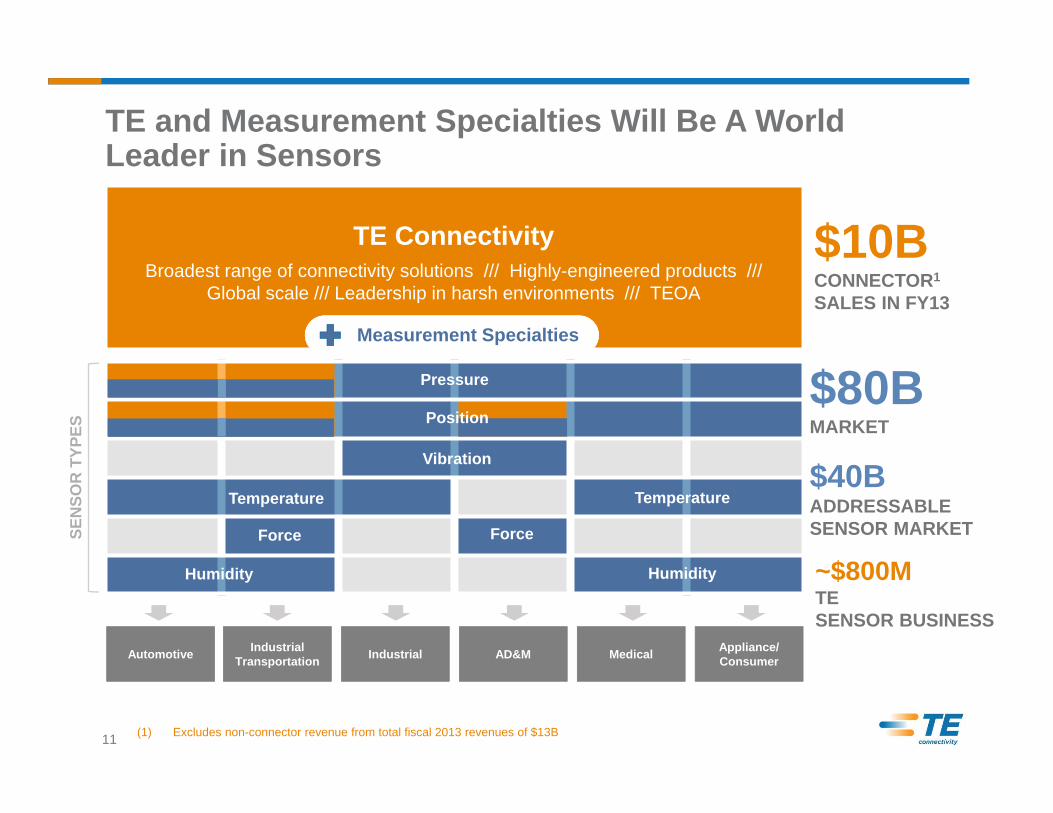
~$10BCONNECTOR1
SALES IN FY13
TE ConnectivityBroadest range of connectivity solutions /// Highly-engineered products ///
Global scale /// Leadership in harsh environments /// TEOA
(1) Excludes non-connector revenue from total fiscal 2013 revenues of $13B
TE is the World Leader in Connectivity
11
SEN
SOR
TYP
ES
$10BCONNECTOR1
SALES IN FY13
$40BADDRESSABLESENSOR MARKET
Pressure
Position
Vibration
Temperature Temperature
~$800MTE SENSOR BUSINESS
Automotive Industrial Transportation Industrial AD&M Medical Appliance/
Consumer
Humidity Humidity
Force Force
TE ConnectivityBroadest range of connectivity solutions /// Highly-engineered products ///
Global scale /// Leadership in harsh environments /// TEOA
Measurement Specialties
$80BMARKET
(1) Excludes non-connector revenue from total fiscal 2013 revenues of $13B
TE and Measurement Specialties Will Be A World Leader in Sensors
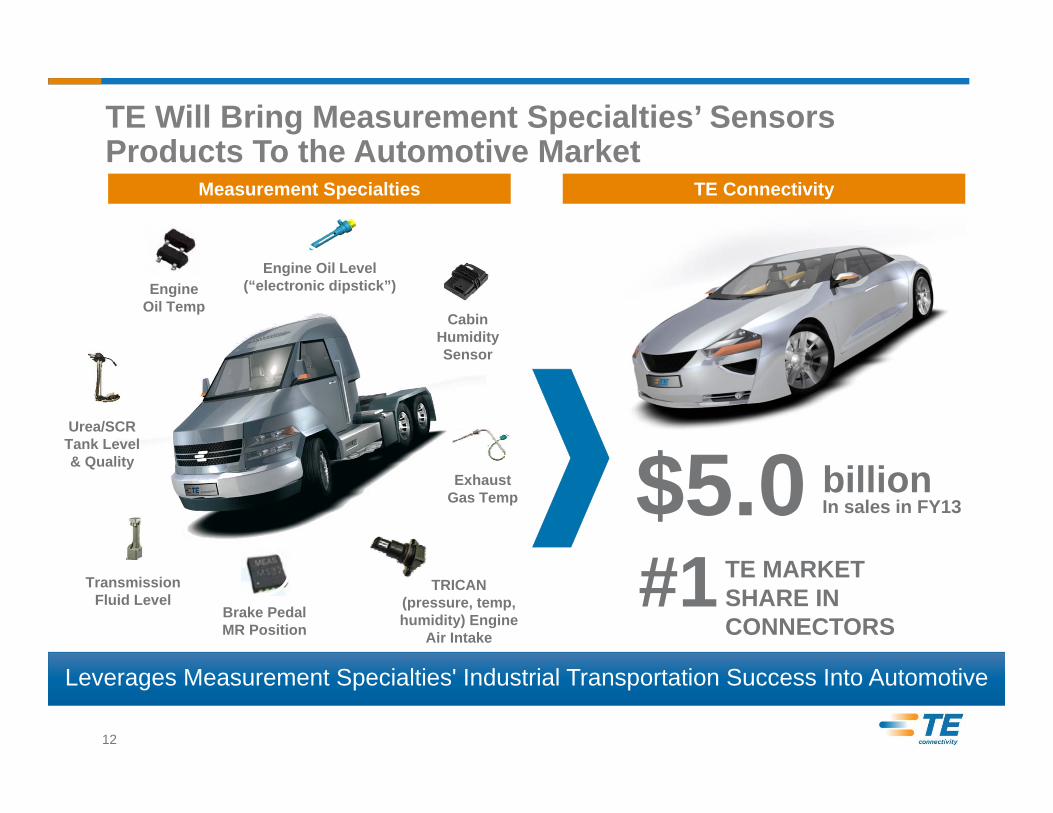
TransmissionFluid Level
TRICAN (pressure, temp, humidity) Engine
Air Intake
ExhaustGas Temp
CabinHumidity Sensor
Engine Oil Level (“electronic dipstick”)Engine
Oil Temp
Brake PedalMR Position
billionIn sales in FY13$5.0
TE MARKET SHARE IN CONNECTORS
#1
Measurement Specialties TE Connectivity
TE Will Bring Measurement Specialties’ Sensors Products To the Automotive Market
Urea/SCRTank Level& Quality
Leverages Measurement Specialties' Industrial Transportation Success Into Automotive
12

Transaction Value
Financial Impact
Timing
Revenue and Cost Synergies
Capital
• $86 a share in cash• $1.7B including assumption of net debt
• Multiple revenue synergy opportunities• Significant tax synergies• Significant cost savings through application of our TEOA system
• Expected to be accretive by mid-single digits to adjusted EPS in year 1• Accretive to revenue growth and gross margin
• Financing with $1.3B of debt and cash on hand• Expect to continue to return ~2/3 of FCF to shareholders over time
• Deal subject to Measurement Specialties’ shareholder approval• Expect to close in calendar year 2014
Transaction Highlights
13

Adjusted Gross Margin, Adjusted Operating Margin, Adjusted EPS, and Free Cash Flow are non-GAAP measures; see Appendix for description and reconciliation.
Adj. Gross Margin % >34%
Adj. Operating Margin >15%
FY12 FY13
Trailing 12 Month’sResults (1)
Target Model
31.0% 32.6%33.6%
13.2% 14.2%15.1%
Adj. EPS $2.86 $3.23Double-
Digit Growth
$3.58
Revenue $13.3B $13.3B 5-7% organic growth
$13.6B
Free Cash Flow ($B) $1.4 $1.5 ~Net Income$1.4
(1) Represents the summation of results for the quarters ended June 28, 2013, September 27, 2013, December 27, 2013, and March 28, 2014
Measurement Specialties Acquisition Is A Great Fit with TE’s Target Financial Model
14
• Leverages TE’s strengths – unparalleled go-to-market capabilities, deep OEM relationships and global footprint – to drive double-digit growth in sensors
• Establishes TE as a leader in the high-growth sensor market
• Increases TE’s addressable market by nearly $40 billion
• Furthers TE’s position in high-margin harsh environment applications
• Drives growth and returns for shareholders
Summary
15

Appendix
16
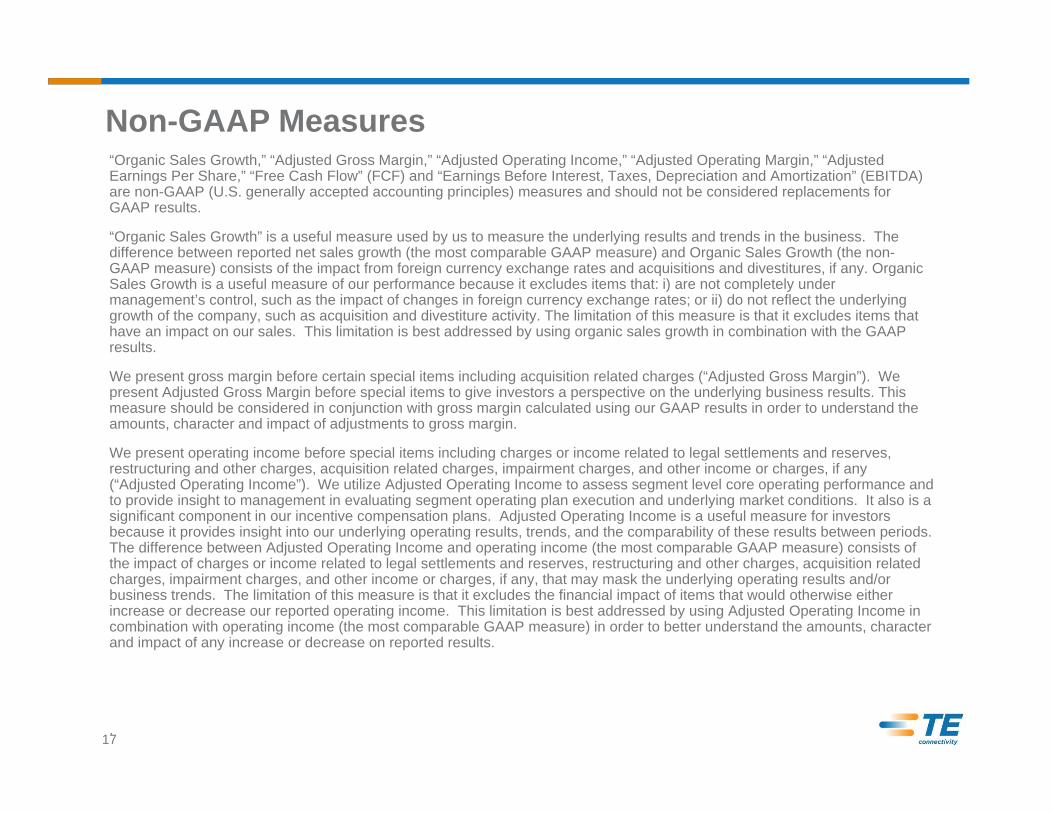
Non-GAAP Measures“Organic Sales Growth,” “Adjusted Gross Margin,” “Adjusted Operating Income,” “Adjusted Operating Margin,” “Adjusted Earnings Per Share,” “Free Cash Flow” (FCF) and “Earnings Before Interest, Taxes, Depreciation and Amortization” (EBITDA) are non-GAAP (U.S. generally accepted accounting principles) measures and should not be considered replacements for GAAP results.
“Organic Sales Growth” is a useful measure used by us to measure the underlying results and trends in the business. The difference between reported net sales growth (the most comparable GAAP measure) and Organic Sales Growth (the non-GAAP measure) consists of the impact from foreign currency exchange rates and acquisitions and divestitures, if any. Organic Sales Growth is a useful measure of our performance because it excludes items that: i) are not completely under management’s control, such as the impact of changes in foreign currency exchange rates; or ii) do not reflect the underlying growth of the company, such as acquisition and divestiture activity. The limitation of this measure is that it excludes items that have an impact on our sales. This limitation is best addressed by using organic sales growth in combination with the GAAP results.
We present gross margin before certain special items including acquisition related charges (“Adjusted Gross Margin”). We present Adjusted Gross Margin before special items to give investors a perspective on the underlying business results. This measure should be considered in conjunction with gross margin calculated using our GAAP results in order to understand the amounts, character and impact of adjustments to gross margin.
We present operating income before special items including charges or income related to legal settlements and reserves, restructuring and other charges, acquisition related charges, impairment charges, and other income or charges, if any (“Adjusted Operating Income”). We utilize Adjusted Operating Income to assess segment level core operating performance and to provide insight to management in evaluating segment operating plan execution and underlying market conditions. It also is a significant component in our incentive compensation plans. Adjusted Operating Income is a useful measure for investors because it provides insight into our underlying operating results, trends, and the comparability of these results between periods. The difference between Adjusted Operating Income and operating income (the most comparable GAAP measure) consists of the impact of charges or income related to legal settlements and reserves, restructuring and other charges, acquisition related charges, impairment charges, and other income or charges, if any, that may mask the underlying operating results and/or business trends. The limitation of this measure is that it excludes the financial impact of items that would otherwise either increase or decrease our reported operating income. This limitation is best addressed by using Adjusted Operating Income in combination with operating income (the most comparable GAAP measure) in order to better understand the amounts, character and impact of any increase or decrease on reported results.
.17

Non-GAAP Measures, continuedWe present operating margin before special items including charges or income related to legal settlements and reserves, restructuring and other charges, acquisition related charges, impairment charges, and other income or charges, if any (“Adjusted Operating Margin”). We present Adjusted Operating Margin before special items to give investors a perspective on the underlying business results. It also is a significant component in our incentive compensation plans. This measure should be considered in conjunction with operating margin calculated using our GAAP results in order to understand the amounts, character and impact of adjustments to operating margin.
We present diluted earnings per share from continuing operations attributable to TE Connectivity Ltd. before special items, including charges or income related to legal settlements and reserves, restructuring and other charges, acquisition related charges, impairment charges, tax sharing income related to certain proposed adjustments to prior period tax returns and othertax items, certain significant special tax items, other income or charges, if any, and, if applicable, related tax effects (“Adjusted Earnings Per Share” or “Adjusted EPS”). We present Adjusted EPS because we believe that it is appropriate for investors to consider results excluding these items in addition to results in accordance with GAAP.
We believe such a measure provides a picture of our results that is more comparable among periods since it excludes the impact of special items, which may recur, but tend to be irregular as to timing, thereby making comparisons between periods more difficult. It also is a significant component in our incentive compensation plans. The limitation of this measure is that it excludes the financial impact of items that would otherwise either increase or decrease our reported results. This limitation is best addressed by using Adjusted Earnings Per Share in combination with diluted earnings per share from continuing operations attributable to TE Connectivity Ltd. (the most comparable GAAP measure) in order to better understand the amounts, character and impact of any increase or decrease on reported results.
The forecasted Adjusted EPS accretion amount that is set forth in this presentation is a non-GAAP measure and should not be considered a replacement for GAAP results. With regard to this forward-looking forecasted non-GAAP financial measure, reconciliation to the applicable forward-looking forecasted GAAP financial measure is not provided because it is not available without unreasonable effort.
“Free Cash Flow” (FCF) is a useful measure of our ability to generate cash. It also is a significant component in our incentivecompensation plans.
The difference between net cash provided by continuing operating activities (the most comparable GAAP measure) and FCF (the non-GAAP measure) consists mainly of significant cash outflows and inflows that we believe are useful to identify. We believe free cash flow provides useful information to investors as it provides insight into the primary cash flow metric used bymanagement to monitor and evaluate cash flows generated from our operations.
18

Non-GAAP Measures, continuedFCF is defined as net cash provided by continuing operating activities excluding voluntary pension contributions and the cash impact of special items, if any, minus net capital expenditures. Net capital expenditures consist of capital expenditures less proceeds from the sale of property, plant, and equipment. These items are subtracted because they represent long-term commitments. Voluntary pension contributions are excluded from the GAAP measure because this activity is driven by economic financing decisions rather than operating activity. Certain special items, including net payments related to pre-separation taxmatters, also are considered by management in evaluating free cash flow. We believe investors should also consider these items in evaluating our free cash flow. We forecast our cash flow results excluding any voluntary pension contributions becausewe have not yet made a determination about the amount and timing of any such future contributions. In addition, our forecastexcludes the cash impact of special items because we cannot predict the amount and timing of such items.
FCF as presented herein may not be comparable to similarly-titled measures reported by other companies. The primary limitation of this measure is that it excludes items that have an impact on our GAAP cash flow. Also, it subtracts certain cashitems that are ultimately within management’s and the Board of Directors’ discretion to direct and may imply that there is less or more cash available for our programs than the most comparable GAAP measure indicates. This limitation is best addressed by using FCF in combination with the GAAP cash flow results. It should not be inferred that the entire free cash flow amount isavailable for future discretionary expenditures, as our definition of free cash flow does not consider certain non-discretionaryexpenditures, such as debt payments. In addition, we may have other discretionary expenditures, such as discretionary dividends, share repurchases, and business acquisitions, that are not considered in the calculation of free cash flow.
With regard to the forward-looking financial measure of our forecasted Adjusted EPS, reconciliation to the applicable forward-looking forecasted GAAP financial measure is not provided because it is not available without unreasonable effort.
The forecasted EBITDA margin amount for Measurement Specialties that is set forth in this presentation is a non-GAAP measure and should not be considered a replacement for GAAP results. “EBITDA” represents net income before interest expense, interest income, income taxes, depreciation and amortization. EBITDA is not intended to represent Measurement Specialties’ results of operations in accordance with GAAP and should not be considered a substitute for net income or any other operatingmeasure prepared in accordance with GAAP. With regard to the forward-looking financial measure of the forecasted EBITDA margin amount for Measurement Specialties, reconciliation to the applicable forward-looking forecasted GAAP financial measure is not provided because it is not available without unreasonable effort.
19

RECONCILIATION OF GROSS MARGIN AND GROSS MARGIN PERCENTAGE
For the Years EndedSeptember 27, September 28, March 28, December 27, September 27, June 28,
2013 2012 2014 2013 2013 2013($ in millions)
Net sales 13,280$ 13,282$ 3,431$ 3,326$ 3,432$ 3,449$ Cost of sales 8,951 9,236 2,258 2,209 2,276 2,317 Gross margin 4,329 4,046 1,173 1,117 1,156 1,132
Gross margin percentage 32.6% 30.5% 34.2% 33.6% 33.7% 32.8%
Acquisition Related Charges - 75 - - - -
Adjusted gross margin (1) 4,329$ 4,121$ 1,173$ 1,117$ 1,156$ 1,132$
Adjusted gross margin percentage (1) 32.6% 31.0% 34.2% 33.6% 33.7% 32.8%
(1) See description of non-GAAP measures contained in this appendix.
For the Quarters Ended
($ in millions)
20
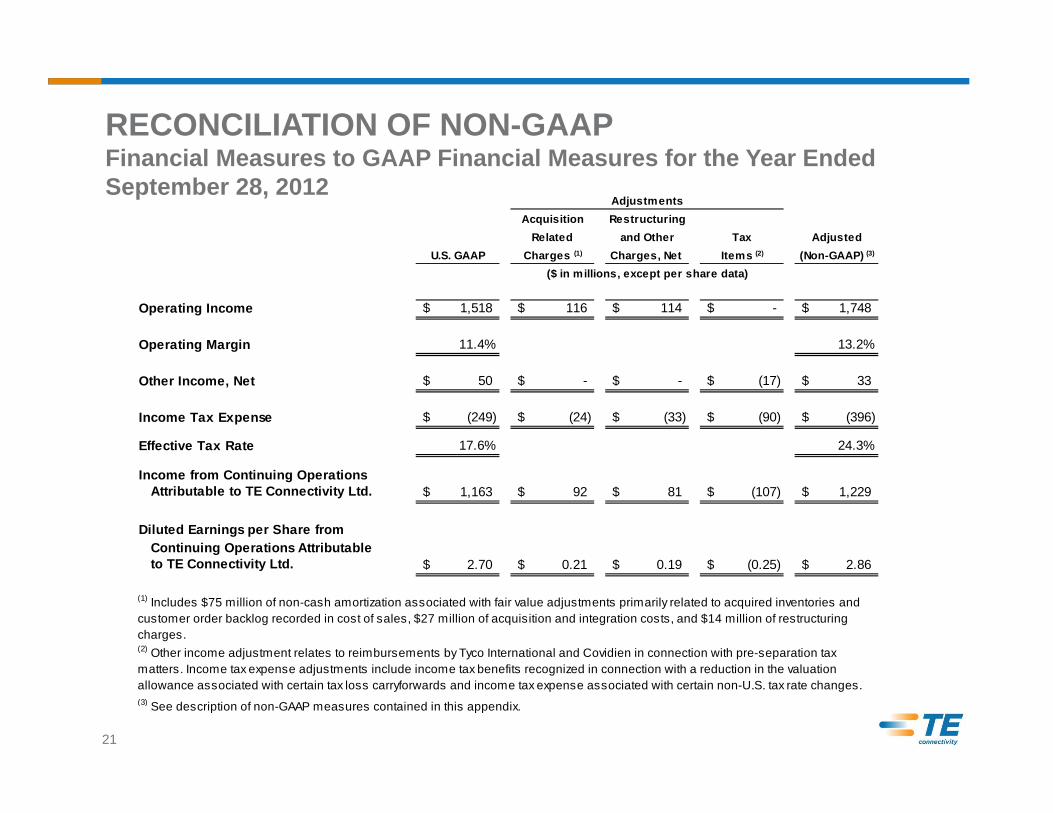
RECONCILIATION OF NON-GAAP Financial Measures to GAAP Financial Measures for the Year Ended September 28, 2012
Acquisition RestructuringRelated and Other Tax Adjusted
U.S. GAAP Charges (1) Charges, Net Items (2) (Non-GAAP) (3)
Operating Income 1,518$ 116$ 114$ -$ 1,748$
Operating Margin 11.4% 13.2%
Other Income, Net 50$ -$ -$ (17)$ 33$
Income Tax Expense (249)$ (24)$ (33)$ (90)$ (396)$
Effective Tax Rate 17.6% 24.3%
Income from Continuing Operations Attributable to TE Connectivity Ltd. 1,163$ 92$ 81$ (107)$ 1,229$
Diluted Earnings per Share from Continuing Operations Attributable to TE Connectivity Ltd. 2.70$ 0.21$ 0.19$ (0.25)$ 2.86$
(1) Includes $75 million of non-cash amortization associated with fair value adjustments primarily related to acquired inventories and customer order backlog recorded in cost of sales, $27 million of acquisition and integration costs, and $14 million of restructuring charges. (2) Other income adjustment relates to reimbursements by Tyco International and Covidien in connection with pre-separation tax matters. Income tax expense adjustments include income tax benefits recognized in connection with a reduction in the valuation allowance associated with certain tax loss carryforwards and income tax expense associated with certain non-U.S. tax rate changes.(3) See description of non-GAAP measures contained in this appendix.
Adjustments
($ in millions, except per share data)
21

RECONCILIATION OF NON-GAAP Financial Measures to GAAP Financial Measures for the Year Ended September 27, 2013
Acquisition RestructuringRelated and Other Tax Adjusted
U.S. GAAP Charges Charges, Net Items (1) (Non-GAAP) (2)
Operating Income 1,556$ 14$ 311$ -$ 1,881$
Operating Margin 11.7% 14.2%
Other Income (Expense), Net (183)$ -$ -$ 213$ 30$
Income Tax (Expense) Benefit 29$ (5)$ (90)$ (354)$ (420)$
Effective Tax Rate (2.3)% 23.5%
Income from Continuing Operations Attributable to TE Connectivity Ltd. 1,276$ 9$ 221$ (141)$ 1,365$
Diluted Earnings per Share from Continuing Operations Attributable to TE Connectivity Ltd. 3.02$ 0.02$ 0.52$ (0.33)$ 3.23$
(1) Includes $331 million of income tax benefits associated with the settlement of an audit of prior year income tax returns as well as the related impact of $231 million to other expense pursuant to the tax sharing agreement with Tyco International and Covidien. Also includes income tax expense related to adjustments to prior year income tax returns, income tax benefits recognized in connection with a reduction in the valuation allowance associated with certain tax loss carryforwards, and income tax benefits recognized in connection with the lapse of statutes of limitations for examinations of prior year income tax returns. In addition, the other income adjustment includes amounts related to reimbursements by Tyco International and Covidien in connection with pre-separation tax matters.(2) See description of non-GAAP measures contained in this appendix.
Adjustments
($ in millions, except per share data)
22

RECONCILIATION OF NON-GAAP Financial Measures to GAAP Financial Measures for the Quarter Ended March 28, 2014
Acquisition RestructuringRelated and Other Tax Adjusted
U.S. GAAP Charges Charges, Net Items (1) (Non-GAAP) (2)
Operating Income 510$ 1$ 21$ -$ 532$
Operating Margin 14.9% 15.5%
Other Income, Net 16$ -$ -$ (14)$ 2$
Income Tax Expense (136)$ -$ (10)$ 36$ (110)$
Effective Tax Rate 27.2% 21.7%
Income from Continuing Operations Attributable to TE Connectivity Ltd. 364$ 1$ 11$ 22$ 398$
Diluted Earnings per Share from Continuing Operations Attributable to TE Connectivity Ltd. 0.87$ -$ 0.03$ 0.05$ 0.95$
(1) Includes income tax expense related to adjustments to prior year income tax returns. In addition, other income includes amounts related to reimbursements by Tyco International and Covidien in connection with pre-separation tax matters.(2) See description of non-GAAP measures contained in this appendix.
Adjustments
($ in millions, except per share data)
23

RECONCILIATION OF NON-GAAP Financial Measures to GAAP Financial Measures for the Quarter Ended December 27, 2013
Restructuringand Other Tax Adjusted
U.S. GAAP Charges, Net Items (1) (Non-GAAP) (2)
Operating Income 479$ 7$ -$ 486$
Operating Margin 14.4% 14.6%
Other Income, Net 32$ -$ (25)$ 7$
Income Tax Expense (127)$ (1)$ 7$ (121)$
Effective Tax Rate 26.3% 26.1%
Income from Continuing Operations Attributable to TE Connectivity Ltd. 355$ 6$ (18)$ 343$
Diluted Earnings per Share from Continuing Operations Attributable to TE Connectivity Ltd. 0.85$ 0.01$ (0.04)$ 0.82$
(2) See description of non-GAAP measures contained in this appendix.
(1) Includes income tax expense related to adjustments to prior year income tax returns. In addition, other income includes amounts related to reimbursements by Tyco International and Covidien in connection with pre-separation tax matters, including $18 million related to our share of a settlement agreement entered into by Tyco International with a former subsidiary.
($ in millions, except per share data)
Adjustments
24
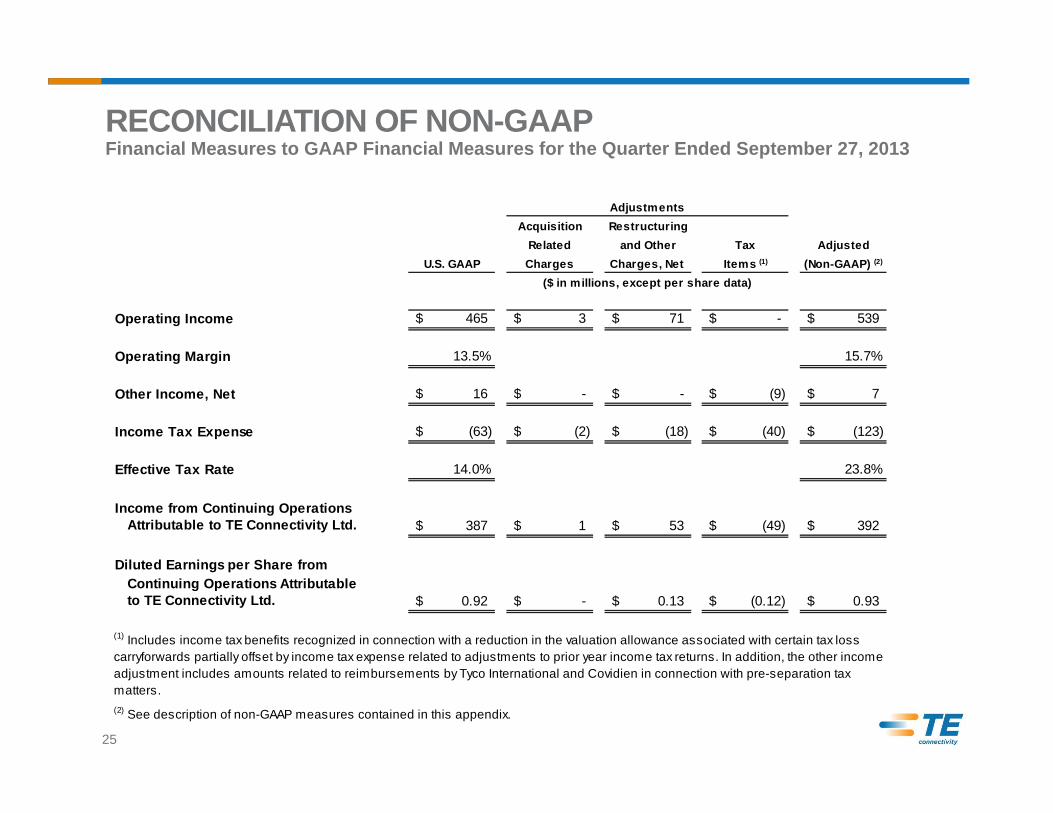
RECONCILIATION OF NON-GAAP Financial Measures to GAAP Financial Measures for the Quarter Ended September 27, 2013
Acquisition RestructuringRelated and Other Tax Adjusted
U.S. GAAP Charges Charges, Net Items (1) (Non-GAAP) (2)
Operating Income 465$ 3$ 71$ -$ 539$
Operating Margin 13.5% 15.7%
Other Income, Net 16$ -$ -$ (9)$ 7$
Income Tax Expense (63)$ (2)$ (18)$ (40)$ (123)$
Effective Tax Rate 14.0% 23.8%
Income from Continuing Operations Attributable to TE Connectivity Ltd. 387$ 1$ 53$ (49)$ 392$
Diluted Earnings per Share from Continuing Operations Attributable to TE Connectivity Ltd. 0.92$ -$ 0.13$ (0.12)$ 0.93$
(2) See description of non-GAAP measures contained in this appendix.
(1) Includes income tax benefits recognized in connection with a reduction in the valuation allowance associated with certain tax loss carryforwards partially offset by income tax expense related to adjustments to prior year income tax returns. In addition, the other income adjustment includes amounts related to reimbursements by Tyco International and Covidien in connection with pre-separation tax matters.
($ in millions, except per share data)
Adjustments
25

RECONCILIATION OF NON-GAAP Financial Measures to GAAP Financial Measures for the Quarter Ended June 28, 2013
Acquisition RestructuringRelated and Other Tax Adjusted
U.S. GAAP Charges Charges, Net Items (1) (Non-GAAP) (2)
Operating Income 439$ 3$ 67$ -$ 509$
Operating Margin 12.7% 14.8%
Other Income, Net 18$ -$ -$ (8)$ 10$
Income Tax Expense (93)$ (1)$ (21)$ -$ (115)$
Effective Tax Rate 21.9% 23.6%
Income from Continuing Operations Attributable to TE Connectivity Ltd. 332$ 2$ 46$ (8)$ 372$
Diluted Earnings per Share from Continuing Operations Attributable to TE Connectivity Ltd. 0.79$ -$ 0.11$ (0.02)$ 0.88$
(2) See description of non-GAAP measures contained in this appendix.
(1) Relates to reimbursements by Tyco International and Covidien in connection with pre-separation tax matters.
($ in millions, except per share data)
Adjustments
26
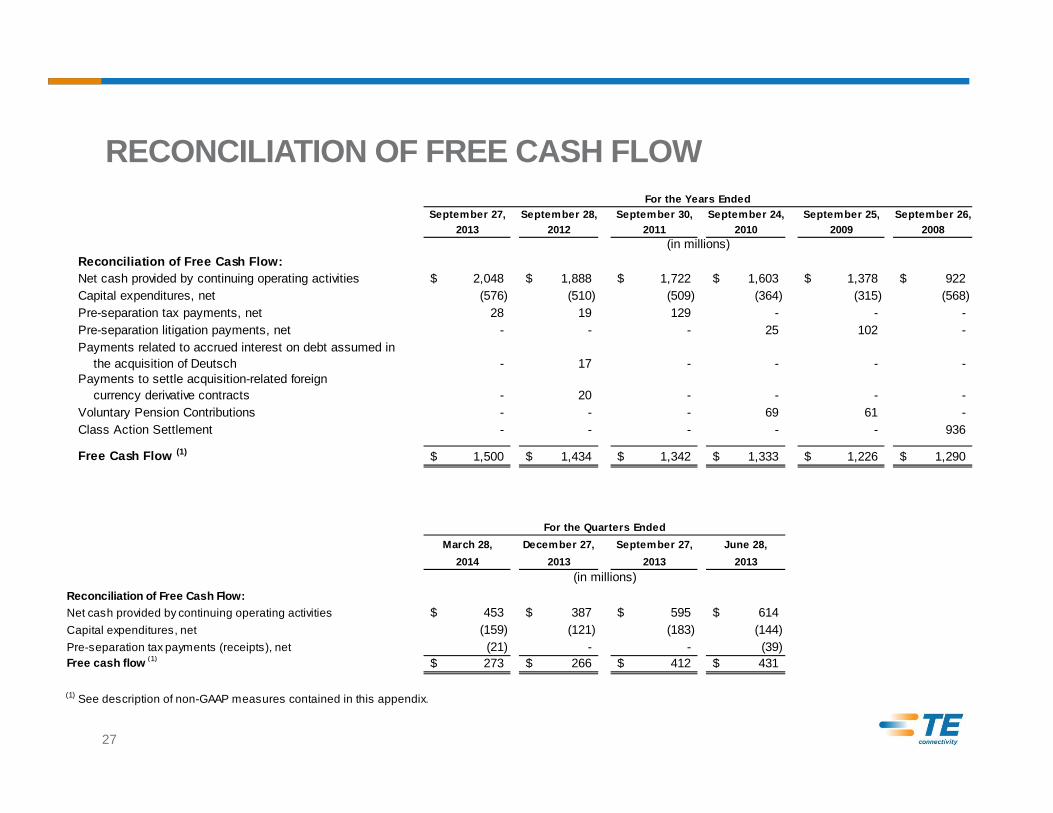
RECONCILIATION OF FREE CASH FLOWFor the Years Ended
September 27, September 28, September 30, September 24, September 25, September 26,2013 2012 2011 2010 2009 2008
(in millions)Reconciliation of Free Cash Flow:Net cash provided by continuing operating activities 2,048$ 1,888$ 1,722$ 1,603$ 1,378$ 922$ Capital expenditures, net (576) (510) (509) (364) (315) (568) Pre-separation tax payments, net 28 19 129 - - - Pre-separation litigation payments, net - - - 25 102 - Payments related to accrued interest on debt assumed in the acquisition of Deutsch - 17 - - - - Payments to settle acquisition-related foreign currency derivative contracts - 20 - - - - Voluntary Pension Contributions - - - 69 61 - Class Action Settlement - - - - - 936
Free Cash Flow (1) 1,500$ 1,434$ 1,342$ 1,333$ 1,226$ 1,290$
March 28, December 27, September 27, June 28,2014 2013 2013 2013
Reconciliation of Free Cash Flow:Net cash provided by continuing operating activities 453$ 387$ 595$ 614$ Capital expenditures, net (159) (121) (183) (144) Pre-separation tax payments (receipts), net (21) - - (39) Free cash flow (1) 273$ 266$ 412$ 431$
(1) See description of non-GAAP measures contained in this appendix.
For the Quarters Ended
(in millions)
27


