8
Measurement and Inspection Sensors 100 M & I 2,5 m 40° U-GAGE™ ANALOG POWER SIGNAL OUTPUT DISCRETE

Measurement and Inspection Sensors
100
M &
I
DIAGNOSTICS
Error No.
Error TypeError No.
Error Type
System OK
Emitter Error
Align / blank
Serial Comm
Output Short
EEPROM
E / R Mismatch
CPU Error
Receiver Error
Null / Span
POWER
2 - TX
3 - RX
5 - COM
ALIGNMENT
SWITCH
DIAGNOSTICS
INDICATOR
RS-232
MAHCIP-1
HIGH RESOLUTION MINI-ARRAY CONTROLLER
1011
1213
1415
1617
1819
20
NC
NC10-30Vdc
GATE
NC
TXTX
+12V
BR
EMTR
RCVR
BU
BK
5 Wires
WH
30V
150mA MAX
OUTPUT#1
COMDRN
T/RT/R
16-30V dc
1A MAX
POWER
1011
1213
1415
1617
1819
20
OUTP
UTAL
ARM
GATE AL
IGNF1
30V(MAX)
150mA MAX
ALARM
10-30Vdc
ALIGN
RS-485
2,5 m
40°
U-GAGE™ ANALOGPOWER
SIGNAL
OUTPUTDISCRETE

101Banner Engineering ©
Table of ContentsM
& I
M & I Theory ....................................102M & I Applications ............................106
LT3 Laser Distance Gauging Sensor ........108
Q50 Triangulation Sensor ....................114
LG Laser Measurement Sensor ..............120
S18U Ultrasonic Sensor ......................126
T30U Ultrasonic Sensor ......................132
QT50U Long-range Ultrasonic Sensor ......138
LX Part Sensing Light Screen ................144
Mini-Array & Mini-Array High-ResolutionMeasuring Light Screens ....................148
PVA & PVD Bin-Picking Sensors ............158
VTB Series ......................................166
Selection Guide: Overview ................................170
IMPORTANT SAFETY WARNING!
The sensors described in this section of this catalogue donot include the self-checking redundant circuitry necessaryto allow their use in personnel safety applications. A sensorfailure or malfunction can result in either an energised orde-energised output condition. Never use these products assensing devices for personnel safety.
!

Measurement & Inspection Theory
102
M &
I
Accuracy
Accuracy is defined as the difference between theindicated value and the actual value at room tem-perature. In most cases, the accuracy comprises oftwo main sources of error: the resolution and thelinearity.
Analogue Output
The analogue output of a sensor is the continuousoutput of a measured variable. The format of thisoutput may be 4 to 20 mA, 0 to 10 V or others.
Beam Angle
Ultrasonic sensors emit a cone sonic energy thatdiverges with distance. The angle of this beam isusually defined as the total (included) angle. Ultra-sonic beams are not perfect cones. Most of theultrasonic energy is in the centre of the beam. Theenergy level decreases with distance away from thecentreline. The beam angle is defined as the regionwhere the energy is 50% of the energy measured onthe centreline. See Figure 1.
Colour effects
The colour of the object being measured can affectthe resolution and accuracy of the readings. White,red, yellow and orange targets reflect more lightthan green, blue or black targets. The resolutionspecifications listed in this catalogue are for whitetargets. The resolution for dark targets may be up tofour times less than for white targets. Figure 2shows the relative amount of received light that isreflected from various target colours. The resolution
is roughly affected according to the square of thereceived light. For example, reducing the amount oflight by a factor of nine degrades the resolution by afactor of three. Note that ultrasonic sensors areunaffected by colour or transparency of the target.
Colour Sensitivity
For optical sensors, colour sensitivity refers to thechange in output when the colour of a targetchanges. For example, the LG5 typically changesless than 75 µm as the target changes from a brightwhite to a near black target (approximately 90%reflectance to 10% reflectance. Note: for very pre-cise measurements, Banner uses precision groundceramic targets, as opposed to Kodak standard card-board targets).
Deadband
Deadband refers to the region where the sensor can-not make measurements. For example, the deadbandof the Q45U ultrasonic sensor is 100 mm, i.e. theoutput is unusable when a target is in this deadbandarea. Mounting hardware should be positioned sothat the intended target is always within the measur-ing range.
Digital Output
Digital outputs are on-off outputs that signal when acontinuous measurement has reached a specificvalue. Digital outputs are typically signaled with PNPor NPN transistors or an electromechanical relay.
Glossary of Terms
100
80
60
40
20
0
Figure 2: Relative reflected light from a red LED light source
white red
oran
ge
yello
w
purp
le
gree
n
blue
blac
k
% R
efle
ctan
ce
Figure 1: Beam Angle
beamangle
sensor

103Banner Engineering ©
Measurement & Inspection TheoryM
& I
Load Resistor
A load resistor, also called a dropping resistor, is aprecision resistor used to convert a 4 to 20 mA sig-nal to a voltage signal. The most common droppingresistor is 250 Ω ± 0,025 Ω, which converts the cur-rent to a 1 V to 4 V signal. For good stability overtemperature, the dropping resistor should have atemperature coefficient of 0,01% per ºC or better.
Frequency Response
Frequency response refers to the maximum frequen-cies that an analogue sensor can track. All analoguesensors have an inherent response time that limitstheir ability to measure periodic motions at highfrequencies. For example, consider a laser displace-ment sensor with a 1,6 ms response time that ismeasuring runout on a rotating cylinder. Since thelaser sensor is averaging data over a 1,6 ms period,it will under report the amplitude of the peak runout.This error increases as the rotational speed increas-es. Typically, this error is specified as the rotationalspeed that produces a -3 dB error (-3 dB equals a30% error). For a 1,0 ms averaging time, the -3 dBfrequency response is 450 Hz. At 450 Hz, a 1,0 mmdisplacement reports as 0,7 mm by the laser sensor.For reference, note that the crankshaft of a carengine running at 3.000 rpm is only 50 Hz.
Full Scale
The full scale range of a sensor represents the maxi-mum measuring range possible. For example, alaser displacement sensor that measures from 75 to125 mm has a full scale range of 50 mm. Even if theuser has configured the sensor to read from 100 to120 mm, the full scale remains at 50 mm. This isimportant to keep in mind if a manufacturer lists aperformance specification in terms of “% of fullscale”. The errors don’t shrink with the calibratedmeasuring span, as they would if the manufacturerlisted the spec in terms of “% of span”.
Hysteresis
Hysteresis is commonly used to represent the dif-ference in switching points for digital outputs. Forexample, an output might turn on when a targetreaches 25 mm, but does not turn off until the targetis 24 mm away. Therefore there is 1 mm of hystere-sis. Hysteresis is also used in regard to analoguesensors to represent the difference in an outputfrom moving upscale and moving downscale. Forexample, a contact probe is calibrated to output 4 to20 mA from 0 to 10 mm. When travelling from 0 to10 mm, the 5 mm point corresponds to an output of11,98 mA. When travelling from 10 to 0 mm, the5 mm point corresponds to 12,02 mA. Therefore,the hysteresis is 0,04 mA or 0,25% of span. Theanalogue hysteresis in electro-mechanical measuringsystems is often measurable; in non-mechanicalsensors, such as photoelectrics, it is most ofteninsignificant.
Linearity
Linearity actually refers to the maximum amount ofnonlinearity in the output of the sensor. It is usuallydefined as the maximum deviation above or belowthe ideal output of the sensor. It should be notedthat linearity errors are repeatable errors and do notaffect the sensor’s ability to repeatably activate digi-tal outputs. Furthermore, since linearity errors arerepeatable, they are potentially correctable within thehost system. A linearisation scheme in a host sys-tem could consist of a table of actual and idealvalues that serves as table for interpolation. SeeFigure 3.
Figure 3: Linearity
outp
ut
actualoutput
ideal output
distance
linearity

Measurement & Inspection Theory
104
M &
I
Measuring Range
The measuring range represents the maximumrange of values that a sensor can measure.
Measuring Span
The measuring span usually refers to the actual con-figured values that the sensor is set up for. Forexample, a sensor with a measuring range of 0,2 to1 m, is set up with a measuring span 0,5 to 0,8 m.
Reference Conditions
The performance specifications for measuring sen-sors are typically given for reference conditions.Reference conditions are usually 20 °C and 1 atmos-phere of pressure (approximately 1 Bar). In addition,a reference target must also be described in thespecifications. For laser measuring devices, a whiteceramic target is often used. For ultrasonics, asquare metal target is typically called out.
Repeatability
The repeatability of a sensor is the difference in thesensor’s output when the same input is given multi-ple times. Banner typically uses repeatability toquantify the performance of a digital sensor. For adigital sensor, repeatability represents the variationin switching distances for a standard target at refer-ence conditions. For example, a laser displacementsensor is programmed to switch its output at a dis-tance of 100 mm. The actual switching distance ismeasured with a micrometer twenty times. The datashow a standard deviation of 0,01 mm; the two-sigma repeatability is 0,02 mm.
Resolution
Resolution is one of the most important specifica-tions in measuring devices. It is a measure of small-est change in the position of a target that can besensed by the measuring device. It is also a measureof the expected fluctuations in the output of a devicewhen the target is at a fixed distance away from thesensor. For example, consider a device with a reso-lution of “0,2% of measuring distance” that is100 mm away from the target.
The resolution is 0,2% times 100 mm or 0,2 mm.This means that any change greater than 0,2 mm inthe position of the target causes a measurablechange in the output of the sensor. It also impliesthat if the target does not change position, one couldexpect the noise of the output signal to be less than0,2 mm. Sometimes a manufacturer specifies outputresolution and list a specification in bits such as“12 bit”. This means that the output portion of thecircuit has a resolution of one in 212 (4096). If thesensor has a measuring window of, say, 100 mm,this would equate to 100/4096 = 0,024 mm. Whenspecifications are written this way, make sure thatthe rest of the circuit has a resolution smaller thanthe output portion of the circuit (the digital-to-ana-logue converter). In other words, if a sensor has anoutput resolution of 0,02 mm, and the rest of a sen-sor’s measuring system produces a resolution of0,5 mm, the overall resolution is limited to 0,5 mm.Influences on resolution include response speed,target conditions, distance to target and externalfactors such as noise from unterminated outputsand shields or lighting, motors, etc.
Response Time
Response time is a measure of how quickly a sensorcan react to a change in the input variable. This isgenerally reported as the time it takes for the sensorto output a signal representing 63% of the change inthe input. For example, a temperature sensor at 0 °Cis quickly placed in 100 °C water. The sensor reads63 °C after 4 seconds. Therefore, the response timeof the sensor is 4 seconds.
Span
The span of a sensor is the range over which thelinear output is configured. For example, an ultra-sonic sensor is calibrated so that 4 mA equals500 mm; 20 mA equals 1200 mm. The span of thesensor is 700 mm.
Span Adjustment Range
This represents the amount of adjustability in thelinear output of the sensor. For example, a laser
105Banner Engineering ©
Measurement & Inspection TheoryM
& I
displacement sensor might have a span adjustmentrange of 5 to 15 mm, meaning the 4 to 20 mA signalcan be correlated to spans as small as 5 mm or aslarge as 15 mm. This range is sometimes referred toas turndown ratio. In the example above, the turn-down ratio is 15:5 or 3:1.
Standoff Distance
The distance from the face of the sensor to the mid-point of the measuring range.
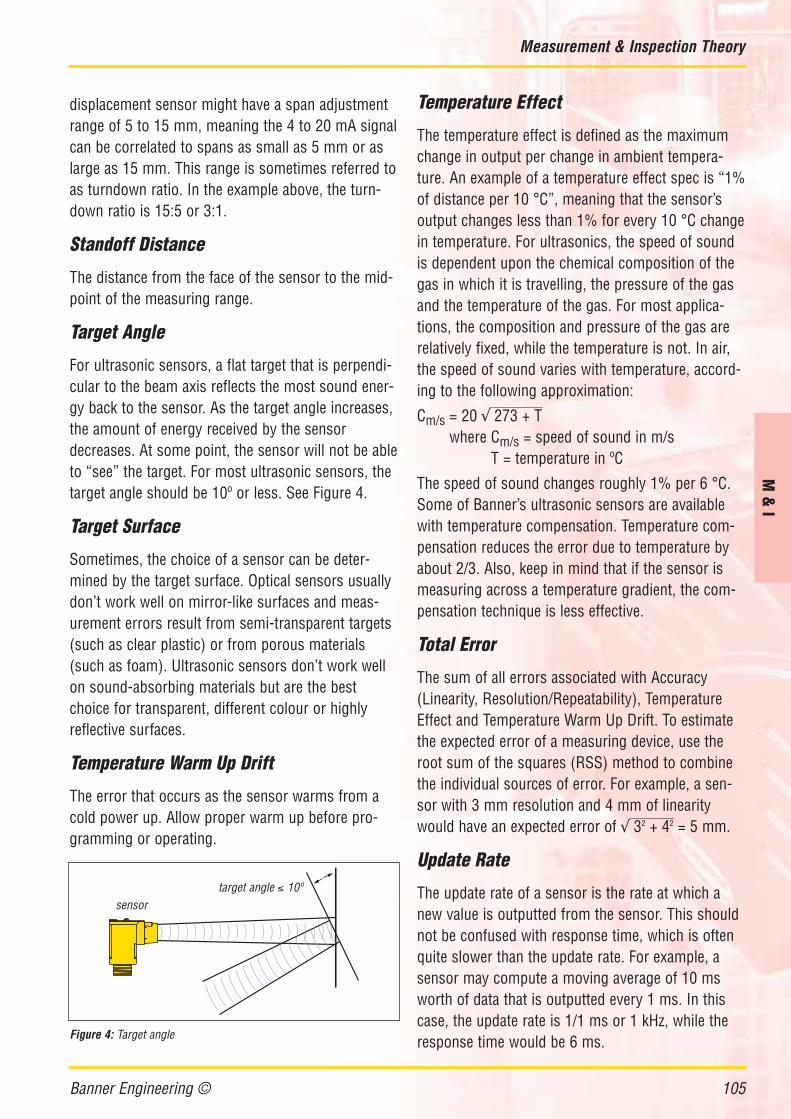
Target Angle
For ultrasonic sensors, a flat target that is perpendi-cular to the beam axis reflects the most sound ener-gy back to the sensor. As the target angle increases,the amount of energy received by the sensordecreases. At some point, the sensor will not be ableto “see” the target. For most ultrasonic sensors, thetarget angle should be 10º or less. See Figure 4.
Target Surface
Sometimes, the choice of a sensor can be deter-mined by the target surface. Optical sensors usuallydon’t work well on mirror-like surfaces and meas-urement errors result from semi-transparent targets(such as clear plastic) or from porous materials(such as foam). Ultrasonic sensors don’t work wellon sound-absorbing materials but are the bestchoice for transparent, different colour or highlyreflective surfaces.
Temperature Warm Up Drift
The error that occurs as the sensor warms from acold power up. Allow proper warm up before pro-gramming or operating.
Temperature Effect
The temperature effect is defined as the maximumchange in output per change in ambient tempera-ture. An example of a temperature effect spec is “1%of distance per 10 °C”, meaning that the sensor’soutput changes less than 1% for every 10 °C changein temperature. For ultrasonics, the speed of soundis dependent upon the chemical composition of thegas in which it is travelling, the pressure of the gasand the temperature of the gas. For most applica-tions, the composition and pressure of the gas arerelatively fixed, while the temperature is not. In air,the speed of sound varies with temperature, accord-ing to the following approximation:
Cm/s = 20 √ 273 + Twhere Cm/s = speed of sound in m/s
T = temperature in ºC
The speed of sound changes roughly 1% per 6 °C.Some of Banner’s ultrasonic sensors are availablewith temperature compensation. Temperature com-pensation reduces the error due to temperature byabout 2/3. Also, keep in mind that if the sensor ismeasuring across a temperature gradient, the com-pensation technique is less effective.
Total Error
The sum of all errors associated with Accuracy(Linearity, Resolution/Repeatability), TemperatureEffect and Temperature Warm Up Drift. To estimatethe expected error of a measuring device, use theroot sum of the squares (RSS) method to combinethe individual sources of error. For example, a sen-sor with 3 mm resolution and 4 mm of linearitywould have an expected error of √ 32 + 42 = 5 mm.
Update Rate
The update rate of a sensor is the rate at which anew value is outputted from the sensor. This shouldnot be confused with response time, which is oftenquite slower than the update rate. For example, asensor may compute a moving average of 10 msworth of data that is outputted every 1 ms. In thiscase, the update rate is 1/1 ms or 1 kHz, while theresponse time would be 6 ms.Figure 4: Target angle
target angle ≤ 10ºsensor

Applications for Measurement & Inspection Sensors
106
M &
I
ERROR-PROOFING A LASER CUTTING OPERATION
Application: To verify that holes cut into a chassis areproperly positioned.
Sensor: LT3 diffuse-mode sensor.
Operation: A robotic laser-cutting process is used to cutopenings in automotive chassis sections. As soon as asection is cut out, the LT3 inspects the region to verify thatthe hole is in its proper place. Because the sensor cannotbe located within the robot’s range of motion, the LT3’slong operating range is vital for this process.
Page: 108
WOOD PROFILING
Application: Profile wood mouldings; inspect milleddimensions.
Sensor: LG10A65NU sensor.
Operation: The LG10, with a 100 mm stand-off distanceand a 50 mm measuring window, can accurately profile awide variety of wooden mouldings in milling applications.Not only is the LG10 fast and accurate, it is also verytolerant of changing wood colours. For example, changingfrom dark walnut to light ash requires no change in sensorconfiguration.
Page: 120
OATMEAL
OATMEAL
OATMEAL
RANGEINOUT
TEACH
OUTPUT
To S
et N
EA
R a
nd
FA
R L
imits.
1.
Pre
ss and h
old
Teach
butto
n u
ntil
the Te
ach
light tu
rns o
n (R
ED
)
2.
Adju
st targ
et to
1st lim
it positio
n.
Pre
ss Teach
butto
n. (Te
ach
fla
shes)
Em
itter R
ec
eiv
er
FILL LEVEL CONTROL
Application: To monitor and control fill level of dry cerealin a packaging operation.
Sensor: Q50BU sensor.
Operation: Many food processing lines now fill by level,instead of by weight. Infrared analogue Q50 sensors arethe best choice for fill level monitoring of irregular sur-faces, such as dry cereals.
Page: 114
U-GAGE™ ANALOGPOWER
SIGNAL
OUTPUTDISCRETE
U-GAGE™ ANALOGPOWER
SIGNAL
OUTPUTDISCRETE
CRANE ANTI-COLLISION
Application: To insure that the crane apparatus does notcontact the top of the container.
Sensor: T30UDNBQ sensor.
Operation: The T30U senses the distance to the top of thecontainer and outputs a signal if the distance is less than acritical pre-set value.
Page: 132

107Banner Engineering ©
Applications for Measurement & Inspection SensorsM
& I
PARCEL PROFILING
Application: To accurately measure boxes to be shipped.
Sensor: 3 High-resolution MINI-ARRAY MAHE64Aemitters and MAHR64A receivers.
Controller: 3 MAHCN-1 control modules.
Operation: The 3 arrays are positioned at right angles toeach other. Array controllers transmit box length, widthand height data to the host process controller. The hostcompiles size information for all of the parcels and deter-mines a packing program which optimises use of cargocontainer space.
Page: 148
MO
DE
ROLL SIZE MONITORING
Application: To monitor the size of a large roll of goodsfrom a distance of up to 8 m.
Sensor: QT50U sensor.
Operation: During the printing process, the roll of paper,which may be mounted at an inconvenient location nearthe ceiling, must be monitored to prevent running out ofpaper during the print run. A QT50U sensor is mountedperpendicular to the roll, at a distance up to 8 m from anempty roll. Because the sensor can be taught remotely, itmay also be located near the ceiling.
Page: 138
PARTS COUNTING
Application: To count hardware as it leaves a vibratoryfeeder.
Sensor: LX6ESR emitter and LX6RSR receiver.
Operation: The output of the LX6RSR receiver includes a5 ms pulse stretcher (OFF-delay) to improve count accura-cy. Successive parts must be separated by at least 7 ms.Minimum object detection size is 5,6 mm.
Page: 144
WAREHOUSE ORDER PICKING
Application: To indicate which bin to pick from and verifythat an item was removed.
Sensor: PVA Series emitter/receiver pairs.
Operation: The system controller (typically a computer)issues an instruction to pick an item from a particularlocation. The controller turns ON the PVA’s “job lights” atthe specified location. The job lights go OFF when an itemfrom that location is removed. If multiple items arerequired from one location, the job light stays ON until thecorrect number of items are removed.
Page: 158


