CUNY INSTITUTE FOR URBAN SYSTEMS CITY UNIVERSITY OF NEW YORK Dr. Robert E. Paaswell, Executive Director, CIUS 96 Greenwich Street, New York, NY 10006 cunybpl.org Michael Bobker, Executive Director, Building Performance Lab Measurement Guide: Air-Cooled Chillers By: Josue Martinez | Jr. Engineer Phillip Chao, PhD | Applied Research Scientist Duncan Prahl, RA, AIA | Sr. Applied Research Scientist Reviewed by: Jillian Panagakos | Jr. Engineer Honey Berk, LEED AP O&M, CMVP | Managing Director July 20, 2020
Transcript
CUNY INSTITUTE FOR URBAN SYSTEMS
CITY UNIVERSITY OF NEW YORK
Dr. Robert E. Paaswell, Executive Director, CIUS 96 Greenwich Street, New York, NY 10006 cunybpl.org Michael Bobker, Executive Director, Building Performance Lab
Measurement Guide: Air-Cooled Chillers
By: Josue Martinez | Jr. Engineer Phillip Chao, PhD | Applied Research Scientist Duncan Prahl, RA, AIA | Sr. Applied Research Scientist Reviewed by: Jillian Panagakos | Jr. Engineer Honey Berk, LEED AP O&M, CMVP | Managing Director
July 20, 2020
i
Table of Contents Table of Figures ...........................................................................................................................i Table of Tables ............................................................................................................................i Acronyms....................................................................................................................................ii Purpose of Guides ......................................................................................................................1
General Overview of NYC GHG Reduction Goals................................................................................... 1 Why Take Measurements? .........................................................................................................1
Prioritizing Appropriate, Necessary Measurements ............................................................................. 1 Application, Baseline, and Post-Retrofit Measurements ....................................................................... 3 Direct and Proxy Measurements .......................................................................................................... 3 Measurement Uncertainty ................................................................................................................... 3
General System Overview ..........................................................................................................5 Safety .................................................................................................................................................. 5 Description of System .......................................................................................................................... 5 System Overview ................................................................................................................................. 5 Key Variables Associated with Calculating Energy Consumption of an Air-Cooled Chiller ...................... 6 Operating Characteristics..................................................................................................................... 7 Scope of This Guide ............................................................................................................................. 7
Measurements ...........................................................................................................................8 Measurement Approach ...................................................................................................................... 8 Electricity - Measure at the Main Feed to the Chiller ............................................................................ 9 Cooling Load ........................................................................................................................................ 9 Outdoor Air Temperature .................................................................................................................... 9 Measurement Tools and Equipment .................................................................................................... 9 Measurement Strategies.................................................................................................................... 11 Measure Power at the Main Feed to the Chiller Using a Data-logging Power Meter ........................... 11 Measure Cooling Load with Thermocouples and Pressure Gauges ..................................................... 12 Measure Outside Air Temperature..................................................................................................... 13 Alternate Strategy for Power and Cooling Measurements – Download Data from a BAS .................... 14
Table of Figures Figure 1. Components of an air-cooled chiller .......................................................................................... 6 Figure 2. Measurement boundary of an air-cooled chiller ........................................................................ 8 Figure 3. Example of device information export from HOBOware .......................................................... 16
Table of Tables Table 1. List of measurements and associated tools ................................................................................. 9 Table 2. Detailed descriptions of measurement tools ............................................................................ 10
ii
Acronyms AHU Air handling unit Btu British thermal unit COP Coefficient of performance CUNY BPL CUNY Building Performance Lab DCAS DEM NYC Department of Citywide Administrative Services Division of Energy
Management FELL CUNY BPL Field Equipment Lending Library kW kilowatt IPMVP International Performance Measurement and Verification Protocol OAT Outdoor air temperature M&V Measurement and verification MW Megawatt true power true RMS power VAV Variable air volume VFD Variable frequency drive NOAA CNY National Oceanic and Atmospheric Administration Climate Normal Year
1
Purpose of Guides This guide is one of a series developed with the goal of implementing consistent, simple, purpose-driven measurement processes to help quantify the impact of projects designed to further New York City’s greenhouse gas (GHG) reduction goals. These guides are designed for use by internal and external stakeholders to facilitate comprehensive characterizations of building energy consumption and promote standardized and reasonable reporting of avoided energy use, through the collection of energy-related system data in buildings owned or operated by the City. Stakeholders include personnel at the NYC Department of Citywide Administrative Services Division of Energy Management (DCAS DEM), NYC Agency Energy Personnel, and third-party consulting engineers and/or other measurement and verification (M&V) providers. These measurement guides may also provide direction to other municipalities or private sector organizations that are looking to quantify avoided energy use for applicable energy conservation measures (ECMs).
General Overview of NYC GHG Reduction Goals As the hub for energy management for the City’s fixed infrastructure, DEM plays a critical role in supporting NYC agency partners’ progress toward major emissions reduction and energy objectives. These goals include:
• 80x50, focuses on achieving an 80% reduction in total economy-wide emissions in NYC by 2050 from a 2005 baseline. NYC also has an 80 x 50 goal relative to an FY06 baseline. OneNYC 2050 extended this goal by committing to net-zero greenhouse gas (GHG) emissions Citywide by 2050. This will require 100% clean energy and offsetting sources of irreducible emissions.
• 50x30, a new target created by the Climate Mobilization Act (NYC Local Law 97 of 2019) that focuses on achieving a 50% reduction in emissions by 2030, relative to an FY06 baseline. This includes all operations, facilities, and assets that are owned or leased by the City and for which the City pays all or part of the annual energy bills.
• 40x25, a new interim target on path to 50x30 that was also included in the Climate Mobilization Act and applies to all City government operations.
• Solar Target of 100MWx25, focuses on installing 100 Megawatts (MW) of solar photovoltaic at City government facilities by 2025.
• Energy Storage Target of 100MWhx20, focuses on installing 100 Megawatt hours (MWh) of energy storage at both private and public facilities by 2020.
Why Take Measurements?
Documenting consistent measurement techniques and reporting standards for DEM-funded energy efficiency projects is a vital step in facilitating judicious project selection and efficient program management. In agency applications for DEM project funding, the use of measurements (as opposed to general assumptions) yields more accurate estimates for baseline consumption and expected avoided energy use. Measurements promote a verifiable methodology that enhances the validity of the application and a best practice that is aligned with the City’s goals.
Prioritizing Appropriate, Necessary Measurements The primary goal of collecting measurements is to establish a reasonable characterization of the system before and after the retrofit in a simple, non-invasive, and replicable manner. This involves collecting
2
data that reasonably document the operational patterns and energy consumption using tools available from the CUNY BPL Field Equipment Lending Library (FELL). This guide is appropriate for a project where the International Performance Measurement and Verification Protocol (IPMVP) Option A or Option B for retrofit isolation is being used. Option A and B require direct or proxy measurements of some or all of the key variables associated with the implementation of an ECM.
An engineering problem, such as measuring the amount of energy used by a piece of equipment or a system, can be solved using many different techniques. These guides provide a primary recommendation for direct or proxy measurements of key system variables. It is understood that other techniques may be more appropriate for specific situations and that the user can adjust these recommendations based on the specific details of the project they are undertaking.
The measurement processes outlined in this guide were established to meet four key criteria and to standardize GHG reduction reporting across City facilities and agencies. Measurements should be:
1. Reasonable: These measurements will not reflect the exact annual energy consumption of a device or system. Rather, they are expected to represent a reasonable characterization of the annual energy consumption and are generally normalized either by measured operation or weather-dependent variables such as outdoor air temperature (OAT). When measurements are being taken before and after a retrofit, the measurement techniques may change based upon the characteristics of the ECM, but both techniques are expected to provide equally reasonable results.
2. Replicable and Consistent: A key goal is to provide methodologies that are easily replicable by a wide range of users who have varying degrees of familiarity with the facility’s operations and system configuration. This guide has multiple measurement strategies with differing levels of accuracy, however the results from any of these strategies are consistent enough to enable comparison across ECMs or facilities.
3. Simple: The measurement strategies and processes in this guide are intended to be as minimally invasive as possible, and relatively easy to set up. Setup time for most measurements should be less than an hour; however, in some cases, specialized personnel such as electricians or operating engineers should be engaged to assist with the installation of measurement equipment. This guide highlights methods of data collection that do not interfere with regular system operation and that are not excessively difficult to perform. All necessary tools used for measurements can be borrowed from FELL. The guides also provide standardized demonstrations for equipment setup, data collection protocols, and post-processing of the data to develop estimates of annual energy consumption.
4. Purpose-driven: While there may be different reasons for collecting these measurements (conducting full M&V, identifying preliminary avoided energy estimates, fault detection diagnostics, etc.), all methodologies represent the intent to estimate annual energy consumption and associated emissions.
Taking measurements provides verification of the two key variables associated with energy consumption in facilities: 1) operating schedule; and 2) energy used by the system when operating. Measuring operational variation in energy consumption over time, and other variables like OAT, allow for short term measurements to be extrapolated to a seasonal or annual estimate of energy consumption. For example, measuring a boiler can reveal the general time of day when the boiler is used in the facility, and how often it operates with respect to OAT. Given a range of measurements under varying
temperatures, a reasonable model of operation can be developed and applied to all times that the boiler is used over the course of an entire heating season.
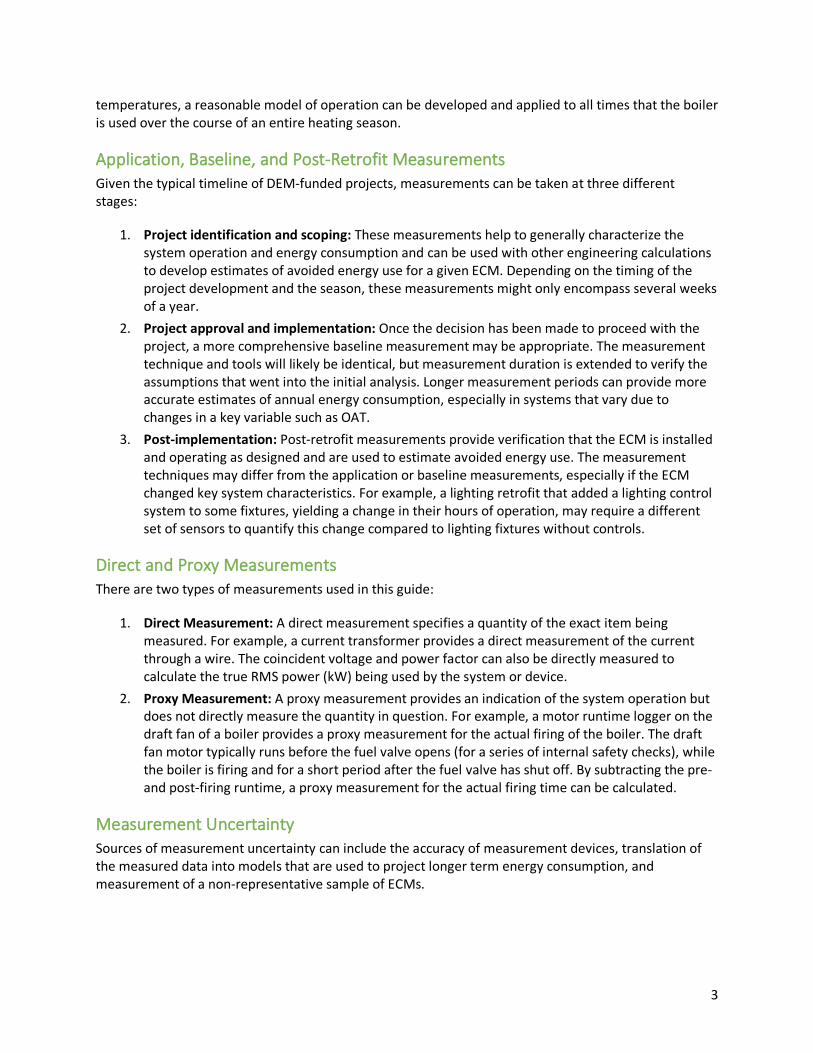
Application, Baseline, and Post-Retrofit Measurements Given the typical timeline of DEM-funded projects, measurements can be taken at three different stages:
1. Project identification and scoping: These measurements help to generally characterize the system operation and energy consumption and can be used with other engineering calculations to develop estimates of avoided energy use for a given ECM. Depending on the timing of the project development and the season, these measurements might only encompass several weeks of a year.
2. Project approval and implementation: Once the decision has been made to proceed with the project, a more comprehensive baseline measurement may be appropriate. The measurement technique and tools will likely be identical, but measurement duration is extended to verify the assumptions that went into the initial analysis. Longer measurement periods can provide more accurate estimates of annual energy consumption, especially in systems that vary due to changes in a key variable such as OAT.
3. Post-implementation: Post-retrofit measurements provide verification that the ECM is installed and operating as designed and are used to estimate avoided energy use. The measurement techniques may differ from the application or baseline measurements, especially if the ECM changed key system characteristics. For example, a lighting retrofit that added a lighting control system to some fixtures, yielding a change in their hours of operation, may require a different set of sensors to quantify this change compared to lighting fixtures without controls.
Direct and Proxy Measurements There are two types of measurements used in this guide:
1. Direct Measurement: A direct measurement specifies a quantity of the exact item being measured. For example, a current transformer provides a direct measurement of the current through a wire. The coincident voltage and power factor can also be directly measured to calculate the true RMS power (kW) being used by the system or device.
2. Proxy Measurement: A proxy measurement provides an indication of the system operation but does not directly measure the quantity in question. For example, a motor runtime logger on the draft fan of a boiler provides a proxy measurement for the actual firing of the boiler. The draft fan motor typically runs before the fuel valve opens (for a series of internal safety checks), while the boiler is firing and for a short period after the fuel valve has shut off. By subtracting the pre- and post-firing runtime, a proxy measurement for the actual firing time can be calculated.
Measurement Uncertainty Sources of measurement uncertainty can include the accuracy of measurement devices, translation of the measured data into models that are used to project longer term energy consumption, and measurement of a non-representative sample of ECMs.
4
Measurement accuracy is improved by using high quality and properly calibrated equipment. Typically, the recommended measurement equipment yields measurement errors of less than 2% and may often be significantly lower than 1%. As such, measurement error is typically negligible. CUNY BPL has worked to develop robust measurements and associated models that further reduce error. CUNY BPL has not developed tools to develop statistically valid sample sizes to achieve a desired error at a specific confidence interval; therefore, the recommended approach is to identify measurement points in the applicable system to capture the largest percentage of the total connected load as possible. This will allow for quantification of both the peak power draw of the system and operational variations that exist in the system.
5
General System Overview This guide describes the measurement approach for quantifying avoided energy use associated with retrofitting an existing chiller with an air-cooled chiller.
Safety This guide does not cover health and safety aspects of the collection of measurements at facilities. There are many hazards that exist in facilities surrounding the collection of measurements, including but not limited to: electrical safety, fall protection, personal protective equipment, control of hazardous energy (lock out/ tag out), confined space, respiratory protection, and machine safeguarding. Part of the measurement planning process must include the identification and mitigation of these and other hazards. The implementation of a measurement strategy and installation of measurement equipment should be performed by qualified personnel.
Description of System The following sections provide background information on the components of air-cooled chillers. If you are already familiar with the system, you may skip to the Measurement Description for System section.
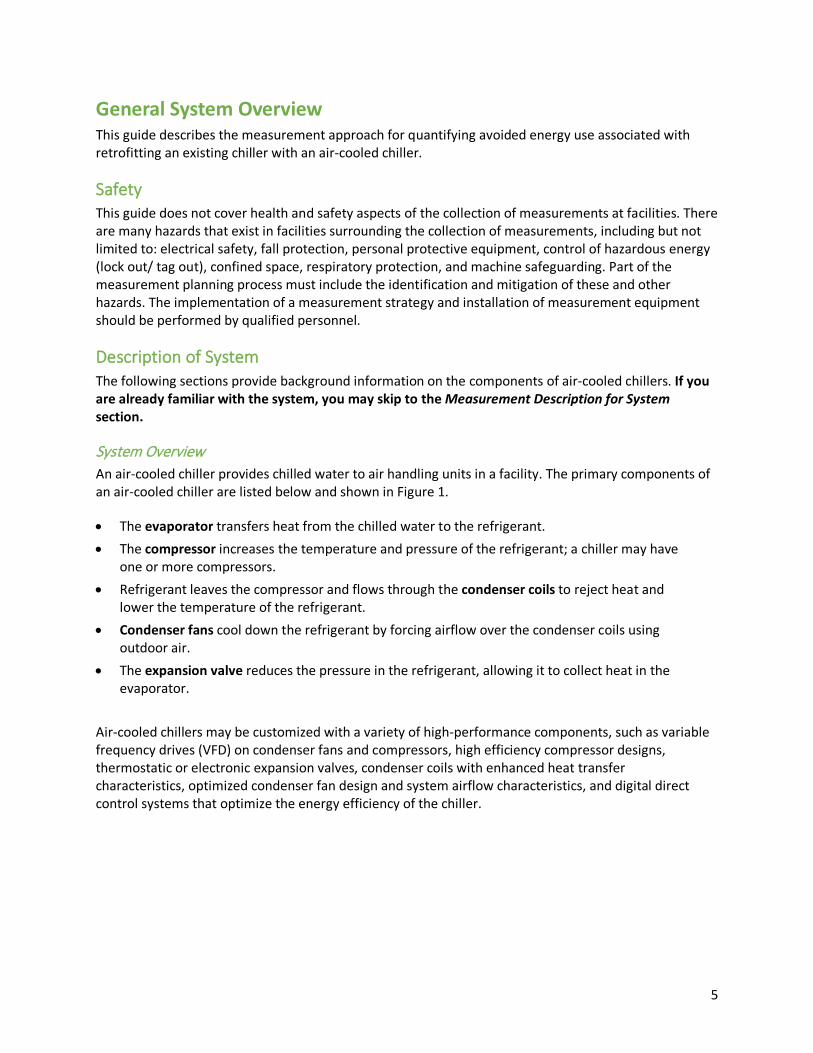
System Overview An air-cooled chiller provides chilled water to air handling units in a facility. The primary components of an air-cooled chiller are listed below and shown in Figure 1.
• The evaporator transfers heat from the chilled water to the refrigerant. • The compressor increases the temperature and pressure of the refrigerant; a chiller may have
one or more compressors. • Refrigerant leaves the compressor and flows through the condenser coils to reject heat and
lower the temperature of the refrigerant. • Condenser fans cool down the refrigerant by forcing airflow over the condenser coils using
outdoor air. • The expansion valve reduces the pressure in the refrigerant, allowing it to collect heat in the
evaporator. Air-cooled chillers may be customized with a variety of high-performance components, such as variable frequency drives (VFD) on condenser fans and compressors, high efficiency compressor designs, thermostatic or electronic expansion valves, condenser coils with enhanced heat transfer characteristics, optimized condenser fan design and system airflow characteristics, and digital direct control systems that optimize the energy efficiency of the chiller.
6
Figure 1. Components of an air-cooled chiller
Key Variables Associated with Calculating Energy Consumption of an Air-Cooled Chiller To calculate annual electricity savings (kWh) associated with an air-cooled chiller, compressor power (kW), cooling load, and total system runtime need to be measured.
The necessary variables to assess the energy savings are:
• Evaporator (chilled) water flow rate • Evaporator (chilled) water return temperature (from building) • Evaporator (chilled) water supply temperature (to building) • Chiller true RMS power consumption coincident with other measurements • Operating schedule • OAT
Condenser fan
Condenser coil
Compressor
Evaporator
Expansion valve
Chilled water
7
Operating Characteristics Because an air-cooled chiller generally comes as a single package, its control algorithms are optimized to balance the electrical energy consumption between the condenser fans and the compressor pumps. Running fans at higher speed or running multiple fans simultaneously reduces compressor energy, and vice versa. Regardless of whether the fans are variable- or constant-speed (or if the compressor is variable- or constant-speed), the appropriate sensors, direct digital controls, and control algorithms should minimize energy consumption.
Systems may have either constant- or variable-speed condenser fans. For constant-speed fans, the air flow rate through the heat exchanger is modulated by staging the fans. For variable-speed, the fans all run at the same speed, which is modulated continuously.
There are three capacity-control approaches for constant-speed compressors. First, systems with multiple compressors may be staged to meet the load. The drawbacks of this approach are less precise control and wear and tear from turning the compressors on and off. Secondly, for screw compressors only, it is possible to unload the compressor. A slide valve controls which suction inlets are open along the length of the screw; with fewer inlets open, there is less refrigerant compression. The third approach, referred to as hot gas bypass, occurs when some of the refrigerant leaving the compressor is diverted away from the condenser and simply returns to the compressor at high temperature and pressure. This approach is less common today due to its inherent inefficiency since the compressor still operates at full capacity. Variable-speed compressors are both staged and modulated in speed to precisely meet demand.
Scope of This Guide This guide describes how to measure and analyze the annual energy consumption of an air-cooled chiller system as a complete replacement for an existing cooling tower and chiller. As such, a primary goal is to describe the data that should be collected through measurements and the appropriate equipment to perform those measurements. Measurement of the pumping energy associated with the chilled water distribution in the facility is not discussed in this guide.
Since the retrofit is a wholesale change to the cooling system, the assessment of energy savings may require a separate approach to cover evaluation of the annual energy consumption of the pre-retrofit condition. Existing cooling systems may vary, from absorption, water-cooled, or air-cooled chillers. The cooling load is assumed to be the same for both pre- and post-retrofit conditions. Interactive effects with whole-facility cooling load due to operational or equipment changes to the distribution system are ignored. Nevertheless, it is important to note any operational changes and account for them as non-routine adjustments.
8
Measurements
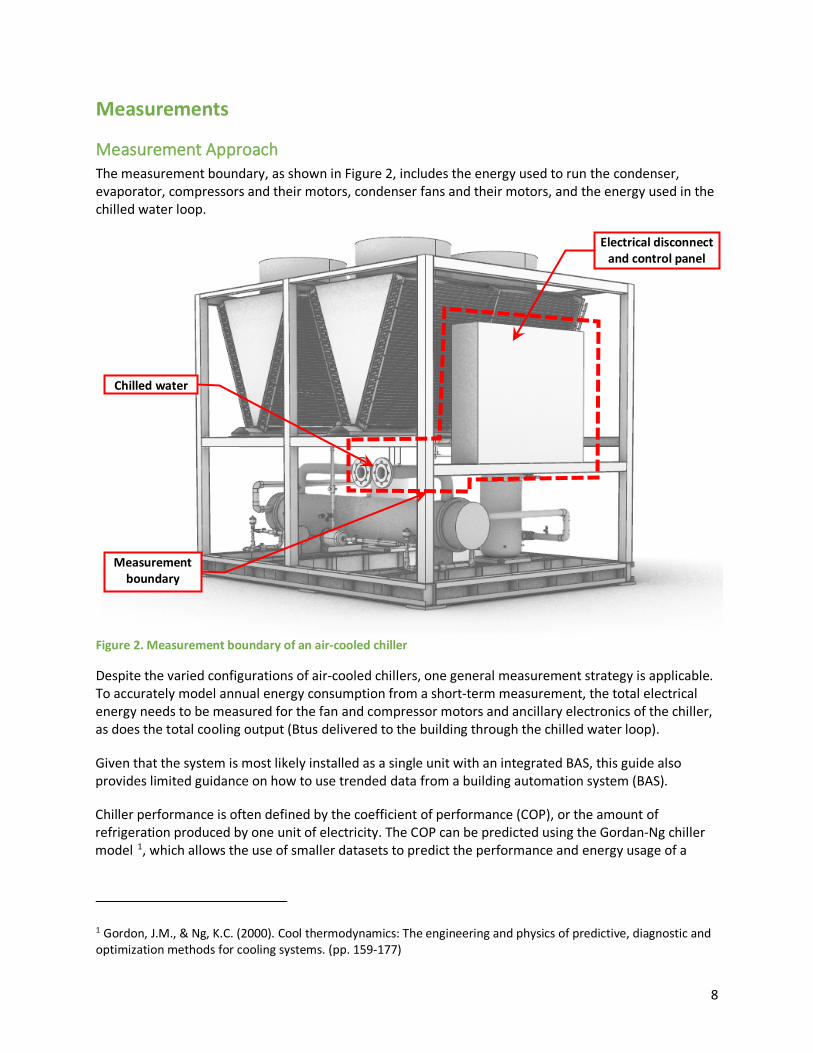
Measurement Approach The measurement boundary, as shown in Figure 2, includes the energy used to run the condenser, evaporator, compressors and their motors, condenser fans and their motors, and the energy used in the chilled water loop.
Figure 2. Measurement boundary of an air-cooled chiller
Despite the varied configurations of air-cooled chillers, one general measurement strategy is applicable. To accurately model annual energy consumption from a short-term measurement, the total electrical energy needs to be measured for the fan and compressor motors and ancillary electronics of the chiller, as does the total cooling output (Btus delivered to the building through the chilled water loop).
Given that the system is most likely installed as a single unit with an integrated BAS, this guide also provides limited guidance on how to use trended data from a building automation system (BAS).
Chiller performance is often defined by the coefficient of performance (COP), or the amount of refrigeration produced by one unit of electricity. The COP can be predicted using the Gordan-Ng chiller model 1, which allows the use of smaller datasets to predict the performance and energy usage of a
1 Gordon, J.M., & Ng, K.C. (2000). Cool thermodynamics: The engineering and physics of predictive, diagnostic and optimization methods for cooling systems. (pp. 159-177)
Chilled water
Electrical disconnect and control panel
Measurement boundary
9
chiller for a much wider range. As such, a few weeks of chiller performance data collected during different seasons can be extrapolated to reasonably predict annual electricity consumption.
Electricity - Measure at the Main Feed to the Chiller A power meter is used to measure the power to the chiller at the switchgear or disconnect that supplies power to the entire system. It is important to measure the power over the full range of loading conditions to get an accurate representation of the chiller. Several weeks of measurement in different seasons, backed up by documentation showing the programming in the controller, is generally sufficient to capture the operation of the system with respect to OAT.
Cooling Load The cooling load requires the measurement of the chilled water loop flow rate and the temperature difference (i.e., Delta T) between the supply and return in the chilled water loop. Pressure gauges mounted on the inlet and outlet of each of the chilled water pumps measure the pressure drop across the pumps. Flow rate is then determined from the manufacturer’s pump curve. The flow rate should be summed across all the pumps to obtain the full chilled water loop flow rate. The temperature difference in the chilled water loop should be measured with thermocouples at the supply and return of the chilled water loop (or inlet and outlet of the evaporator). The chiller or BAS may also have a flow meter and temperature sensors that can be used, or an onboard chilled water Btu meter.
Outdoor Air Temperature Taking measurements for at least two weeks during the hottest time of summer and two weeks during spring or fall should be sufficient to capture the operation of the system and characterize the cooling load with respect to OAT. It is important to pick measurement periods where the full range of OAT can be covered, to develop a robust annual performance model.
Measurement Tools and Equipment The measurements in this guide can be performed with the equipment listed in Table 1; more detailed descriptions have been provided in Table 2. NYC agency employees can borrow the recommended equipment from the CUNY BPL FELL, and have it delivered to their facility. Third-party M&V consultants and others can use this equipment list as guidance, recognizing that many manufacturers make comparable equipment. Inclusion on the list in Table 1 or Table 2 should not be construed as an endorsement of these manufacturers.
Table 1. List of measurements and associated tools
Measurement Units Tool FELL Equipment
True RMS Energy kWh Data-logging Power Meter and Current Transformers
DENT ELITEpro XC Portable Power Data Logger (EXCUNC) Dent 16” RoCoil Flexible Rope Current Transformers (CT-R16-A4-U)
OAT °F Weatherproof Temperature/Relative Humidity Data Logger
Onset HOBO Temperature/RH Data Logger (MX2301)
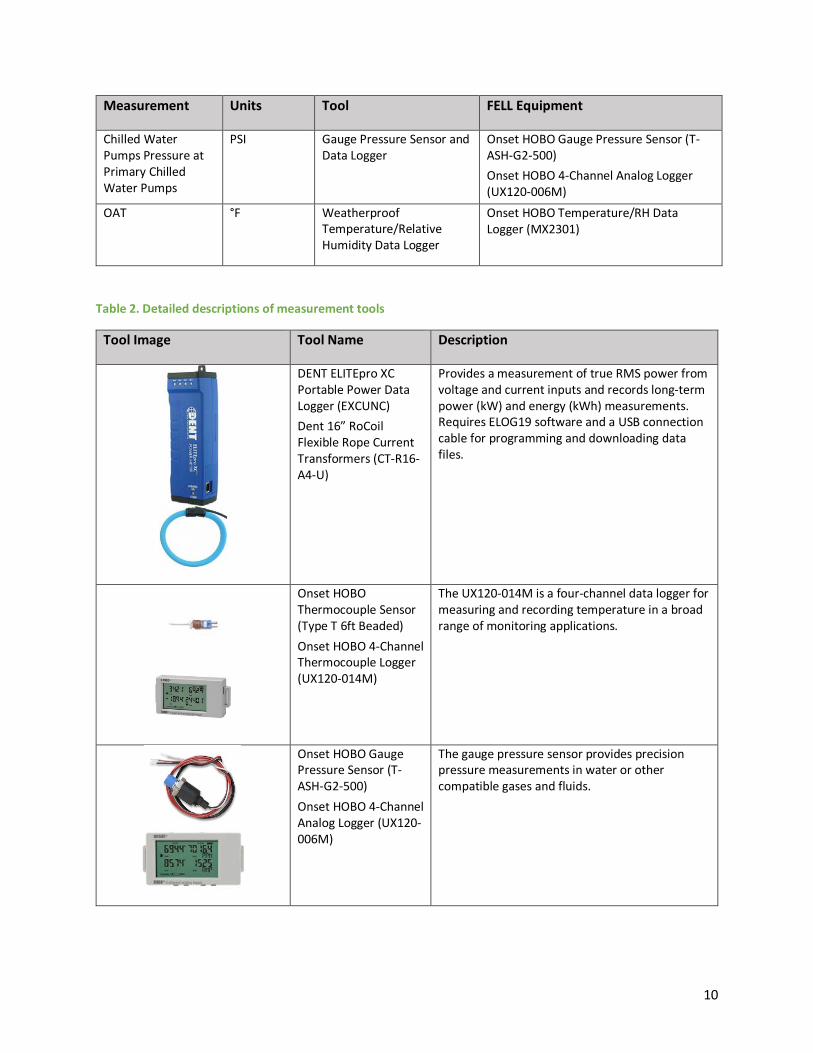
Table 2. Detailed descriptions of measurement tools
Tool Image Tool Name Description
DENT ELITEpro XC Portable Power Data Logger (EXCUNC) Dent 16” RoCoil Flexible Rope Current Transformers (CT-R16-A4-U)
Provides a measurement of true RMS power from voltage and current inputs and records long-term power (kW) and energy (kWh) measurements. Requires ELOG19 software and a USB connection cable for programming and downloading data files.
The gauge pressure sensor provides precision pressure measurements in water or other compatible gases and fluids.
11
Tool Image Tool Name Description
Onset HOBO Temperature/RH Data Logger (MX2301)
Records outdoor air temperature and relative humidity using internal sensors. Requires HOBOware software and a USB connection cable for programming and downloading data files.
Measurement Strategies The following instructions have been developed for each measurement strategy discussed in this guide. While these are reasonably detailed, certain aspects of each strategy may need to be modified based on the specific system configuration at each facility. Early surveying of the facility is recommended when tailoring each strategy to unique site conditions. It is also important to remove outlier data, particularly when the system is in a transient state. See the discussion in the Calculation Methodology section.
To calculate COP, there are separate measurements strategies for electrical power and cooling load, and there is one alternative strategy to measure both metrics. If a BAS and sensors for the relevant variables are available, then BAS data may be used, provided the BAS can trend data and has sufficient data storage capacity and data export capability.
The measurement recommendations reference supplementary equipment guides, which can be found in Appendix A.
A.2: Fluke 345 Clamp Meter A.3: DENT ELITEpro XC Power Meter A.7: Onset HOBO Outdoor Temperature/RH Data Logger A.9: Onset HOBO Gauge Pressure Sensor and Onset HOBO 4-Channel Analog Logger (UX120-006M) A.12: Onset HOBO Thermocouple Sensor and Onset HOBO 4-Channel Thermocouple Logger (UX120-014M)
Measure Power at the Main Feed to the Chiller Using a Data-logging Power Meter This measurement is needed to calculate the COP of the system at various operating points, as an input to the chiller model and to develop an operating schedule. Measurement is taken at the main feed to the chiller, either at the switchgear or within the chiller itself.
STEP 1: Preparation for Data Acquisition 1. Confirm site conditions and locations where data acquisition equipment will be placed. 2. Obtain measurement equipment from FELL:
a. DENT ELITEpro XC Energy Logger – (EXCUNC) with 16” Flexible CTs (Current Transformers) – (DENT CT-R16-A4-U)
3. Refer to Appendix A.3: DENT ELITEpro XC Power Meter a. Set up and initialize the DENT logger per the instructions in section A.3.1.
12
STEP 2: Installation at the Site 1. Implement appropriate safety procedures. 2. Refer to Appendix A.3: DENT ELITEpro XC Power Meter
a. Install the DENT ELITEpro XC power meter using sections A.3.2 to A.3.3 as guidance. 3. Initial field setup is now complete.
STEP 3: Verify Data is Being Collected 1. Implement appropriate safety procedures. 2. If possible, wait for the first recording period to pass during the installation at site; if not, return
to the site as soon as possible to retrieve data from the logger to verify data collection. Do not remove the logger from the equipment.
3. Refer to Appendix A.3: DENT ELITEpro XC Power Meter a. Confirm that the DENT ELITEpro XC power meter is collecting data and that system
operation is being recorded per the instructions in section A.3.4. Be careful not to stop the meter when downloading data.
4. It is recommended that this step be repeated periodically during the measurement period.
STEP 4: Retrieve Data Acquisition Equipment and Download Data 1. Implement appropriate safety procedures. 2. Refer to Appendix A.3: DENT ELITEpro XC Power Meter
a. Confirm that the DENT ELITEpro XC has collected the required data per the instructions in section A.3.4. Do not yet remove the meter from the equipment. Be careful not to stop the meter when downloading data.
b. Once data acquisition has been confirmed, stop the logger per the instructions in section A.3.5.
3. Remove the data logger and return it to FELL.
Measure Cooling Load with Thermocouples and Pressure Gauges This measurement is needed to calculate the COP and cooling output of the system at various operating points, and to collect temperatures needed for the chiller model. This measurement approach is suitable for constant- or variable-speed chilled water pumps. The pressure gauges are mounted at the suction and outlet of each pump. The thermocouples are mounted at the inlet and outlet of the chilled water loop to the evaporator.
STEP 1: Preparation for Data Acquisition 1. Confirm site conditions and locations where data acquisition equipment will be placed. 2. Obtain measurement equipment from FELL:
a. Onset HOBO 4-Channel Analog Logger (UX120-006M) – one per pump b. Onset HOBO Gauge Pressure Sensor (T-ASH-G2-500) – two per pump c. Onset HOBO Thermocouple Sensor (Type T 6ft Beaded) – two sensors d. Onset HOBO 4-Channel Thermocouple Logger (UX120-014M) – one or two data loggers
depending on how close the inlet and outlet pipes to the evaporator are to each other 3. Refer to Appendices A.9 and A.12: Gauge Pressure Sensor and Thermocouple Sensor
a. Set up and initialize the 4-Channel Analog Logger per the instructions in sections A.9.1 and A.9.2.
b. Set up and initialize the 4-Channel Thermocouple Logger per the instructions in sections A.12.1 and A.12.2
13
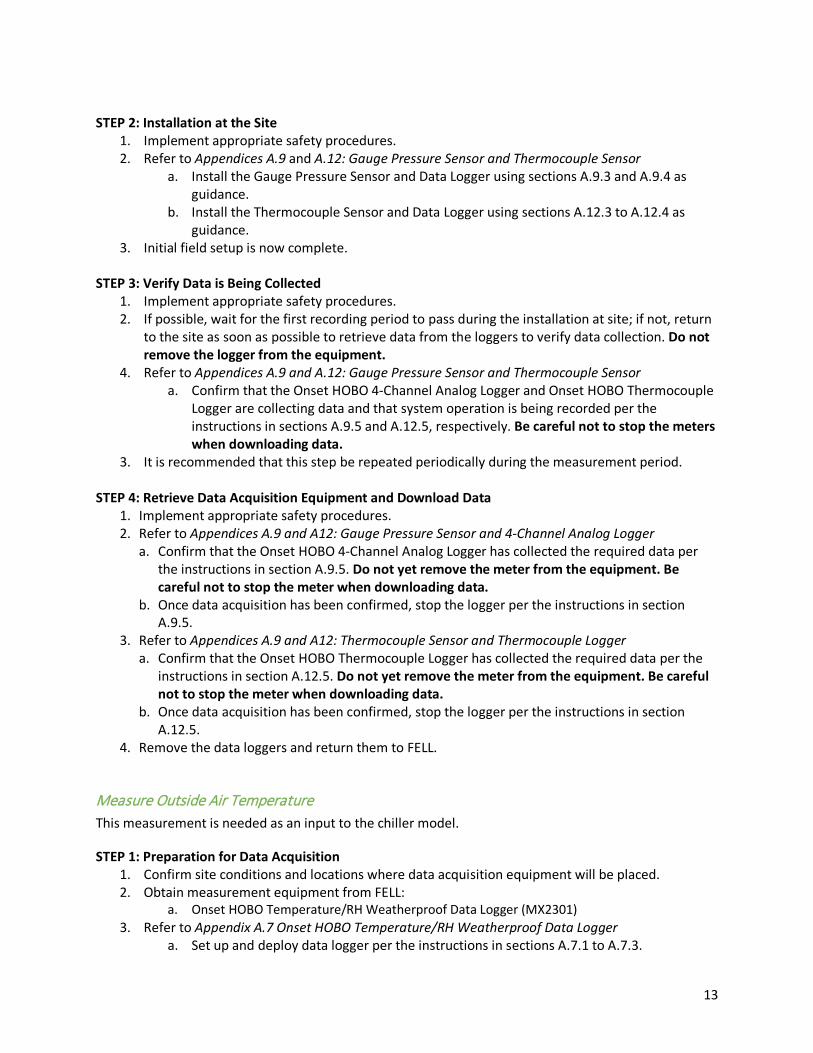
STEP 2: Installation at the Site
1. Implement appropriate safety procedures. 2. Refer to Appendices A.9 and A.12: Gauge Pressure Sensor and Thermocouple Sensor
a. Install the Gauge Pressure Sensor and Data Logger using sections A.9.3 and A.9.4 as guidance.
b. Install the Thermocouple Sensor and Data Logger using sections A.12.3 to A.12.4 as guidance.
3. Initial field setup is now complete.
STEP 3: Verify Data is Being Collected 1. Implement appropriate safety procedures. 2. If possible, wait for the first recording period to pass during the installation at site; if not, return
to the site as soon as possible to retrieve data from the loggers to verify data collection. Do not remove the logger from the equipment.
4. Refer to Appendices A.9 and A.12: Gauge Pressure Sensor and Thermocouple Sensor a. Confirm that the Onset HOBO 4-Channel Analog Logger and Onset HOBO Thermocouple
Logger are collecting data and that system operation is being recorded per the instructions in sections A.9.5 and A.12.5, respectively. Be careful not to stop the meters when downloading data.
3. It is recommended that this step be repeated periodically during the measurement period.
STEP 4: Retrieve Data Acquisition Equipment and Download Data 1. Implement appropriate safety procedures. 2. Refer to Appendices A.9 and A12: Gauge Pressure Sensor and 4-Channel Analog Logger
a. Confirm that the Onset HOBO 4-Channel Analog Logger has collected the required data per the instructions in section A.9.5. Do not yet remove the meter from the equipment. Be careful not to stop the meter when downloading data.
b. Once data acquisition has been confirmed, stop the logger per the instructions in section A.9.5.
3. Refer to Appendices A.9 and A12: Thermocouple Sensor and Thermocouple Logger a. Confirm that the Onset HOBO Thermocouple Logger has collected the required data per the
instructions in section A.12.5. Do not yet remove the meter from the equipment. Be careful not to stop the meter when downloading data.
b. Once data acquisition has been confirmed, stop the logger per the instructions in section A.12.5.
4. Remove the data loggers and return them to FELL.
Measure Outside Air Temperature This measurement is needed as an input to the chiller model.
STEP 1: Preparation for Data Acquisition 1. Confirm site conditions and locations where data acquisition equipment will be placed. 2. Obtain measurement equipment from FELL:
a. Onset HOBO Temperature/RH Weatherproof Data Logger (MX2301) 3. Refer to Appendix A.7 Onset HOBO Temperature/RH Weatherproof Data Logger
a. Set up and deploy data logger per the instructions in sections A.7.1 to A.7.3.
14
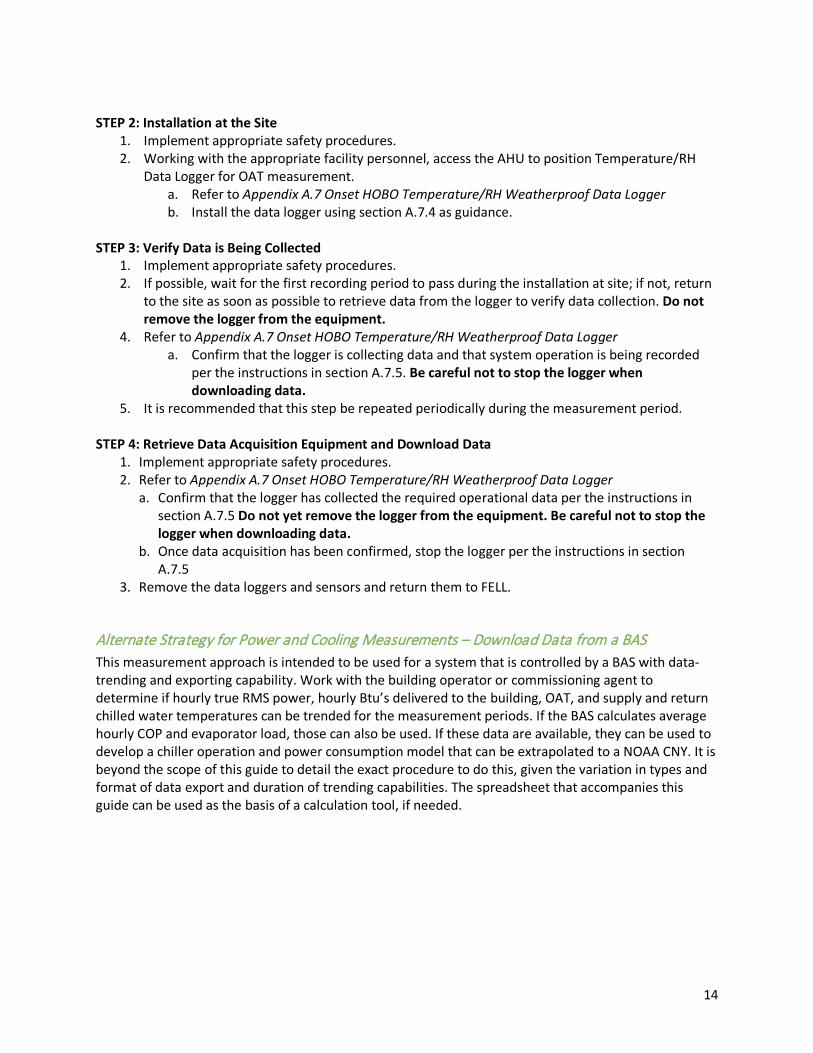
STEP 2: Installation at the Site
1. Implement appropriate safety procedures. 2. Working with the appropriate facility personnel, access the AHU to position Temperature/RH
Data Logger for OAT measurement. a. Refer to Appendix A.7 Onset HOBO Temperature/RH Weatherproof Data Logger b. Install the data logger using section A.7.4 as guidance.
STEP 3: Verify Data is Being Collected
1. Implement appropriate safety procedures. 2. If possible, wait for the first recording period to pass during the installation at site; if not, return
to the site as soon as possible to retrieve data from the logger to verify data collection. Do not remove the logger from the equipment.
4. Refer to Appendix A.7 Onset HOBO Temperature/RH Weatherproof Data Logger a. Confirm that the logger is collecting data and that system operation is being recorded
per the instructions in section A.7.5. Be careful not to stop the logger when downloading data.
5. It is recommended that this step be repeated periodically during the measurement period. STEP 4: Retrieve Data Acquisition Equipment and Download Data
1. Implement appropriate safety procedures. 2. Refer to Appendix A.7 Onset HOBO Temperature/RH Weatherproof Data Logger
a. Confirm that the logger has collected the required operational data per the instructions in section A.7.5 Do not yet remove the logger from the equipment. Be careful not to stop the logger when downloading data.
b. Once data acquisition has been confirmed, stop the logger per the instructions in section A.7.5
3. Remove the data loggers and sensors and return them to FELL.
Alternate Strategy for Power and Cooling Measurements – Download Data from a BAS This measurement approach is intended to be used for a system that is controlled by a BAS with data-trending and exporting capability. Work with the building operator or commissioning agent to determine if hourly true RMS power, hourly Btu’s delivered to the building, OAT, and supply and return chilled water temperatures can be trended for the measurement periods. If the BAS calculates average hourly COP and evaporator load, those can also be used. If these data are available, they can be used to develop a chiller operation and power consumption model that can be extrapolated to a NOAA CNY. It is beyond the scope of this guide to detail the exact procedure to do this, given the variation in types and format of data export and duration of trending capabilities. The spreadsheet that accompanies this guide can be used as the basis of a calculation tool, if needed.
15
Calculation Methodology
Total annual energy (in kWh/year) is calculated using the general equation, below:
𝐸𝐸 � 𝑘𝑘𝑘𝑘ℎ𝑦𝑦𝑦𝑦𝑦𝑦𝑦𝑦
� = �𝑇𝑇𝑖𝑖[𝐻𝐻𝐻𝐻𝐻𝐻𝑦𝑦𝐻𝐻] ∗ 𝑃𝑃𝑖𝑖 �𝑘𝑘𝑘𝑘ℎℎ𝐻𝐻𝐻𝐻𝑦𝑦
�𝑖𝑖
(1)
Where,
𝐸𝐸 = electricity use of chiller motor, kWh/year 𝑖𝑖 = bin index, or operational bin, as defined by the load frequency distribution 𝑇𝑇𝑖𝑖= total amount of time that chiller is operational for a given operational bin, hours/year (note
that the operational bin can be defined by temperature ranges or scheduling characteristics) 𝑃𝑃𝑖𝑖= average motor power draw for each operational bin, i, in kW
A Microsoft Excel workbook has been developed along with this guide to facilitate the calculation of total annual energy consumption from the measured data:
1. Air-cooled chiller: To be used when measuring annual consumption of the chiller using the average power draw (kW) as measured by a data-logging power meter, chilled water temperatures as measured by thermocouples, chilled water flow rate as measured by gauge pressure sensor, and the average hourly temperature as measured by a temperature/RH logger. Alternatively, the same data can be downloaded from a BAS, if available.
Instructions are included in the workbook that detail how to input data and how to interpret and make use of the results. Specific calculation methodology can be found in Appendix A.17: Air-Cooled Chiller Calculations and is captured in the workbook.
It is important to note that the models developed with these measurements are for steady state operation. The data loggers will most likely capture transient operation of the chiller. To improve model fit, the data records for these periods must be manually removed prior to pasting into the spreadsheet. Transient operation occurs during startup and shutdown. The startup transient lasts approximately one hour, while the chiller and the building cooling load stabilize; the shutdown transient may be briefer, typically about 30 minutes.
16
Reporting Recommendations As part of the documentation of expected avoided energy use, the integration of measurements and calculation methodology discussed in this guide will serve to enhance these projections. To facilitate transparency and data quality control, the following pieces of information should be documented to accompany expected savings calculations:
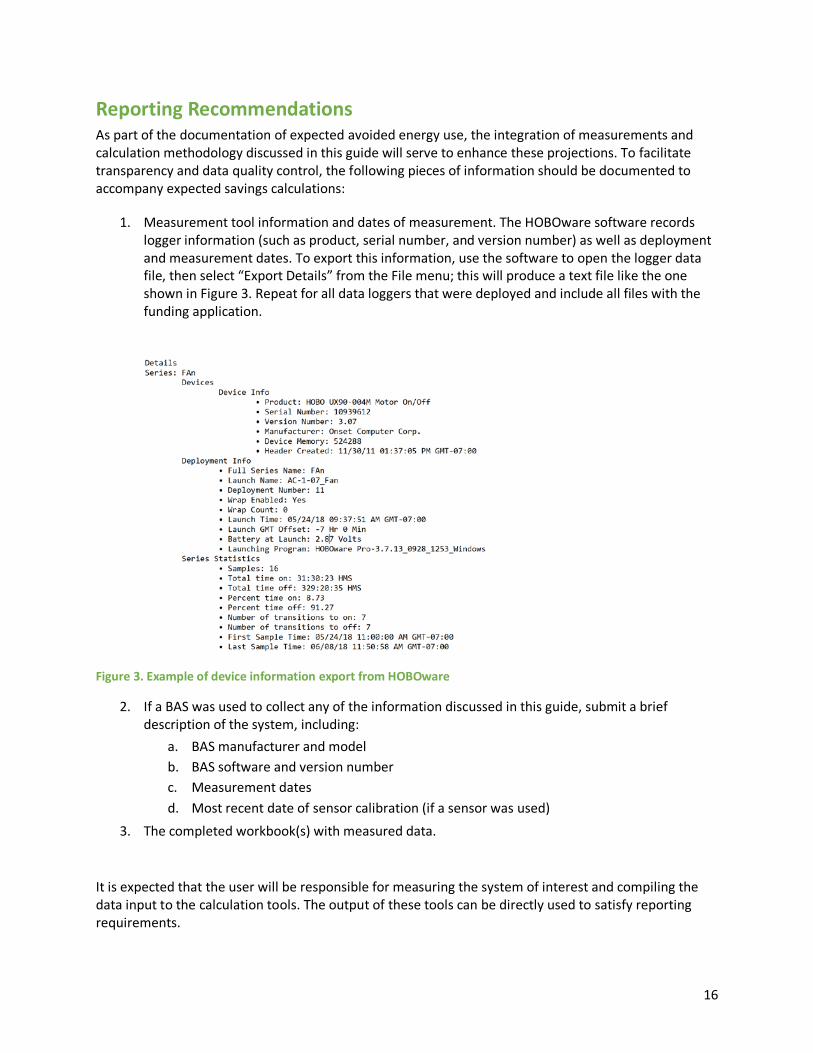
1. Measurement tool information and dates of measurement. The HOBOware software records logger information (such as product, serial number, and version number) as well as deployment and measurement dates. To export this information, use the software to open the logger data file, then select “Export Details” from the File menu; this will produce a text file like the one shown in Figure 3. Repeat for all data loggers that were deployed and include all files with the funding application.
Figure 3. Example of device information export from HOBOware
2. If a BAS was used to collect any of the information discussed in this guide, submit a brief description of the system, including:
a. BAS manufacturer and model b. BAS software and version number c. Measurement dates d. Most recent date of sensor calibration (if a sensor was used)
3. The completed workbook(s) with measured data.
It is expected that the user will be responsible for measuring the system of interest and compiling the data input to the calculation tools. The output of these tools can be directly used to satisfy reporting requirements.