Sulfuric acid aerosol is the ultimate product of the oxidation of anthropogenic sulfur dioxide andnaturally emitted reduced sulfur compounds such as dimethylsulfide. Although the atmosphericaerosol is very complex, H 2 S04 and H 2 0 are usually the major components. In particular, it isoften assumed that particles formed by homogenous nucleation in the atmosphere initially consist
entirely of H 2 S04 and H 2 O. The processes by which these particles form and grow are stillpoorly understood. But these processes are important since they affect the number concentration and size distribution of the atmospheric aerosol which, in turn, have direct andindirect influences on climate (Twomey, 1991; Preining, 1991; Leaitch, Isaac, Strapp, Banie& Wiefe, 1992; Schwartz, 1996; Saxena & Menon, 1999). One significant part of these processesis growth by coagulation.
Intermolecular attractions (dispersion or van der Waals' forces) produce an increase in coagulation rate constants for particles in the free molecular and transition regimes (Schmidt-Ott &Burtscher, 1982; Alam, 1987; Huang, Seinfeld & Marlow, 1990). This increase is often expressed interms of the enhancement factor, defined as the ratio of the experimental coagulation rate constantto the value predicted by hard sphere collision theory; the enhancement factor is always greaterthan unity.
Experimental results give a variety of results for enhancement factors. Fuchs and Stugin (1965)reported enhancement factors of 2.8 and 2.3 for NaCl particles with diameters of 5 and 9 nm,respectively. For these particles, they estimated a somewhat smaller theoretical enhancement factorof 2.2. Mercer and Tillery (1971) studied the coagulation rates of room air particles produced byradon decay, their results indicated that the enhancement factor is about 4. Shon, Kasper and Shaw(1980) studied NaCl particles with diameters of 18-105 nm and reported that the enhancementfactor is no larger than 1.1 even for the smallest particles. Okuyama, Kousaka and Hajashi (1984)measured coagulation rates for 5-40 nm diameter particles of various compositions. They obtainedenhancement factors of about 2 for NaCl, from 1 to 3 for ZnClz and between 5 and 10 for Ag. Thesevalues were somewhat smaller than the theoretically expected values for ZnC12 and NaCl andmuch larger than expected for Ag. McMurry (1980) simulated the evolution of the size distributionof photochemically generated H 2 O-H2 S04 aerosols in a smog chamber and reported that usingan enhancement factor of 1.98 gave generally better agreement than neglecting van der Waalsforces. Brockmann, McMurry and Liu (1982) studied coagulation of ammonium sulfate particlesand found an enhancement factor of about 2.1 over the diameter range of 5-40 nm. Theory (Sceats,1989) predicts a substantial variation in enhancement factor over the size ranges covered in theexperiments of McMurry and Brockmann et aI., Van Dingenen and Raes (1990) reported enhancement factors for H 2 0-H2 S04 aerosols that increased from 1.2 for diameters of about 200 nm to2.0 for diameters of about 30 nm.
The above results clearly cover a wide range and provide little information on the sizedependence of the enhancement factor in the transition regime. Here we describe a new method forthe determination of coagulation rate constants for monodisperse, neutral particles. The method isan adoption of the TDMA technique (Rader & McMurry, 1986); it uses a differential mobilityanalyzer (DMA) to produce a monodisperse aerosol (Knutson & Whitby, 1975; Pui & Kinney,1991) and a second DMA to separate the coagulation products from the original aerosol. Thisallows us to vary the particle size over a reasonable range in the transition regime. A key aspect ofthis approach is that we measure the initial rate of formation of the coagulation products ratherthan the rate of disappearance of the total particle number. This makes the method much moresensitive and much less subject to errors caused by deposition of particles in the apparatus. We usethe method to determine coagulation rate constants as a function of particle size for H 2 O-H2 S04aerosols. The results are compared to theoretical calculations to determine the Hamaker constantfor these particles.
2. Experimental
2.1. Apparatus
A flow diagram of the experimental set up is shown in Fig. 1. Clean, dry air was supplied by anAadco 737 pure air generator. The air flows were controlled by calibrated MKS 1259C mass flowcontrollers. Sulfuric acid aerosol was generated by mixing S03(g) with humid air in a 1/8 in.stainless-steel tee. S03(g) was produced by bubbling 10-50 sccm (standard cm3 per minute) of airthrough a glass frit immersed in fuming sulfuric acid (19-24% S03 by mass); the bubbler was keptin a constant temperature bath at 20.2°C. An air flow of 1000~2000 sccm was humidified by passinga portion of the flow through a humidifier consisting of a 100 cm length of Nafion tubing(permeable to water but not air) immersed in distilled water. After mixing this saturated portion ofthe flow with the dry portion, the humidity was monitored by a humidity sensor (Vaisala HumitterSOU). For the experiments described here, the humidity at this point was kept at 40 ± 1%, exceptfor a few experiments in which it was kept at 60 ± 1%.
Once the S03 and H 2° flows were mixed, the aerosol was allowed to pass through a 220 cm3
tubular chamber; this allowed the aerosol to grow by coagulation. It was found that the stability ofthe aerosol number concentration was improved by using a circulating water bath to keep thechamber at 20.2°C. The size of the particles exiting the chamber could be altered by changing eitherthe air flow through the chamber or the air flow that was saturated with S03' Using a faster flowthrough the chamber, or a smaller S03 flow, produced smaller particles while a slower total flow ora larger S03 flow produced larger particles.
F
S03/air
S03/H2S04
Kr-85
DMA#l
... valve
[gj filter
ill flow controller
--0- laminar flow meter
® 4-way valve
~ bipolar charger
excessair
DMA#2Po-210
Teflon~coated- '-Jstirr bar magnetic
stirrer
electrostatic 1
precipitator -T
H2S04/air
%RH sensor
Nafiontubing
humidifier
Fig. 1. Flow diagram of the experimental apparatus.
A portion of the polydisperse aerosol exiting the chamber was charged by a 85Kr bipolar chargerand a monodisperse fraction was obtained by using a TSI 3071 differential mobility analyzer(DMA# 1) set at an appropriate voltage. The aerosol inlet and outlet flows of DMA# 1 weremaintained at 483 accm (actual cm3 per minute). All aerosol flows in this experiment weremonitored using the pressure drop across laminar flow elements which were calibrated againstthe mass flow controllers. The sheath air ,flow was 6000 sccm. Since the sheath air was dry, therelative humidity of the aerosol leaving the DMA was much lower than that of the aerosol enteringthe DMA.
The charge on the monodisperse aerosol was removed by passing the aerosol through a 210pO
bipolar charger and then through an electrostatic precipitator. The precipitator consisted ofa 26 cm length of 1/2 in.o.d. stainless~steel tube with a 1/8 in.o.d. stainless-steel rod passed throughthe center. The rod was typically held at 1800 V. The efficiency of the electrostatic precipitator wastested before each experiment by bypassing the bipolar charger on DMA#2 and confirming thatno particles were detected at the outlet of DMA # 2 for any appropriate voltages.
Coagulation of the monodisperse aerosol occurred inside a continuously stirred tank reactor(CSTR). This consisted of a three necked, round bottom, glass flask with an estimated volume of5.21. A four-port valve was used to either direct the aerosol flow through the CSTR or to bypass theCSTR while adjusting the experimental conditions. The CSTR contained a 1.5 x 6cm Tefloncoated stirring bar driven by a magnetic stirrer; this was used to maintain homogeneous conditionsin the CSTR. The data analysis is based on the assumption that the CSTR was well mixed;however, too large a stirring rate results in excessive deposition of particle on the walls. Aninsufficient stirring rate could be detected by the fact that it resulted in substantial fluctuations innumber concentration while the CSTR was being filled. For these experiments, the stirring rate wasadjusted so that while filling the CSTR the root-mean-square fluctuation in the number densitywas less than 1% (compared to 10% without stirring) while giving a steady-state number densitywithin 1% of that obtained without stirring. An estimation of the stirring rate used during theexperiment was about 140-150 rpm. The residence time in the CSTR was approximately 650s.
The temperature in the CSTR was monitored using a Hg in glass thermometer inserted into theCSTR. The temperature inside the CSTR was typically 25 ± 1°C. Over the course of an experiment(approximately one and a half to two hours) this temperature varied by 0.5 to 1°C. This slighttemperature fluctuation is not big enough to significantly affect either the coagulation rate or theresidence time in the reactor.
The total number density of particles exiting the reactor was monitored by withdrawing a flow of150 accm to a TSI 7610 condensation nuclear counter (CNC# 1). After passing through a laminarflow element the flow was diluted with clean air to provide the total flow (,...., 1500 accm) required bythe CNC.
The remainder of the flow could be either sent on to the second DMA or diverted to a cooledmirror dewpoint hygrometer (EG&G model 911, not shown in Fig. 1) to determine the relativehumidity of the aerosol flow. Except when checking the dewpoint, this flow passed througha second 210pO bipolar charger and a second differential mobility analyzer (DMA#2). The sheathair for DMA # 2 was the filtered excess air from DMA # 1. The aerosol flows were maintained at333 accm. Filtered room air was added to the aerosol flow exiting DMA#2 to provide the totalflow required by CNC # 2 (TSl model 7610). A computer data acquisition system was used tooperate DMA#2 in fast scan mode (Wang & Flagan, 1990) and to record the counts from both
CNCs. Each data set consists of about 80-100 scans depending on the length of the experiment.Each scan from DMA # 2 took 90 s and consisted of 45 mobility bins with voltages ranging fromone-half to three times the voltage set on DMA # 1. The first 6 points of each scan were not usedsince steady state was not yet established in the DMA. The size resolution of the distributionmeasured with DMA # 2 was sufficient to allow the concentrations of the initial particles (monomers) and coagulation products (dimers) to be determined separately.
2.2. Procedure
All experiments were carried out in a dynamic mode in which the concentrations of monomersand dimers were measured as conditions inside the CSTR changed in response to changes in theaerosol entering the CSTR. The rate equations were then fit to the concentrations in order todetermine coagulation and wall loss rate constants. The data analysis procedure requires that theconcentrations be known as functions of the time in the CSTR. However, since the particlestake time to pass through the connecting tubing, the bipolar charger, and DMA # 2, there isa difference between the time at which the number concentration is measured at CNC # 2 and thetime at which that concentration was present in the CSTR. This time delay was measured as part ofthe procedure.
Prior to beginning an experiment, the four-port valve was set so that the flow bypassed theCSTR. The operating conditions were adjusted to provide a reasonable number of particles of thedesired size and the voltage on DMA # 2 was adjusted to match the maximum of the distributionleaving DMA # 1. The voltage on DMA # 1 was then set to zero to provide particle-free air and theflow was directed through the CSTR which was thoroughly flushed out. While clean air waspassing through the reactor, the flow was briefly diverted to the dew point hygrometer so that therelative humidity inside the reactor could be determined.
When the voltage on DMA # 1 was turned on, the particle number concentration in the CSTRstarted to increase as particle-free air was replaced with the aerosol. We refer to this as filling theCSTR. During the first 180s of filling (the first two scans ofDMA#2), the voltage on DMA# 2 waskept constant at the maximum of the distribution leaving DMA# 1; the data taken during thisinterval were used to determine the delay time as discussed below. DMA # 2 was then changed toscanning mode and used to determine the size distributions. The total number concentrationexiting the reactor was monitored by CNC # 1.
After approximately 90-100 min, the monomer and dimer concentrations reached constant,steady-state values. The voltage on DMA# 1 was then set to zero so that no fresh monomer wasintroduced into the CSTR. The particle concentrations then decreased as the aerosol was replacedby clean air. We refer to this as flushing the CSTR. Data collected during flushing was especiallyuseful in determining the wall loss rate constants for the monomer and dimer.
The time delay, f1t 2 defined as the time required for particles to flow from the CSTR to CNC # 2,was determined as follows. Let t1 be the flow time from DMA # 1to the CSTR and let t2 be the flowtime from DMA# 1 to CNC#2, then
f1t 2 = t 2 - t 1 • (1)
During the first 180 s of filling, the concentrations measured by CNC # 1 and CNC # 2 wererecorded and plotted as functions of time. These plots gave straight lines with intercepts at t 1 + f1t 1
and t 2, respectively, where ~t1 is defined as the time required for particles to flow from the CSTR toCNC # 1. ~t 1 is much smaller than the other quantities; by using the tubing volumes and flow ratesit was estimated to be 3.0 ± 0.5 s. Then t 1 and t 2 were obtained from the intercepts and substitutedin Eq. (1) to obtain the time delay, ~t2' The average delay was found to be 38.9 ± 4.4 s; this wasreasonably consistent with the value estimated from the volumes and flow rates. The average valuefor t 1 was 18.5 ± 4.2 s. The error limits for t 1 and t 2 are the standard deviations of the means of thevalues obtained for all experiments.
2.3. Particle composition
In most of these experiments, particle-free air from DMA# 1 was continuously flowed throughthe CSTR between experiments. When this was done with the humidifier kept at 40% RH, themeasured dewpoints in the air exiting the CSTR were - 24 ± 1°C. This corresponds to relativehumidities in the CSTR of 2.8 ± 0.4%. The corresponding equilibrium composition of the particles, calculated using the tables .of Gmitro and Vermeulen (1964), was 72.5 ± 0.5 wt% H 2 S04 .
Experiments with the humidifier at 60% RH gave dewpoints of - 21.9%°C, CSTR relativehumidities of 3.4%, and particle compositions of 71.7% H2 S04 . In some of the early experiments,the flow was allowed to bypass the CSTR between experiments. In these experiments, the dewpoints were initially very high and only slowly reached a constant value as air flowed through theCSTR; this was due to water vapor infiltrating the CSTR between experiments. Subsequentoutgassing of water from the CSTR walls raised the dewpoints. For these experiments themeasured dewpoints were -23.5 ± 1°C, the relative humidities were 3.0 ± 0.3%, and the H 2 S04
weight percentage in the aerosol was 72.2 ± 0.5%.
3. Data reduction
3.1. Fitting ofsize distributions
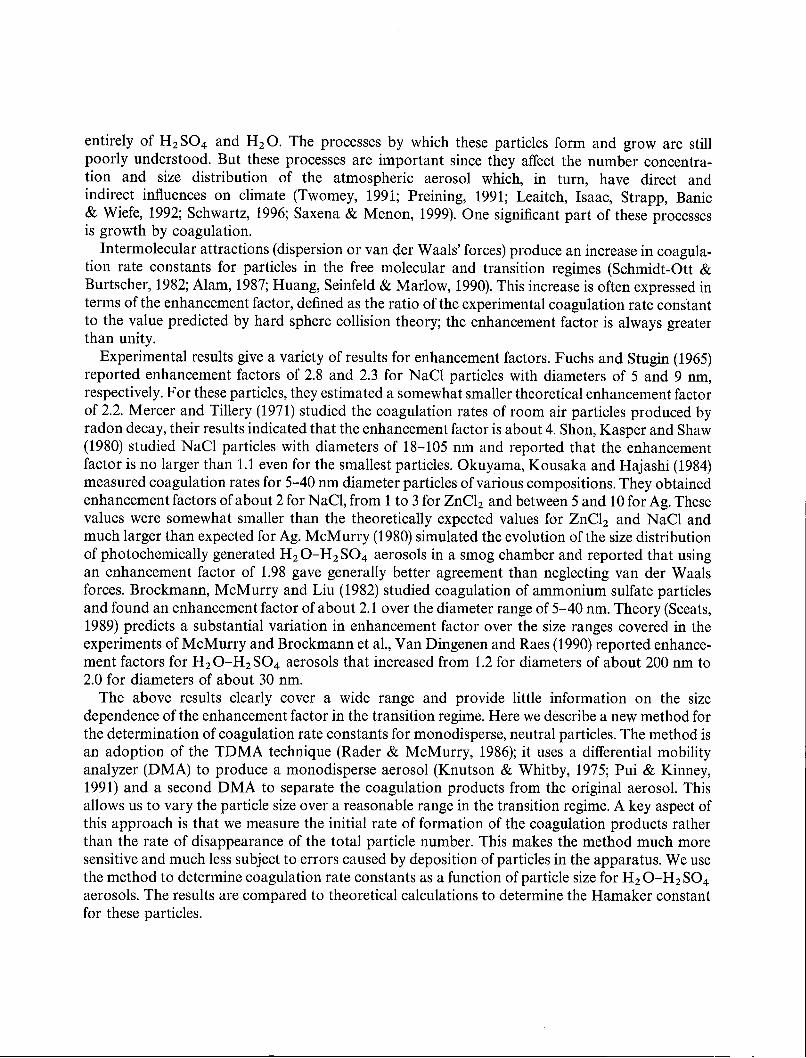
Typical size distributions for the aerosol exiting the CSTR are shown in Fig. 2. There are threepeaks. One, centered at approximately the voltage set on DMA # 1, corresponds to the monomer.The peak at twice this voltage consists of larger particles (2V particles) that were doubly chargedwhen passing through DMA# 1 but singly charged at DMA#2. These 2V particles have a minoreffect in the data analysis. The middle peak corresponds to particles with twice the volume of themonomer; these are the dimers produced by coagulation. From the two sets of data in Fig. 2, it canbe clearly seen that, as the experiment proceeds, the concentration of dimer increases more rapidlythan that of the monomer.
Since the three peaks partially overlap, it was necessary to fit all three simultaneously. This wasdone by generating a synthetic distribution function including a Gaussian instrumental spreadingfunction (Stolzenburg & McMurry, 1988). Non-linear regression was used to adjust the parametersof the function to produce the best fit to the measured data. There were seven parameters in the fit:a single instrumental spreading parameter, the standard deviation of the spreading function and,for each of the three peaks, both a number concentration and a centroid voltage offset. The voltageoffset was required because the peaks were not quite in their expected positions. This was due to
• data near start of filling• data near steady state
monomer
~(3 100:e('0
sc:oijJ:; 10c:~c:o()
~E::JZ
1000
0.1 I I I , "I , • I , I ! , I , I ! , , I I I I I '11 I I" I I I I , I I , , I , I , ! I I I I I I I , I ! I I I ! , ! , , I D I , , , , , I ,
60 70 80 90 100 110 120 130
Particle Diameter (nm)
Fig. 2. Typical size distributions exiting the CSTR in the filling and steady-state case. The points are measuredconcentrations and the lines are best fits.
both a slight systematic difference between the two DMAs and a small amount of evaporation thatcaused the particles to decrease slightly in size during the course of an experiment. The monomerdiameter typically decreased by 1.1-2.2 nm (1.2-3.7%) during filling, remained constant at steadystate, and decreased by 5.5-8.5 nm (6.3-19.5%) during flushing. In general, larger diameter changeswere observed when smaller size particles were used. The relatively large decrease during flushingwas due to the fact that there was no replacement of the particles by fresh particles during thisportion of the experiment. Since the coagulation rate constant were primarily determined by thedata obtained at steady state, the average size at steady state was taken as the size for which the rateconstant was measured. Although evaporation of the particles occurred throughout the experiment, it did not affect the number concentration being measured.
The synthetic distribution was generated by separately calculating the distribution for each ofthe three peaks and then combining the three distributions. For the monomer and 2V particles, thedistributions were calculated by convolving the theoretical transfer functions for the two DMAsoperating at the measured flow rates and then applying a Gaussian instrumental spreadingfunction. For the dimer peak, the shape was computed by numerically coagulating the theoreticalmonomer distribution exiting DMA# 1 and then applying the transfer function for DMA#2 andthe instrumental spreading function.
The fits in Fig. 2 show a slight systematic deviation on the high-voltage sides of the peaks.Although the cause of this has not been identified, we suspect that it is due either to non-idealperformance of the DMAs or to the implicit assumption of plug flow in the calculation of thedistribution. The deviation does not significantly affect the results; it is only visible because of the
logarithmic scale used in Fig. 2. The standard deviation of the instrumental spreading function wastypically about 3% during filling, remained constant during steady state, and then increasedslightly during the flushing case. For the smallest particles, the spreading factor increased to asmuch as 6-10% during flushing. This can be attributed to the partial evaporation of the particles.Individual particles experienced a spread of residence times in the CSTR and therefore evaporatedto varying degrees; this produced an increase in the width of the distribution. The spread inresidence times increased during filling, remained constant during steady state, and then increasedagain during flushing. Since the small particles evaporated to a greater degree, a larger increase inthe spreading function was observed for the smaller particles. This made it difficult to carry outexperiments for particles with diameters ofless than 60 nm since the spreading of the monomer and2V peaks tended to obscure the dimer peak.
The uncertainties in reading the aerosol flows measured by the laminar flow meters on DMA # 2were estimated to be ± 4%. Due to their effect on the DMA transfer function, these each give anerror of 1.9% in the particle concentration. The aerosol flow exiting DMA # 2 is also used indetermining particle concentration from the count rate measured by CNC # 2; thus, the flowuncertainty leads to a random error (between experiments) in the particle concentrations of 6.2%.Since this error will have the same effect on both the monomer and dimer concentrations, thissource of error leads to an uncertainty in individual coagulation rate constants of 6.2%. Weestimate that the corresponding systematic error in the flows and the rate constants is less than 2%.
3.2. Charging fraction
The number concentrations resulting from the fits of the distribution functions are those of thefraction of the particles bearing a single positive charge. The charging fractions for the 2l0pObipolar charger was determined as follows. With the aerosol bypassing the CSTR, a monodisperseaerosol was generated with DMA # 1 at voltage V. The charge on the aerosol was removed bypassing it through a bipolar charger and the electrostatic precipitator. Then, the aerosol was passedthrough a second bipolar charger, and the size distribution was measured with DMA # 2. Thescans with DMA # 2 covered a sufficient range to include the peaks at V/2 and 2V that result fromparticles that were doubly charged at DMA#2 and DMA# 1, respectively. Because of therelatively narrow size distribution and small median diameter from the S03 source, larger chargemultiples were unimportant. The aerosol number densities were kept low enough that the numberof dimer particles formed by coagulation was not significant compared to the three peaks (at V,V/2, and 2V) that were being measured.
Let the number concentrations in these three peaks be N V / 2 , N v , and N 2V ' Then we have
N V /2 = Af2'
N v = Afl + A'f'z,
N 2V = A'fl'
(2)
(3)
(4)
where A and A' are the number concentrations of the monomer (singly charged in DMA # 1) and2V (doubly charged in DMA# 1) particles that exit from precipitator,Jl andf2 are the fractions ofthe monomer that are singly and doubly charged by the 2l0pO charger for DMA#2, andf'l and
12 are the fractions of the 2V particles that are singly and doubly charged at DMA # 2. The totalnumber density of particles that enter the bipolar charger for DMA#2 is monitored by CNC# 1,let this be NT , given by
N T = A + A'. (5)
Eqs. (2)-(5) are four equations with six unknown·s. To circumvent this, the charge fractionmeasurements were started by setting the voltage ofDMA # 1 to a value where A' was negligible sothat Eqs. (2)-(5) could be solved for11 andl2' The voltage on DMA# 1 was then reduced by half sothat the values of11 and12 from the previous voltage becamef'l and12 at the new voltage. Thennew values of11 and 12 were determined and the process was repeated to obtain the chargingfractions for a sequence of sizes. A number of such sequences were obtained using various initialvoltages.
As noted above, the uncertainties in N V / 2 , N v , and N2V are about 5%. The estimated uncertaintyin NT was about 2%. Propagating these uncertainties through the procedure described above leadsto an uncertainty of about 5.6% for the largest particles increasing to 7.5% for smaller particles.These uncertainties were used to weight the data in determining best-fit polynomials.
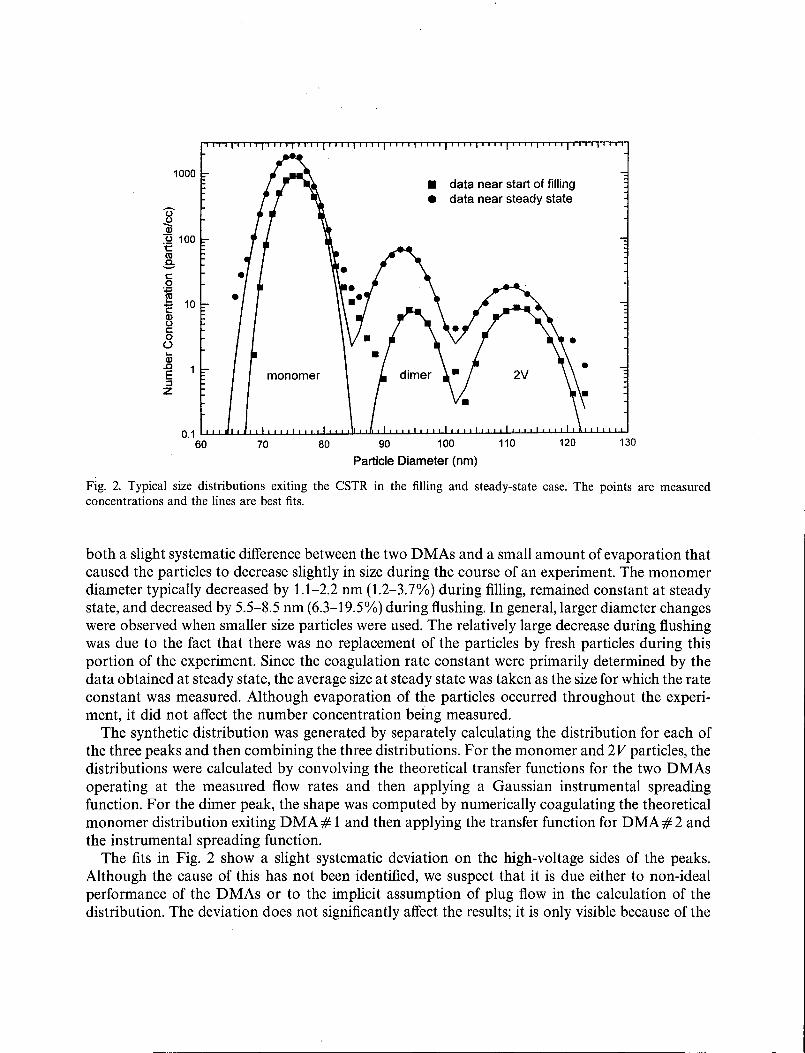
Fig. 3 shows the experimental charging fraction as a function of particle size along with thebest-fit polynomials. For the singly charged fraction, the results were fit to a third-order polynomial whereas the results for the doubly charged fraction were fit to a second-order polynomial.The scatter about these curves is consistent with the estimated uncertainties in the data points. Theestimated uncertainty in the charging fractions calculated from these polynomials is about 3.5%.In combination with the estimated errors from the DMA flows, we get an estimated 'betweenexperiments' uncertainty of 7.4% in determining the monomer and dimer concentrations.
14 I I I I I I I I 2.5
2.0 -0Q)
e>III
.t=U
1.5 ~.c::looQ)C>1.0 2c:
~Q)a.
05• singly chargedx doubly charged
12
2
-0Q) 10e>III
.t=U~ 8C>c:
US~ 6
~Q)
e 4Q)a.
o I I I I I I J I 0.030025010050 150 200
Diameter (nm)
Fig. 3. Charging efficiency of the 210pO bipolar charger for singly and doubly charged particles. Points are measuredefficiencies, lines are best-fit polynomials.
As a check on the accuracy of the number concentrations, we computed the ratio of the total ofthe three peaks measured by DMA#2 to the total measured by CNC# 1. The former totalincluded a small correction for the production, via coagulation, of larger particles. The average ofthese ratios was 0.97 with a standard deviation of 0.14. Although the average is in reasonableagreement with the expected ratio of unity, the standard deviation is nearly double that expectedfrom the estimated uncertainties in the number concentrations. This discrepancy is largely due tothree outliers; the most severe of these gave a 37% difference between the two methods ofmeasuring the total number.
The obtained charge distributions were compared with the charge distributions calculated usingthe theory of Fuchs (Wiedensohler, 1988). The singly charged distribution obtained in this studyfollows a trend similar to the calculated distribution, but with about half the magnitude of thecalculated values. The doubly charged distribution goes through a maximum at about 200 nm,unlike the calculated distribution. The magnitudes for the calculated doubly charged fractions areabout 5-11 times the observed values.
3.3. Fitting the number concentration
The raw number concentrations resulting from the fits of the distributions were corrected usingthe charging fractions determined as described above. The concentration in the 2V peak was usedto correct the monomer concentration for 2V particles that were doubly charged at DMA#2.Fig. 4 shows a typical plot of the monomer and dimer number concentrations as functions of time
3000
2500
o
u-aJu
2000 tIII.3:co
1500 ~-c~c
1000 8IDEis
500
80006000
...~"'~."'u.1AI. .....
...•
4000
Time (sec)
• monomerA dimer
2000
80
0- 70QQ)
12 601::l'Oa.
C')
0 50....-c:B 40~-c:~c: 300()....Q) 20E0c:0
::lE 10
00
Fig. 4. Typical time trace of monomer and dimer concentrations. Points are measured concentrations, corrected forcharging fraction, and lines are best fits to the kinetic model. The voltage on DMA# 1 was turned off at 5691 s.
as the CSTR is filled and flushed. The sole source of monomer to the CSTR is the flow into theCSTR. If the concentration of monomer entering the CSTR is [M]o then the source rate per unitvolume is kF[M]o where kF is the flushing rate constant defined by kF = Q/V, V is the volume ofthe CSTR and Q is the volumetric flow rate. The major processes that remove the monomer areflow out of the reactor with rate constant kF and coagulation to form dimer
M+M~D (6)
with rate constant kc . Minor removal processes are deposition on the walls of the CSTR with rateconstant kw and coagulation of monomer with dimer
M+D~P
with the 2V particles
M+L~P
and with coagulation products larger than the dimer,
M+P~P.
(7)
(8)
(9)
Since these latter processes are all very minor and should have similar rate constants they are givena common rate constant kc.All coagulation rate constants here are written as for coagulationbetween identical particles. These processes give the following rate equation for the monomer:
The dimer is produced by coagulation in the CSTR and by flow into the CSTR. Although thedimer concentration exiting DMA # 1 should be zero, some dimer will be produced by coagulationwhile flowing from DMA# 1 to the CSTR; this requires a time dt 1 determined as described in theprocedure section above. If it is assumed that the changing charge state of the aerosol in this regiondoes not affect the coagulation rate constant, then the concentration of dimer entering the reactor,[D]o, should be kc [M]2dt1 • We found that using this value of [D]o or allowing it to be a freeparameter in the fit did not significantly affect either the quality of the fit or the resulting value ofkc. The major removal processes for the dimer are flow out of the reactor with rate constant kF andcoagulation with monomer, reaction (7). Minor removal processes are deposition on the walls ofthe CSTR with rate constant kw, and coagulation with dimer and with larger particles
D +D~P,
D+L~P
and
D+P~P
with rate constants kc.The rate equation for the dimer is
To evaluate Eqs. (10) and (14) requires [L] and [P] as functions of time. The former is obtainedfrom the measured number concentrations of the 2V peak. The latter are obtained from the rateequation
The rate equations were integrated numerically and the parameters were adjusted using nonlinear least squares to provide the best fit to the data. [M]o and [D]o were assumed to changeinstantaneously between zero and constant values when the voltage on DMA# 1 was turned on oroff. Since the equations refer to concentration in the CSTR, a small correction for coagulation inthe sample lines downstream of the CSTR was made. This consisted of reducing [M] by 2keM 2f:..t2and increasing [D] by keM 2f:..t2 where f:..t2 is the time delay as defined in the procedure section.The uncertainties in the delay times, f:..t 1 and f:..t2, lead to an uncertainty of2.3% in the coagulationrate constants.
Four parameters (kc, kw, kw, [Mo]) were fit simultaneously. kF was calculated from the reactorvolume and flow rate; the fit is not sensitive to this parameter (maximum effect on ke was 0.4%)since it always appears in combination with parameters that were fit. Also, k'c was assumed to beequal to ke . These two coagulation rate constants are expected to be very similar in magnitudesince the size difference between the monomer and dimer is not very large. The fits were notsensitive to the value of k'c; the expected difference ofless than 13% between ke and k'c producesa change ofless than 0.4% in the coagulation constant. In the fits, the initial rise in the concentrations was most sensitive to [M]o and [D]o, the decays during flushing were most sensitive tokw and kw, and the steady state was most sensitive to ke .
In some cases, the monomer number density slowly drifted upwards or downwards, occasionallyby as much as 4% per hour during the steady-state period of the experiment. For those data wheredrifting was observed, the input number concentration, [M]o was allowed to be linear function oftime; this added another parameter to the fit.
Based on the scatter of data about the fitted lines, the standard deviations of the fitted values ofke were typically 2-5%. As noted above, the estimated uncertainties in input monomer and dimerconcentration amounted to 7.4%. However, in some cases the disagreement between the sum of thepeaks measured with DMA # 2 and the total number was substantially greater than this error. Inthose cases, the uncertainty in the number concentrations was taken as the difference between thetwo methods of determining the total. Errors in other inputs to the fit contribute an uncertainty of2.4%. These three sources of uncertainty were combined in quadrature to obtain estimates of theuncertainties in the measured rate constants. The percentage uncertainties averaged 13% andranged from 7.6 to 37%. Identifiable sources of systematic error are substantially smaller than theserandom errors.
4. Results and discussion
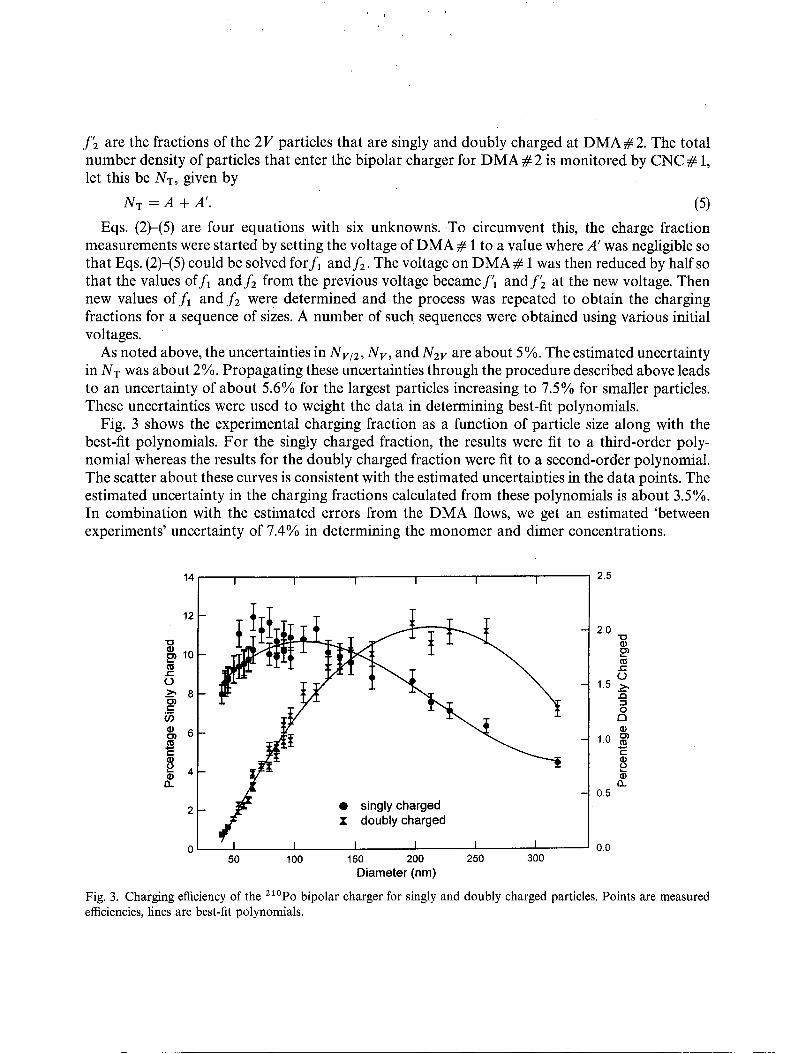
The coagulation rate constants resulting from this work are plotted in Fig. 5. The error bars areone sigma uncertainties estimated as described above. Also shown are the rate constants for equal
I3.5 i I i I i i i i i i i i i i I i I i i I I i I I i I i i i i I i i i I i i i I i i i i i i i
(j)M-- 3.0
!30;>~ 2.5......,CIIIjjj 2.0c::o()
~et::c::
~ 1.0~h ~_ I ttttr: it! Mm ~- -----_. !~ -----------------------------------------
<3 0.5
0.0 [, i I I I I i I I I 1 I I I I I , i I I , , I , J I I I I I , I • , I , , , , I I ' , I ,
~ ~ ~ W 00Radius (nm)
Fig. 5. Size dependence of the coagulation rate constants. Thin solid line is the value calculated from Sceats hard spherecollision theory. The bottom dotted line is the value calculated from Fuchs hard sphere collision theory. The thick solidline is the best-fit result for the experimental data (A = 16KT). The error bars are the estimated one sigma uncertaintiesfor each data point. Circles, squares, and triangles represent 72.5, 72.2, and 71.7 wt% H2 S04, respectively.
size particles calculated using the hard sphere collision theories ofSceats (1989) and of Fuchs (1964)and the rate constants calculated accounting for van der Waa1s' forces calculated as discussedbelow. The experimental results show enhancements relative to the hard sphere rate constantsranging from 1.2 for the largest particles (127 nm) to 2.8 for the smallest particles (49 nm). These arecomparable to the factor of two enhancement reported by McMurry (1980) for H2 O-H2 S04particles with diameters of 20-50 nm and the enhancement factors of 1.2-2.0 reported by VanDingenen and Raes (1990) for H2 0-H2 S04 aerosols with diameters of 200-30 nm. Before weattribute this enhancement to van der Waa1s' forces, we must eliminate the possibility that theresults are artificially high due to either incomplete mixing or turbulent coagulation.
4.1. Wall losses, mixing, and turbulent coagulation
These three processes are all driven by turbulence and so are closely linked. The coagulationrate constants will be erroneously high if the turbulence is too weak to produce completemixing or so strong that coagulation is enhanced by velocity shear in the gas. The wall lossrate constants are obtained from the experiments and provide a means to get some insight intothe degree of turbulence in the reactor. It should be noted that the wall loss rate constantsare highly uncertain since they depend on the difference between the CSTR flushing rate andthe observed decay rate of the aerosol concentration. This difference is typically about 10-25%;as a result the wall loss rate constants are very sensitive to variations in the flow rate throughthe CSTR.
For particles in the size range used in these experiments, the wall loss rate constants should bealmost entirely determined by diffusion. We have corrected the wall loss rate constants bysubtracting the sedimentation rate constants calculated using
ksed = 3U sed /4R, (16)
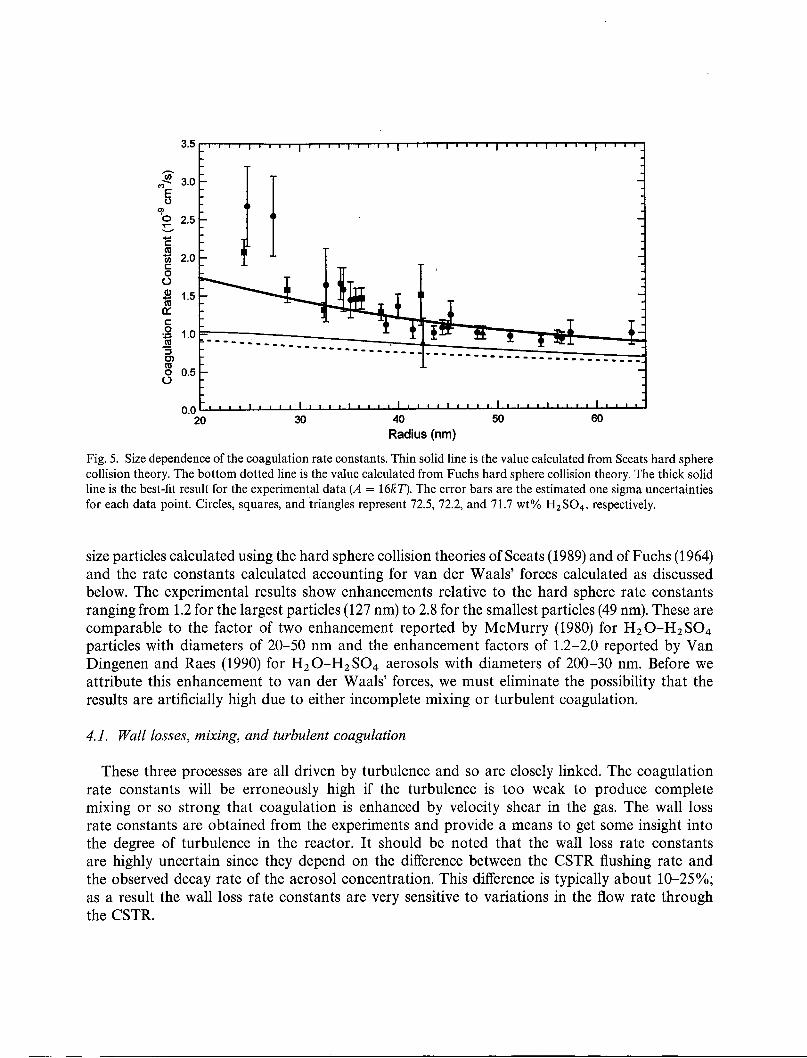
where Used is the sedimentation velocity and R is the radius of the CSTR. This correction amountsto no more than 5%. The resulting wall loss rate constants are plotted as a function of Browniandiffusion coefficient in Fig. 6. Fitting the results to a power law of the form
kWaIl - ksed = AD~ (17)
yields n = 0.71 ± 0.13, in excellent agreement with the value of 0.75 predicted by the theory ofLandau and Levich (Fuchs, 1964). When applied to a sphere of radius R, this theory gives
kWaIl - ksed = (U*/2R)(DB/v)0.75, (18)
where u* is friction velocity and v is the kinematic viscosity of the gas. Fixing the exponent inEq. (17) as 0.75 yields A = 2.10 ± 0.13 cm -1.5 S-0.25. Since the CSTR has a radius of about 11 cm,Eq. (18) yields a friction velocity of approximately 10 cm s -1.
With this result we can roughly estimate the time scale for macroscale mixing in the reactor byturbulent diffusion. The eddy diffusion coefficient, DE, as a function of distance z from the wall isgiven by (Fuchs, 1964)
DE ~ 0.3U*z. (19)
900 I I i i i I i i I i I I i I I I I I i i I i I I I I
800 •
200
500
~.
••
••
•••400
700
100
'I/)
'f~ 600
E~c::8~0::c:: 300
.QI/)
~o
oI I , , I I , , J I I , I , I I I , I , I , , I I I
o 5 10 15 20 25
Diffusion Coefficient (10-6cm2/sec)
Fig. 6. Wall loss rate constants, corrected for sedimentation, as a function of particle diffusion coefficient. The line is thebest fit to a simple power law.
This will not apply all the way to the center of the reactor. Evaluating this at z = R/2 yieldsDE = 17 cm2 s-1; the average over the volume of the CSTR will be somewhat smaller than thissince lower values will apply near the walls and at the center. The time constant for diffusionalmixing in a sphere is (Crank, 1975, Section 6.3.6) R2/(4.5DE ), = 1.5 s. A more realistic value may betwo or three times as large. This value is considerably smaller than the CSTR residence time of650 s and is consistent with the observation, reported above, that the mixing is sufficient to suppressconcentration fluctuations during the filling and flushing of the CSTR.
The coagulation rate constants are determined mainly by the data obtained at steady state. Thenthe maximum fractional error due to insufficient mixing should be of the order of the fractionaldifference in the steady-state concentration of monomer and the concentration in the flow enteringthe CSTR; call this fractional error Eo. For these experiments, Eo is in the range 0.05-0.09. As thefluid resides in the CSTR, mixing reduces the variations in concentration. If the fractional error, E,decays exponentially with time constant tM and if the residence time in the CSTR is tR, then we have
E = Eo exp (- tR/tM). (20)
Since tR = 650 s, the error will be negligible if tM is in the order of 100 s or less.The mixing time constant, tM, must include both the time constant for macroscale mixing by
eddy diffusion, estimated above, and the time constant for microscale mixing by diffusion. The latertime constant is of the order of magnitude given by (Pohorecki & Baldyga, 1983)
tmicroscale ~ (V/S)1/2(DB/v), (21)
where s is the rate of energy dissipation per unit mass of fluid. This can be estimated by (Pond,Stewart & Burling, 1963)
s ~ (2.5U*3)/R. (22)
Using the friction velocity estimated above, we obtain s = 230 cm2 s- 3 and micromixing timeconstants in the range of 0.2-0.3 s for the range of Brownian diffusion coefficients encountered inthese experiments. These estimates are based on the assumption of fully isotropic, homogeneousturbulence. This will not apply through the fluid, in particular it cannot apply near the walls. Evenallowing for this and for the fact that there appears to be considerable uncertainty over theexpression for the exact value of this time constant, it is clear that it is sufficiently short to ensurecomplete mixing in these experiments.
Excessive turbulence can have the effect of enhancing coagulation. There are two aspects of thisthat must be considered. One of these is inertial effects resulting from the fact that the particles areconstantly subjected to accelerations of the fluid. For the present experiments, these effects shouldbe negligible since the relaxation times of the particles are of the order of 10- 7 s while theKolmogorov time scale of the fluctuations, given by (V/S)1/2 (McComb, 1991), is of the order of0.025 s. Thus, we expect that the particles should closely follow the fluid flow.
The second way in which turbulence can enhance coagulation is via turbulent enhancement ofthe diffusion coefficient. According to Williams (1988), the multiplicative enhancement factor g is
1g = [1 - (nx/2) + xtan- 1 x]'
(23)
where
x = 2a(0.15jDB )1/2(BjV)1/4. (24)
For the largest particles, with a = 64 nm and DB = 4.6 x 10- 6 cm2 s-1, this yields g = 1.023, thefactor decreases to g = 1.004 for the smallest particles. Thus, if the value used for the energydissipation rate is not an over estimate, the rate constants measured for the largest particles may beslightly larger than the actual values.
4.2. Determination of the Hamaker constant
The rate constants as a function of particle size were fit to theory to determine the Hamakerconstant. The most widely used theory for calculating coagulation rate constants is the hard spheretheory of Fuchs (1964). This theory was not designed to incorporate interparticle forces and itsgeneralization (Marlow, 1980) to account for the effect of interparticle forces in the transitionregime is very complex. The theory of Sceats (1989) was derived specifically for the case ofinterparticle interactions and gives a much simpler formula for the transition regime; it also givesvery similar hard sphere results to the Fuchs theory (see Fig. 5). Because of its convenience andappropriateness to the problem at hand, we use the theory of Sceats here. The calculations describethe interparticle force in terms of the Hamaker constant; this constant mainly depends on thecomposition of the particles. Reliable values of the Hamaker constant for H 2 S04-H2°particlesare not available.
In the formulation of Sceats (1989), the coagulation rate constant for the kinetic and diffusionlimited regimes are given by
and
kK = (~)(ai + aj)2Cij E(00)
ko = 27t(ai + aj)DijE(O),
(25)
(26)
where ai and aj are the radii of the particles, cij as the mean relative speed of the particles, Dij is therelative diffusion coefficient (i.e., the sum of the diffusion coefficients of the two particles), and E( (0)and E(O) are the enhancement factors for Knudsen numbers of infinity and zero, respectively. Interms of these limits, the transition regime coagulation rate constant is given by
kT = kdJ1 + t& - tij ),
where
(27)
(28)kK
tij = 2ko
'
To determine the enhancement factors, the expressions given by Sceats (1989) were solvednumerically for values of the reduced Hamaker constant, A', ranging from 0.01 to 1000. Theseexpressions ignore the effect of retardation on the interparticle interaction. The calculated enhancement factors were fit to within 0.8% by the expressions
E(O) = 1 + alX + a3x3 (29)
(30)
and
~ 3£(00)=1+ jA,+b1 x+b3 x,1 + boy A'
where x is In(l + A'), a1 = 0.0757, a3 = O~0015, bo = 0.0151, b1 = -0.186 and b3 = -0.0163. Thenumerator in the second term in Eq. (30) was chosen to give the analytically derived limitingbehavior at small values of A'. The reduced Hamaker constant is related to the Hamaker constant,A, via
A 4aiaj'- 2"
A - kT(ai + aj)(31)
The above equations, with ai = aj, were used in a weighted non-linear regression routine to findthe value of the Hamaker constant that best fit the measured rate constants. In this fit, the results ofexperiments in which filling and flushing was done separately were not used. The data wereweighted using the uncertainties for each measured rate constant. The best fit, shown by the heavyline in Fig. 5, corresponded to A' = 16 ± 6 or A = (6.4 ± 2.6) x 10 - 13 erg; the uncertainties are95% confidence limits. The fit is consistent with the estimated uncertainties as determined bythe value of the chi-square probability (Press, Flannery, Teukolsy & Vettering, 1989, Chapter 14).The uncertainties in A and A' are large because kc has only a logarithmic dependence on theHamaker constant; the corresponding uncertainties in calculated rate constants are only 4-5%.The Hamaker constant obtained here is in good agreement with the value of 5.4 x 10- 13 ergestimated by McMurry (1980).
The residuals in this fit show a small but statistically significant trend indicating that, as thediameter decreases, the rate constant increases more strongly than predicted by the theory. Wecannot say if this is real or if it is due to a slight systematic error in the experiments. If the trend isreal, it may to do to the approximate nature of the theory used here. There was no observable effectof the slight variation in composition examined here.
As noted above, there was occasionally poor agreement between the total particle concentrationdetermined from the size distribution and the total measured by CNC # 1. If it is assumed that thelater number is correct, and that the error is uniform over the small range of sizes in thedistribution, then the rate constants can be adjusted by using the ratio of the two totals. When thiswas done, the fit was improved slightly and gave A' = 12 ± 5; this agrees with the previousdetermination within the error limits. Since we do not understand the origin of the discrepancybetween the concentration measurements, we do not think that it is appropriate to prefer thisadjusted value.
Finally, we consider the possible effect of retarded interactions; the theory used here does notaccount for this. When the particles are far enough apart that the finite speed oflight must be takeninto account, the enhancement due to the intermolecular attraction will go down significantly. Anapproximate distance beyond which the retarded interaction of particle needs to be considered isgiven by Schmidt-Ott and Burtscher (1982). This distance depends on the particle size and theHamaker constant. We calculated an upper limit to the effect of retardation for a Hamakerconstant of 22 kT, using the largest particle size employed in this work (about 127 nm). A simpleupper limit was obtained by assuming that the intermolecular attraction drops to zero once the
(32)
shortest distance between the two particles is beyond the transition distance given by
3hCdT = 8n2A .
(Schmidt-Ott & Burtscher, 1982); this certainly gives an over estimate of the effect of retardation.The result of this calculation showed that for A = 22 kT, the upper limit for the effect of retardedinteractions was less than 1%. We therefore conclude that the neglect of retarded interactions isjustified.
5. Conclusion
We have developed a tandem differential mobility analyzer method for measuring coagulationrate constants that uses the rate of formation of the coagulation products rather than the rate ofchange of the total number concentration or the growth of a particle size distribution. This methodprovides a useful means for obtaining coagulation rate constants as a function of particle size forequal size particles. For uncharged H2S04/H2 0 particles (72.5% H 2 S04 by weight) at 298 K withdiameters ranging from 49 to 127 nm, we observed an enhancement factors ranging from 1.2 to 2.8relative to the values calculated for sticky hard spheres using the method of Sceats (1989). Thelarger enhancement factors were obtained for the smaller particles. The results are in reasonableagreement with the approximate theory of Sceats with van der Waals forces taken into account.The best-fit value of the Hamaker constant was found to be (6.4 ± 2.6)10- 13 erg. This constantgives enhancement factors of 1.30-1.58 over the measured diameter range. Using Eqs. (29) and (30),the enhancement factor is found to be 1.25 in the diffusion (continuum) limit and 2.27 in the kinetic(free molecule) limit.
Acknowledgements
We thank Richard Leaitch of the Atmospheric Environment Service for the loan of a condensation nucleus counter. Funding was provided by the Natural Sciences and Engineering ResearchCouncil of Canada.
References
Alam, M. K. (1987). The effect of van der Waals and viscous forces on aerosol coagulation. Aerosol Science andTechnology, 6, 41.
Brockmann, 1. E., McMurry, P. H., & Liu, B. Y. H. (1982). Experimental study of simultaneous coagulation anddiffusionalloss of free molecule aerosols in turbulent pipe flow. Journal of Colloid and Interface Science, 88, 522.
Crank, J. (1975). The mathematics ofdiffusion. (2nd Ed). Oxford: Clarendon Press.Fuchs, N. A. (1964). The mechanics ofaerosols.. Oxford: Pergamon Press.Fuchs, N. A., & Stugin, A. G. (1965). Coagulation rate of highly dispersed aerosols. Journal ofColloid Science, 20, 492.Gmitro,1. I., & Vermeulen, T. (1964). Vapor-liquid equilibria for aqueous sulfuric acid. American Institute of Chemical
Engineering Journal, 10, 740.
Huang, D. D., Seinfeld, J. H., & Marlow, W. H. (1990). BGK equation solution of coagulation for large Knudsen numberaerosols with a singular attractive contact potential. Journal of Colloid and Interface Science, 140, 258.
Knutson, E. 0., & Whitby, K. T. (1975). Aerosol classification by electric mobility: Apparatus, theory, and applications.Journal ofAerosol Science, 6, 443.
Leaitch, W. R., Isaac, G. A., Strapp, J. W., Banic, C. M., & Wiebe, H. A. (1992). The relationship between cloud dropletnumber concentrations and anthropogenic pollution: Observations and climatic implications. Journal ofGeophysicalResearch, 97, 2463.
Marlow, W. H. (1980). Derivation of Aerosol collision rates for singular attractive contact potentials. Journal ofChemical.Physics, 73, 6284.
McComb, W. D. (1991). The physics offluid turbulence. Oxford: Oxford University Press.McMurry, P. H. (1980). Photochemical aerosol formation from S02: A theoretical analysis of smog chamber data.
Journal of Colloid and Interface Science, 78,513.Mercer, T. T., & Tillery, M. I. (1971). Coagulation rates of particles produced in air by thoron. Journal of Colloid and
Interface Science, 4, 785.Okuyama, K., Kousaka, Y., & Hayashi, K. (1984). Change in size distribution of ultrafine aerosol particles undergoing
Brownian coagulation. Journal of Colloid and Interface Science, 101, 98.Pohorecki, R., & Baldyga, J. (1983). New model of micromixing in chemical reactor. 1. General development and
application to a tubular reactor. Industrial and Engineering Chemistry Fundamentals, 22, 392.Pond, S., Stewart, R. W., & Burling, R. W. (1963). Turbulence spectra in the wind over waves. Journal ofthe Atmospheric
Sciences, 20, 319.Preining, O. (1991). Aerosol and climate - an overview. Atmospheric Environment, 11, 2443.Press, W. H., Flannery, B. P., Teukolsy, S. A., & Vettering, W. T. (1989). Numerical recipes in pascal.. Cambridge:
Cambridge University Press.Pui, D. Y. H., & Kinney, P. D. (1991). Use of electrostatic classification method to size 0.1 mm SRM particles
- a feasibility study. Journal ofRes. National Institute ofStand. Technology, 96, 147.Rader, D. J., & McMurry, P. H. (1986). Application of the tandem differential mobility analyzer to studies of droplet
growth or evaporation. Journal ofAerosol Science, 17, 771.Saxena, V. K., & Menon, S. (1999). Sulfate-induced cooling in the southeastern U.S.: An observational assessment.
Geophysical Research Letters, 16, 2489.Sceats, M. G. (1989). Brownian coagulation in aerosols - the role of long range forces. Journal ofColloid and Interface
Science, 129, 105.Schmidt-Ott, A., & Burtscher, H. (1982). The effect of van der Waals forces on aerosol coagulation. Journal ofColloid and
Interface Science, 89, 353.Schwartz, S. (1996). The whitehouse effect - shortwave radiative forcing of climate by anthropogenic aerosols: An
overview. Journal ofAerosol Science, 3, 359.Shon, S.-N., Kasper, G., & Shaw, D. T. (1980). An experimental study of Brownian coagulation in the transition regime.
Journal ofColloid and Interface Science, 73, 233.Stolzenburg, M. R., & McMurry, P. H. (1988). TDMAFIT users's manual, university of Minnesota Particle Technology
Laboratory Publication No. 653.Twomey, S. (1991). Aerosols, clouds and radiation. Atmospheric Environment, 25A, 2435.Van Dingenen, R., & Raes, F. (1990). Coagulation enhancement of H20-H2S04 aerosols: Experiments and model
calculations in the transition regime. Journal ofAerosol Science, 21, s237.Wang, S. c., & Flagan, R. C. (1990). Scanning electrical mobility spectrometer. Aerosol Science and Technology, 13, 230.Wiedensohler, A. (1988). An approximation of the bipolar charge distribution for particles in the submicron size range.
Journal ofAerosol Science, 19, 387.Williams, M. M. R. (1988). A unified theory of aerosol coagulation. Journal ofPhysics D, 21, 875.