Page 1
UNIVERSITY OF SOUTHERN QUEENSLAND
FACUTLY OF ENGINEERING AND SURVEYING
Measurement of Waste in Concrete
Construction using Lean Construction
Methodologies
A dissertation submitted by
George Kenneth Watson
In fulfilment of the requirements of
Bachelor of Engineering Honours (Civil)
OCTOBER 2014
Page 2
ii | P a g e E N G 4 1 1 2
Abstract
This dissertation develops and analyses the quantification of all wastes present in particular
construction process. This has been conducted from a lean construction perspective where waste
has been defined as any non-value adding process or activity. The specific processes chosen were
concrete paving, hand-pouring concrete and the installation of formwork. The types of wastes
present in the construction industry have been researched and a comprehensive list collated. A
number of waste classifications have been evaluated to organise these wastes into manageable
groups. These classifications were also selected on their usability and the potential techniques of
measurement. A suitable format for waste reporting has been established and trialled in a
construction environment. This has been evaluated by Professional Engineers in management
positions within the construction industry.
Due to the individual nature of construction projects there are significant inefficiencies in
comparison to similar industries such as manufacturing. Of these wastes concrete construction has
been deemed the largest contributor to wastage. This leads us to the question of how do we
measure not only the materials wasted but the other types of waste in processes. This needs to be
answered as efficiencies cannot be improved without the knowledge of where and how they are
occurring.
This project has been conducted utilising; theoretical research, practical on-site observations and by
seeking industry feedback on the conclusions drawn from these investigations. The theoretical
research took the form of a literature review on lean construction methodologies and types of
‘waste’. This focused on waste management and classification and how this has been applied to
construction projects around the world. Practical on site observations were used to develop activity
mapping and waste sampling which were used in the case studies for waste classification and
quantification. From this a suitable format for waste reporting has been established and trialled in a
construction environment. Industry feedback was sought in the form of structured interviews and an
accompanying questionnaire. These interviews were conducted with four Engineering Managers
working on a variety of large construction projects. From this evaluation improvements can be made
to this structure and a future direction for this research has been determined.
This research can be used as a base for lean construction waste reporting within the Australian
construction industry. It has shown this it is both practical and useful to implement this reporting
process on site. The dissertation has also identified the need for a cost/benefit analysis into waste
reporting on construction sites to determine the efficiency of the process itself.
Page 3
iii | P a g e E N G 4 1 1 2
Limitations of Use
The Council of the University of Southern Queensland, its Faculty of Health, Engineering & Sciences,
and the staff of the University of Southern Queensland, do not accept any responsibility for the
truth, accuracy or completeness of material contained within or associated with this dissertation.
Persons using all or any part of this material do so at their own risk, and not at the risk of the Council
of the University of Southern Queensland, its Faculty of Health, Engineering & Sciences or the staff
of the University of Southern Queensland.
This dissertation reports an educational exercise and has no purpose or validity beyond this exercise.
The sole purpose of the course pair entitled “Research Project” is to contribute to the overall
education within the student’s chosen degree program. This document, the associated hardware,
software, drawings, and other material set out in the associated appendices should not be used for
any other purpose: if they are so used, it is entirely at the risk of the user.
Page 4
iv | P a g e E N G 4 1 1 2
Candidates certification
I certify that the ideas, designs and experimental work, results, analysis and conclusions set out in
this dissertation are entirely my own efforts, except where otherwise indicated and acknowledged.
I further certify that the work is original and has not been previously submitted for assessment in
any other course or institution, except where specifically stated.
George Kenneth. Watson
0061004847
(signature)
(date)
Page 5
v | P a g e E N G 4 1 1 2
Acknowledgements
I would like to acknowledge and thank those who have provided assistance throughout the
completion of this research project. Without these people I would not have been able to achieve the
aim and objectives of this dissertation.
I would like to thank my supervisor Dr Vasantha Abeysekera for his significant assistance and
guidance throughout my research.
Appreciation is also due to my employer Wagners Constructions for their support, feedback and
access to resources.
Page 6
vi | P a g e E N G 4 1 1 2
Contents Abstract ................................................................................................................................................... ii
Limitations of Use .................................................................................................................................. iii
Candidates certification ......................................................................................................................... iv
Acknowledgements ................................................................................................................................. v
List of figures ........................................................................................................................................... x
List of tables .......................................................................................................................................... xii
List of appendices ................................................................................................................................ xiii
List of Abbreviations .............................................................................................................................xiv
Introduction ............................................................................................................................................ 1
1.1 Outline........................................................................................................................................... 1
1.2 Introduction .................................................................................................................................. 1
1.4 Aim ................................................................................................................................................ 1
1.3 The Problem .................................................................................................................................. 2
1.4 Research Objectives ...................................................................................................................... 2
1.6 Conclusions ................................................................................................................................... 3
Literature ................................................................................................................................................ 4
2.1 Background ................................................................................................................................... 4
2.2 Lean construction.......................................................................................................................... 5
2.3 Types of waste .............................................................................................................................. 6
2.4 Identification of waste – Transformation flow value .................................................................. 10
2.6 Measurement of waste – Value Stream Mapping (VSM) ........................................................... 14
2.6.1 Process activity mapping for Construction Process Analysis (CPA) ..................................... 14
2.6.2 Supply Chain response matrix .............................................................................................. 19
2.6.3 Product variety funnel ......................................................................................................... 19
2.6.4 Quality filter mapping .......................................................................................................... 20
2.6.5 Demand amplification mapping ........................................................................................... 20
2.6.6 Decision point analysis ......................................................................................................... 20
2.6.7 Physical structure mapping .................................................................................................. 21
2.6.8 Commitment Reliability as a measure of waste .................................................................. 23
2.6.9 Activity Sampling as an estimate of waste ........................................................................... 25
2.6.10 Multiple Activity Chart (MAC) ............................................................................................ 27
2.7 Classification of Construction Waste .......................................................................................... 29
2.7.1 European Waste List (EWL) .................................................................................................. 29
Page 7
vii | P a g e E N G 4 1 1 2
2.7.2 Lean Construction ................................................................................................................ 32
2.7.3 4D construction site management ....................................................................................... 33
2.7.5 Last Planner System for concreting operations (LPS) .......................................................... 35
2.7.6 Classification of waste by source ......................................................................................... 38
2.7.7 Classification of waste by processes .................................................................................... 39
2.7.8 Management classification of waste ................................................................................... 40
2.7.9 PESTLE classification of waste .............................................................................................. 41
2.7.10 Project management classification of waste ..................................................................... 41
2.7.11 Value adding classification of waste .................................................................................. 42
2.8 Concrete construction ................................................................................................................ 43
2.8.1 Technology ........................................................................................................................... 43
2.8.2 Current methodologies ........................................................................................................ 43
2.8.3 Current Reporting Structures ............................................................................................... 43
Xstrata coal – Project Waste Management .................................................................................. 45
Project Status Report Template .................................................................................................... 47
2.9 Summary of literature ................................................................................................................. 48
Method ................................................................................................................................................. 50
3.1 Overview ..................................................................................................................................... 50
3.2 Methodology ............................................................................................................................... 50
3.2.1 Literature Review ..................................................................................................................... 50
3.2.2 Questionnaire .......................................................................................................................... 51
3.2.3 Reporting structure .................................................................................................................. 51
3.2.4 Case studies ............................................................................................................................. 51
3.2.5 Data collection & Results ......................................................................................................... 51
3.2.6 Discussion and Recommendations .......................................................................................... 52
3.2.6 Summary, Conclusions and Further work ................................................................................ 52
Reporting Structure .............................................................................................................................. 53
4.1 Introduction ................................................................................................................................ 53
4.2 Development of reporting structure .......................................................................................... 53
4.2.1 Reporting in the Last Planner System .................................................................................. 53
4.2.1 Selection of Waste Classification ......................................................................................... 55
4.2.2 KPI’s ...................................................................................................................................... 56
4.2.3 Reporting structure .............................................................................................................. 58
4.3 Reporting Structures ................................................................................................................... 60
Page 8
viii | P a g e E N G 4 1 1 2
Case studies .......................................................................................................................................... 62
5.1 Overview of Wellcamp Airport Construction .............................................................................. 62
5.2 Concrete paving .......................................................................................................................... 64
5.2.1 The Process .......................................................................................................................... 64
5.2.2 Waste KPI’s ........................................................................................................................... 67
Design waste ................................................................................................................................. 74
5.3 Hand Pours .................................................................................................................................. 76
5.3.1 The Process .......................................................................................................................... 76
5.3.2 Waste KPI’s ........................................................................................................................... 78
5.4 Formwork Assembly.................................................................................................................... 83
5.4.1 The Process .......................................................................................................................... 83
5.4.2 Waste KPI’s ........................................................................................................................... 86
5.5 Sample Weekly Waste Report .................................................................................................... 93
Industry Feedback ............................................................................................................................... 101
6.1 Aim ............................................................................................................................................ 101
6.2 Format ....................................................................................................................................... 101
6.3 Target Group ............................................................................................................................. 102
6.4 Method ..................................................................................................................................... 102
6.3 Questionnaire ........................................................................................................................... 104
6.4 Results ....................................................................................................................................... 108
6.5 Discussion .................................................................................................................................. 113
6.5.1 Lean Construction .............................................................................................................. 113
6.5.2 Waste & waste reducing Strategies ................................................................................... 113
6.5.3 Report Content & Structure ............................................................................................... 113
6.5.4 Tools and Techniques......................................................................................................... 114
6.5.5 Frequency ........................................................................................................................... 114
6.5.6 Feasibility ........................................................................................................................... 114
6.5.7 Additional Comments ........................................................................................................ 115
Conclusions ......................................................................................................................................... 116
7.1 Summary ................................................................................................................................... 116
7.2 Review of the Problem .............................................................................................................. 116
7.3 Conclusion ................................................................................................................................. 118
7.4 Limitations of the study ............................................................................................................ 118
7.5 Further Work ............................................................................................................................. 119
Page 9
ix | P a g e E N G 4 1 1 2
Appendices .......................................................................................................................................... 120
Appendix A – Project Specification ................................................................................................. 120
Appendix B – Monthly Site Waste Report Template ...................................................................... 121
Appendix C – RAS field sampling sheets ......................................................................................... 127
Appendix D – Questionnaire Feedback Forms ................................................................................ 132
Reference List ...................................................................................................................................... 148
Bibliography ........................................................................................................................................ 150
Page 10
x | P a g e E N G 4 1 1 2
List of figures
Number Title
Figure 1 - Sources and cause of construction waste. (Bossink 1996 p 59) ............................................. 7
Figure 2 - Comprehensive list of wastes developed through research. ................................................. 9
Figure 3 - Transformation model .......................................................................................................... 10
Figure 4 - Flow model applied to the transformation of materials repeated over two cycles.
(Abeysekera 2009, p. 205) .................................................................................................................... 11
Figure 5 - Flow process of concrete batching and on-site production (Dunlop & Smith 2004, p. 57). 11
Figure 6 - Relationship and expectations of the supplier and customer (Abeysekera 2009a, p. 217). 11
Figure 7 - Flow diagram of Transformation Flow Value applied to management ................................ 12
Figure 8 - Symbols JIS Z 8206 (Lee et al. 1999, p. 65) .......................................................................... 15
Figure 9 - Flow process chart of steel erection process (Lee et al. 1999, p. 66) ................................... 16
Figure 10 - Plan view flow diagram of steel erection process (Lee et al. 1999, p. 67) ......................... 17
Figure 11 - Plan view of construction with implemented improvements ............................................ 18
Figure 12 - Product variety model applied to a brewing example (Hines & Rich 1997, p. 54). ............ 19
Figure 13 - Quality filter mapping applied to automotive supply chain (Hines & Rich 1997, p. 55). ... 20
Figure 14 - Physical structure map of an automotive industry example (Hines & Rich 1997, p. 58) ... 21
Figure 15 - Decision support tool used based of correlations between tools and wastes. (Hines & Rich
1997, p. 50) ........................................................................................................................................... 22
Figure 16 - Layout for application of VALSAT to determine effectiveness of waste identification tools.
(Hines & Rich 1997, p. 60) ..................................................................................................................... 23
Figure 17 - Expected vs actual progress of tasks within a project plan.(Sharma 2013, p. 25) ............. 24
Figure 18 - Commitment Reliability calculation for tasks represented in the above schedule. (Sharma
2013, p. 25) ........................................................................................................................................... 24
Figure 19 - Activity sample example demonstrating collected data and calculations. ........................ 25
Figure 20 - Normal distribution demonstrating the range of data within a confidence level of 95%. . 26
Figure 21 - Multiple activity chart of a concreting operation transporting concrete using 3
wheelbarrows and a hoist. (Abeysekera 2009b, p. 263) ...................................................................... 27
Figure 22 - Optimised version of the original Multiple Activity chart where all three wheelbarrows
are used and empty barrows are sent down straight after filled barrow is unloaded. (Abeysekera
2009b, p. 265) ....................................................................................................................................... 28
Figure 23 - Representation of material inputs and waste outputs for a construction site. (Llatas 2011,
p. 1274) ................................................................................................................................................. 31
Figure 24 - Optimisation of movements of concrete pumps.(Lin & Haas 1996, p. 220) ...................... 33
Figure 25 - Building Information Model representing a real construction operation. (Popov et al.
2010, pp. 364,5) .................................................................................................................................... 35
Figure 26- Last Planner System flowchart. (Choo 2003, p. 40) ............................................................. 36
Figure 27 - The Last Planer System in terms of should, can, will and do. (Ballard 2000, pp. 3-15) ...... 37
Figure 28 - Classification of wastes according to management structures. ......................................... 40
Figure 29 - PESTLE framework for classification of wastes according to their specific impacts.
(Abeysekera, 2014) ............................................................................................................................... 41
Figure 30 - Classification of wastes according to common project management KPI's. (Abeysekera,
2014) ..................................................................................................................................................... 41
Page 11
xi | P a g e E N G 4 1 1 2
Figure 31- Waste classification flowchart (Xstrata coal 2014). ............................................................. 46
Figure 32 - Relationship between waste reporting, planning and the construction process itself. ..... 53
Figure 33 - Model of continuous improvement applied to waste reduction. (HARRIS 2006, p. 39) .... 54
Figure 34 - Example template for visually representing commitment reliability. ................................ 57
Figure 35 - Data tabulation for Random Activity Sampling of a process .............................................. 57
Figure 36 - Template Flow Process Chart ............................................................................................. 57
Figure 37 - Example template for a Multiple Activity Chart. ................................................................ 58
Figure 38 - Waste reporting structure for quantification of Key Performance Indicators. .................. 59
Figure 39 - Layout of airport with the turning node pictured on the far left end of the runway and the
apron located in front of the terminal (Wagners Constructions). ........................................................ 62
Figure 40 - Commitment reliability calculation of the paving of the turning node. ............................. 67
Figure 41 - Example of RAS sampling taken over one day of paving. ................................................... 68
Figure 42 - Utilisation rates of the elements in the concreting process. .............................................. 68
Figure 43 - FPC for the concrete paving process running for a duration of three truck deliveries. ..... 70
Figure 44 - Multiple Activity Chart (MAC) for concrete paving utilising a 6 truck turnaround. ........... 71
Figure 45 - FPC over a duration of two hand pours; each with two trucks arriving and placing at the
same time. ............................................................................................................................................ 79
Figure 46 - MAC of processes over the duration of multiple concrete pours. ..................................... 80
Figure 47 - The run in the middle is currently supporting the formwork for the runs either side. Once
each side is completed and the formwork is removed the middle run will be paved as an infill run. . 83
Figure 48 - Calculation of commitment reliability showing the work planned each day and the actual
progress at the end of each day. .......................................................................................................... 86
Figure 49 - FPC for the installation of three forms. .............................................................................. 88
Figure 50 - MAC showing the various elements of the formwork installation process. ....................... 89
Page 12
xii | P a g e E N G 4 1 1 2
List of tables
Number Title Page
Table 1 - Tabulated process analysis with non-value adding and unnecessary processes outlined in
red. (Lee et al. 1999, p. 69) ................................................................................................................... 17
Table 2 – Comparison of process before and after implementation of improvements with change in
number of transportation steps outlined in red. (Lee et al. 1999, p. 69) ............................................. 18
Table 3 - Classifications of example wastes into materials, time and information. ............................. 38
Table 4 - Inventory of materials kept on site used in concrete production. ........................................ 74
Table 5 - Waste Reporting Summary for the concreting process. ........................................................ 75
Table 6 - Inventory of materials kept on site used in concrete production. ........................................ 81
Table 7 - Summary of waste KPI's for hand pours. ............................................................................... 82
Table 8 - Summary of waste KPI's for the installation of formwork. .................................................... 92
Table 9 - Quantification of the significance of different sources of waste. ........................................ 109
Table 10 - Suggested waste measurement frequencies for each technique. ..................................... 111
Page 13
xiii | P a g e E N G 4 1 1 2
List of appendices
Number Title Page
A Project Specification .................................................................................................. 120
B Monthly Site Waste Report Template ....................................................................... 121
C RAS field sampling sheets .......................................................................................... 127
D Questionnaire Feedback Forms ................................................................................ 132
Page 14
xiv | P a g e E N G 4 1 1 2
List of Abbreviations
BIM Building Information Model
CPA Construction Process Analysis
CSMS Construction Site Management System
EWL European Waste List
FPC Flow Process Chart
ISPS Integrated Site Planning System
JIS Japanese Industrial Standards
JIT Just in Time
KPI Key Performance Indicator
LCI Lean Construction Institute
LPS Last Planner System
MAC Multiple Activity Chart
NVA Non-value Adding
NVAN Non-value Adding but Necessary
PESTLE Political, Economic, Social, Technological, Legal, Environment
RAS Random Activity Sampling
RFI Request for Information
TFV Transformation Flow Value
TPS Toyota Production System
VA Value Adding
VSM Value Stream Mapping
Page 15
1 | P a g e E N G 4 1 1 2
Chapter 1
Introduction
“There has never been a systematic attempt to observe all wastes in a construction process.”
(Koskela 1997, p. 6)
1.1 Outline
The above statement suggests the need for a study into the quantification of all the wastes
present in a particular construction process. This report endeavours to both classify and
measure the wastes present in particular concreting processes.
1.2 Introduction
The temporary nature of construction projects is but one reason for the vast inefficiencies
within the Australian construction Industry. The resulting product of these inefficiencies is
waste whether it be wasted time, materials or monetary losses. This report will begin with a
background of the presence and effects of waste in construction. This is followed by a
literature review focusing on appropriate topics such as waste and lean construction methods
for waste reduction. A study of classification and measurement of these examined types of
waste present in construction will be used to determine the methods best used to map the
sources. A suitable format for waste reporting will be established and trialled in a construction
environment.
1.4 Aim
This research will study the application of lean construction methodologies to the Australian
construction industry. To achieve this the report will examine production processes involved in
construction and identify and measure waste with the aim of improving performance. In order
to do this it is necessary to focus on a specific group of processes. The scope of this project will
include the process of concreting with associated processes such as formwork and
reinforcement assembly.
Page 16
2 | P a g e E N G 4 1 1 2
1.3 The Problem
The construction industry is one of the largest producers of waste in Australia. This is an
industry characterised by low efficiencies and lagging environmental credentials. It has been
proven that this can be improved by the implementation of Lean Construction principles.
(Koskela 1997, p. 6) Given that concreting operations account for a large proportion of the cost
of construction it is useful to examine these issues in relation to concrete construction.
1.4 Research Objectives
The following research objectives will be used as a guide for conducting research and
experimentation. Additionally they will be used to monitor progress and measure the overall
success of the research project:
1 Investigate current methodologies for construction of concrete structures and the
types of waste present. This will focus on the construction phase of traditional
design, tender and construct projects.
2 Identify lean construction techniques for reducing waste
3 Establish techniques for measuring waste and a framework to implement these.
4 Select specific processes to study (foundations, culvert, bridge pier etc) and
measure waste.
5 Synthesise a suitable format for waste reporting based on the literature review
6 Seek feedback from construction industry professionals on Key Performance
Indicators for waste
7 Use waste classifications and corresponding remedial actions for report
recommendations
8 Conduct a case study for concreting including; classification of wastes, process
mapping and application of reporting formats.
1.5 Methodology
This report will begin with a review of current literature relevant to lean production in the
construction industry. This will be broken up into a number of interconnected sections
consisting of; lean construction, types and classification of waste and different concrete
construction methodologies. The objectives will be used to create a template for reporting
waste in traditional design, tender and construct projects. To achieve this the report has been
broken up into the following chapters:
Literature review
Methodology
Page 17
3 | P a g e E N G 4 1 1 2
Waste reporting structure
Case studies
Industry Feedback
Conclusions and Recommendations
1.6 Conclusions
This research has outlined the current methods for waste measurement and methods for
implementation of lean production methods in construction. This research will provide a
framework for the classification and measurement of waste in concrete construction. The
outcomes of this study could be used in the planning and execution of concreting processes in
construction projects. The framework developed through this research can also be modified
for use in other areas of construction processes.
Page 18
4 | P a g e E N G 4 1 1 2
Chapter 2
Literature
2.1 Background
The construction industry has been slow to implement environmentally friendly practices with
many Australian companies yet to implement waste minimisation strategies (Faniran & Caban
1998). Landfill is generally the most cost-effective and convenient solution to construction
waste with 20-30% of all landfill originating from construction projects. (Teo & Loosemore
2001) Australia generates 32.4 million tons of waste annually. 42% of this is generated from
the construction and demolition sectors where concrete constitutes 81.8% of this.
Unfortunately only 57% of this is recycled. (Tam 2009)
From my previous comments I have chosen to focus on concrete construction. I have chosen
concrete as this is the largest contributor of waste in the building and construction industry. A
study into waste generated in the Dutch residential building industry by Bossink found that
80% of waste from the residential building industry consisted of materials such as concrete,
bricks, piles and roof tiles. (Bossink & Brouwers 1996)This is partly due to the prevalence of
concrete structures as well as the issues related to batching and timing of pours.
Construction of concrete structures can be broken down to the major processes of; design,
planning, formwork, reinforcement assembly, pouring, removing formwork and any resulting
defects or required re-work. This research will primarily focus on the processes of formwork,
reinforcement and pouring.
There are many different contracts and types of organisations utilised in construction.
Contracts can be tendered as design and build but this is regularly divided between a design
firm and a construction company. Within the construction process there is often a complex
relationship between the main contractor, sub-contractors and suppliers. A large amount of
waste is generated both within and at the interface between each of these organisations. For
the purpose of this research the scope will be restricted to waste generated by the main
contractor.
This leads us to measurement of this waste. Waste in construction activities need to be
measured to determine productivities, costs and environmental impact. To do this first the
waste needs to be identified to determine both the reason and source. Once this is established
Page 19
5 | P a g e E N G 4 1 1 2
it can be categorised into a particular group to determine the method of measurement.
Measurement of some wastes can be easy, however, others are both difficult. This research
will attempt to determine methods to measure all types of waste according to different
classifications.
2.2 Lean construction
According to the Lean Construction Institute Australia, lean construction is; “a production
management-based approach to project delivery”(LCI 2014). This concept of “lean” is focused
on: elimination of waste; maximisation of customer value and increasing workflow. (LCI 2014)
The concept of lean production originated from the Toyota Production System (TPS),
developed by the vice president of the Toyota Motor Company (Sugimori et al. 1977). The
system was developed to reduce costs through the elimination of waste using just in time
production (JIT). JIT requires that everything is produced as needed in only the necessary
quantities and only when needed (Sugimori et al. 1977).
Koskela states; “Manufacturing has been a reference point and a source of innovations in
construction for many decades.” (Koskela 1997, p. 1) The article also states that lean
production is the major manufacturing practice used in western countries. By combining this
information it is obvious that it is only natural that lean production be applied in the
construction sector.
Lean production has been very useful in mass production. This is because manufacturing
cheaply produces large volumes of standard materials using a low skilled workforce and
specialised machinery. However, construction is considered a craft industry. This is where
products are built one at a time using a highly skilled workforce and an assortment of flexible
tools at a high cost. The development of lean construction endeavours to integrate the
benefits of both these industries. (Choo 2003)
The principal outcome of all lean construction elements is increasing value generation and the
elimination of waste. The methodologies to achieve this can be classified into the phases of;
increased flexibility, flow smoothing and continuous improvement. Examples of these methods
include; the pull system, Just-in-time delivery, supply chain management and value stream
mapping. (Koskela 1997)
Page 20
6 | P a g e E N G 4 1 1 2
2.3 Types of waste
This section will demonstrate the types of waste identified by a number of literary articles.
From these lists a comprehensive list can be made for use in classification. Formoso identifies
waste as any inefficiency where larger than necessary amounts of; capital, resources,
equipment or labour are expended in construction (Formoso, Isatto & Hirota 1999). The
following lists outline the types of waste identified by a selection of literary sources:
Abeysekera (2009) provides the following extensive list of waste:
Processing waste
Waiting/idle time
Transporting
Making-do
Inventory
Unnecessary motion
Requests for information (RFI’s)
Design errors
Lack of communication
Constructability concerns
(Abeysekera 2009a)
A survey by (Faniran & Caban 1998) indicates the five largest sources of waste:
Material
Design changes
Design and detailing errors
Poor weather
Packaging and non-reclaimable consumables
However, this research focuses on the construction portion of the traditional design-tender-
construct project. For this reason types of waste such as design changes and detailing errors
have little relevance to this analysis.
(Hines & Rich 1997, p. 47)) lists the seven commonly accepted wastes derived from the Toyota
Production system:
1. Overproduction
2. Waiting
Page 21
7 | P a g e E N G 4 1 1 2
3. Transport
4. Inappropriate transport
5. Unnecessary inventory
6. Unnecessary motion
7. Defects
Bossink 1996 provides a list of causes of waste and in which stage in the construction project
they originated. These ‘causes’ could be loosely defined as descriptive definitions of types of
waste.
Figure 1 - Sources and cause of construction waste. (Bossink 1996 p 59)
Source CauseDesign Error in contract documents
Design
Contract documents incomplete at commencement
of construction
Design Changes to design
Design Choices of specifications of products
Design Choosing low quality products
Design Incorrect sizing of products
Design
Designer unfamilliar with possibilities of differnet
products
Design
Lack of influence of contractors and lack of
knowledge about construction
Procurement Ordering error, overordering and underordering
Procurement Lack of possiilities to order small quantities
Procurement Use of products that do not fit
Materials handling Damaged during transport
Materials handling Damage due to inappropriate storage
Materials handling Unpacked supply
Materials handling Throwaway packaging
Operation Error by tradesperson or labourer
Operation Equipment malfunction
Operation Inclement weather
Operation Accidents
Operation Damage caused by subsequent trades
Operation Replacement of incorrect material
Operation Method to lay foundation
Operation
Required quantity of products unknown due to
imperfect planning
Operation
Information about types and sizing of products arrives
too late to contractor
Residual Conversion waste from cutting uneconomical shapes
Residual Offcuts from cutting materials to length
Residual
Overmixing of materials for wet trades due to lack of
knowledge of requirements
Residual Waste from application process
Residual Packaging
Other Criminal waste due to damage or theft
Other
Lack of on site materials control and waste
management plans
Page 22
8 | P a g e E N G 4 1 1 2
This list once again introduces the design wastes, however, only the construction stage wastes
of procurement, materials handling, operation and residual will be considered for this analysis.
This table groups the traditionally considered types of waste such as offcuts and packaging in a
new group labelled residual. (Bossink 1996 p 59) The following is a comprehensive list of the
wastes identified through the research process:
Page 23
9 | P a g e E N G 4 1 1 2
Figure 2 - Comprehensive list of wastes developed through research.
Types of waste Poor weatherError in contract documents
Poor weatherDetailing errors
Poor weatherContract documents incomplete at commencement of construction
Poor weatherDesign changes
Poor weatherChoices of specifications of products
Poor weatherChoosing low quality products
Poor weatherIncorrect sizing of products
Poor weatherDesigner unfamilliar with possibilities of differnet products
Poor weatherLack of influence of contractors and lack of knowledge about construction
Poor weatherOrdering error, overordering and underordering
Poor weatherLack of possiilities to order small quantities
Poor weatherTransport time
Poor weatherWaiting/idle time
Poor weatherDamaged during transport
Poor weatherInappropriate transport
Poor weatherUnnecessary motion
Poor weatherUnnecessary inventory
Poor weatherDamage due to inappropriate storage
Poor weatherLack of communication
Poor weatherRequest for information (RFI's)
Poor weatherConstructability concerns
Poor weatherError by tradesperson or labourer
Poor weatherDamage caused by subsequent trades
Poor weatherEquipment malfunction
Poor weatherMaking do
Poor weatherPoor weather
Poor weatherAccidents
Poor weatherReplacement of incorrect material
Poor weatherMethod to lay foundation
Poor weatherRequired quantity of products unknown due to imperfect planning
Poor weatherInformation about types and sizing of products arrives too late to
Poor weatherOverproduction
Poor weatherDefects and Re-work
Poor weatherProcessing waste (conversion from cutting uneconomical shapes)
Poor weatherOffcuts from cutting materials to length
Poor weatherOverproduction
Poor weatherWaste from application process
Poor weatherPackaging
Poor weatherCriminal waste due to damage or theft
Poor weatherLack of on site materials control and waste management plans
Page 24
10 | P a g e E N G 4 1 1 2
2.4 Identification of waste – Transformation flow value
Before waste can be measured it needs to be identified and traced back to its source in the
construction process or supply chain. The Transformation Flow Value (TFV) approach
represents construction as transformations, value generation and flow of materials or
resources. Each of these representations allow us to analyse construction activities different
ways.
Koskela states that there are two aspects in production; conversions and flows. Both of these
activities require time and materials, however, only conversions create value by converting
one material into another. Conversion activities are linked together by flow activities which
include processes such as; transporting, waiting or inspecting. The aim of this classification is
to identify flow activities which can be eliminated and increase efficiency of conversion
activities. (Koskela 1997)
Transformation simplifies construction into the conversion of inputs to outputs. The inputs can
be materials, labour or capital and the outputs represent the final product. The transformation
or conversion is representative of the particular construction activity needed to create the
desired output. The transformation activities are seen as value-adding and anything that is
non-transformation is non-value adding or waste. Planning in construction is the identification
of what processes are needed to convert the required inputs into outputs and generate value.
(Abeysekera 2009a, p. 204)
Construction can also be represented by the flow of materials and other resources - and the
efficiency of any project is directly linked to the continuation of this flow or continuity of work.
Below is the flow model applied to the generic transformation of materials. This shows the
actual value of processing surrounded by necessary ‘waste’ procedures. This also shows that
this can be broken down into cycles simplifying the identification process. (Abeysekera 2009a,
p. 214)
Figure 3 - Transformation model (Abeysekera 2009, p. 204.)
Input Conversion/
Transformation Output
Page 25
11 | P a g e E N G 4 1 1 2
This method can be applied to discrete construction processes. These are processes which can
be narrowed down to a relatively small repetitive cycle mostly unaffected by other outside
processes. One such example is the generic concreting process which is shown in the following
diagram:
Figure 5 - Flow process of concrete batching and on-site production (Dunlop & Smith 2004, p. 57).
Lastly construction processes can also be represented by the value provided to customers.
Value is created when the products and services created by the suppliers meet the expected
requirements of the customer. This relationship can also be applied to a consultant and client
relationship or any other customer-supplier relationship as shown in the following figure.
Figure 6 - Relationship and expectations of the supplier and customer (Abeysekera 2009a, p. 217).
One of the biggest challenges in a supplier-customer relationship is understanding what is of
value to the client. In other words what are their requirements and expectations of the
products and services the supplier is going to provide? The supplier is often made up of a
number of organisations consisting of consultants, contractors, subcontractors and material
Figure 4 - Flow model applied to the transformation of materials repeated over two cycles. (Abeysekera 2009, p. 205)
Page 26
12 | P a g e E N G 4 1 1 2
and equipment suppliers. In construction it can often be quite difficult to coordinate all these
parties to achieve these expectations and requirements. (Abeysekera 2009a, pp. 217-9)
Bertelsen and Koskela discuss methods to operationalise the TFV model of construction for
Managing the Three Aspects of Production in Construction. The successful integration of the
three concepts of transformation, flow and value is the foundation of implementing the TFV
model. These three concepts can be used in different situations to improve our production
system. (Bertelsen & Koskela 2002, pp. 1-6)
Bertelson and Koskela portray the three TFV tools in a managerial environment demonstrating
the way in which management is responsible for handling the production system. The overall
production flow is broken up into three management functions of contracts management,
process management and value management. The role of contracts management is setting up
the production system which is different for each construction project. Process management
aims to maintain high efficiencies and predictable flow of work by maintaining cooperation
between all parties involved in the construction process. Value management ensures the
outputs from the process meet the client’s needs. This involves ensuring the timeliness; quality
and cost are all satisfactory for the client. Basically these three roles work together to
determine the inputs required, oversee the transformation and validate the outputs.
(Bertelsen & Koskela 2002, pp. 6-7)
Figure 7 - Flow diagram of Transformation Flow Value applied to management
Bertelson and Koskela promote the implementation of these three roles of management
separately for two reasons. Firstly, of the three aspects discussed only contract management is
currently implemented. This means that it would be easier to simply add process and value
management as two separate positions leaving the current contract management role intact.
Secondly, considering the differences in the roles it would seem more convenient to recruit
people with different skillsets specific for the requirements of each role. (Bertelsen & Koskela
2002, p. 8)
Inputs Contract Managment
Transformation Process
management Outputs
Value management
Page 27
13 | P a g e E N G 4 1 1 2
In conclusion the article provides a guide for the implementation of TFV by splitting the
managerial structure into the three separate roles.
Page 28
14 | P a g e E N G 4 1 1 2
2.6 Measurement of waste – Value Stream Mapping (VSM)
Another useful example of waste identification is value stream mapping. This approach
categorises all processes into three groups: value adding (VA), necessary but non-value adding
(NVAN) and non-value adding. (Hines & Rich 1997) Value stream mapping categorises the
critical path into these groups and identifies the non-value adding processes. Once these are
eliminated the new critical path is then mapped and wastes identified continuing the iterative
process. By continually iterating the critical path value stream mapping can not only be applied
linearly but also to complex systems.(Braglia, Carmignani & Zammori 2006)
VSM can be used to map production processes or entire construction projects. (Hines & Rich
1997, p. 50) Hines and Rich describe the uses and origins of the following seven value stream
mapping tools:
1. Process activity mapping
2. Supply chain response matrix
3. Production variety funnel
4. Quality filter mapping
5. Demand amplification mapping
6. Decision point analysis
7. Physical structure mapping
2.6.1 Process activity mapping for Construction Process Analysis (CPA)
Process activity mapping originates from industrial engineering and is conducted by studying
the flow of the processes and subsequently identifying waste. Improvement by rearranging the
process layout and elimination of unnecessary tasks – very similar to Construction Process
Analysis. (Hines & Rich 1997, p. 50)
Construction process analysis is a tool used for the identification and quantification of waste in
construction activities. Research indicates that this method is particularly effective for highly
repetitive processes. (Lee et al. 1999, p. 63) Unlike traditional process analysis tools CPA can
distinguish between value and non-value adding processes to identify waste. CPA uses process
analysis tools such as top-view flow diagrams and process charts to find problems in
construction processes. To map processes the method utilises symbols from the Japanese
Industrial Standards (JIS Z 8206) summarised in the following table taken from (Lee et al. 1999,
p. 65).
Page 29
15 | P a g e E N G 4 1 1 2
Figure 8 - Symbols JIS Z 8206 (Lee et al. 1999, p. 65)
Lee uses an example of a steel erection process to demonstrate the steps involved in CPA:
Page 30
16 | P a g e E N G 4 1 1 2
Figure 9 - Flow process chart of steel erection process (Lee et al. 1999, p. 66)
The flow process chart is a list of all processes undertaken to complete the steel erection
process. This defines the processes according the symbols from JIS Z 8206 such as operation,
transportation, inspection etc. and whether they are value-adding, non-value adding but
necessary or non-value adding and unnecessary. This chart can be used to measure waste by a
simple calculation:
This chart is accompanied by a flow diagram providing a plan view of the site illustrating the
steps spatially. 23.33
Page 31
17 | P a g e E N G 4 1 1 2
Figure 10 - Plan view flow diagram of steel erection process (Lee et al. 1999, p. 67)
These charts can then be summarised into the following table. The time and cost spent on
operation, transportation and inspection is divided into categories of value-adding, non-value
adding but necessary or non-value adding and unnecessary. Now that these non-value adding
and unnecessary processes have been identified the aim is to reduce the number and overall
share of these activities.
Table 1 - Tabulated process analysis with non-value adding and unnecessary processes outlined in red. (Lee et al.
1999, p. 69)
In this particular example improvements were made from this identification process which
reduced the number of these unnecessary activities. One of these improvements was dividing
the building area into bays each with a corresponding inventory. Originally the materials were
stored according to the steel manufacturer’s inventory spread across multiple locations. This
was changed to store the materials according to the construction sequence with each
Page 32
18 | P a g e E N G 4 1 1 2
inventory incorporating all the materials needed for a particular construction bay. This
eliminated a number of transportation processes therefore resulting in less unnecessary
activities.
Figure 11 - Plan view of construction with implemented improvements
Table 2 – Comparison of process before and after implementation of improvements with change in number of
transportation steps outlined in red. (Lee et al. 1999, p. 69)
As well as identification of waste and comparing improvements to construction processes CPA
can be used to compare similar construction activities. This allows a direct comparison of
efficiencies on different projects. This is a graphical method which can easily be integrated into
existing project management tools. One limitation is that a CPA conducted at this level can
only identify waste processes and not waste within individual process.(Lee et al. 1999, pp. 69-
72)
Page 33
19 | P a g e E N G 4 1 1 2
2.6.2 Supply Chain response matrix
Supply chain response determines the lead-time constraints on the supply chain for a
particular process. This produces a diagram of lead times for products at specific points in the
supply chain allowing the identification of individual problematic lead times on the critical
path. Identification of these lead times allows better planning of procurement and reducing
waste time waiting for materials. This can also reduce ‘making do’ waste by having the right
products there at the right time. (Hines & Rich 1997, pp. 51,2)
2.6.3 Product variety funnel
Product variety funnel is used to describe the addition of complexity to a process as it
proceeds along the process path. The funnel represents the often exponential growth in
variety of a product due to the addition of variety at each production phase. Figure 12 shows
this model applied to a brewing example. This model shows how the variety of products
increases with factors such as brew type and can size creating a complex array of products
form the same set of materials. This can be seen in construction with the use of raw materials
used to build with. There is now such are variety of types and sizes of all products from
excavators to bolts and nuts. This complexity requires suppliers to have huge inventories to
please the daily needs of construction projects which is the origin of inventory waste. The
product variety funnel can be further applied to products such as precast concrete items which
are often custom made due to the infinite combinations of size, shape, amount and placement
of reinforcing and the strength and composition of concrete required.
Figure 12 - Product variety model applied to a brewing example (Hines & Rich 1997, p. 54).
Page 34
20 | P a g e E N G 4 1 1 2
2.6.4 Quality filter mapping
Quality filter mapping plots the rates for particular types of defects along the supply chain. This
tool allows the identification of quality problems and where they occurred along the supply
chain. Defects are a large source of waste at the end of any project and the prevention of
these earlier in the project can save a lot of time and money (waste) in the end. Three types of
defects have been plotted in the following figure. (Hines & Rich 1997, pp. 54,5)
Figure 13 - Quality filter mapping applied to automotive supply chain (Hines & Rich 1997, p. 55).
2.6.5 Demand amplification mapping
Demand amplification is mapping the supplies and demands of particular products. Supply is a
relatively constant flow while demand can fluctuate wildly. This means that while supply may
meet demand on average there will still be a number of occurrences where demand will be
much greater. This tool can be used to determine the impact of consumers on suppliers at
different levels further up the supply chain.
2.6.6 Decision point analysis
Decision point analysis is a tool used to analyse supply chains exhibiting both push and pull
philosophies. The method relies on determining the decision point of a supply chain. This point
is where the supply chain changes from a demand driven pull system to a forecast-driven push
system. In construction this point often occurs between the suppliers and contractor where
the suppliers only replenish stocks when depleted and contractors purchase based on future
works. This is one of the reasons suppliers often need to keep large inventories to meet the
wild fluctuations of the construction industry. Determining the decision point is critical to
understanding how supply chains react to changes. This understanding can be used for
Page 35
21 | P a g e E N G 4 1 1 2
suppliers to better plan inventories and for contractors to form better relationships with
suppliers.
2.6.7 Physical structure mapping
This method allows us to see an overview of supply chains from at an industry level. To do this
we need to map the relationships between the interconnected suppliers, producers and
consumers at an industry level. This method can be used to map either the costs incurred or
volumes produced at each point within the supply chain. Figure 14 - Physical structure map of
an automotive industry example (Hines & Rich 1997, p. 58) demonstrates these two maps with
the number of firms involved in each production tier on the left and the map of costs involved
on the right. The cost adding map areas are determined by the value adding processes. This is
yet another way to represent the value adding process. In a manufacturing environment the
assembler is situated in the middle of the diagram being fed by various tiers of suppliers. In a
construction model the site production will be set in the middle of the map. This Is potentially
a very useful tool for analysing waste within the supply chain as we are able to see a physical
representation of where excessive costs are being incurred. These costs at this point can then
further be investigated to reveal the wastes causing this.
Figure 14 - Physical structure map of an automotive industry example (Hines & Rich 1997, p. 58)
Figure 14 provides a decision support tool which measures the correlation and between each
of the chosen wastes and the proposed method of mapping. To determine the best mapping
tool for a specific waste the waste is first selected in the table and following the row across the
column or mapping tool with a ‘H’ denoting high correlation is selected. For example if we
need to map the unnecessary motion waste in a system using the table the tool with highest
correlation is process activity mapping. This array of tools can be used to map waste
Page 36
22 | P a g e E N G 4 1 1 2
throughout the production process. The most difficult task is to decide which tools are
applicable to measure which types of waste.
Figure 15 - Decision support tool used based of correlations between tools and wastes. (Hines & Rich 1997, p. 50)
The article provides a framework for the implementation of a value stream analysis tool
(VALSAT). This framework uses the following procedure:
1. Identify value stream
2. Identify wastes present in particular value stream
3. List wastes in A and tools in B with correlation matrix in C
4. Identify a benchmark company for each waste
5. Weightings applied to wastes and overall structure
6. Add up total weightings for each tool
This process is undertaken by filling out the table in Figure 16. The process is best completed
by the managers involved in the particular value stream as these are the people most effective
at producing change in that area. The total weightings for each tool are then used to
determine which tool is deemed most effective in identify waste most important to the
particular value stream. The reason a benchmark company is listed is to determine what
competitors are best at reducing that particular waste and what the company undertaking the
process can learn from this. This is also a point to measure the company’s performance off,
thus creating a benchmark. (Hines & Rich 1997, pp. 59-61)
Page 37
23 | P a g e E N G 4 1 1 2
1
0.5
0.4
0.5
0.8
1
1
Figure 16 - Layout for application of VALSAT to determine effectiveness of waste identification tools. (Hines &
Rich 1997, p. 60)
2.6.8 Commitment Reliability as a measure of waste
Commitment reliability is the level of dependability that a contractor executes the works
specified in the contract according to construction program. Commitment reliability can also
be understood as the commitment of the contractor to undertake these works in a way that
meets all the requirements of quality assurance according to the project specifications.
(Sharma 2013, p. 1)
Sharma provides the following example for the measurement of the Commitment reliability of
specific tasks within a project plan:
Page 38
24 | P a g e E N G 4 1 1 2
Figure 17 - Expected vs actual progress of tasks within a project plan.(Sharma 2013, p. 25)
The above figure illustrates the actual progress (green) as a percentage of the planned
progress (grey) during a progress report. The commitment reliability can be measured as a
percentage by Actual progress/Planned progress:
Figure 18 - Commitment Reliability calculation for tasks represented in the above schedule. (Sharma 2013, p. 25)
Commitment reliability is a useful measurement in any project and could potentially be used
as a Key Performance Indicator (KPI) when reporting on waste. This possibility will be explored
further in the report structure section of this report.
Once the commitment reliability has been established the next step is to increase this
reliability. One method proven to achieve this is the Last Planner system.
Page 39
25 | P a g e E N G 4 1 1 2
2.6.9 Activity Sampling as an estimate of waste
The most convenient measure of waste is to estimate the efficiencies of individual work
processes on site. This simple method to detect productivity problems is known as Activity
Sampling. This method involves recording the total number of workers or machines working in
a particular area. Then the number of the workforce working is recorded at timed intervals
over a period of time such as a day. (Abeysekera 2009a, p. 2)
Figure 19 - Activity sample example demonstrating collected data and calculations.
In this example we can see that 36% are not working on average. This means there is room for
improvement and that this activity should be further analysed to determine causes and
potential solutions. (Abeysekera 2009, p. 2)
To better understand the accuracy of this data we need to determine the % confidence of this
data and potentially the amount of samples we need to achieve our desired level of
confidence. This data can also be represented graphically in the form of a distribution. If
enough data is collected the graph should resemble a normal distribution as shown in the
following figure. The following process is used to calculate the confidence level of a particular
set of data collected:
Sample size = 10
Average result = 7.7
Range = 0-12
Proportion (p) = 7.7/12 = 64%
Time Interval No. working Total workers 12
6:00 AM 8
7:00 AM 6 Average/total
8:00 AM 8 7.7 / 12 = 0.641667
9:00 AM 9
10:00 AM 5 Percentage Efficiency
11:00 AM 3 64.17%
12:00 PM 11
1:00 PM 12
2:00 PM 8
3:00 PM 7
Average 7.7
Page 40
26 | P a g e E N G 4 1 1 2
The following method is used to calculate the number of samples required to achieve the
required level of confidence:
The standard error (SE) can be calculated from the following equation:
( ) √
√
Using a confidence level of 95% the critical value (z*) = 1.960
0.5 ± 1.960 x 0.048
0.5 ± 0.09408
The 95% confidence limit is from 0.40592 to 0.59408. Therefore, we are 95% confident that
between 40% and 60% of the labour was utilised over the time period.
Similarly this equation can be rearranged to determine the number of samples required to
satisfy a pre-determined confidence level:
Therefore by taking 196 samples the proportion of unproductive work can be determined
within 5% accuracy. Similarly completing the same calculation for 90% confidence only 49
sample would need to be taken.
Figure 20 - Normal distribution demonstrating the range of data within a confidence level of 95%.
Page 41
27 | P a g e E N G 4 1 1 2
2.6.10 Multiple Activity Chart (MAC)
Once an Activity Sampling study has been conducted the data can be further analysed with a
Multiple activity chart to provide an optimum solution. The chart shows the interconnected
movements of people and plant against a common timeframe. This allows us to better
understand the process and potentially rearrange it in such a way as to increase the output or
decrease the cycle time without any additional inputs. (Abeysekera 2009b, p. 262)
To build this chart an array of data must first be collected. The construction process must be
broken up into repetitive cycles which can be analysed as discrete process. Within these
processes the activities are then listed in order and depending on any overlaps or
interdependencies. Once this cycle is defined the times required for each activity are used to
plot them on the common time scale. An example of this process applied to a concreting
operation is demonstrated in the following figure.
Figure 21 - Multiple activity chart of a concreting operation transporting concrete using 3 wheelbarrows and a
hoist. (Abeysekera 2009b, p. 263)
B1, B2 and B3 denote the actions of the three wheelbarrows while the U and D arrows indicate
the movement of the hoist lifting the barrows up and down. The movements of the hoists and
the emptying and filling of the wheelbarrows is rearranged to produce the following chart.
(Abeysekera 2009b, p. 262)
Page 42
28 | P a g e E N G 4 1 1 2
Figure 22 - Optimised version of the original Multiple Activity chart where all three wheelbarrows are used and
empty barrows are sent down straight after filled barrow is unloaded. (Abeysekera 2009b, p. 265)
The rearranged chart has increased the output of the concreting by 150% by reducing the cycle
time and therefore increasing the amount of concrete moved in the same amount of time.
(Abeysekera 2009b, p. 265) This example shows how a MAC can optimise a process by
enabling the used to visually rearrange activities to achieve an optimum outcome without the
need for trials.
Page 43
29 | P a g e E N G 4 1 1 2
2.7 Classification of Construction Waste
2.7.1 European Waste List (EWL)
The European Waste List (EWL) has proposed a waste classification based around a structure
of three construction processes. These broadly classify construction and demolition waste into;
packaging, remains and soil. Packaging of the materials and products supplied to the works
includes materials such as cardboard, plastic and metal containers and wooden pallets.
Remains includes any left-over building materials such as concrete, ceramics or wood. Soil
includes any material left over from excavations and not used as fill. (Llatas 2011, p. 1266)
The early stages of work include clearing and setting up the site and excavations. This involves
enclosing the worksite and providing basic infrastructure, access and facilities. Most of the
waste generated from this stage consists of unsuitable soil from clearing and initial
excavations. (Llatas 2011, p. 1266)
The second stage is the reception and storage of materials. Much of the waste from procuring
materials consists of; packaging, incorrect purchases, substandard quality, damage during
transport and the transport time itself. Lack of space and poor storage conditions are often
reasons for damage occurring on site. (Llatas 2011, p. 1266)
The third and largest stage is the execution of construction activities. This stage can produce a
large variety of wastes depending on the activities being undertaken. Common wastes are:
Soil from excavation
Excess components and building materials
Remains of temporary elements
Breakages and losses
Defects
(Llatas 2011, p. 1266)
Llatas proposes a model to quantify the waste produced on construction and demolition sites.
This uses the basic principle of measuring materials inputs and applying relevant equations and
factors producing a theoretical output of waste. These basic tools used in this model has been
shown graphically in Figure 15 with the supplied materials as the input on the left and waste
generated as the output on the right. To achieve this theoretical output the input is multiplied
by the corresponding factors listed in between.
Page 44
30 | P a g e E N G 4 1 1 2
Figure 15 - Tools used to implement the model. (Llatas 2011, p. 1266)p1266
The model consists of three steps:
1. Identification of elements of the construction process
2. Categorise waste according to EWL list
3. Application of analytical equations to estimate waste
(Llatas 2011, p. 1265)
The identification of elements involves systematically defining the structure of the project to
determine all the components and materials that are needed to produce each element. The
analytical expressions combine the waste type, amount and a number of factors to estimate
the waste into three equations depending on the three categorisations of waste. The general
expression for packaging is given in Equation 1. (Llatas 2011, p. 1267)
Equation 1 - Analytical estimation of waste. (Llatas 2011, p. 1267)
CWPi - expected construction waste amount for waste EWL.
P - represents packaging waste
k - type of packaging waste
Qi amount of the building element I inputted into the system
Fp - packaging waste factor
Fc – conversion factor
Fi – increase in volume factor
Page 45
31 | P a g e E N G 4 1 1 2
The packaging waste factor transforms the amount of building material into the amount of
waste based on how the material is packaged. This information can be obtained from the
supplier and consists of a volume or weight ratio of the material to packaging. Fc is the
conversion factor for the units of measurement for materials and their waste. Fi accounts for
the increase in volume for some types of waste known as the ‘sponge effect’. This can be due
to the increase in volume of some materials due to how it is stored or collected, however, this
is not needed if the mass of materials is used. The following diagram shows the input material
types typically required by construction projects on the left. On the right is a selection of the
common types of materials wastes generated from these input materials. These materials will
either end up in landfill of incinerated or taken to a secondary market for re-use and recycling.
Figure 23 - Representation of material inputs and waste outputs for a construction site. (Llatas 2011, p. 1274)
There are a number of limitations of this classification. This method only considers types of
material waste neglecting other types such as time. However, it would be difficult to
implement this method for waste time. This classification relies on the European Waste List
database and this would need to be adjusted for the Australian construction industry. (Llatas
2011, p. 1275)
The model is very usefull for the intended purpose of classifying material wastes which is but
one facet of waste that is considered in lean construction. This method is relevant for the
Page 46
32 | P a g e E N G 4 1 1 2
current view of waste management but if a comprehensive view of waste is adopted a more
comprehensive view of classification will need to be adopted.
2.7.2 Lean Construction
One of the original lean construction methodologies is the concept of JIT delivery. This means
the materials needed are brought to site and installed immediately; negating the need for
storage or double-handling. This is an example of a ‘pull’ method where materials are ordered
and manufactured as needed. The opposite of this is the more commonly used ‘push’ system
which involves ordering anticipated materials based on forecasting. The problem with this
method is often exact amounts are not known in advance and more is ordered than needed to
compensate for uncertainties. The pull system eliminated this overproduction by only
replenishing material. However, for the pull system to work efficiently leads times need to be
reduced and an effective mechanism to notify the upstream producer needs to be
implemented. Concrete supplied from batch plants is an example of a pull system. As ready-
mix concrete cannot be stockpiled on site it must be delivered to site as needed and is placed
immediately. This is a process which requires a high level of cooperation and interdependence
between the supplier and contractor. (Tommelein & Li 1999)
Often attempts at JIT delivery by reducing inventories have just pushed these inventories back
to suppliers which need to hold an even greater inventory to supply construction needs –
increasing ‘total’ supply chain costs. According to Russell (2009) this is a very narrow-minded
approach which does not consider the entire supply chain as a system. (Russell 2009, p713)
Abeysekera suggests the following steps should be considered when increasing flow in
activities:
Improving constructability by simplifying the number of steps
Reduction of variability in number of parts in sizes
Flexibility to substitute materials and source subcontractors at short notice
Process transparency and planning
(Abeysekera et al, 2009)
Koskela presents the following principles for improvement of flow:
Reduction in variability
Compression of cycle times
Simplification
Page 47
33 | P a g e E N G 4 1 1 2
The article then continues on suggest flexibility, transparency and the need for constant
improvement not unlike that of (Abeysekera et al, 2009)(Koskela 1997).
Abeysekera provides an overview of the traditionally implemented improvements for
increasing productivities:
Technology such as pre-stressed and pre-cast concrete
Plant and equipment (excavators, cranes)
Automation and factory production
Innovation of products and processes
Scale economies (mass production and learning curve effects)
Modularisation and type-plans for residential housing developments
Specialisation using subcontractors and outsourcing.
(Abeysekera et al, 2009; Hennayake and Ponnampalam,1982)
All these methods for increasing flow and efficiency has been proven to work in today’s
construction industry. However,
2.7.3 4D construction site management
For large structural concrete operations cranes are often used to move formwork and other
materials into location. With the increased size and capacity if modern cranes this is now far
more efficient and greater access to locations is available. Lin writes about planning
construction activities using these large semi-stationary equipment. Due to the size of this
equipment it is desired to minimise movements which requires planning on behalf of the
engineer. (Lin & Haas 1996)
Figure 24 - Optimisation of movements of concrete pumps.(Lin & Haas 1996, p. 220)
Page 48
34 | P a g e E N G 4 1 1 2
Planning concrete pours such as the one pictured above requires rigorous planning of
positioning of equipment in conjunction with how much equipment needed to achieve your
desired productivity. The pump movements must be timed with productivities and what area
of the slab can be reached from each position. The productivities of the concreting crews must
be equivalent to the planned rate of concrete delivery and how many concrete trucks are
available to service the pour. If this is not the case waste will be generated. If the productivity
of the crew is greater than the supply they will be waiting and inactive therefore increasing the
total time required for the same amount of production. On the other hand if delivery times are
too close and trucks will be waiting also increasing the likelihood of sending trucks away.
Lin describes the benefits of using an interactive computerised planning process to better
illustrate and evaluate these complex activities. This method allows the planned to visualise
the process before it is implemented and to test alternative plans before commencement. This
technology is not only very useful for the planners but can potentially save large amounts of
time and resources on-site. Lin states, “Planning is typically the responsibility of a small pool of
experts whose knowledge is largely undocumented.” (Lin & Haas 1996) An added benefit of
this system is a detailed record of the planning process can then be kept for future record. This
can help planners to both better understand any problems that occur and provide learnings for
further similar operations.
One area currently being researched is 4D visualisation of construction site management.
There are a number of systems being developed for this purpose such as Integrated Site
Planning System (4D-ISPS) and Construction Site Management System (CSMS). 4D modelling
involves the combination of the planning schedule into a 3D model of the worksite. Adding
time allows the planner to visually analyse the workflow of the project using a graphical
simulation to better locate and understand potential problems therefore avoiding waste This
can be created by programs such as AutoCAD which is generally already completed in the
design stage of the project. This allows the construction and movement of 3D elements to be
directly linked to the time schedule of the project. (Ma, Shen & Zhang 2005; Zhang, Ma & Pu
2001)
This 4D model can be further expanded into a 5D model with the added dimension of cost.
Incorporating this into the model allows the instant generation of costs at any point in time
over the project. The core concept of this modelling is Building Information Model or BIM
which manages both the information and the graphical model. BIM can be used to model the
entire life cycle of a structure as well as the construction phase and can incorporate other
Page 49
35 | P a g e E N G 4 1 1 2
dimensions such as sustainability and energy-savings. (Popov et al. 2010, pp. 359,60)
(Kamardeen 2010, p. 285)
This BIM model allows planners to more easily optimise and predict the performance of
construction projects before starting. This concept is very applicable for construction of
buildings and other complicated structures where accurate 3D drafting and modelling would
have already taken place. This would be somewhat more difficult for some civil projects where
2D plans are used as some volumes and materials cannot be calculated from the model.
(Kamardeen 2010, p. 285) Another issue in some circumstances is that these plans would need
to more accurately portray the actual activities taking place. For many of these projects a 2D
staging approach may still be more efficient.
Theoretically an infinite number of dimensions can be added to this model and some literature
describes models with up to 8 dimensions. These dimensions can be aspects such as; facilities
management, sustainability, safety and potentially waste. (Kamardeen 2010, p. 285)
This model can be used to better plan and track waste generation leading to more accurate
problem diagnosis when reducing waste. This would also help in creating more realistic plans
to increase commitment reliability, a concept which will be introduced in the next section. The
possibility of incorporating waste into this model is outside the current scope for this research
but is potential direction for further research.
2.7.5 Last Planner System for concreting operations (LPS)
Due to the ever increasing size and complexity of construction projects the need to plan
effectively is continually growing in importance. Due to this resulting increase in complexity of
planning a hierarchical system has been developed to delegate various levels of planning to
different groups. The top level of planning deals with the global constraints of the project and
Figure 25 - Building Information Model representing a real construction operation. (Popov et al. 2010, pp. 364,5)
Page 50
36 | P a g e E N G 4 1 1 2
the overall inputs and outputs. This provides an outline for the subsequent layers of planning
from project staging right down to weekly plans of site activities. (Ballard 2000, pp. 3-1)
The aim of the LPS is increasing reliability of planning and the stabilisation of production-level
workflow. The LPS uses concepts of “front-end planning”,” lookahead planning” and
“commitment planning” are utilised for various levels of planning required by different levels
of the hierarchy. From this master schedule, lookahead and a weekly work schedule are
created. According to Choo the purpose of a master schedule is to show what can feasibly be
completed in the allotted time and what lead times are required. A lookahead provides an
overview of all the activities in the best sequence with all the required resources. The weekly
schedule is work that is currently available and what work needs to be done to satisfy the
lookahead plan. (Choo 2003, pp. 37-41)
Figure 26- Last Planner System flowchart. (Choo 2003, p. 40)
The LPS implements production control into the traditional systems of project management.
The last planning process looks at what should be done and rationalises this into what can be
done. This then creates an inventory of work from which what will be done can be planned.
(Ballard 2000, pp. 3-14)
The LPS has two components; production unit control and work flow control. Production
controls work within the production units and work flow controls work flow between
production units. Production unit control is measured directly by the output quality of the
work being performed for each given assignment. To achieve high outputs the provided
assignments must be well defined. The right sequence and amount of work for the assignment
Page 51
37 | P a g e E N G 4 1 1 2
must also be selected. The final criteria for planning assignments is that the work selected can
be done, meaning the appropriate resources are available and prerequisite work has been
completed. Work flow control ensures that this work flows through these production units in
the appropriate sequence and rate. (Ballard 2000, pp. 3-2 - 3-5)
Figure 27 - The Last Planer System in terms of should, can, will and do. (Ballard 2000, pp. 3-15)
The research conducted by Ballard shows that the LPS can be used to achieve 90% reliability of
planning on site. This reliability and increased ability to plan has profound effects for the
productivities of construction sites. This in turn can reduce waste generation across all
categories. (Ballard 2000, pp. 10-, -1)
Page 52
38 | P a g e E N G 4 1 1 2
2.7.6 Classification of waste by source
Two methods of source-based classification will be defined:
Types of waste (time, materials, information)
Materials, plant, people
The first source-based method involves grouping types of waste into the three categories of
time, material and information. This results in the following example lists:
Table 3 - Classifications of example wastes into materials, time and information.
Type of waste
Materials
Processing waste
Overproduction (offcuts, excess etc.)
Lack of materials control and waste
management plan
Unnecessary inventory
Time
Accidents
Weather
Defects
Waiting/idle time
Ineffective work
Transporting
Unnecessary motion
Information
Making-do
Lack of communication
Request for information (RFI's)
Design errors/changes
Constructability concerns
Another potential classification of waste is by attributing them to their sources being; people,
plant and materials. This approach simplifies classification by using easily identifiable sources
increasing usability on site.
Page 53
39 | P a g e E N G 4 1 1 2
2.7.7 Classification of waste by processes
Classification by process is determining the total waste attributed to each of the defined
activities in either the construction project or a defined process within the project.
The first method is process based where waste can be classified according to the different
processes involved in completing the task. For the example of concreting these processes
include; planning, formwork, reinforcement assembly, pouring, removing formwork and any
resulting defects or required re-work. Wastes can then be classified according to the process in
which they occur. For example waste time may occur across all processes whereas waste
material such as reinforcement will only occur in reinforcement assembly.
The second is taken from Serpell’s “Characterisation of waste in building construction projects”
and categorises waste into different stages of the construction process. These categories are
broadly classified as:
Design
Procurement,
Materials handling
Operational
Residual and
Other
Where residual is material waste such as offcuts and excess and other includes theft, damage
and lack of material control plans. Waste time is further broken down to categories of work
inactivity and ineffective work. Work inactivity includes waiting, travelling, resting and any
other time when work has ceased. Whereas ineffective work focuses on efficiency of working
time as well as re-work and having to invent new ways to complete work. (Serpell, Venturi &
Contreras 1995)
Page 54
40 | P a g e E N G 4 1 1 2
2.7.8 Management classification of waste
This approach classifies waste according to the management structure responsible for that
process. The three management structures are production management, project management
and business management. These classifications represent the major facets of any
construction company. This approach is very useful as it directly implies the responsibility and
that responsible for the occurrence of each type of waste detected.
Management Classification
Production
management
Project
management
Business
management
Processing waste Requests for
information (RFI’s)
Inventory
Waiting/idle time Design errors Unnecessary motion
Transporting Constructability
concerns
Making-do Error in contract
documents
Lack of
communication
Figure 28 - Classification of wastes according to management structures.
Page 55
41 | P a g e E N G 4 1 1 2
2.7.9 PESTLE classification of waste
The PESTLE framework is an acronym for political, economic, social, technological, legal and
environment. This classification system originates as a strategic management plan for
companies when analysing the impacts of decisions and policies. Typical wastes can be
attributed to the different areas as follows:
Figure 29 - PESTLE framework for classification of wastes according to their specific impacts. (Abeysekera, 2014)
2.7.10 Project management classification of waste
The following classification originates from typical Key Performance Indicators (KPI’s) used in
reporting construction projects. The University of Oxford defines a number of KPI’s based on
the specific areas of a project being; client satisfaction, environmental, finance, personnel and
process. (Oxford 2013, p. 2) Ngoc gives a number of example KPI’s including; time, issues,
quality, resources and costs. (Ngoc 2014, pp. 5-6) From these examples a number of
KPI’s can be developed to measure the performance of a project in relation to waste
generation:
Figure 30 - Classification of wastes according to common project management KPI's. (Abeysekera, 2014)
Political Economic Social Technological Legal Environment
Requests for
information (RFI’s)
Processing
waste
Lack of
communication
Transporting Error in contract
documents
Contaminated
materials
Design changes Transporting Poor weather
Design and
detailing errors
Waiting/idle
time
Making-do
Inventory
Time Cost Quality Safety Environment Etc
Waiting/idle
time
Constructability
concerns
Processing
waste
Unnecessary
motion
Contaminated
materials
Criminal waste
Transporting Inventory Making-do Poor weather
Lack of
communication
Design and
detailing errors
Design errors Accidents
Requests for
information
(RFI’s)
Design changes Equipment
malfunction
Page 56
42 | P a g e E N G 4 1 1 2
2.7.11 Value adding classification of waste
This classification groups all processes into the categories of; value adding, non-value adding
and non-value adding but necessary. Both subgroups of non-value adding and necessary but
non-value adding are considered wasteful. Non-value adding or ‘pure waste’ includes
processes such as unnecessary movement, storage between processes and waiting times.
Necessary but non-value adding process, such as transportation and unpacking materials, are
those which add no value but are required in the current operational environment. These can
only be eliminated with major changes to the operating system.
Hines goes on to state that there are seven categories of waste; overproduction, waiting,
transport, inappropriate processing, unnecessary inventory, unnecessary motion and defects.
All of these can be categorised into these to subgroups depending on the operation. (Hines &
Rich 1997) Russell lists the same categories with the addition of talent, which is underutilising
potential skills and knowledge of employees. (Russell 2009)
This concept presents us with a method of classifying processes depending on their value and
necessity. It further provides 7 categories of waste which fall under the classifications of non-
vale adding and non-value adding but necessary.
Page 57
43 | P a g e E N G 4 1 1 2
2.8 Concrete construction
2.8.1 Technology
Over the past few decades the use of new technologies has led to vast improvements in speed
and productivity of concrete construction. In recent years there has been an explosion in the
variety of concrete mixes and applications. These mixes cater to everything from freezing
temperatures to reducing carbon emissions. New technologies for placement using machines
have meant that concrete can be placed in more locations and in larger quantities without
human error. The use of concrete pumps is now commonplace for pours ranging from small
hard to get to locations to pours for monolithic structures involving hundreds of cubic meters.
Another common technology is slip form pavers which utilise a mobile formwork to move
along the concrete pour continually placing, compacting and finishing the concrete. This
technology has an array of applications ranging from construction of high-rise cores to
pavements and traffic barriers. However, these are expensive machines and are only cost
effective for large volume concrete pours. (Zayed, 2008 p1).
2.8.2 Current methodologies
Concrete has many applications for construction, including: buildings, roads, bridges and
drainage structures. These are all constructed in different ways, but for most the actual
process of concreting stays the same. Concrete pumps are now used for most operations with
the exception of small easily accessible locations or tall buildings where a crane and bucket
may be employed. Although pumps are costly they are still much more efficient than
traditional methods of carting concrete by hand. This allows the pour to be completed more
quickly and with less labour needed. This is quite important in Australia where labour costs
are quite high compared to material costs. Pumps also allow us to pour in locations previously
inaccessible meaning less time and material needs to be spent on creating an access to the
pour location. (Dunlop & Smith 2003, p. 274)
2.8.3 Current Reporting Structures
This section will analyze a number of reporting structures used by construction companies. The
first report to be analyzed is a Construction Waste and Spoil Management Plan from Aurizon.
Aurizon – Construction Waste and Spoil Management Plan.
This document is developed at the beginning of the project to outline the expectations and
monitoring required to fulfill the waste management obligations. The report structure is as
follows:
Page 58
44 | P a g e E N G 4 1 1 2
1. Purpose
2. Construction Waste Generation
3. Classification of waste streams
4. Construction Demobilization
5. Environmental Impacts and Controls
6. Environmental monitoring and reporting
(Aurizon 2014)
The purpose provides a summary of the contents of the report, including; waste identification,
waste handling, storage and disposal, spoil management and sewerage and wastewater
treatment. This section also includes a schedule of the construction activities and a risk
assessment for sewerage and wastewater. (Aurizon 2014, p. 7)
Construction waste generation includes both the strategy for waste reduction and the
potential sources of waste. These sources are categorized by construction activity such as
earthworks or road construction. These activities are then further broken down into the
specific waste types such as asphalt, concrete, steel or timber. Materials were the only type of
waste considered in this report which focused on waste from an environmental perspective.
(Aurizon 2014, p. 7)
Construction demobilization and environmental impacts and controls are planning sections
outlining responsibilities and procedures at different stages in the project. Waste monitoring
and reporting is a very useful section outlining all the expectations of the company. Waste
monitoring outlines how waste will be tracked including:
Date and time of Departure
Classification
Amount
Waste use (recycled/stored/treated/disposed)
Reference to track waste
(Aurizon 2014, p. 7)
Reporting covers what reviews will need to be undertaken over the life of the project. The
reviews will consider all changes in the project and any incidents or audit finding on the project
taking the form of a compliance report.
Page 59
45 | P a g e E N G 4 1 1 2
SKM – Construction waste management plan
This waste management report is produced as a sub plan for the Construction Environment
Management Plan. This defines waste management as a subset of environmental controls and
as a means of complying with legislation. Another way of defining waste management is as a
subset of production management and as a means of improving efficiencies. The report
structure is as follows:
1. Introduction
2. Legislative and regulatory compliance
3. Environmental aspects, impacts and risks
4. Environmental control measures and procedures
5. Training
6. Inspections, monitoring, auditing and reporting
7. Review and improvement of the CWMP
8. Waste management register
Section 3 includes plans for waste minimization and classification of waste. In this case the
classifications of waste are defined by the type of risk posed to the environment. Following
this there is a methodology for classifying wastes on site which is summarized by Figure 31-
Waste classification flowchart (Xstrata coal 2014)..
Xstrata coal – Project Waste Management
As with the other plans this focused on physical wastes purely from an environmental
management perspective. A similar structure is used as follows:
1. Regulatory framework
2. Methodology
3. Environmental values
4. Potential impacts and mitigation
5. Cumulative impacts
This plan focuses on defining and tracking the impacts of each specific waste and applying
specific management methods.(Xstrata coal 2014)
Page 60
46 | P a g e E N G 4 1 1 2
Figure 31- Waste classification flowchart (Xstrata coal 2014).
An interesting addition to this plan is the Review and Improvement of the plan. This is an
essential tool for ensuring the continued effectiveness of any plan. This included monthly,
quarterly and annual reviews on the adequacy of the plan on varying levels of detail. The
waste management register is included as a template for recording all the wastes and their
properties. (Xstrata coal 2014)
A number of useful ideas have been presented in this plan and can be integrated into a
productivities based waste management report. The waste reporting will need to be part of an
Page 61
47 | P a g e E N G 4 1 1 2
overall waste management plan which will outline how this report will be used. Including a
waste classification method into the plan will increase the usability of the reporting ensuring
the waste is classified correctly and increasing the reliably of the report. (Xstrata coal 2014)
Project Status Report Template
This is a template for summarizing an entire project by determining the status of a number of
key performance indicators. These being; scope, schedule, cost, risks and quality. The status of
each indicator is determined by the percentage variance from the plan with those with a large
variance highlighted red and the inclusion of an explanation why. The body of the report
follows the standard format of:
Work completed
Planned work
Open issues
Open risks
Deliverables and milestones
Key performance indicators
(Piscopo 2013)
These reports can be broken up into two categories of waste planning and waste reporting, of
which the latter we will be focused on. Most of the waste plans define waste management as a
subset of environmental controls and as a means of complying with legislation. For the
purpose of this research we want to define waste management as a subset of production
management. This directly relates waste to productivities and as means of increasing
efficiencies. The Reporting templates introduces the concept of Key Performance Indicators
(KPI’s). For projects these are important indicators such as cost and timeframe. However, it
would be useful to determine representative KPI’s for waste.
Page 62
48 | P a g e E N G 4 1 1 2
2.9 Summary of literature
Manufacturing has been a reference point and a source of innovations in construction for
many decades. Lean construction is now the major manufacturing practice used in western
countries.
Lean construction has been effectively implemented on construction projects in some
European countries such as Finland and England. There is a reasonable amount of literature
available regarding methodologies, outcomes and effects of this application. However, there is
still very little literature on this application within the Australian construction sector.
A number of types of waste have been identified through this review which can be
summarised into the three broad categories of transformation, flow and value. The TFV
approach represents construction as transformation, value generation and flow of materials or
resources. Each of these representations allows us to analyse construction activities in
different ways. The most important step is understanding what is of value to the customer and
their requirements and expectations. (Abeysekera 2009a, pp. 217-9)
Once this waste is identified it can be mapped by techniques derived from Value Stream
Mapping (VSM). This approach categorises all processes into three groups: value adding (VA),
necessary but non-value adding (NNVA) and non-value adding (NVA). (Hines & Rich 1997) This
allows us to determine the source and causes of waste identified as non-value adding by
categorising the processes within a specific construction activity. The critical path is mapped
according to these categories to identify these wastes. Once wastes are identified and
eliminated the new critical path is then mapped and any new wastes identified, continuing the
iterative process. By continually iterating the critical path value stream mapping can not only
be applied linearly but also to complex systems of processes often found in construction
projects. (Braglia, Carmignani & Zammori 2006)
Seven value stream mapping tools are then used to map the types of waste identified in the
value stream. The appropriate mapping tool is selected for each type of waste using a matrix
showing the correlation between each waste type and the mapping tools. (Hines & Rich 1997,
pp. 59-61)
The next step is the classification of waste into standard categories which can be easily
quantified and compared across different processes and construction projects. One method of
standardising this process is the European Waste List (EWL) which broadly classifies
construction waste into; packaging, remains and soil. The estimated waste for each category
can then be calculated by factoring the input quantity to predict the output quantity leftover.
Page 63
49 | P a g e E N G 4 1 1 2
This classification is specialised for European countries and include location specific data such
as average wastes and technology used. This is a system which could be used to standardise
measurement of waste in the Australian construction industry. (Llatas 2011, p. 1275)
Process optimisation and waste reduction can be aided using dimensional construction site
management. Additional dimensions such as time, cost and waste can be applied to 3D plans
of a construction site to better illustrate and plan a project. This is a complex process but one
which allows waste to be prevented through planning rather than dealt with after the
completion of the construction process. The Last planner System (LPS) is another method
which provides a framework for the detail of planning required at each level in the
construction hierarchy. This can be treated as the backbone for planning all elements of a
project including the expected and actual waste created in each process. (Kamardeen 2010, p.
285; Popov et al. 2010, pp. 359,60)
This identification, classification, quantification and planning approach needs to be
summarised into a form which can be used to evaluate the performance of a activity or
project. This performance analysis needs to be conducted in such a way that it is standardised
to both analyse projects over time and to compare different projects. Using a standardised
approach this performance comparison can then be further extended to broad performance
indicators for whole companies.
This process is not unlike the way in which other indicators such as environmental
performance of projects and companies is rated. By extending this process to waste both
contractors and clients can make better informed decisions tendering and selecting tenders for
projects.
From this literature I have decided upon the following as the most important indicators and
components which should be included in a monthly report to management:
Commitment Reliability
Overall percentage of waste
Non-value adding waste
Non-value but necessary waste
Broad classifications of waste
Origins of waste visual representation both within the schedule and on site
Expected (planned) vs actual waste (%)
Recommendations
Page 64
50 | P a g e E N G 4 1 1 2
Chapter 3
Method
3.1 Overview
For any company to function there needs to be a clear chain of communication from the
ground up. This requires a clearly defined management structure with the access to the
appropriate information necessary for decision-making at each management level. For this
information to be appropriate it needs to be both reliable and summarized to the necessary
level of detail. This information is usually conveyed in the form of structured reports detailing
the performance of a number of key characteristics of the project. This is written to inform the
next level of management who in turn then further streamline the necessary information to be
passed onto the next level of management. This reporting process continues all the way up the
management pyramid.
3.2 Methodology
This chapter will illustrate the chosen method to achieve the report objectives as stated in the
aim. These objectives include using lean construction techniques to measure and quantify
waste for concreting in construction. This will then be used to create a template for reporting
waste in traditional design, tender and construct projects. To achieve this the report has been
broken up into the following chapters:
Literature review
Questionnaire
Reporting structure
Case studies
Data collection & Results
Discussion and recommendations
Summary, conclusions & further work
3.2.1 Literature Review
The literature review provides an overview of the information available relevant to this
research project. This information has been collected for a large number of sources to provide
a representative picture of what is available and what gaps are present in the current
Page 65
51 | P a g e E N G 4 1 1 2
literature. This literature will be used as a knowledge base to analyze and build on for the rest
of the report.
This chapter will primarily focus on evaluation and selection of methods for classification of
waste from a lean construction perspective. These will be weighed up against specific criteria
to justify the selection. An analysis of the effectiveness and ease of implementation of selected
methods in the Australian construction industry will be conducted. This will be used to both
determine which methods to use and for what types of waste they will be most effective.
Utilizing this, a measurement technique and weighting scheme will be determined for each
classification and a relevant unit of measurement will be determined.
3.2.2 Questionnaire
This section will outline the method used to obtain feedback on the developed reporting
structures. Feedback is required to both determine the best structure and provide information
whether different structures may be better for different circumstances. Feedback has been
sought from a number of engineering companies working in the construction industry. These
companies can be classified according to their roles on construction projects. These roles range
from; owner, contract administrator, consultant and contractor. A questionnaire has been
provided to easily document and compare the feedback to determine the value of each report
structure.
3.2.3 Reporting structure
This section will develop a suitable report format based on the information collected in the
literature review. This will be heavily reliant on the development of a classification and
selection of Key Performance Indicators to measure waste.
3.2.4 Case studies
The methodology for waste reporting will be applied to the construction of the Wellcamp
Airport. The particular processes studied will be taken for the construction of concrete
pavements. This will include mapping the processes and identifying and classifying wastes
present and summarizing the results in the proposed report format.
3.2.5 Data collection & Results
The construction processes in the chosen case studies will be analysed according to the Key
Performance Indicators. Each of these KPI’s have methods of measurement which involve the
collection of different types of data about different facets of the project. Once this data is
collected and analysed the resulting KPI’s will be calculated.
Page 66
52 | P a g e E N G 4 1 1 2
3.2.6 Discussion and Recommendations
This section will provide an opportunity to discuss the effectiveness of the chosen
methodology and the value of the results received by implementing the chosen structure.
3.2.6 Summary, Conclusions and Further work
The level of achievement of the project aim and objectives will be discussed and which of
these achieved the expected outcomes. Based on the findings from this report future
directions for research will be presented.
Page 67
53 | P a g e E N G 4 1 1 2
Chapter 4
Reporting Structure
4.1 Introduction
Project reports will ideally contain all the important statistics for management to make
decisions about the health of a particular project. For this reports need to highlight any major
issues while still providing a representative picture of the situation.
To ensure this is the case a questionnaire on waste reporting has been written to enable
industry feedback on the development of a structure. This questionnaire has been distributed
to a number of engineering professionals in the construction industry.
4.2 Development of reporting structure
This section will develop a number of potential waste reporting structures based on the
literature review. An important component of this report is the ability to effectively and
consistently classify the waste being reported.
4.2.1 Reporting in the Last Planner System
To establish how this waste reporting structure operates it is necessary to determine its place
in the overall construction plan. For every construction process there should be a preceding
planning process and a subsequent reporting process as shown in the following diagram. This
planning occurs in the three forms of master plan, lookahead and weekly schedule. In
respective order these determine the position of the process in the overall construction
project; when it is most likely to be completed and how it will be scheduled within the week
depending on other construction processes.
Figure 32 - Relationship between waste reporting, planning and the construction process itself.
Planning
•Master plan
•Lookahead
•Weekly work Schedule
Construction Process
Waste Reporting
•Waste management plan
•Monthly Report
•Weekly productivities
Page 68
54 | P a g e E N G 4 1 1 2
As planning is conducted in the three before mentioned stages the reporting is also most
effective if implemented in similar stages. Projects often have overarching waste management
plans which can be added to and treated as the overall plan by which the monthly waste
management plans can be measured against. The waste report being developed within this
report will be used as a method of calculating and tracking weekly productivities for use by site
engineers and junior management. This data can then be collated on a monthly basis for a
progress report to senior management. This report will involve a simplified version showing
only the KPI’s, their variance from expected wastage and the overall trend for each KPI.
The developed waste reporting structure will have to be used in conjunction with the Last
Planner System. This would enable a holistic approach to waste reduction by allowing an
approach where recommendations and changes resulting from the waste reports can be
incorporated back into planning. This process of continuous improvement is has been
modelled in Figure 33.
Figure 33 - Model of continuous improvement applied to waste reduction. (HARRIS 2006, p. 39)
Systems
•Lean construction
•Quality management
Last Planner System
•Planning Anlaysis & Production
•Management Processes
Introduction of improvements
Performace monitoring
•Activity Sampling
•KPI's
Reduced waste
•Raised productivity
Page 69
55 | P a g e E N G 4 1 1 2
4.2.1 Selection of Waste Classification
An extensive list of wastes has been listed in the literature review. To categorise these a
number of classifications have been reviewed and developed. This section will provide reasons
for a selection to be used as a basis of the reporting structure. The major classifications
developed in the literature review are as follows:
European Waste List (EWL)
Management structure
PESTLE
Project Management
Source
Process
The two major themes emerging from these classifications are classification according to the
type of waste and classification according to the people responsible.
The methods of classification presented in the literature review can be integrated together to
provide an overview of the types of waste present in any process. This method of classification
would use the following process:
1. What is the stage of the construction project?
(procurement, materials handling, operational etc)
2. What is the specific process being conducted?
(formwork, reinforcement assembly, pouring etc)
3. Is the waste – a material, due to a lack of information or take up time?
This process can be used as a tool for consistently reporting what types of waste are present
on site.
The biggest challenge is defining a waste classification which is easily defined into categories
encompassing elements which are integral to each and every construction process on site.
These also need to be easily defined and quantified at a site level to enable an efficient and
reliable flow of data. For this reason the final waste classification will need to be presented in
the form of performance indicators for the respective waste groups.
Other concepts introduced throughout the literature review can be used as performance
indicators. The concept of Supply Chain Management introduced the pull system which aims
for reduction and ultimate elimination of inventory. From this it can be gathered that the
Page 70
56 | P a g e E N G 4 1 1 2
inventory required on site is an important indicator of wastes present within the supply chain
and potentially the ordering processes of the companies involved.
Commitment reliability provides an overall indicator of the company’s ability to keep its
promises and meet deadlines. However, this indirectly gives us an indicator of whether the
company is being wasteful. It the project is behind and deadlines are not being met we can
assume that some wasteful process is to blame or at least much waste will be generated
during these delays.
4.2.2 KPI’s
The most integral part of any project reporting structure is the development of performance
indicators. Key performance indicators (KPI’s) are a measurement of performance of a
particular activity or endeavor. To develop a useful KPI it must satisfy three conditions. The
indicator must be an important contributor to the project making it ‘key to its success. The KPI
must be quantified or measured in some way. The KPI must give an indication of the present
and future performance of what is being measured. Each of these KPI’s will be measured by a
number of different methods discussed in the literature review. Some of the indicators will be
simply measure by the loss in production or the lost time due to the particular issue. (Ngoc
2014, pp. 5-6)
From the waste lists and classifications presented in the literature review five major KPI’s can
be synthesized:
1. Commitment Reliability
2. Transformation
3. Quality
4. Inventory
5. Design
4.2.2.1Commitment reliability
Commitment Reliability can be used as an overarching measure of waste for the project. This
indicator compares planned performance to actual performance to give % reliability.
Task Progress ____ days ____ days
Task 1
%
Task 2
%
Planned
Progress
Page 71
57 | P a g e E N G 4 1 1 2
Figure 34 - Example template for visually representing commitment reliability.
4.3.2.2 Transformation
Transformation or process waste includes wastes such as transportation, waiting and idle time
and the utilization of available resources. This wastage is measured by utilization in the form of
Random Activity Sampling (RAS). This method involves recording utilization results for the
specific process over the course of a day and averaging to calculate a final utilization %.
Figure 35 - Data tabulation for Random Activity Sampling of a process
A more detailed approach is used to calculate the process wastes in the form of a Flow Process
Chart. This breaks the process up into steps which are classified according to the type of
operation being performed and whether it is value-adding, non-value adding or non-value
adding but necessary. Data is then collected for each step including the machinery and crew
required, time taken and the distance travelled. This data is then collated to give an overall
waste % for the process.
Figure 36 - Template Flow Process Chart
If the process displays a high level of waste it can be further analyzed using a Multiple Activity
Chart (MAC). This is another form of process mapping which provides a visual representation
of the process. This makes it easy to identify wasted time and to determine a cycle time which
Random Activity Sample
Total labour:
Time Working
6:00 AM
7:00 AM
8:00 AM
9:00 AM
…
Efficiency %
Step Machine Crew VA NVN NVA
1
2
3
…
VA Value Added
NVN Non-value added but necessary NVA time / total time =
NVA Non-value added and unnecessary Waste
Flow Process ChartRequired Distance
(m)
Time
(min)
Cost
($/min) Symbol
Flow
Symbol
Operation
Transportation
Retention Storage
Delay
Inspection Volume inspection
Quality inspection
Step
Page 72
58 | P a g e E N G 4 1 1 2
we will aim to reduce. Once this cycle time is identified a critical path can be determined
identifying which activities need to be re-scheduled or moved.
Figure 37 - Example template for a Multiple Activity Chart.
4.2.2.3 Quality
Quality is a measurement of the time and resources taken up by activities such as inspections,
defects and work improvement notices. This is measured as the time taken by quality / total
process time as a percentage.
4.2.2.4 Inventory
Inventory waste which occurs when an unnecessary amount of material and products are on
site wasting space and increasing the possibility of damage before use. The waste Is calculated
by the amount of materials present on site divided by the actual amount of materials required
for that day or days being observed.
4.2.2.5 Design
Design waste is a result of poorly detailed or errors in plans which result in constructability
concerns. This includes section will analyze sources of waste such as requests for information,
design and detailing errors and the resulting constructability concerns.
4.2.3 Reporting structure
The following report template has been developed using the specified KPI’s. The most useful
correlating measurement techniques have been suggested as methods of measurement to
judge the performance of each KPI to the expected performance.
Minutes Utilisation
Element 1 …. %
Element 2 %
Element 3 %
Element 4 %
Average Total %
Cycle time = ____min
Ele
me
nts
of
op
era
tio
n305 10 15 20 25
Page 73
59 | P a g e E N G 4 1 1 2
Figure 38 - Waste reporting structure for quantification of Key Performance Indicators.
KPI Waste Method of measurement Unit Result
Commitment
reliability
Actual/Planned %
Transformation
(process waste)
Utilisation RAS, MAC %
Transport time FPC %
Quality Inspections Waste time/total time %
Defects No.
Inventory waste Material stock Daily need / total
materials
%
Design waste RFI No.
RAS Random Activity Sampling Improved
MAC Multiple Activity Chart No change
FPC Flow Process Chart Worse
Page 74
60 | P a g e E N G 4 1 1 2
4.3 Reporting Structures
For the purpose of this research reporting structures will be developed for weekly and monthly
timeframes. A weekly waste report template has been provided below and a more detailed
monthly report can be found in Appendix B.
Weekly Site Waste Report FOR
Construction Project
6/10/14 – 12/10/14
1 Progress Overview: (Progress of projects and current activities being conducted. Summary of current works and works
completed since previous report. Any major decisions or changes influencing waste generation.)
2 Key Performance Indicators:
Page 75
61 | P a g e E N G 4 1 1 2
3 Open Issues:
(Any newly discovered non-value adding processes and potential solutions.)
4 Closed Issues:
(Any issues raised in the last report and implemented solutions)
5 Photos:
(Annotated photographs illustrating issues, changes and initiatives implemented on site.)
6 Recommendations:
(Explanations for any changes in waste generation and any initiatives taken to remedy this. Comments of
KPI’s.)
7 Conclusions:
(Reiteration of major points and outputs from report.)
Appendix A – Random Activity Sampling (RAS)
Appendix B – Flow Process Chart (FPC)
Appendix C – Multiple Activity Chart (MAC)
Page 76
62 | P a g e E N G 4 1 1 2
Chapter 5
Case studies
5.1 Overview of Wellcamp Airport Construction Wellcamp Airport is situated 20 minutes west of Toowoomba and is currently being
constructed by a locally based company Wagners. This Airport is due for completion in
November this year with flights expecting to start on the 19th of the month. The airport
consists of a Terminal facility and a 3750m runway able to take aircraft up to a Boeing 747. In
addition to this there will be a number of buildings, taxiways and aprons to cater for the flow
of aircraft. The airport will be accessed from the Toowoomba – Cecil Plains Rd via a 4.3km dual
carriageway ring road which will also connect onto the future Toowoomba Bypass.
The construction of this facility can be broken up into; earthworks, building, pavements,
concreting and services. This chapter will present a number of case studies of these
construction processes with a focus on construction of concrete pavements.
As part of the runway construction a large area of high-strength concrete pavements are being
constructed. A concrete turning node will be built at the end of the runway to provide large
aircraft room to maneuver. This area is constructed from concrete to provide a surface that
has both an acceptable friction factor and a robust surface which can cope with the force
imposed by turning planes. Another concrete pavement will be laid in front of the terminal as
an apron for planes to park while boarding passengers.
Figure 39 - Layout of airport with the turning node pictured on the far left end of the runway and the apron
located in front of the terminal (Wagners Constructions).
TURNING NODE
Page 77
63 | P a g e E N G 4 1 1 2
These areas are being laid using a concrete paver and as a trial for the Wagners new
Environmentally Friendly Concrete (EFC). This concrete does not contain Portland cement and
instead uses blast furnace slag and fly ash to create a geopolymer binder. This mix gives the
concrete performance advantages and has been proven to reduce carbon emissions by 80-
90%. The pavements encompass an area of almost 54,000m2 and will use in excess of
23,000m3 of concrete.
Page 78
64 | P a g e E N G 4 1 1 2
5.2 Concrete paving
5.2.1 The Process
The concrete pavement is being constructed using a specially designed paving machine which
places, vibrates and screeds the concrete. The paving machine used was a GOMACO GP-4000
which has the ability to pave widths ranging from 3.66 to 15.24m wide. The paving process
involves a complicated cyclic process repeated each paving run. The turning node is divided up
into a number of straight runs 4.5m wide which allow the machine to pave up to 200m in a
straight line depending on the particular run. The Apron, however, is divided up into runs of
5m wide which allows paving of 80m runs with a current rate of 240m per day.
The paver uses string lines to give an offset from the pavement surface. Using this string line
the paver is able to self-level as it moves down the run keeping the concrete surface height
consistent with the design gradient.
The process is similar to other concreting operations with primary difference being the
automation of a number of processes usually performed by physical labor. As with any other
large concreting operation the process is supplied by 6 – 9 concrete trucks on turnaround from
the onsite batch plant. Having a batch plant on site reduces transport times enabling the use of
dump trucks instead of agitator trucks. This increases the supply efficiency as dump trucks can
be loaded quicker, can dump their load quicker and take less time to wash out. This time
saving multiplied by the average of 64 loads/day makes a huge difference the overall project
cost and schedule. The use of dump trucks is also made possible by the utilization of the paving
machine which only requires trucks to dump the concrete on the ground in front of the
machine.
This project is also the first to use a paving machine to build concrete pavements on an airport.
This coupled with the use of an experimental concrete provides a number of engineering
challenges both known and unknown. Prior to the commencement of this project a number of
test runs were undertaken on the Wagners hanger. This process has allowed the paving crew
to continually refine to process to what is now an efficient and viable process. Some of the
learnings which occurred as part of this process will be discussed in the next section.
Page 79
65 | P a g e E N G 4 1 1 2
The photographs below illustrate the steps involved:
Step 1 - Conducting scratch test before
concreting can commence.
Step 3 – Dump truck tipping concrete in front
of paver
Step 6 – Concrete is screened by paving
machine.
Step 5 – Paver pushes concrete forward
vibrating the concrete into place.
Step 2 – Setting up paver for run.
Step 4 – Full range of testing showing
compression cylinders and flexural beams.
Page 80
66 | P a g e E N G 4 1 1 2
Step 11 – Cleaning out sawcuts .
Step 7 – Concrete screened and broomed by
hand.
Step 8 – Concrete sprayed with curing
compounds.
Step 10 – Softcutting concrete surface to
induce cracking.
Step 9 – Completed concrete run.
Step 12 – Covering with geofabric to enable
curing in optimum conditions.
Page 81
67 | P a g e E N G 4 1 1 2
5.2.2 Waste KPI’s
The following sections will calculate the Key Performance Indicators for the concreting
process. From this the process can be evaluated both over time and against other processes to
determine the performance regarding waste.
Commitment Reliability
The commitment reliability of a project can be measured as a percentage by Actual
progress/Planned progress:
Figure 40 - Commitment reliability calculation of the paving of the turning node.
The turning node was planned to take 22 days, however, the program stretched out to 38
days. From this it can be calculated that the project completed 58% of the planned work within
the 22 days giving the project an overall commitment reliability of 58%.
Transformation waste
The utilisation levels of the operation were determined by Random Activity Sampling (RAS).
This sample was conducted over one hour during paving:
This sample gives a very low efficiency for the paving crew. However, in this case the efficiency
of the labour force is not necessarily representative of the output of the operation as the
paver is continuously moving forward finishing the concrete. To measure the efficiency of the
paver the length of stops within the same period can be measured.
Task Progress
Turning node
58%
22 days 16 days
Planned
Progress
Page 82
68 | P a g e E N G 4 1 1 2
Figure 41 - Example of RAS sampling taken over one day of paving.
The utilisation of the paving operation was measured on two different days using this method.
Over this period the paving crew had an overall efficiency of 54% while the paver itself had a
much higher efficiency of 71%. This is as expected as the efficiency of the process is
determined by the paver placing concrete while the crew is there to tend to the paver.
Figure 42 - Utilisation rates of the elements in the concreting process.
Total workers: 10
Total plant: 1
Time:
8:50 7 1
9:05 7 1
9:14 6 1
10:04 3 0
11:27 7 1
11:37 5 1
11:47 8 1
11:53 0 0
12:02 8 1
12:30 0 0
12:49 4 1
12:54 1 0
13:06 7 1
13:40 5 0
Average:
Average Utilisation:
Labour working: Plant working:
48.57% 64.29%
56.43%
Utilisation
Testing 45%
Truck 1 100%
Truck 2 93%
Truck 3 87%
Truck4 81%
Truck 5 71%
Truck 6 60%
Paver 66%
Paving crew 54%
Average 73%
Ele
me
nts
of
op
era
tio
n
Page 83
69 | P a g e E N G 4 1 1 2
Each utilisation is calculated from the start of the concrete pour. Note that the paver needs a
minimum of two trucks to tip before paving can begin in order to keep up production. There is
an average utilisation of 73% when the productivities of the pavement crew are incorporated
into the result.
So what does this mean for the efficiency of the crew? The crew efficiency is still relevant as
although it doesn’t directly correlate to the output it is tells us that the machine does not need
this many crew. The fact that there appears to be 2 too many crew shows that they are not
unproductive but do not have enough work. This is an interesting finding and could be further
investigated as a recommendation.
Transportation Waste
The best evaluation of the waste due to transportation is by using a Flow Process chart. This
enables processes to be classified into types of operation and whether or not they add value.
As the time taken for each process is recorded the total time wasted by transportation can be
calculated. This can be divided by the overall time to undertake the work activity to give the %
of time taken up by transportation.
Page 84
70 | P a g e E N G 4 1 1 2
Figure 43 - FPC for the concrete paving process running for a duration of three truck deliveries.
An interesting note is that there is no step for rejecting trucks based on slump tests. Slump is
considered an important indicator for the characteristics of concrete and must be within a
certain tolerance from the design slump. However, in this case EFC is still an experimental
product and has no proven correlation between strength and slump and therefore no guide
tolerance.
It is evident from the flow process chart that there is a high proportion of waste. In this case a
Multiple Activity Chart will be used to further map this process to determine possible solutions
for this wastage.
Page 85
71 | P a g e E N G 4 1 1 2
Uti
lisa
tio
n
Test
ing
Slu
mp
Slu
mp
Slu
mp
45%
Tru
ck 1
Tip
s /
tran
sit
Tip
s /
tran
sit
100%
Tru
ck 2
Tip
s /
tran
sit
Tip
s /
tran
sit
93%
Tru
ck 3
Tip
s /
tran
sit
Tip
s /
tran
sit
87%
Tru
ck4
Tip
s /
tran
sit
Tip
s /
tran
sit
81%
Tru
ck 5
Tip
s /
tran
sit
71%
Tru
ck 6
Tip
s /
tran
sit
60%
Pav
er
66%
Pav
ing
cre
w54
%
Ave
rage
73%
510
1520
25
Tru
ck b
atch
ed
Re
turn
to
pla
nt
Dri
ves
to s
ite
Was
he
s o
ut
30
Re
turn
to
pla
nt
Tru
ck b
atch
ed
Dri
ves
to s
ite
50
Was
he
s o
ut
Re
turn
to
pla
nt
85
Full
ran
ge o
f te
stin
g
Pav
ing
Pav
ing
7580
Tru
ck
bat
che
dD
rive
s to
sit
e
Was
he
s
ou
tR
etu
rn t
o p
lan
t
5560
6570
Was
he
s
ou
t
Was
he
s o
ut
Re
turn
to
pla
nt
Dri
ves
to s
ite
Tru
ck
bat
che
d
45
Tru
ck b
atch
ed
Dri
ves
to s
ite
3540
Tru
ck
bat
che
dD
rive
s to
sit
eW
ash
es
ou
tR
etu
rn t
o p
lan
t
Tru
ck
bat
che
dD
rive
s to
sit
eW
ash
es
ou
t
Tru
ck b
atch
ed
Was
he
s o
ut
Re
turn
to
pla
nt
Dri
ves
to s
ite
Tru
ck
bat
che
d
Tru
ck b
atch
ed
Dri
ves
to s
ite
Re
turn
to
pla
nt
Was
he
s o
ut
Re
turn
to
pla
nt
Dri
ves
to s
ite
Was
he
s
ou
tR
etu
rn t
o p
lan
t
Elements of operation
Cyc
le t
ime
= 2
7.5m
in
Uti
lisa
tio
n
Test
ing
Slu
mp
Slu
mp
Slu
mp
45%
Tru
ck 1
Tip
s /
tran
sit
Tip
s /
tran
sit
100%
Tru
ck 2
Tip
s /
tran
sit
Tip
s /
tran
sit
93%
Tru
ck 3
Tip
s /
tran
sit
Tip
s /
tran
sit
87%
Tru
ck4
Tip
s /
tran
sit
Tip
s /
tran
sit
81%
Tru
ck 5
Tip
s /
tran
sit
71%
Tru
ck 6
Tip
s /
tran
sit
60%
Pav
er
66%
Pav
ing
cre
w54
%
Ave
rage
73%
510
1520
25
Tru
ck b
atch
ed
Re
turn
to
pla
nt
Dri
ves
to s
ite
Was
he
s o
ut
30
Re
turn
to
pla
nt
Tru
ck b
atch
ed
Dri
ves
to s
ite
50
Was
he
s o
ut
Re
turn
to
pla
nt
85
Full
ran
ge o
f te
stin
g
Pav
ing
Pav
ing
7580
Tru
ck
bat
che
dD
rive
s to
sit
e
Was
he
s
ou
tR
etu
rn t
o p
lan
t
5560
6570
Was
he
s
ou
t
Was
he
s o
ut
Re
turn
to
pla
nt
Dri
ves
to s
ite
Tru
ck
bat
che
d
45
Tru
ck b
atch
ed
Dri
ves
to s
ite
3540
Tru
ck
bat
che
dD
rive
s to
sit
eW
ash
es
ou
tR
etu
rn t
o p
lan
t
Tru
ck
bat
che
dD
rive
s to
sit
eW
ash
es
ou
t
Tru
ck b
atch
ed
Was
he
s o
ut
Re
turn
to
pla
nt
Dri
ves
to s
ite
Tru
ck
bat
che
d
Tru
ck b
atch
ed
Dri
ves
to s
ite
Re
turn
to
pla
nt
Was
he
s o
ut
Re
turn
to
pla
nt
Dri
ves
to s
ite
Was
he
s
ou
tR
etu
rn t
o p
lan
tElements of operation
Cyc
le t
ime
= 2
7.5m
in
Figu
re 4
4 -
Mu
ltip
le A
ctiv
ity
Ch
art
(MA
C)
for
con
cre
te p
avin
g u
tilis
ing
a 6
tru
ck t
urn
aro
un
d.
Page 86
72 | P a g e E N G 4 1 1 2
A multiple activity chart of the concrete paving process is another method of determining
utilisation as well as a visual representation of the processes involved. This enables the cycle
time to be determined which for this example is 35 minutes. It is clear that this cycle is
determined by the trucks and their batching and turnaround time. An interesting feature of
this concreting process is the use of dump trucks to transport concrete. This enables quicker
batching, tipping and washout times, therefore reducing the cycle time.
Quality
There are a number of tests and inspections required before, during and after concrete
placement. Inspections correspond to the three hold points required for each concrete pour:
Use of a scratch template (checks depth of formwork)
Notice of intention to place concrete
Placement of Dowel bars
Each of these requires an ACG (Airport Consultancy Representative) to be present and either
witness the test or inspects the formwork or dowel bars. From observation the scratch test
takes an average of 14 minutes before each pour, however, the waste time comes from
waiting for an ACG representative which can take upwards of an hour if poorly coordinated.
The inspection of dowel bars also takes a similar amount of time.
List of checks required by Wagner’s personnel
Fastening of dowel bars
Formwork height
Paving bay free from debris
Timing of concrete trucks
Concrete testing results
On-site concrete testing also takes approximately 5 minutes per slump which is conducted on
the first 2 trucks and every third truck thereafter. A complete range of testing is conducted is
conducted on four concrete batches per lot which takes 30 minutes for each set. For the
purposes of this operation a lot is considered one day which is an average of 200m lineal
paving with 7 hours or 420 minutes of paving time. This equates to 450m3 per day which is
approximately 64 concrete batches of which 23 will need to be tested.
Page 87
73 | P a g e E N G 4 1 1 2
In addition to this the following statistics should be noted:
Defects 109
WIN’s (Work Improvement Notices) 2
The defects were classified as joints, cracks, honeycombing or surface/texturing. Work
improvement notices have also been included as these are issued as remedial actions for non-
conformances.
To achieve the desired quality the concrete must be soft cut after placement to induce
cracking. This is ideally started 5 hours after a pour and takes approximately 16 hours to
complete three 80m runs or one days paving. Another issue affecting the quality of the saw
cuts is the residue left behind after cutting. The saw built for this task cuts downwards leaving
the residue inside the cut as opposed to an upwards cutting blade which would throw the
residue outwards. To remove this the saw must be pulled back along each cut while a blower-
vac is used to blow the residue away. The extra process requires a second operator and an
increase in the time required for each cut.
Inspection Testing Paving
14 115
14 120
60
88 235 420
Waste = Waste time / total time
Waste 43%
Time (min)
Photo 2 – Air voids extending into slab.
Photo 1 - Spalling between concrete slabs.
Page 88
74 | P a g e E N G 4 1 1 2
Inventory waste
The three major inventory items used for the paving are formwork, dowels and the ingredients
to make concrete. The batch plant supplying concrete also supplies concrete to the
construction of the terminal, a bridge and the perimeter fence. The concrete mixes for these
structures require similar mix designs and therefore use the same ingredients. However, as the
concrete paving uses EFC the inventory of the materials at any one time can be quantified as
follows:
Table 4 - Inventory of materials kept on site used in concrete production.
The tonnage of concrete used per day can be calculated as follows:
Concrete density of 2.4t/m3
Use 240 x 0.5 x 5 = 600m3
600 x 2.4 = 1440t per day
With a daily demand of 1440t per day this is enough for little over a week. Compared to most
batch plants this is an excessive supply. However, space is not an issue on site allowing storage
of materials which need to be trucked in from a metropolitan area.
Design waste
Over the length of the project a total of 16 Requests for Information (RFI’s) have been raised.
The RFI’s covered a number of categories ranging from methods for measuring evaporation
rate to the necessary concrete strength required to run the paver over new pavements. The
most common type of RFI was seeking advice on repairs to the concrete surface, joints and to
remediate cracks. There was a total of 6 of this type of RFI making it evident that there has
been a number of issues with the concrete corresponding to the large amount of defects.
Material Inventory (t)
40mm 6,500
Sand 4,500
Slag 600
Flyash 200
Activators 150
Total 11,950 t
Page 89
75 | P a g e E N G 4 1 1 2
Constructability concerns
The concrete is poured in numbered runs 4.5m wide which are further divided into square
bays 4.5m long. An expansion joint has been dsigned through the turning node on the
northern end. This posed a problem to the paving team as at least one bay needed to be left in
each run to have the time and space to install the joint.
The installation of expansion joints requires the paver to stop just before the bay and wait for
formwork to be placed in front of it on both sides of the open bay. This takes approximately 1
hour to complete before the paver can continue. This process will be discussed further in the
next case study.
Reporting of Results
The results of the analysis are presented in the following table. These results are
representative of the concreting process thus far:
Table 5 - Waste Reporting Summary for the concreting process.
KPI Waste Method of measurement Unit Result
Commitment
reliability
Actual/Planned % 58
Transformation
(process waste)
Utilisation RAS, MAC % 73
Transport time FPC % 47
Quality Inspections Waste time/total time % 43
Defects No. 109
Inventory waste Material stock Daily need / total
materials
% 12
Design waste RFI No. 16
RAS Random Activity Sampling
MAC Multiple Activity Chart
FPC Flow Process Chart
Page 90
76 | P a g e E N G 4 1 1 2
5.3 Hand Pours As part of the turning node and apron a number of expansion joints need to be installed
laterally and longitudinally across the pavements. These required the paver to skip this bay and
continue paving at the next bay to allow for the installation of the expansion joint once the
concrete is cured.
5.3.1 The Process
Once the paver has passes and the concrete has cured any concrete must be removed from
inside the bay and the internal formwork must be removed. Once the area is clear the foam
expansion joint can be installed. Once this is completed the bay takes approximately 40
minutes to hand pour. Compared to paving this is a very expensive and time consuming
operation with a rate of 15m3/hr compared to 77m3/hr for the paver.
The following photos show the installation of formwork across a run. This process is used so
that a bay can be left open for the installation of an expansion joint.
The actual process of conducting a hand pour is outlined in the following photos:
Step 1– Paver is stopped while formwork is
lowered into place with an excavator
Step 2 – Positioning form
Step 3– Installed formwork which paver can
move over
Step 4 – Paver moving over skipped bay
Page 91
77 | P a g e E N G 4 1 1 2
Step 4 - Placing concrete against expansion
joint.
Step 6 – Pouring bay using chutes on two
concrete trucks.
Step 1– Hand pour bay after paver has passed
Step 2 – Cleaned face of slab for installation of
expansion joint
Step 5 – Vibrating concrete into place.
Step 3 - Placement of foam expansion joint.
Page 92
78 | P a g e E N G 4 1 1 2
5.3.2 Waste KPI’s
The following sections will calculate the Key Performance Indicators for the concreting
process. From this the process can be evaluated both over time and against other processes to
determine the performance regarding waste.
Commitment Reliability
The commitment reliability of a project can be measured as a percentage by Actual
progress/Planned progress:
IT was expected that three had pours would be achieved per day when paving was not
underway. This has been consistently achieved giving the process an overall commitment
reliability of 100%.
Step 8 – Screeding surface
Step 7 – Placing concrete using a vibrating
screed.
Step 10 – Brooming surface
Step 9 – Smoothing finnish .
Page 93
79 | P a g e E N G 4 1 1 2
Transformation waste
The utilisation levels of the operation were determined by Random Activity Sampling (RAS).
This sample was conducted over one day of hand pours and gave an average utilisation of 43%.
Waste due to transportation:
Figure 45 - FPC over a duration of two hand pours; each with two trucks arriving and placing at the same time.
As with the concrete paving process a large amount of waste was evident from the FPC which
calls for further analysis. A multiple activity chart representing three hand pours has been
constructed to better analyse the source of waste. It is quickly evident that there is a
extensive cycle time of 70 minutes per bay. This cycle is measured from the batching of the
truck to the last application of curing compound. It is also evident that there are a number of
elements which are very inefficient and much less efficient than the paving process.
Page 94
80 | P a g e E N G 4 1 1 2
Tim
e (
min
)U
tili
sati
on
Test
ing
16%
Tru
ck 1
100%
Tru
ck 2
100%
SEC
cre
w77
%
Wag
ne
rs
cre
w
EP21
/11
Cu
rin
g
age
nt
EP21
/11
Cu
rin
g
age
nt
EP21
/11
Cu
rin
g
age
nt
9%
Cyc
le t
ime
= 7
0min
Wo
rk, s
cre
ed
, bro
om
bay
1
9095
140
Tru
ck
bat
che
d
Dri
ves
to
site
Tip
s /
tran
sit
Slu
mp
Slu
mp
Slu
mp
Was
he
s
ou
t
Re
turn
to p
lan
t
Was
he
s
ou
t
Tru
ck
bat
che
d
Dri
ves
to
site
Tip
s /
tran
sit
150
110
115
120
125
155
160
165
Wo
rk, s
cre
ed
, bro
om
bay
2W
ork
, scr
ee
d, b
roo
m b
ay 2
Re
turn
to p
lan
t
Tru
ck
bat
che
d
Dri
ves
to
site
Tip
s /
tran
sit
Was
he
s
ou
t
Re
turn
to p
lan
t145
130
135
100
105
Was
he
s
ou
t
Re
turn
to p
lan
t
Was
he
s
ou
t
Tru
ck
bat
che
d
Dri
ves
to
site
Tip
s /
tran
sit
Re
turn
to p
lan
t
Elements of operation
Dri
ves
to
site
Re
turn
to p
lan
t
655
1015
2025
30
Tru
ck
bat
che
d
Was
he
s
ou
t
Tip
s /
tran
sit
Tru
ck
bat
che
d
Dri
ves
to
site
Tip
s /
tran
sit
7075
8085
3540
4550
5560
Figu
re 4
6 -
MA
C o
f p
roce
sse
s o
ver
the
du
rati
on
of
mu
ltip
le c
on
cre
te p
ou
rs.
Page 95
81 | P a g e E N G 4 1 1 2
Quality
There were no defects directly attributed to hand pours, however, in some cases the need for
hand pours was the result of defects.
Inventory waste
The materials used for hand pours are the same as the paving process, however, the amount
used for hand pours is insignificant.
Table 6 - Inventory of materials kept on site used in concrete production.
The tonnage of concrete used per day can be calculated as follows:
Concrete density of 2.4t/m3
Use 12.5 x 3 x 0.5 x 5 = 94m3
94 x 2.4 = 225t per day
The demand for 3 hand pours uses only 1.8% of the inventory at the plant which is insignificant
compared to the paving operation.
Design waste
3 of the 16 RFI’s directly correlated to the execution of hand pours.
Reporting of Results
The summary of results from the analysis is presented in the following table:
Page 96
82 | P a g e E N G 4 1 1 2
Table 7 - Summary of waste KPI's for hand pours.
KPI Waste Method of measurement Unit Result
Commitment
reliability
Actual/Planned % 100
Transformation
(process waste)
Utilisation RAS, MAC % 43
Transport time FPC % 27
Quality Inspections Waste time/total time % 0
Defects No. 0
Inventory waste Material stock Daily need / total
materials
% 1.8
Design waste RFI No. 3
RAS Random Activity Sampling
MAC Multiple Activity Chart
FPC Flow Process Chart
Page 97
83 | P a g e E N G 4 1 1 2
5.4 Formwork Assembly Normally the use of a paving machine such as the GOMACO would negate the need for
formwork as the machine acts as its own formwork whilst the concrete is being placed.
However, for this operation each run needs to be fixed to the next so that the entire pavement
surface acts as one slab. This is of course with the exception of the designed expansion joints.
To do this dowel bars have been used to lock the concrete runs together. These are 32mm
round bars placed at a minimum spacing of 250 and a maximum spacing of 450. These dowels
also need to be placed a distance of 600mm from the ends of each slab. The formwork has
been introduced purely as a system of holding the dowels in place. This is only needed for
every second pour as the ‘infill’ runs between two completed runs already have dowel bars
protruding for the concrete on each site. This means that for these infill runs no formwork is
needed and formwork installation only occurs for every second run. This saves a lot of time as
the formwork installation process is complicated, time consuming and subject to rigorous
testing and inspection.
Figure 47 - The run in the middle is currently supporting the formwork for the runs either side. Once each side is
completed and the formwork is removed the middle run will be paved as an infill run.
5.4.1 The Process
Formwork is transported to site by truck and unloaded by an excavator or forklift. From here
an excavator is used to move formwork and place them in position along the runs. Two
laborers follow this process and position the formwork longitudinally using survey marks and
string lines and vertically by packing the ends to the marked RL. Then holes are drilled to bolt
the forms down. Once in place another crew packs each of the fastening points between the
Page 98
84 | P a g e E N G 4 1 1 2
ends enabling the forms to be fastened down with bolts. A forklift carries the dowels down the
run as two laborers place them into each position in the formwork on either side of the run.
This process is then repeated with the collars where the laborers simply place the collars on
the formwork where they are used by the next crew to fix the dowel bars into place.
Step 3– Moving generator for drill along run.
Step 6– Installation of triangle crack inducers
on bottom and sides of slab.
Step 5– Packers installed to height and forms
bolted down on top
Step 2– Excavator lifting forms into place.
Step 4– Transporting dowels down run usinf
forklift.
Step 1– Overview of formwork installation
process.
Page 99
85 | P a g e E N G 4 1 1 2
Step 10– Removal of formwork 1 day after
paving
Step 9 – Finnished formwork run ready for
paving
Step 8 – Scratch test to check formwork height
Step7– Dowel bars inserted into formwork
Page 100
86 | P a g e E N G 4 1 1 2
5.4.2 Waste KPI’s
The following sections will calculate the Key Performance Indicators for the process of
formwork installation. These KPI’s can then be measure over time, compared to similar
processes and compared to the planned performance.
Commitment Reliability
The commitment reliability of this project can be measured as a percentage by Actual
progress/Planned progress:
Figure 48 - Calculation of commitment reliability showing the work planned each day and the actual progress at the end of each day.
The commitment reliabilities for the three day progress review are as follows:
Run 1 = 75% (a majority of this task has been completed)
Run 2 = 0% (this task has not been attempted)
Run 3 = 0% (this task has not been attempted)
Run 4 = __ (this task is not planned to commence until the next day)
It is evident that while a majority of the first task has been completed this has been at a cost to
tasks 2 & 3. The average commitment reliability of the project is 25%.
The labour required for the installation of formwork was drastically underestimated by
management at the beginning of the project. It was originally assumed that 6 labourers would
be able to install one run (two sides) of formwork per day. However, this ended up taking 4
days per run. The solution to this was to gradually increase the number of labourers until it
Task Progress
Install run 1 200m
75% 150m
Install run 2 200m
0% 0m
Install run 3 200m
0% 0m
Install run 3 200m
0% 0m
Day 1 Day 2 Day 3 Day 4
Planned
Progress
Page 101
87 | P a g e E N G 4 1 1 2
was possible to achieve one run per day. To achieve this target a total of 30 labourers split into
dayshift and nightshift have been used.
Transformation waste
The utilisation levels of the operation were determined by Random Activity Sampling (RAS).
Two samples were conducted over two days of formwork assembly:
The first study was conducted on the 8th of October which sampled a total of 17 workers and 4
plant. The plant being two forklifts, a bobcat and an excavator. Over a course of almost 4 hours
the labour had an overall efficiency of 53% with the plant only utilised 25% of the time.
The second sample was taken on the 14th of October and with a labour force of 12 and the
same four plant. This study gave an average utilisation of approximately 47% for both labour
and plant.
Combining these results we obtain an average utilisation of 43% for the entire operation.
Obviously this number may not be entirely representative of the efficiencies of individual
processes but gives a broad indication of the overall wastage.
Transportation Waste
The installation of formwork requires transportation of different types of materials using a
number of machines:
As with the concrete paving process a large amount of waste was evident from the FPC which
calls for further analysis.
Page 102
88 | P a g e E N G 4 1 1 2
Step Machine Crew VA NVN NVA
1 Excavator loads truck at storage area Excavator 1 16 4
2 Truck takes forms to run Truck 100 9 4
3 Form inspected for defects 1 4
4 Excavator lifts form 1 into place Excavator 1 2 4
5 Place forms level and straight (pack ends) 2 5 4
6 Drill holes for bolts into seal 1 18 4
7 Move generator down run Forklift 10 2 4
8 Install packers to height 2 22 4
9 Fasten down forms with bolts 1 17 4
10 Clean concrete out of dowel holes 1 13 4
11 Dowel bars inserted into formwork Forklift 2 4 4
12 Collars placed on formwork Forklift 2 3 4
13 Dowel bars locked in with collars 2 18 4
14 Excavator lifts form 2 into place Excavator 1 2 4
15 Place forms level and straight (pack ends) 2 5 4
16 Drill holes for bolts into seal 1 18 4
17 Move generator down run Forklift 10 2 4
18 Install packers to height 2 22 4
19 Fasten down forms with bolts 1 17 4
20 Clean concrete out of dowel holes 1 13 4
21 Dowel bars inserted into formwork 2 7 4
22 Collars placed on formwork Forklift 2 3 4
23 Dowel bars locked in 2 18 4
24 Excavator lifts form 3 into place Excavator 1 2 4
25 Place forms level and straight (pack ends) 2 5 4
26 Drill holes for bolts into seal 1 18 4
27 Move generator down run Forklift 10 2 4
28 Install packers to height 2 22 4
29 Fasten down forms with bolts 1 17 4
30 Clean concrete out of dowel holes 1 13 4
31 Dowel bars inserted into formwork 2 7 4
32 Collars placed on formwork Forklift 2 3 4
33 Dowel bars locked in 2 18 4
34 Formwork Inspected 20 4
35 Scratch test 6 4
9 15 7 No. times
120 187 54 Min
NVA time / total time =
VA Value Added 15% Waste
NVN Non-value added but necessary
NVA Non-value added and unnecessary
Installation of 3 formsRequired
Symbol
Distance
(m)
FlowTime
(min) Cost ($/min)
Symbol
Operation
Transportation
Retention Storage
Delay
Inspection Volume inspection
Quality inspection
Step
Figure 49 - FPC for the installation of three forms.
Page 103
89 | P a g e E N G 4 1 1 2 Ti
me
(m
in)
Uti
lisa
tio
n
Tru
ck48
%
Exca
vato
r81
%
Cre
w 1
(le
vell
ing
form
wo
rk)
100%
Cre
w 2
(d
rill
ing
bo
lt h
ole
s in
to
seal
)88
%
Fork
lift
/ ge
ne
rato
rM
ove
M
ove
M
ove
M
ove
13
%
Cre
w 3
(fa
s10
0%
Cre
w 4
70%
Cre
w 5
56%
Cre
w 6
75%
Cyc
le t
ime
=75
min
Un
load
20
form
s
Do
we
ls in
sert
ed
& lo
cke
d
in f
orm
3
Dri
ll h
ole
s fo
r b
olt
s fo
rm 4
Dri
ll h
ole
s fo
r b
olt
s fo
rm 5
Inst
all p
acke
rs t
o h
eig
ht
form
4
Fast
en
fo
rm 2
Fast
en
fo
rm 2
Leve
l
11
Leve
l
12Le
vel
13
Leve
l
14
Leve
l
15
Leve
l
16
Do
we
ls in
sert
ed
& lo
cke
d in
form
1
Do
we
ls in
sert
ed
& lo
cke
d in
form
2
Un
load
20
form
s
Leve
l
4Le
vel
5
Leve
l
6
Leve
l
7
Leve
l
8Le
vel
9
Cle
an o
ut
ho
les
form
2
125
130
135
Cle
an o
ut
ho
les
form
3
Leve
l 17
Leve
l
18
Leve
l
19
Leve
l
20
110
115
120
Inst
all p
acke
rs t
o h
eig
ht
form
3
100
105
Cle
an o
ut
ho
les
form
1
Dri
ll h
ole
s fo
r b
olt
s fo
rm 3
Inst
all p
acke
rs t
o h
eig
ht
form
2
Leve
l
1
Dri
ll h
ole
s fo
r b
olt
s fo
rm 1
Dri
ll h
ole
s fo
r b
olt
s
form
2
Inst
all p
acke
rs t
o h
eig
ht
form
1
Elements of operation
Fast
en
fo
rm 1
Leve
l
2
Leve
l
3
Leve
l
10
9095
Load
ed
Tran
spo
rt
Load
ing
Tran
sit
Load
ed
Tran
spo
rt
Load
ing
Tran
sit
6065
7075
8085
3035
4045
5055
510
1520
25
.
Figu
re 5
0 -
MA
C s
ho
win
g th
e v
ario
us
ele
me
nts
of
the
fo
rmw
ork
inst
alla
tio
n p
roce
ss.
Page 104
90 | P a g e E N G 4 1 1 2
Quality
There have been a number of quality issues arising from the formwork assembly methodology.
The formworks when delivered to site were out of tolerance and required each form to be
ground back into shape. During pouring most of the quality issues have arisen from the
placement of dowel bars. In some instances these have been bent but most cases have arisen
from poorly fixed collars. This allows the dowel bars to either fall into or out of the concrete
pour due to the vibrations of the paving machine.
Each runs formwork is inspected before the commencement of concrete placement. This
inspection is dependent on when the paving is initiated and does not interrupt the work flow
of the formwork installation. For this reason there is no inspection time directly attributed to
the installation of formworks.
Inventory waste
The formwork used has been manufactured from the Wagners workshop in town reducing the
lead time and potential problems with ordering. A total of 2km was manufactured at the start
of the project. With an average run length of 200m this is enough to form up 5 runs assuming
both sides need to be formed up. Using the current method each day a minimum of three runs
of formwork are needed: one to be paved, one being formed up and a third which cannot be
stripped until the next day. Realistically it takes more than a day to form each run so a fourth
set needs to be utilised for the formwork to be able to stay behind the paver. This means that
only 1600m of the 2000m on site is being used at any point in time correlating to wastage of
20%.
The 32mm dowel bars need to be ordered from China with a two month lead time. For this
reason the total order of 28,000 dowels was placed before the start of the project to avoid
issues. However, this means that a huge inventory of dowels needs to be kept on site which
Photo 2 –Dowel bar pushed out of slab.
Photo 1 – Dowel bar vibrated into concrete
slab.
Page 105
91 | P a g e E N G 4 1 1 2
takes up space and can increase the risk of damage. Fortunately on this particular site, space is
not an issue and dowel bars are a particularly robust product. Assuming one run is paved per
day 552 dowels will be used per day giving a daily inventory wastage of approximately 98%
which will reduce over time to 0% as the supply is used up.
Design waste
To date a total of 2 RFI’s have been raised regarding the formwork and dowel bars.
Constructability concerns
The formwork was built in 4.5m lengths to cater for the 4.5m wide runs on the turning node.
However, due to the overall dimensions of the apron it was determined that 5m width runs
would be necessary and therefore 5m lengths of formwork would be required. To achieve this
additional 500mm sections of formwork were manufactured and bolted to the existing
formwork.
Page 106
92 | P a g e E N G 4 1 1 2
Reporting of Results
The waste KPI’s discussed have been summarised quantitatively in the table below:
Table 8 - Summary of waste KPI's for the installation of formwork.
KPI Waste Method of measurement Unit Result
Commitment
reliability
Actual/Planned % 25
Transformation
(process waste)
Utilisation RAS, MAC % 43
Transport time FPC % 15
Quality Inspections Waste time/total time % 0
Defects No. 0
Inventory waste Material stock Daily need / total
materials
% 98
Design waste RFI No. 2
RAS Random Activity Sampling
MAC Multiple Activity Chart
FPC Flow Process Chart
Page 107
93 | P a g e E N G 4 1 1 2
5.5 Sample Weekly Waste Report
From these case studies we have developed a detailed description of each of the processes
involved in the construction of the Concrete pavements for the airport. This information
coupled with the report format were used to create a Weekly Waste Report of the concrete
paving operation for the week of the 12th of October.
Page 108
94 | P a g e E N G 4 1 1 2
Weekly Site Waste Report
FOR
Construction Project
6/10/14 – 12-10/14
1 Progress Overview:
The construction of the concrete apron has progressed into its fourth week of paving with just
over a quarter completed. Due to the recent open day a transition pavement between the
taxiway and the apron has been constructed to facilitate airplane movements. This is
particularly complex process to transition from the rigid concrete pavement to a flexible
pavement.
Due to the impending deadline for the CASA (Civil Aviation Authority) audit production has
been stepped up. More labourers and engineering staff have been recruited to achieve this.
Some of these will be dropping back to conduct repairs on the placed concrete.
2 Key Performance Indicators:
To estimate the wastage the following KPI’s have been measured:
KPI Waste Method of measurement Unit Result
Commitment
reliability
Actual/Planned % 100
Transformation
(process waste)
Utilisation RAS, MAC % 56
Transport time FPC % 47
Quality Inspections Waste time/total time % 54
Defects No. 1
Inventory waste Material stock Daily need / total
materials
% 12
Design waste RFI No. 0
RAS Random Activity Sampling Improved
MAC Multiple Activity Chart No change
FPC Flow Process Chart Worse
Page 109
95 | P a g e E N G 4 1 1 2
3 Open Issues:
1. Saw cut night crew: For best quality saw cutting needs to be performed 5 hours from
placement. To achieve this saw cutting night crew could be utilised as most pours
finish in the afternoon.
2. Cracks: Thirteen transverse cracks formed in one of the runs - far more than ever
before. This is thought to be attributed to a delay in saw cutting and covering with
geofabric.
4 Closed Issues:
1. Hand pours: Due to a change in methodology the need for hand pours has been
eliminated. This has been achieved by paving every second run on the same side of the
expansion joints. This has improved efficiencies greatly as SEC crews no longer need to
be taken off the paver every few days.
2. Outsourcing cartage: Previously concrete cartage needed to be outsourced when
agitator trucks were needed for hand-pours. Now that hand pours are no longer
necessary this will not occur again.
3. Saw Cuts residue: The design of the saw used cuts into the concrete laving residue
inside the cuts which later cements together again. Now the saw is run back over the
cut while a blower-vac blows away the residue.
4. Dowel bar movement: The vibration of the paving machine has caused dowel bars to
move. To prevent this it is now mandatory for engineers to check every dowel before
the pour.
Page 110
96 | P a g e E N G 4 1 1 2
4 Photos:
Photo 1 - Placing formwork for an expansion
joint.
Photo 2 - Outsourcing concrete cartage to Boral
for hand-pours.
Photo 3 – Placement of concrete in front of
terminal.
Photo 4 – Installation of the end-of-run
formwork.
Photo 6 – Collar vibrated off dowel bar which
has fallen into the pour.
Photo 5 – Softcut surface to induce cracking.
And placement of geofabric to slow curing.
Page 111
97 | P a g e E N G 4 1 1 2
5 Summary & Recommendations:
The paving plan for the apron required 200 lineal meters a day, however, SEC is currently
averaging three 80m runs with a total of 240m. This gives the program a 100% commitment
reliability as the promised work has been completed in the allotted time. The batching plant
holds a capacity of 11,000t of materials which is a little over a week’s supply with the current
usage of 1440t of concrete per day or 12% of inventory.
The paving process has undergone a number of changes resulting from learnings developed
over the months since commencement. In the past week a number of key solutions have been
developed to a range of issues. The major improvement being the elimination of hand-pours
through a change in paving layout.
Utilisation of labour and plant is 56% while transportation time still accounts for 47% of the
total time of each cycle. It is obvious the movement of trucks is more time consuming than the
turning node which was closer to the on-site batch plant. As the labourers are tending to the
paving machine utilisation cannot be directly correlated to productivity in this case.
There has been no RFI’s this week which contrasts to last week’s 4 RFI’s due to the
commencement of crack repairs on completed pavement. The one defect was recorded for the
13 cracks on run 33 potentially due to the delay in saw cutting.
6 Conclusions:
Paving has increased in productivity and is achieving a bettor quality outcome than ever
before. This consistency has improved the commitment reliability and reduced RFI’s. However,
issues such as transportation times and underutilisation of labour are still prevalent.
Page 112
98 | P a g e E N G 4 1 1 2
Appendix A – Random Activity Sampling (RAS)
PROJECT: Wellcamp Airport Construction
OPERATION:Concrete Paving
STUDY NO.: 2
STUDY TYPE: Random Activity Sample (RAS)
DATE: 9/10/2014
Start time: 8:45 Finnish Time: 14:00
WEATHER CONDITIONS: Overcast
NOTES:
Total workers: 10
Total plant: 1
ObservationsTime: Notes:
8:50 7 1
9:05 7 1
9:14 6 1
10:04 3 0 Cleaning and resetting
11:27 7 1
11:37 5 1
11:47 8 1
11:53 0 0 Truck not arrived
12:02 8 1
12:30 0 0 Truck not arrived
12:49 4 1
12:54 1 0 Truck not arrived
13:06 7 1
13:40 5 0 End of paving
Average: Average Utilisation: 56.43%
Labour working: Plant working:
48.57% 64.29%
Page 113
99 | P a g e E N G 4 1 1 2
Appendix B – Flow Process Chart (FPC)
Page 114
100 | P a g e E N G 4 1 1 2
Appendix C – Multiple Activity Chart (MAC)
Uti
lisa
tio
n
Test
ing
Slu
mp
Slu
mp
Slu
mp
45%
Tru
ck 1
Tip
s /
tran
sit
Tip
s /
tran
sit
100%
Tru
ck 2
Tip
s /
tran
sit
Tip
s /
tran
sit
93%
Tru
ck 3
Tip
s /
tran
sit
Tip
s /
tran
sit
87%
Tru
ck4
Tip
s /
tran
sit
Tip
s /
tran
sit
81%
Tru
ck 5
Tip
s /
tran
sit
71%
Tru
ck 6
Tip
s /
tran
sit
60%
Pav
er
66%
Pav
ing
cre
w50
%
Ave
rage
Ave
rage
73%
Elements of operation
Tru
ck
bat
che
dD
rive
s to
sit
eW
ash
es
ou
tR
etu
rn t
o p
lan
t
Tru
ck
bat
che
dD
rive
s to
sit
eW
ash
es
ou
t
Tru
ck b
atch
ed
Was
he
s o
ut
Re
turn
to
pla
nt
Dri
ves
to s
ite
Tru
ck
bat
che
d
Tru
ck b
atch
ed
Dri
ves
to s
ite
Re
turn
to
pla
nt
Was
he
s o
ut
Re
turn
to
pla
nt
Dri
ves
to s
ite
Was
he
s
ou
tR
etu
rn t
o p
lan
t
Was
he
s
ou
t
Was
he
s o
ut
Re
turn
to
pla
nt
Dri
ves
to s
ite
Tru
ck
bat
che
d
45
Tru
ck b
atch
ed
Dri
ves
to s
ite
3540
30
Re
turn
to
pla
nt
Tru
ck b
atch
ed
Dri
ves
to s
ite
50
Was
he
s o
ut
Re
turn
to
pla
nt
Re
turn
to
pla
nt
Dri
ves
to s
ite
Was
he
s o
ut
85
Full
ran
ge o
f te
stin
g
Pav
ing
Pav
ing
7580
Tru
ck
bat
che
dD
rive
s to
sit
e
Was
he
s
ou
tR
etu
rn t
o p
lan
t
5560
6570
510
1520
25
Tru
ck b
atch
ed
Uti
lisa
tio
n
Test
ing
Slu
mp
Slu
mp
Slu
mp
45%
Tru
ck 1
Tip
s /
tran
sit
Tip
s /
tran
sit
100%
Tru
ck 2
Tip
s /
tran
sit
Tip
s /
tran
sit
93%
Tru
ck 3
Tip
s /
tran
sit
Tip
s /
tran
sit
87%
Tru
ck4
Tip
s /
tran
sit
Tip
s /
tran
sit
81%
Tru
ck 5
Tip
s /
tran
sit
71%
Tru
ck 6
Tip
s /
tran
sit
60%
Pav
er
66%
Pav
ing
cre
w50
%
Ave
rage
Ave
rage
73%
Elements of operationTr
uck
bat
che
dD
rive
s to
sit
eW
ash
es
ou
tR
etu
rn t
o p
lan
t
Tru
ck
bat
che
dD
rive
s to
sit
eW
ash
es
ou
t
Tru
ck b
atch
ed
Was
he
s o
ut
Re
turn
to
pla
nt
Dri
ves
to s
ite
Tru
ck
bat
che
d
Tru
ck b
atch
ed
Dri
ves
to s
ite
Re
turn
to
pla
nt
Was
he
s o
ut
Re
turn
to
pla
nt
Dri
ves
to s
ite
Was
he
s
ou
tR
etu
rn t
o p
lan
t
Was
he
s
ou
t
Was
he
s o
ut
Re
turn
to
pla
nt
Dri
ves
to s
ite
Tru
ck
bat
che
d
45
Tru
ck b
atch
ed
Dri
ves
to s
ite
3540
30
Re
turn
to
pla
nt
Tru
ck b
atch
ed
Dri
ves
to s
ite
50
Was
he
s o
ut
Re
turn
to
pla
nt
Re
turn
to
pla
nt
Dri
ves
to s
ite
Was
he
s o
ut
85
Full
ran
ge o
f te
stin
g
Pav
ing
Pav
ing
7580
Tru
ck
bat
che
dD
rive
s to
sit
e
Was
he
s
ou
tR
etu
rn t
o p
lan
t
5560
6570
510
1520
25
Tru
ck b
atch
ed
Page 115
101 | P a g e E N G 4 1 1 2
Chapter 6
Industry Feedback
6.1 Aim
From the literature review it was established that the following areas required further
investigation:
Major causes of waste in construction
Effectiveness of waste management plans
Commitment reliability of projects
Prevalent waste types
It was also apparent that there needed to be some sort of evaluation on the Waste
Classification and Reporting Structure Developed. The following areas of the reporting
structure will be evaluated by the interviewees:
Structure and coverage
Suitability of methods of waste measurement
Feasibility of implementation
Importance of data collected
6.2 Format
Obtaining feedback will take the form of a face to face interview. This will begin with a general
introduction into the aim of the research and a background on lean construction and the
context of waste. A sample waste report for a specific process will then be used to explain the
structure and waste measurement methods and KPI’s. The process will then culminate with
the interviewee filling out the accompanying questionnaire.
The areas of interest outlined in the aim will be investigated by the use of ‘tick and flick’ rating
system. This gives the participant the ability to either incrementally rate their response 1 – 5 or
whether they agree, disagree or maintain a neutral position to the question asked. This
method makes it quick and easy for the participant to answer the questions. The format also
allows the results to be easily correlated and compared and allows the development statistical
averages. A comments section was provided for the participants to provide feedback on the
survey to potentially improve the effectiveness of this particular data collection method.
Page 116
102 | P a g e E N G 4 1 1 2
6.3 Target Group The questionnaire has been aimed towards Engineers in Management roles on large
construction sites. To gain a balanced and more representative view of responses the
candidates have been chosen from a number of different companies and from a variety of
roles within the middle to senior management tiers. These companies have projects including;
civil, building, electrical installations and airport construction. The interviewees chosen are
listed as follows:
1. Project Manager – Probuild (Grand Central shopping centre reconstruction)
2. Senior Project Engineer – Seymour Whyte Constructions (Toowoomba Range
Remediation)
3. Manager Energy Services –Wagners (Santos electrical infrastructure refit)
4. Contracts Administrator/Project Engineer – Wagners (Wellcamp Airport)
The number of interviewees selected has been chosen to give an indication of the views on
lean construction and waste in the construction industry at this time. To provide a statistically
significant sample would require a large number of professions to be interviewed. For the
purpose of this research this is considered outside the scope and as a potential future direction
for more in-depth study.
6.4 Method
The feedback will be gathered in the form of a structured interview accompanied by a
questionnaire. The interview will begin with a background into the research being conducted
and provide an introduction to lean construction with a focus on defining ‘waste’. The example
reporting structure will be introduced and the structure and relevance of each section
explained. Throughout this process the relevant sections on the questionnaire will be
completed.
Page 117
103 | P a g e E N G 4 1 1 2
The interview structure is as follows:
4.2.2 Results
4.2.2 Discussion of Results
Interview Structure
1 Introduction to research being conducted: Background
Need
Aim
3 minutes
2 Introduction to Lean construction: Overview
JIT production
Value Stream Mapping
5 minutes
3 Defining Waste: Definition
Types
Classification
Methods of measurement
5 minutes
4 Overview of waste reporting structure: Structure
Process used in specific example
Key Performance Indicators
Applications
10 minutes
5 Questionnaire: To be filled out by Interviewee
10 minutes
Page 118
104 | P a g e E N G 4 1 1 2
6.3 Questionnaire
The following questionnaire was used to gauge the interviewee’s responses:
Lean Construction to reduce waste
Project topic: Measurement of waste in Concrete Construction using Lean Construction
Methodologies
Questionnaire background
This research aims to develop a suitable format for the measurement, classification and reporting of
wastes from a lean construction perspective. To complement this research this questionnaire has been
developed to better understand the current situation of waste reporting in the construction industry.
The concept of lean is focused on; elimination of waste, maximisation of customer value and increasing
workflow. For the purpose of this questionnaire waste is considered any wasteful or non-value adding
activity in a construction process.
Instructions
Tick the box that is most representative of you views of each question and provide comments if desired.
Remark: This questionnaire aims only to assess current views on waste reporting within the construction
industry. This questionnaire is NOT to assess people and their work or knowledge.
Participant Information
Name (optional): _________________________
Position: _________________________
Date: _________________________
Page 119
105 | P a g e E N G 4 1 1 2
Questions
1.0 Lean Construction
Agree Neutral Disagree
1.1 Are you familiar with the Lean construction/production concept?
1.2 On your current project is concrete batched on site or delivered?
1.3Do you believe it is reasonable to apply techniques from manufacturing
to construction to increase productivities?
1.4Project progress reports often report on cost, progress and safety - but
rarely do we report on waste. Is this the case?
1.5On your current project is there an effective waste management plan in
place?
2.0
2.1
1 2 3 4 5
Transportation
Inspections
Waiting/idle time
Unnecessary inventory
Overordering or ordering error
RFI's (Requests for information)
Constructability concerns
Design errors
Defects
Lack of waste management plan
Safety concerns
Waste & waste-reducing strategies
(1 significant source of waste - 5 non-waste causing)
In your opinion which of the following aspects of a
project cause wastage?
Page 120
106 | P a g e E N G 4 1 1 2
6.0 Results
3.0
1 2 3 4 5
3.1 Is the content included relevant to the construction works?
3.2 Is the structure logical and easy to follow?
Report Content & Structure
(1 agree - 5 disagree)
In your opinion how would you rate the effectiveness of the following report
characteristics:
4.0 Tools and Techniques
1 2 3 4 5
4.1 How would you rate your current projects commitment reliability?
4.2Do you believe commitment reliability is an effective indicator of
wastage or inefficiency within a project?
4.3Do you think RAS would be effective as a method of determining
utilisation of labour and plant on site?
4.4 Is this an effective way to categorise all construction activities?
4.5Do you think FPC is an effective analysis technique for identifying
wastage on site?
4.6Do you think MAC would be an effective mapping technique for
identifying wastage on site?
A Multiple Activity Chart (MAC) (attached to the report) has been used to
analyse a specific process to visually represent waste time.
A Flow Process Chart (FPC) (attached to the report) has been used to
categorise the process steps according to these 3 classifications and the type of
operation. Data is collected for each step and collated to give an overall waste
%
(1 not-useful - 5 very effective)
In your opinion how would you rate the effectiveness of the following waste
reporting tools:
Construction activities can be classified according to their ability to add 'value'
to the final product being produced.Three categories being: value-adding,
non-value adding and value-adding but necessary.
Commitment reliability is the measure of a projects ability to meet it's goals.
% reliable = actual progress/planned progress
Random Activity Sampling (RAS) records the % of the labourforce working at
random intervals throughout the day giving an overall utilisation %.
Page 121
107 | P a g e E N G 4 1 1 2
Do you have any comments/feedback on the survey?
______________________________________________________________________________________
______________________________________________________________________________________
______________________________________________________________________________________
______________________________________________________________________________________
5.0 Frequency
Weekly Monthly Quarterly
5.1 What fequency/s should the wastage be reported?
5.2What frequency are other project progress reports
(cost/progress/safety) conducted?
5.4 How frequently should the following techniques be used? Daily Weekly Monthly
Commitment Reliability
Random Activity Sampling (RAS)
Flow Process Chart (FPC)
Multiple Activity Chart (MAC)
Supervisor Site Eng Env Eng PM
5.3 Who should be responsible for waste reporting?
5.4 What should this report be called: Tick
Waste management report
Site waste Report
Continuous Improvement Report
Other ____________________________________
6.0 Feasibility
Agree Neutral Disagree
6.1Could lean construction techniques help generate cost savings on this
site?
6.2Do you believe it would be feasible to implement a waste reporting
program on your current project?
Page 122
108 | P a g e E N G 4 1 1 2
6.4 Results
The results for each question are outlined below. The completed questionnaires are located in
Appendix D for reference.
1.0 Lean Construction
Question 1.1
Q: Are you Familiar with the lean construction/production concept?
A: Two out of the four respondents were familiar with lean construction.
Question 1.2
Q: On your current project is concrete batched on site or delivered?
A: Two of the projects had concrete delivered and the other two batched concrete on site.
Question 1.3
Q: Do you believe it is reasonable to apply techniques from manufacturing to construction to
increase productivities?
A: Three of the respondents agreed that it is reasonable with the other disagreeing.
Question 1.4
Q: Project progress reports often report on cost, progress and safety - but rarely do we report
on waste. Is this the case?
A: Only one respondent agreed with the rest disagreeing.
Question 1.5
Q: On your current project is there an effective waste management plan in place?
A: One respondent had an effective plan, one was neutral and the remaining two did not have
a plan.
Page 123
109 | P a g e E N G 4 1 1 2
2.0 Waste & waste reducing Strategies
Question 2.1
Q: In your opinion which of the following aspects of a project cause wastage?
A: The results have been summarised in the following table:
Table 9 - Quantification of the significance of different sources of waste.
3.0 Report Content & Structure
Question 3.1
Q: Is the content included relevant to the construction works?
A: Three respondents believed that the content I very relevant while one was undecided.
Question 3.2
Q: Is the structure logical and easy to follow?
A: All four respondents agree that the structure was very logical and easy to follow.
Question 3.3
Q: Any suggestions for improvement?
A: No suggestions were offered by any of the respondents.
Man
ager
Ener
gy
Serv
ices
Sen
ior
Pro
ject
Engi
nee
r
Co
ntr
acts
Ad
min
istr
ato
r
Pro
ject
Man
ager
Transportation 5 1 1 3 2.5
Inspections 5 5 3 5 4.5
Waiting/idle time 1 1 1 3 1.5
Unnecessary inventory 3 3 3 4 3.3
Over ordering and ordering error 2 3 1 1 1.8
RFI's (Requests for information) 3 3 2 4 3.0
Constructability concerns 3 3 2 3 2.8
Design errors 4 3 3 2 3.0
Defects 2 4 3 2 2.8
Lack of waste management plan 4 3 4 3 3.5
Safety concerns 1 5 4 4 3.5
Respondent's scores
Type of Waste Average
Page 124
110 | P a g e E N G 4 1 1 2
4.0 Tools and Techniques
Question 4.1
Q: Do you believe commitment reliability is an effective indicator of wastage or inefficiency
within a project?
A: The responses were 3,4,5,5 with an average of 4.25. This means that CR is effective.
Question 4.2
Q: Do you think RAS would be effective as a method of determining utilisation of labour and
plant on site?
A: The responses were 5,5,5,5 with an average of 5. This means that RAS is very effective.
Question 4.3
Q: Is Value Adding an effective way to categorise all construction activities?
A: The responses were 5,5,4,3 with an average of 4.25. This means that Value Adding is
effective.
Question 4.4
Q: Do you think the FPC is an effective technique for identifying waste on site?
A: The responses were 5,5,5,3 with an average of 4.5. This means that FPC is very effective.
Question 4.5
Q: Do you think MAC would be an effective mapping technique for identifying wastage on site?
A: The responses were 5,5,5,4 with an average of 4.75. This means that MAC is very effective.
5.0 Frequency
Question 5.1
Q: What frequency/s should the wastage be reported?
A: Two respondents stated that it should be reported weekly and monthly while one picked
weekly and one picked monthly.
Question 5.2
Q: What frequency are other project progress reports (cost/progress/safety) conducted?
A: Two respondents stated weekly and monthly while the other two only reported waste
monthly.
Question 5.3
Page 125
111 | P a g e E N G 4 1 1 2
Q: How frequently should the following techniques be used?
Commitment Reliability
Random Activity Sampling (RAS)
Flow Process Chart (FPC)
Multiple Activity Chart (MAC)
A: The following table outlines the frequencies suggested by the interviewees:
Table 10 - Suggested waste measurement frequencies for each technique.
Question 5.4
Q: Who should be responsible for waste reporting?
A: Two respondents agreed that everyone (Supervisor, Site Eng, Env Eng, PM) should report
waste while one respondent believed it up to the site engineers and another that it is up to
supervisors.
Question 5.5
Q: What should this report be called?
A: This question was introduced late into the questionnaire, therefore only one respondent
was able to answer this question. This person agreed that it should be called the Site Waste
Report.
Man
ager
Ener
gy
Serv
ices
Sen
ior
Pro
ject
Engi
nee
r
Co
ntr
acts
Ad
min
istr
ato
r
Pro
ject
Man
ager
Commitment
ReliabilityD W D W M W
Random Activity
SamplingD W M W W
Flow Process
ChartD W M W M
Multiple Activity
ChartD W M W W
Respondants scores
(D - Daily, W - Weekly, M - Monthly)
Technique
Page 126
112 | P a g e E N G 4 1 1 2
6.0 Feasibility
Question 6.1
Q: Could lean construction techniques help generate cost savings on this site?
A: Three respondents agreed with this statement while one was neutral.
Question 6.2
Q: Do you believe it would be feasible to implement a waste reporting program on your
current project?
A: All respondents agreed that this would be feasible.
Page 127
113 | P a g e E N G 4 1 1 2
6.5 Discussion
The interviews produced a generally positive response with the respondents approving of the
waste measurement techniques. There was very useful feedback and comments on each
section of the questionnaire which will be discussed as follows.
6.5.1 Lean Construction
An interesting result was that 2 out of 4 participants were familiar or at least had heard of the
concept of Lean Construction. A majority of the participants agreed that it is reasonable to
apply techniques from manufacturing to construction to increase efficiencies. Only half of the
respondents had a waste management plan on their current project, however, a majority of
respondents stated that there waste some form of waste reporting or tracking.
6.5.2 Waste & waste reducing Strategies
The three most significant sources of waste were
1. Waiting/Idle time
2. Over ordering and ordering error
3. Transportation
The three least significant sources of waste were
1. Inspections
2. Lack of waste management plan
3. Safety concerns
The ability for interviewees to list additional factors that they believed to be significant sources
of waste of site gave valuable insight. The additional sources listed were:
Recruitment and retraining of employees for different roles and
Poor Materials control
Lack of Experience
No set out (survey)
Wet weather
6.5.3 Report Content & Structure
All those interviewed rated the relevance of report content and the logical layout of the report
highly and had no suggestions for improvement. The report was based on a standard progress
report format which is tried and tested and familiar to most construction professionals. This
may have helped the acceptance of the chosen structure.
Page 128
114 | P a g e E N G 4 1 1 2
6.5.4 Tools and Techniques
This section required the explanation of each of the methods used for data collection.
Commitment reliability received a mixed review. One respondent noted that CR is not always
representative of waste and does not account for issues out of the person’s control.
The respondents agreed that the methods of commitment reliability, RAS, FPC and MAC were
very effective at identifying waste on site. However, there were some different opinions
regarding the application of value-adding as a classification of processes on site. All
respondents agreed that all processes fit into the three categories but not what types of waste
are classified as non-value adding. One of the respondents stated that processes such as
transportation are in fact not non-value adding and should perhaps be categorized differently
as they are a requirement of the process. Another respondent stated that perhaps the
category of non-value adding could be renamed to better reflect the processes it covers.
6.5.5 Frequency
All the respondents agreed that other project progress reports are conducted monthly and
that waste reporting should be treated the same. One of the respondents commented that on
their current project the progress is reported weekly to the project manager and monthly to
the board of directors. The same respondent noted that initially wastage should be reported
weekly then once the process is well established the reporting should be reduced to monthly.
The Contracts Administrator stated that the frequency for waste reporting is job specific
depending on the type of construction.
There were differing opinions on how often the waste measurement techniques should be
used. The Manager of Energy Services suggested that all the methods could be used on a daily
basis and reported at the end of each week. The Senior Project Engineer believed that
commitment reliability would be useful at evaluating waste on a daily and weekly basis but the
other more complex methods would only need to be reported monthly. These answers
followed no trend and seemed to be very biased towards each person’s experience and the
company they work for.
6.5.6 Feasibility
All respondents agreed that lean construction techniques could save costs on construction
sites. One respondent noted that while this would most likely be the case there would need to
be a cost/benefit analysis to prove this before implementation. This would compare the costs
of a particular person monitoring wastage to the cost-savings that could be developed. In the
case that waste reporting is a shared responsibility this would have to incorporate the
accumulated time each individual spends on planning and monitoring per day. Each
Page 129
115 | P a g e E N G 4 1 1 2
respondent also agreed that it would be feasible to implement a waste reporting program on
their current project. One respondent mentioned that this would still be difficult as companies
would not be willing to spend the money to introduce this. A majority of the respondents
believed that reporting should be conducted by site engineers and supervisors out on site in
each area. The benefit of this is that these people know their particular area of site and will be
better able to report waste comprehensively. Another respondent stated that it is everyone’s
responsibility and is required at every level.
6.5.7 Additional Comments
There were a number of constructive comments provided in addition to the questionnaire.
All respondents noted that waste can never be completely eliminated and that in the
ever-changing construction industry this will always be the case.
A large amount of manpower is required for planning which will help to reduce waste.
This is especially important at the beginning of the project
Perhaps an extra person is needed on projects to report wastes across all the different
areas of a project.
Reporting is difficult to implement as companies do not want to spend the money.
Construction time can be classified according to the three W’s; walking, waiting and
working. At any one time every person on site will be doing one of these three.
Everyone is responsible for reporting waste at different level.
Page 130
116 | P a g e E N G 4 1 1 2
Chapter 7
Conclusions
7.1 Summary
This research has conducted a study into the quantification of all wastes present in particular
construction process. This has been conducted from a lean construction perspective where
waste has been defined as any non-value adding process or activity. The processes chosen
were concrete paving, hand-pouring concrete and the installation of formwork. The types of
wastes present in the construction industry have been researched and a comprehensive list
collated. A number of waste classifications have been evaluated to organise these wastes into
manageable groups. These classifications were also selected on their usability and the
potential techniques of measurement.
A suitable format for waste reporting has been established and trialled in a construction
environment. This has been evaluated by Professional Engineers in management positions
within the construction industry. From this evaluation improvements can be made to this
structure and a future direction for this research has been determined.
7.2 Review of the Problem The aim of this research was to study the application of lean construction methodologies to
the Australian construction industry. To achieve this, the report examined production
processes involved in construction and identified and measured waste. This was specifically
applied to concreting processes.
The biggest question to be asked is whether the project has achieved the goals and objectives
determined at the beginning of research. These are both a guide and a measure of the overall
success of the research project:
1 Investigate current methodologies for construction of concrete structures and the
types of waste present.
The types of waste found in construction has been thoroughly researched and the
types identified from multiple sources have been evaluated and incorporated into a
comprehensive list.
2 Identify lean construction techniques for reducing waste
Page 131
117 | P a g e E N G 4 1 1 2
A number of lean construction techniques such as; Just in Time delivery, Value Stream
Mapping and Supply Chain Management have been introduced and evaluated in the
Literature Review.
3 Establish techniques for measuring waste and a framework to implement these.
The literature review has analysed number of lean construction techniques which can
be used for mapping, classifying and measuring construction wastes. The Use of
Transformation flow value and the 7 Value Stream Mapping tools has been identified as
very important. The waste report developed utilises commitment reliability, random
activity sampling, flow process charts and multiple activity charts as waste
measurement techniques.
4 Select specific processes to study and measure waste.
The specific process of concrete paving, had pours and formwork installation have
been selected. These have been studied using case studies of these processes on the
Wellcamp Airport construction site.
5 Synthesise a suitable format for waste reporting.
Formats for waste reports have been developed for both weekly and monthly
timeframes. These reports centre around the KPI’s developed from the literature
review.
6 Seek feedback from construction industry professionals on KPI’s
Structured interviews with Professional Engineers and an accompanying questionnaire
have been used to evaluate the report structure and KPI’s from an industry
perspective.
7 Use waste classifications and corresponding remedial actions for report
recommendations
The report recommendations have been based on the issues and resulting wastes that
have occurred over the period of the report. The associated recommendations have
been based on the standard remedial actions for the particular waste classifications.
8 Conduct a case study for concreting
Three detailed case studies have been conducted on different types of concreting
activities. This has involved mapping the processes, applying waste classifications and
application of the report format.
Page 132
118 | P a g e E N G 4 1 1 2
7.3 Conclusion
In summary the respondents believed the lean construction techniques and waste report to be
very beneficial to improving construction process on site. However, there were some concerns
about the cost/benefit ratio of implementing the controls and collecting the data as compared
to the cost of the waste. This appeared to be the major obstacle in implementation as the
initial cost and time required for implementation would be quite high. This indicates that a
cost/benefit analysis of waste reporting would be a very useful direction for further research.
The varying responses from different construction sites highlights the fact that the integration
of these lean construction techniques may need to be customized to fit different types of
construction management scenarios.
The following recommendations have been developed for improving the waste reporting
process:
The waste report will be presented monthly while wastes will be measured on a
weekly basis using CR, RAS, FPC & MAC.
A cost/benefit analysis will need to be conducted to determine feasibility.
Waste reporting wouldn’t occur unless there is a requirement to do so.
This research project has achieved all the objectives outlined in the project specification.
Construction waste has been effectively classified and measured in a construction
environment. This data collected has been synthesized into a format which is deemed both
usable and useful by construction industry professionals.
7.4 Limitations of the study
This study was limited to the depth of research required for an undergraduate dissertation. For
this reason the scope of work was limited to make the project achievable in the allocated
timeframe of two semesters.
This dissertation focuses on the construction phase of projects and does not consider other
phases such as design and planning. This has been further constrained to concrete
construction and has only conducted research, case studies and industry feedback directly
related to this process.
Page 133
119 | P a g e E N G 4 1 1 2
7.5 Further Work
There are a number of possibilities for further work on this project. Firstly this method of
process analysis, classification and reporting can be applied to other types of concreting
activities and other fields of construction such as earthworks, pavement construction and
structures. Once this method has been further refined and tested on different construction
processes the effect of its implementation can be better determined. This will measure how
informative the reporting is to management and whether effective recommendations can be
determined from data collected. The ultimate test will be whether this method increases
overall efficiencies in construction processes over time.
Another avenue to be explored is the possibility of modification of standards or legislation to
include waste reporting. One method would be to make reporting a requirement from major
government infrastructure clients such as the Department of Transport and Main Roads in
Queensland. This government body acts as a client and contracts road infrastructure projects
to private construction companies. As part of these contracts the companies need to comply
with building standards and report on elements of the project such as environmental
compliance. The best way to integrate waste reporting would be to introduce a requirement
for this into contracts awarded by the Department of Transport and Main Roads.
One of the main points raised in the interviews was the need for a cost/benefit analysis to
prove the feasibility of the approach in a monetary form. This cost/benefit analysis would need
to determine the costs of implementing waste reporting and determine a monetary value of
the wastes eliminated.
Page 134
120 | P a g e E N G 4 1 1 2
Appendices
Appendix A – Project Specification
ENG4111
Research Project Specification
For: George Watson
Topic: Application of lean construction methodologies in concrete
construction processes to measure and reduce waste.
Supervisor: Vasantha Abeysekera
Project Aim: Examine production processes and measure waste with the aim of
improving performance. In order to do this it is necessary to focus on a
specific group of processes – in this case concreting with associated
work such as formwork and rod reinforcement.
Objectives: Issue 2, 4th September 2014
1 Investigate current methodologies for construction of concrete structures and the
types of waste present. This will focus on the construction phase of traditional
design, tender and construct projects.
2 Identify lean construction techniques for reducing waste
3 Establish techniques for measuring waste and a framework to implement these.
4 Select specific processes to study (foundations, culvert, bridge pier etc) and
measure waste.
5 Synthesise suitable format for waste reporting based on literature review
6 Seek feedback from construction industry professionals on Key Performance
indicators for waste
7 Use waste classifications and corresponding remedial actions for report
recommendations
8 Conduct a case study for concreting including classification of wastes, process
mapping and application of reporting formats.
Page 135
121 | P a g e E N G 4 1 1 2
Appendix B – Monthly Site Waste Report Template
Page 136
122 | P a g e E N G 4 1 1 2
Page 137
123 | P a g e E N G 4 1 1 2
Page 138
124 | P a g e E N G 4 1 1 2
Page 139
125 | P a g e E N G 4 1 1 2
Page 140
126 | P a g e E N G 4 1 1 2
Page 141
127 | P a g e E N G 4 1 1 2
Appendix C – RAS field sampling sheets
PROJECT: Wellcamp Airport Construction
OPERATION:Formwork installation
STUDY NO.: 1
STUDY TYPE: Random Activity Sample (RAS)
DATE: 8/10/2014
Start time: 8:00 Finnish Time: 11:45
WEATHER CONDITIONS:
Sunny, Low wind
NOTES:
Total workers: 17
Total plant: 4
ObservationsTime: Notes:
8:08 12 2 Excavator idle
8:22 9 1
8:55 8 1
9:07 10 0
9:53 10 1 Forklift
10:15 8 2
10:32 4 0 Smoko
11:25 12 1 Bobcat
11:40 8 1
Average: Average Utilisation: 38.97%
Labour working: Plant working:
52.94% 25.00%
Page 142
128 | P a g e E N G 4 1 1 2
PROJECT: Wellcamp Airport Construction
OPERATION:Concrete Paving
STUDY NO.: 2
STUDY TYPE: Random Activity Sample (RAS)
DATE: 8/10/2014
Start time: 8:00 Finnish Time: 11:45
WEATHER CONDITIONS:
Sunny, Low wind
NOTES:
Total workers: 10
Total plant: 1 (Paver)
ObservationsTime: Notes:
8:08 8 1
8:21 4 0 Waiting for trucks
8:55 5 1
9:07 7 1
9:53 4 0 Paver setting up
10:15 2 1 Paver starting
10:32 8 1
11:25 9 1
11:40 7 1
Average: Average Utilisation: 68.89%
Labour working: Plant working:
60.00% 77.78%
Page 143
129 | P a g e E N G 4 1 1 2
PROJECT: Wellcamp Airport Construction
OPERATION:Hand Pours
STUDY NO.: 3
STUDY TYPE: Random Activity Sample (RAS)
DATE: 16/09/2014
Start time: 10:05 Finnish Time: 15:15
WEATHER CONDITIONS:
Fine and sunny
NOTES:
1 boral truck contracted in for cartage
Total workers: 7
Total plant: 0
ObservationsTime: Notes:
10:05 0 Waiting for truck
10:20 2 Pouring concrete
10:45 2
11:30 4 Vibrating concrete
11:51 5 3rd vibrator needed
12:15 4
12:52 3
13:05 3
13:21 4 Screeding surface
13:35 3
13:55 2 Brooming
14:12 2
14:42 4
14:55 4
15:10 2
Average: Average Utilisation: 42.86%
Labour working: Plant working:
42.86%
Page 144
130 | P a g e E N G 4 1 1 2
PROJECT: Wellcamp Airport Construction
OPERATION:Formwork
STUDY NO.: 4
STUDY TYPE: Random Activity Sample (RAS)
DATE: 14/10/2014
Start time: 8:45 Finnish Time: 13:55
WEATHER CONDITIONS:
Overcast
NOTES:
Total workers: 12
Total plant: 4 (Paver)
ObservationsTime: Notes:
8:49 8 3
9:05 7 2
9:15 6 2
10:04 6 1
11:18 7 2
11:25 8 1
11:37 4 1
11:47 3 2
11:53 4 1
12:02 5 2
12:30 8 2
12:49 5 3
12:54 6 1
13:06 2 3
13:40 6 1
Average: Average Utilisation: 46.73%
Labour working: Plant working:
47.02% 46.43%
Page 145
131 | P a g e E N G 4 1 1 2
PROJECT: Wellcamp Airport Construction
OPERATION:Paving
STUDY NO.: 5
STUDY TYPE: Random Activity Sample (RAS)
DATE: 14/10/2014
Start time: 8:45 Finnish Time: 14:00
WEATHER CONDITIONS:
Overcast
NOTES:
Total workers: 10
Total plant: 1
ObservationsTime: Notes:
8:50 7 1
9:05 7 1
9:14 6 1
10:04 3 0 Cleaning and resetting
11:27 7 1
11:37 5 1
11:47 8 1
11:53 0 0 Truck not arrived
12:02 8 1
12:30 0 0 Truck not arrived
12:49 4 1
12:54 1 0 Truck not arrived
13:06 7 1
13:40 5 0 End of paving
Average: Average Utilisation: 56.43%
Labour working: Plant working:
48.57% 64.29%
Page 146
132 | P a g e E N G 4 1 1 2
Appendix D – Questionnaire Feedback Forms
Page 147
133 | P a g e E N G 4 1 1 2
Page 148
134 | P a g e E N G 4 1 1 2
Page 149
135 | P a g e E N G 4 1 1 2
Page 150
136 | P a g e E N G 4 1 1 2
Page 151
137 | P a g e E N G 4 1 1 2
Page 152
138 | P a g e E N G 4 1 1 2
Page 153
139 | P a g e E N G 4 1 1 2
Page 154
140 | P a g e E N G 4 1 1 2
Page 155
141 | P a g e E N G 4 1 1 2
Page 156
142 | P a g e E N G 4 1 1 2
Page 157
143 | P a g e E N G 4 1 1 2
Page 158
144 | P a g e E N G 4 1 1 2
Page 159
145 | P a g e E N G 4 1 1 2
Page 160
146 | P a g e E N G 4 1 1 2
Page 161
147 | P a g e E N G 4 1 1 2
Page 162
148 | P a g e E N G 4 1 1 2
Reference List
Abeysekera, V 2009, 'Production Management Perspectives, Module 8: Exploring Construction Production Management Perspectives'.
Abeysekera, V 2009, 'Production Management Perspectives, Module 11:Time and Cost from a Production Management Perspective'.
Aurizon 2014, Construction Waste and Spoil Management Plan, NSW Long Term Train Support Facility (Hexham).
Ballard, HG 2000, 'The last planner system of production control', the University of Birmingham.
Bertelsen, S & Koskela, L 2002, 'Managing the three aspects of production in construction', IGLC-10, Gramado, Brazil.
Braglia, M, Carmignani, G & Zammori, F 2006, 'A new value stream mapping approach for complex production systems', International journal of production research, vol. 44, no. 18-19, pp. 3929-52.
Choo, HJ 2003, 'Distributed planning and coordination to support lean construction', Citeseer.
coal, X 2014, Newlands Coal Extension Project EIS, Chapter 8 Waste.
Dunlop, P & Smith, S 2003, 'Estimating key characteristics of the concrete delivery and placement process using linear regression analysis', Civil Engineering and Environmental Systems, vol. 20, no. 4, pp. 273-90.
Faniran, O & Caban, G 1998, 'Minimizing waste on construction project sites', Engineering, Construction and Architectural Management, vol. 5, no. 2, pp. 182-8.
Formoso, CT, Isatto, EL & Hirota, EH 1999, 'Method for waste control in the building industry', in Proceedings IGLC: proceedings of theProceedings IGLC p. 325.
HARRIS, FAM, R. 2006, HARRIS, F. AND MCCAFFER, R., 6th edn, Blackwell Science Ltd, UK.
Hines, P & Rich, N 1997, 'The seven value stream mapping tools', International journal of operations & production management, vol. 17, no. 1, pp. 46-64.
Page 163
149 | P a g e E N G 4 1 1 2
Kamardeen, I 2010, '8D BIM modelling tool for accident prevention through design', in 26th Annual ARCOM Conference: proceedings of the26th Annual ARCOM Conference Association of Researchers in Construction Management, pp. 281-9.
Koskela, L 1997, 'Lean production in construction', Lean Construction, pp. 1-9.
LCI 2014, What is Lean Construction?, Lean Construction Institute - Australia, Crows Nest, NSW, <http://www.leanconstruction.org.au/pages/what-is-lean-construction.html>.
Lee, S-H, Diekmann, JE, Songer, AD & Brown, H 1999, 'Identifying waste: applications of construction process analysis', in Proceedings of the Seventh Annual Conference of the International Group for Lean Construction: proceedings of theProceedings of the Seventh Annual Conference of the International Group for Lean Construction pp. 63-72.
Lin, K-L & Haas, CT 1996, 'An interactive planning environment for critical operations', Journal of construction engineering and management, vol. 122, no. 3, pp. 212-22.
Ma, Z, Shen, Q & Zhang, J 2005, 'Application of 4D for dynamic site layout and management of construction projects', Automation in Construction, vol. 14, no. 3, pp. 369-81.
Ngoc, Q 2014, Project Management: Key Performance Indicators, LinkedIn Corporation, 18-7-14.
Oxford, Uo 2013, The Key Performance Indicator Evaluation Process (KPI Process), University of Oxford.
Piscopo, M 2013, Project Status Report Template, Capital, Inc, <http://www.projectmanagementdocs.com/project-controlling-templates/project-status-report.html>.
Popov, V, Juocevicius, V, Migilinskas, D, Ustinovichius, L & Mikalauskas, S 2010, 'The use of a virtual building design and construction model for developing an effective project concept in 5D environment', Automation in Construction, vol. 19, no. 3, pp. 357-67.
Sharma, SK 2013, 'Broken Promises - How reliable is project management vis-a-vis time management?', University of Southern Queensland.
Zhang, J, Ma, Z & Pu, C 2001, '4D visualization of construction site management', in Information Visualisation, 2001. Proceedings. Fifth International Conference on: proceedings of theInformation Visualisation, 2001. Proceedings. Fifth International Conference on IEEE, pp. 382-7.
Page 164
150 | P a g e E N G 4 1 1 2
Bibliography
Abeysekera, V. (2009). "Production Management Perspectives, Module 12:Managing Costs from a
Production Management Perspective."
Alarcón, L. F., et al. (2005). Assessing the impacts of implementing lean construction. 13th
International Group for Lean Construction Conference: Proceedings, International Group on Lean
Construction.
Ballard, G., et al. (2003). "Learning to see work flow: an application of lean concepts to precast
concrete fabrication." Engineering, Construction and Architectural Management 10(1): 6-14.
Ballard, G. and G. Howell (1994). "Implementing lean construction: stabilizing work flow." Lean
Construction.
Bassioni, H., et al. (2004). "Performance measurement in construction." Journal of management in
engineering 20(2): 42-50.
Bossink, B. and H. Brouwers (1996). "Construction waste: quantification and source evaluation."
Journal of construction engineering and management 122(1): 55-60.
Dainty, A. R. and R. J. Brooke (2004). "Towards improved construction waste minimisation: a need
for improved supply chain integration?" Structural Survey 22(1): 20-29.
Dunlop, P. and S. D. Smith (2004). "Planning, estimation and productivity in the lean concrete pour."
Engineering, Construction and Architectural Management 11(1): 55-64.
Fearne, A. and N. Fowler (2006). "Efficiency versus effectiveness in construction supply chains: the
dangers of “lean” thinking in isolation." Supply chain management: An international journal 11(4):
283-287.
Formoso, C. T., et al. (2002). "Material waste in building industry: main causes and prevention."
Journal of construction engineering and management 128(4): 316-325.
GOMACO (2012). GP-4000 Slipform paver. Witney, England, GOMACO International Ltd.
Hilsey, A. F. (1981). Multi-purpose precast concrete panels, and methods of constructing concrete
structures employing the same, Google Patents.
Lingard, H., et al. (2001). "Improving solid waste reduction and recycling performance using goal
setting and feedback." Construction Management & Economics 19(8): 809-817.
Page 165
151 | P a g e E N G 4 1 1 2
Llatas, C. (2011). "A model for quantifying construction waste in projects according to the European
waste list." Waste management 31(6): 1261-1276.
Love, P. E. and H. Li (2000). "Quantifying the causes and costs of rework in construction."
Construction Management & Economics 18(4): 479-490.
Mcdonald, B. and M. Smithers (1998). "Implementing a waste management plan during the
construction phase of a project: a case study." Construction Management & Economics 16(1): 71-
Pheng, L. S. and C. J. Chuan (2001). "Just-in-time management of precast concrete components."
Journal of construction engineering and management 127(6): 494-501.
Picchi, F. A. and A. D. Granja (2004). Construction sites: using lean principles to seek broader
implementations. 12 th Conference of the International Group for lean Construction.
Salem, O., et al. (2006). "Lean construction: from theory to implementation." Journal of
management in engineering 22(4): 168-175.
Serpell, A., et al. (1995). "Characterization of waste in building construction projects." Lean
Construction: 67-78.
Sugimori, Y., et al. (1977). "Toyota production system and kanban system materialization of just-in-
time and respect-for-human system." The International Journal of Production Research 15(6): 553-
564.
Tam, V. W. (2009). "Comparing the implementation of concrete recycling in the Australian and
Japanese construction industries." Journal of Cleaner Production 17(7): 688-702.
Tam, V. W. and C. Tam (2008). "Waste reduction through incentives: a case study." Building
Research & Information 36(1): 37-43.
Tantisevi, K. and B. Akinci (2009). "Transformation of a 4D product and process model to generate
motion of mobile cranes." Automation in Construction 18(4): 458-468.
Teo, M. and M. Loosemore (2001). "A theory of waste behaviour in the construction industry."
Construction Management & Economics 19(7): 741-751.
Teo, M. and M. Loosemore (2001). "A theory of waste behaviour in the construction industry."
Construction Management & Economics 19(7): 741-751.
Page 166
152 | P a g e E N G 4 1 1 2
Tommelein, I. D. and A. Li (1999). Just-in-time concrete delivery: mapping alternatives for vertical
supply chain integration. Proceedings IGLC.
UNSW (2013). "HS Risk Management Form - Working in an office environment." University of New
South Wales.
Vrijhoef, R. and L. Koskela (2000). "The four roles of supply chain management in construction."
European Journal of Purchasing & supply management 6(3): 169-178.
Yost, P. A. and J. M. Halstead (1996). "A methodology for quantifying the volume of construction
waste." Waste management & research 14(5): 453-461.
Zayed, T., et al. (2008). "Slip-form application to concrete structures." Journal of construction
engineering and management 134(3): 157-168.


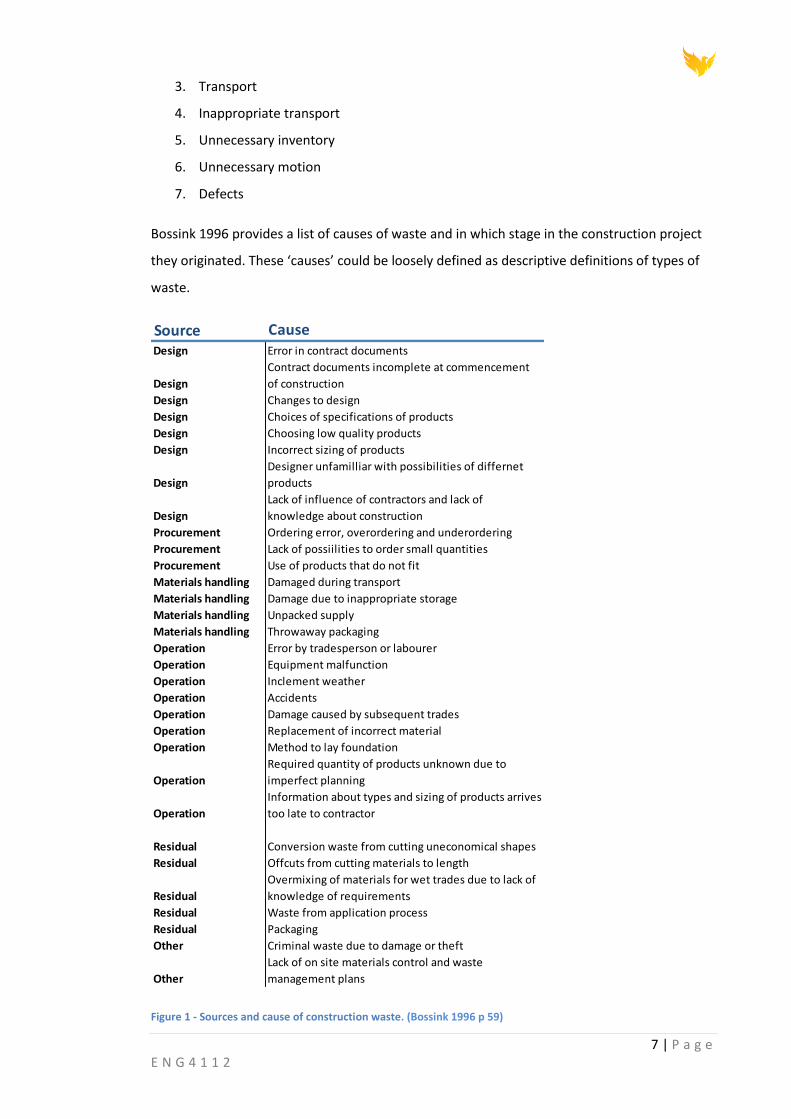


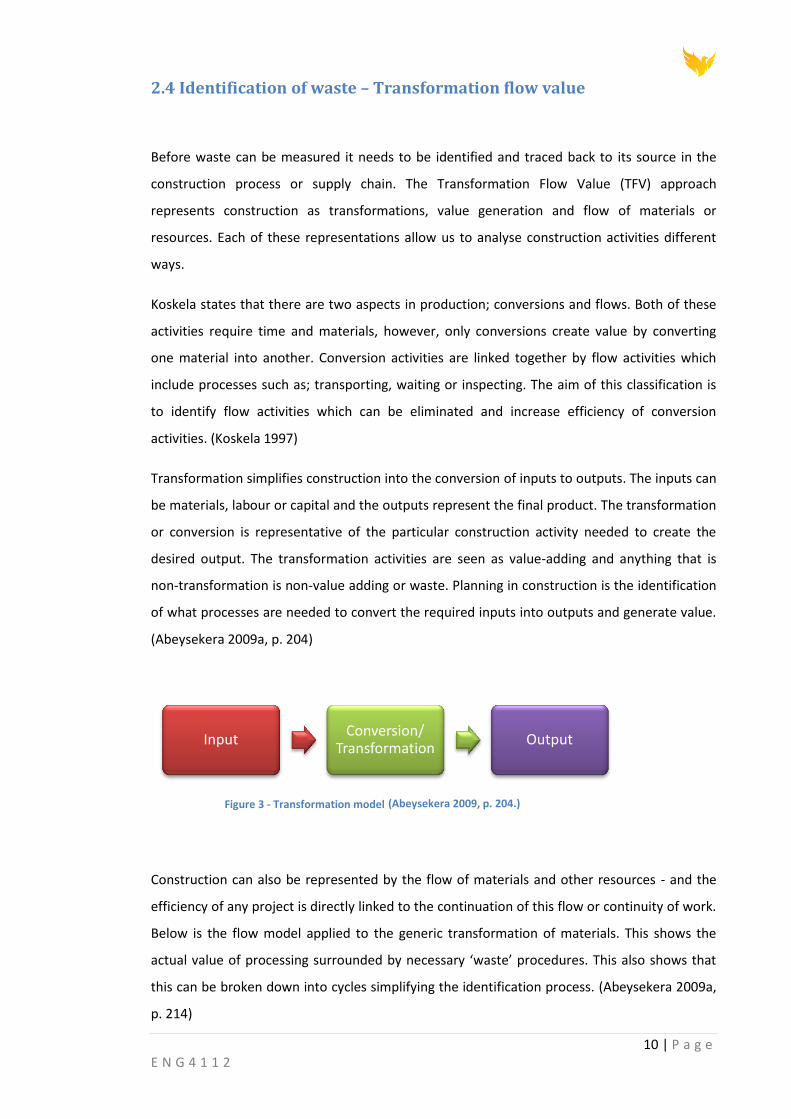


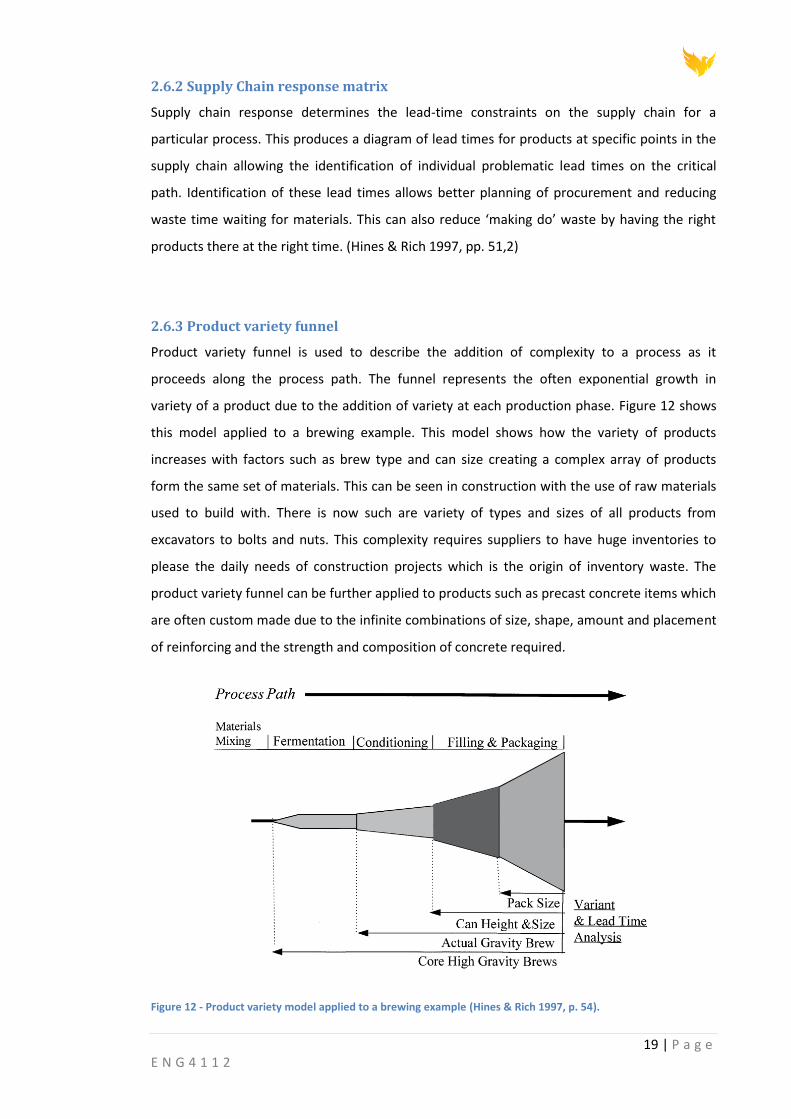


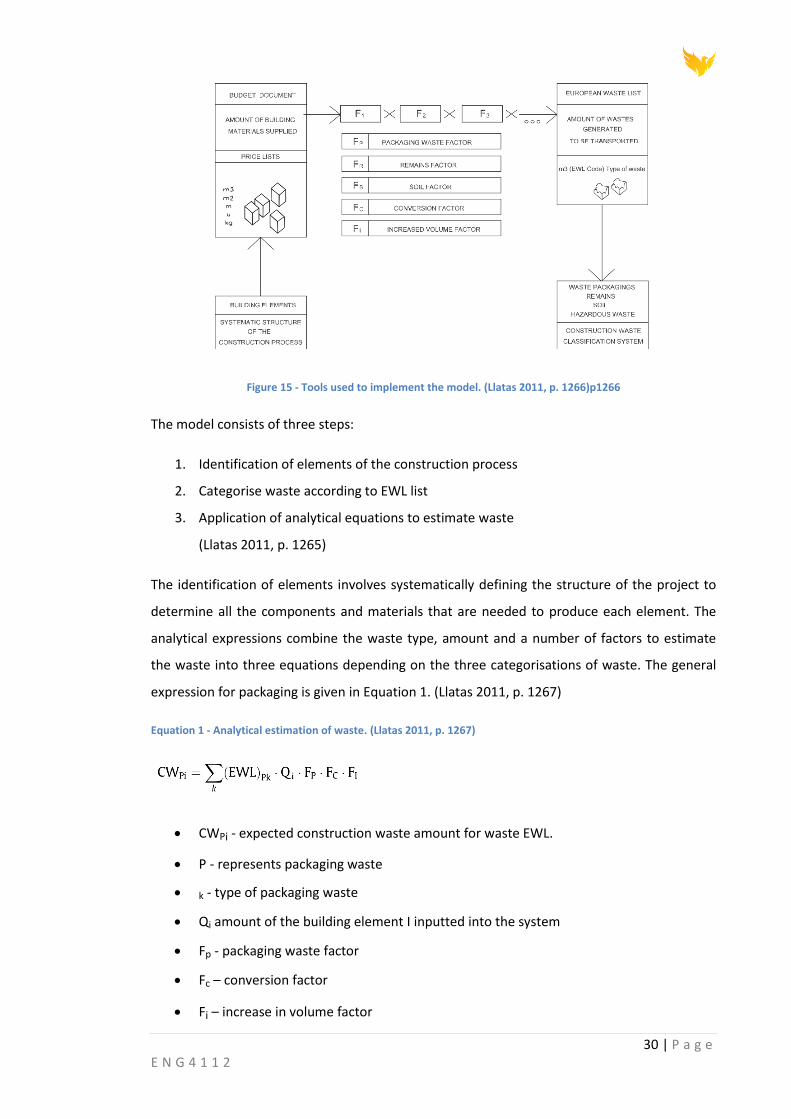


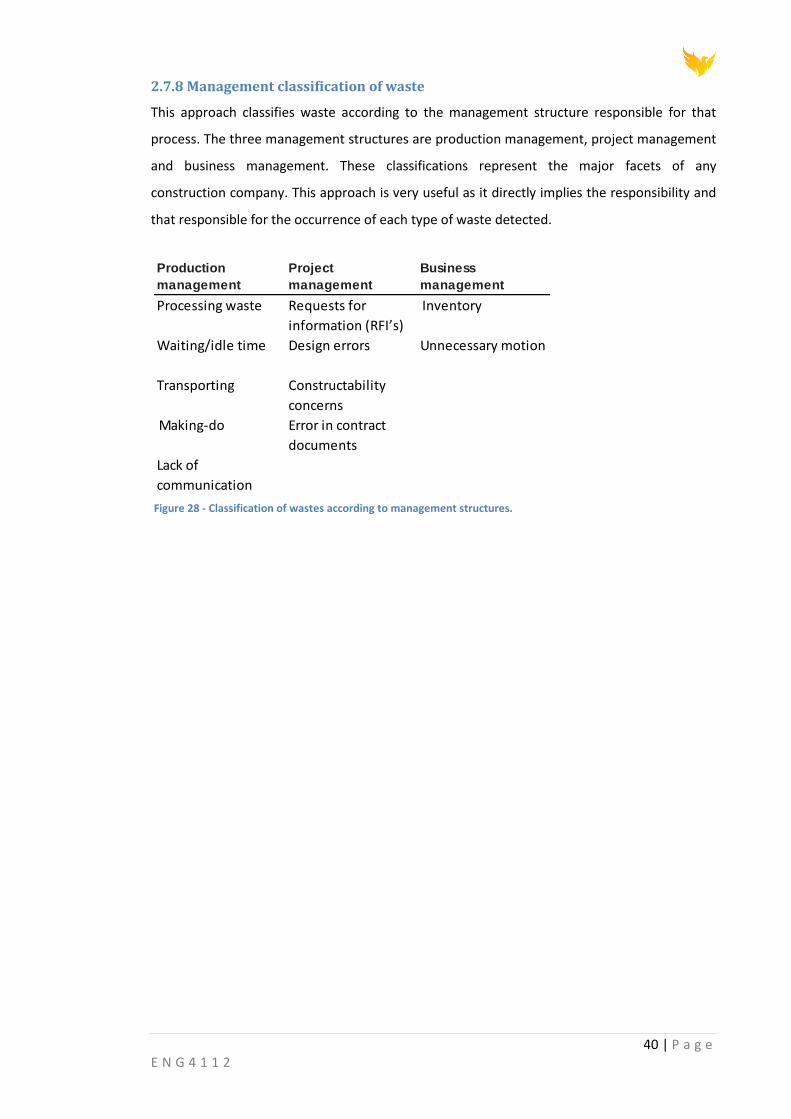


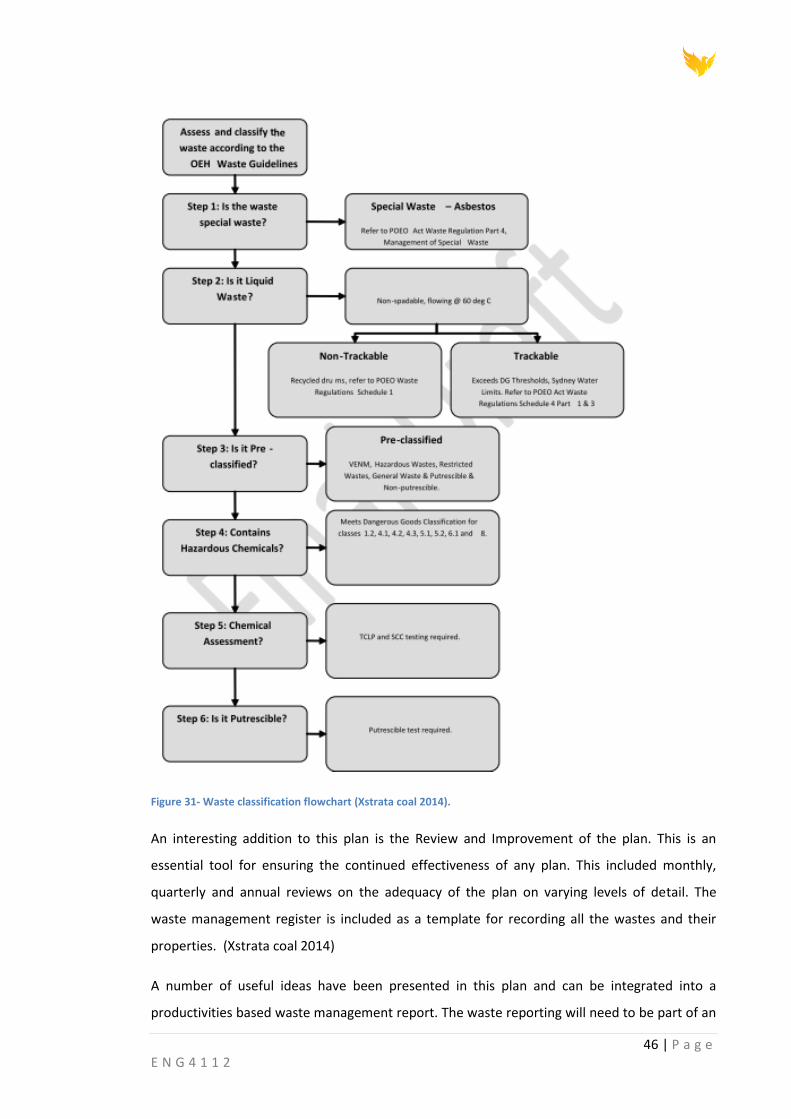


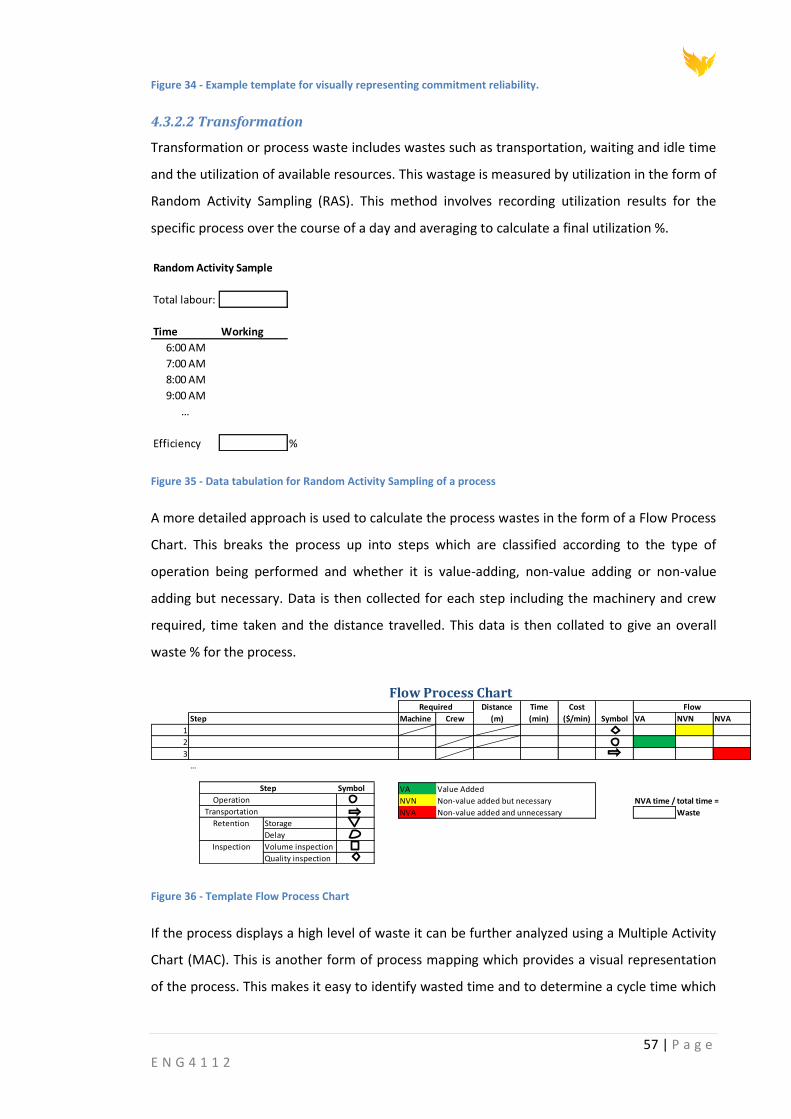
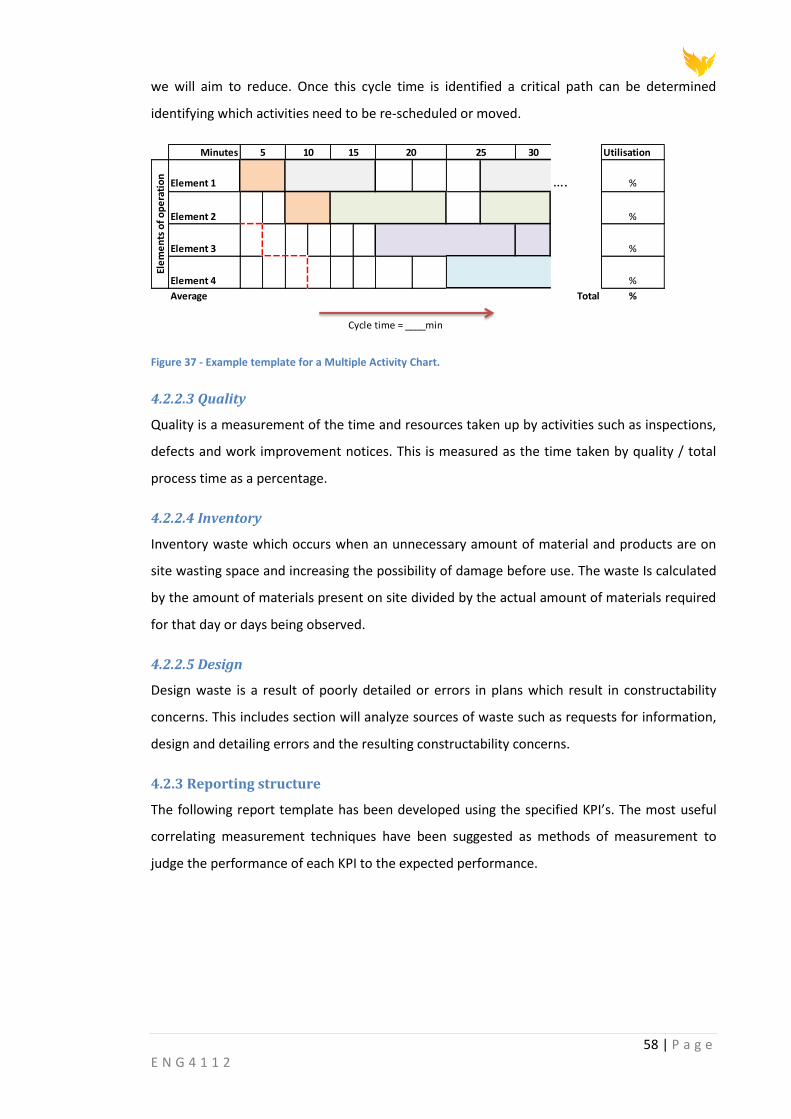
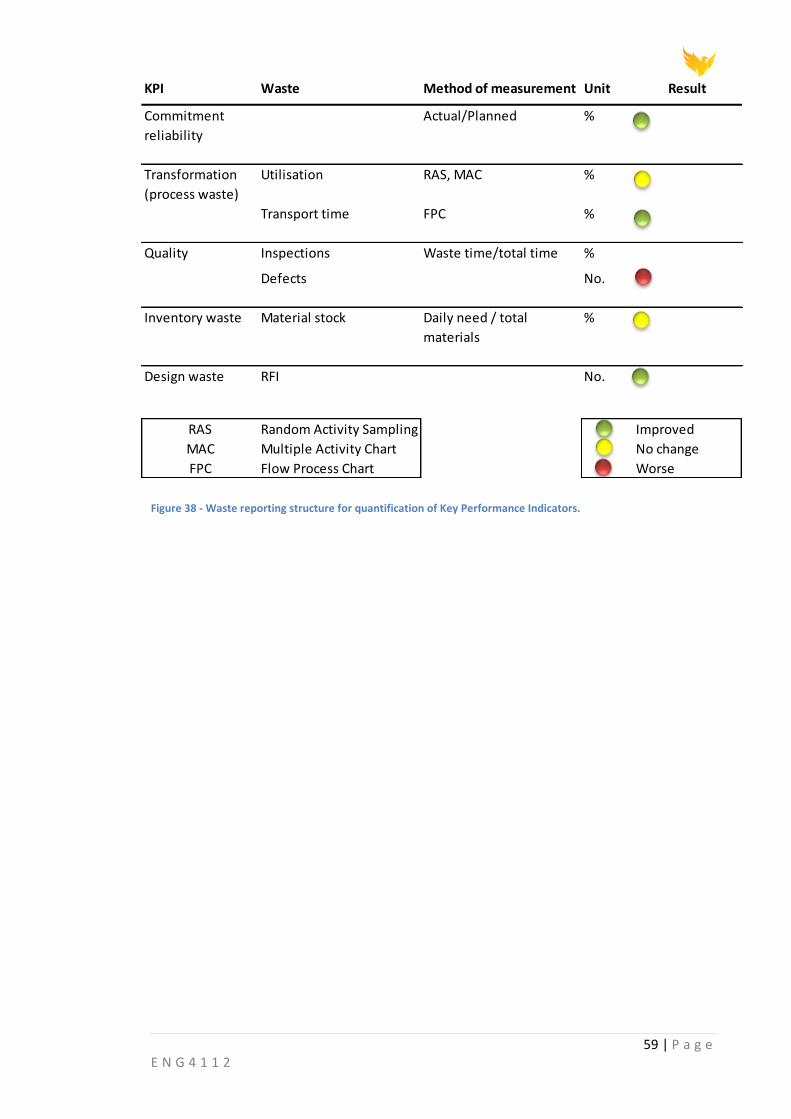


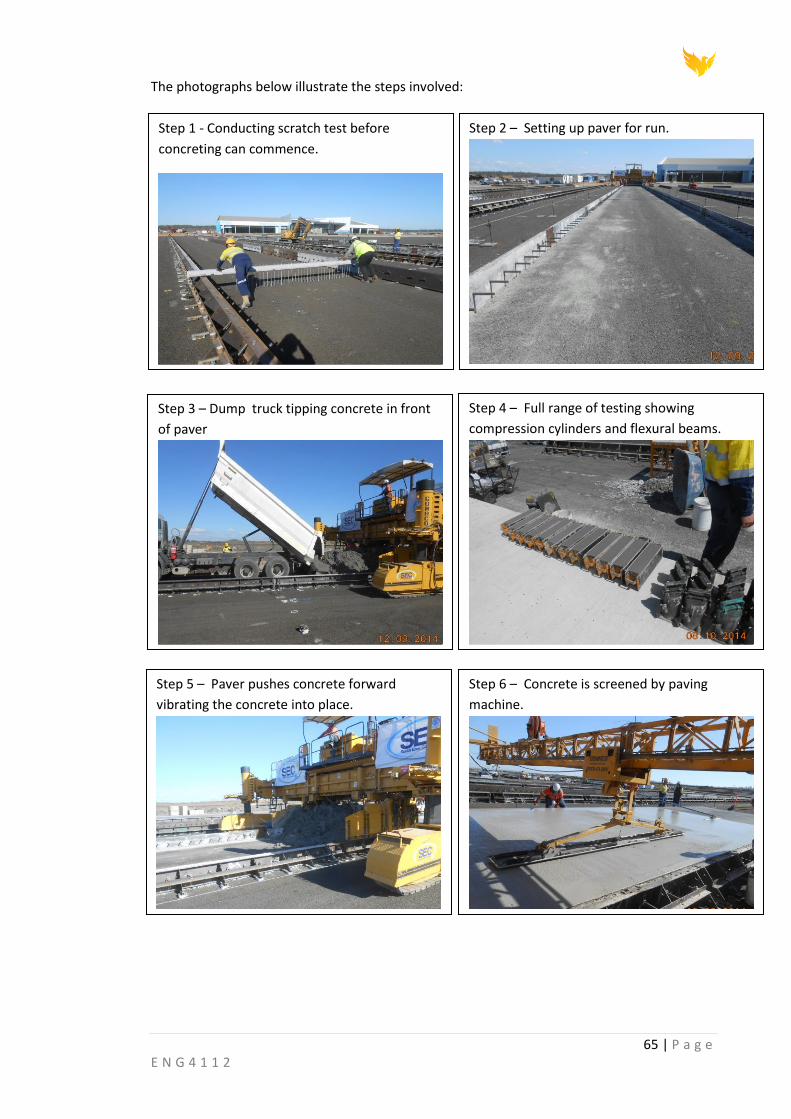
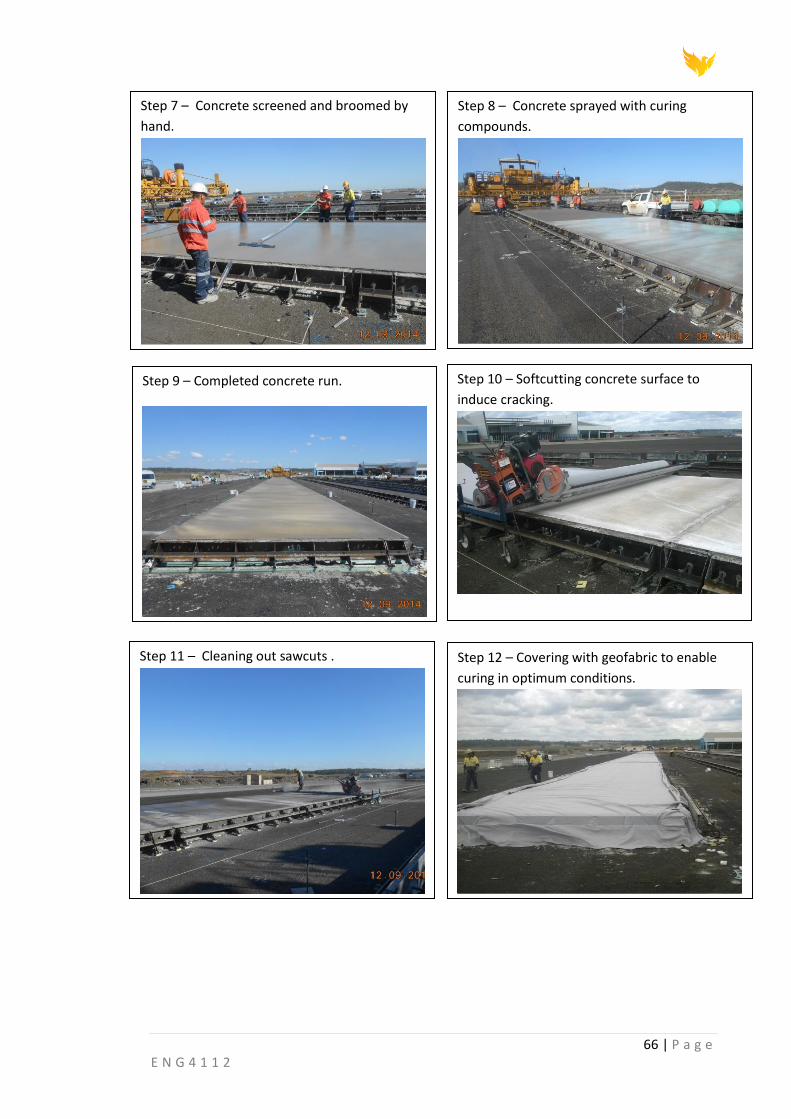


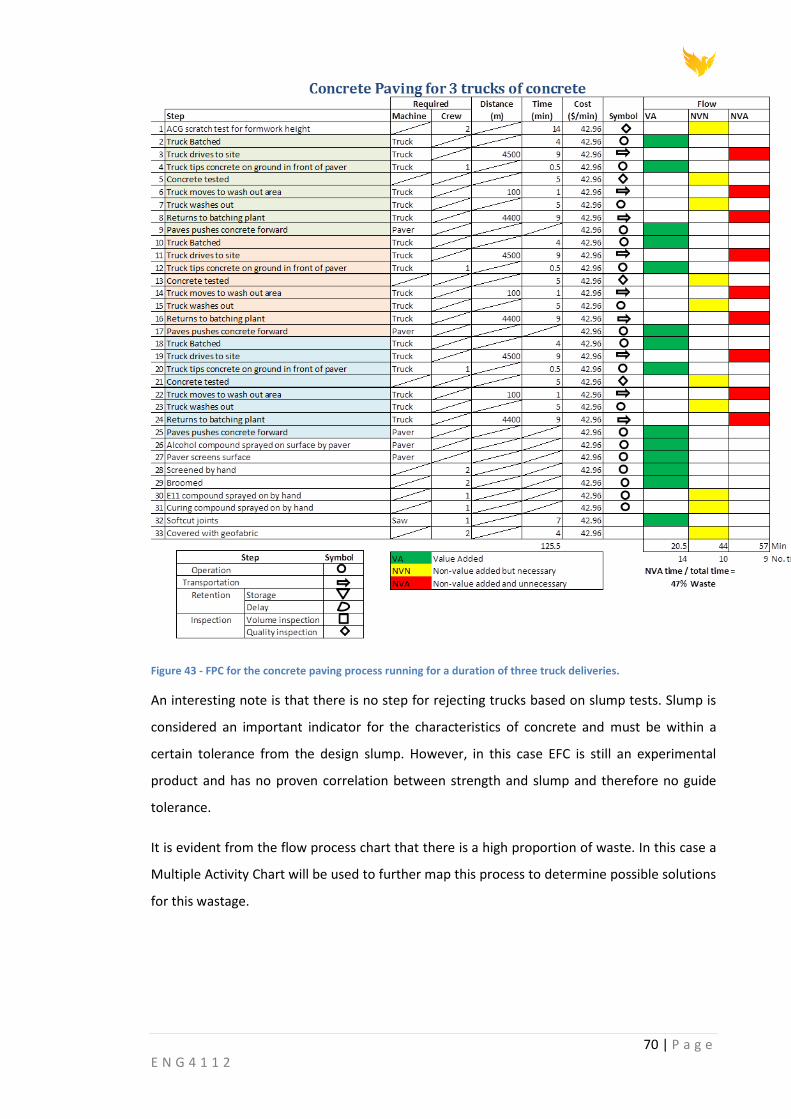

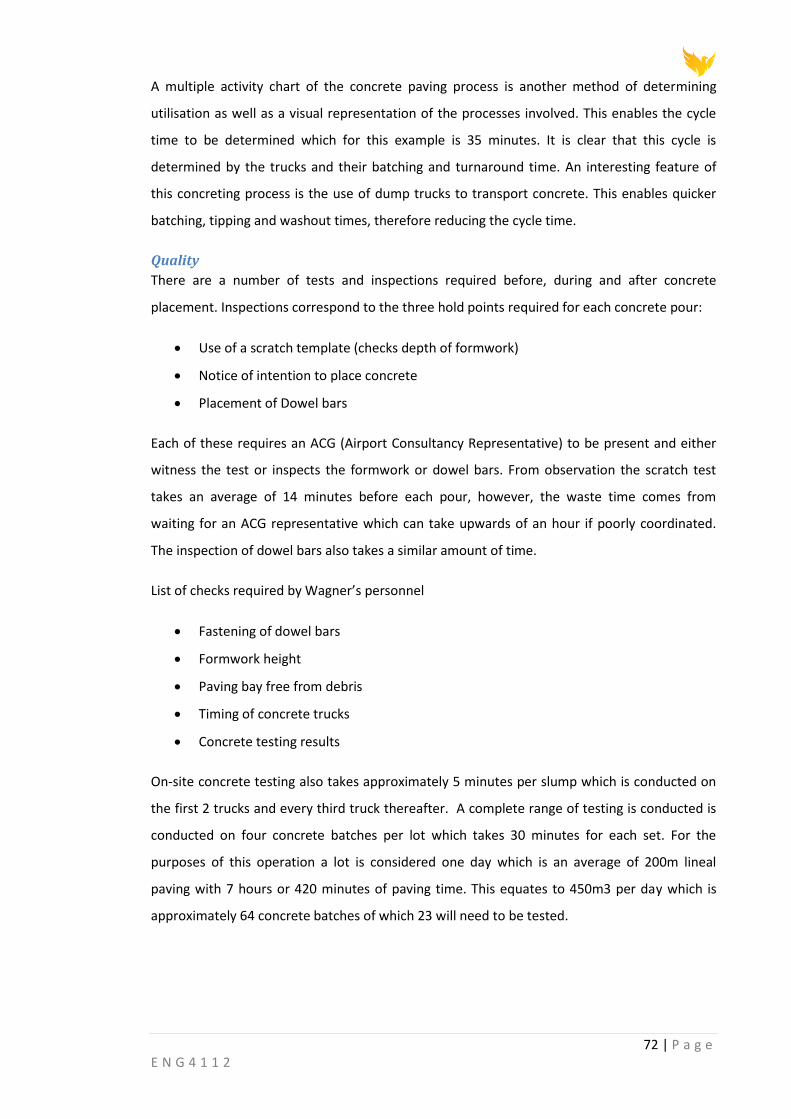
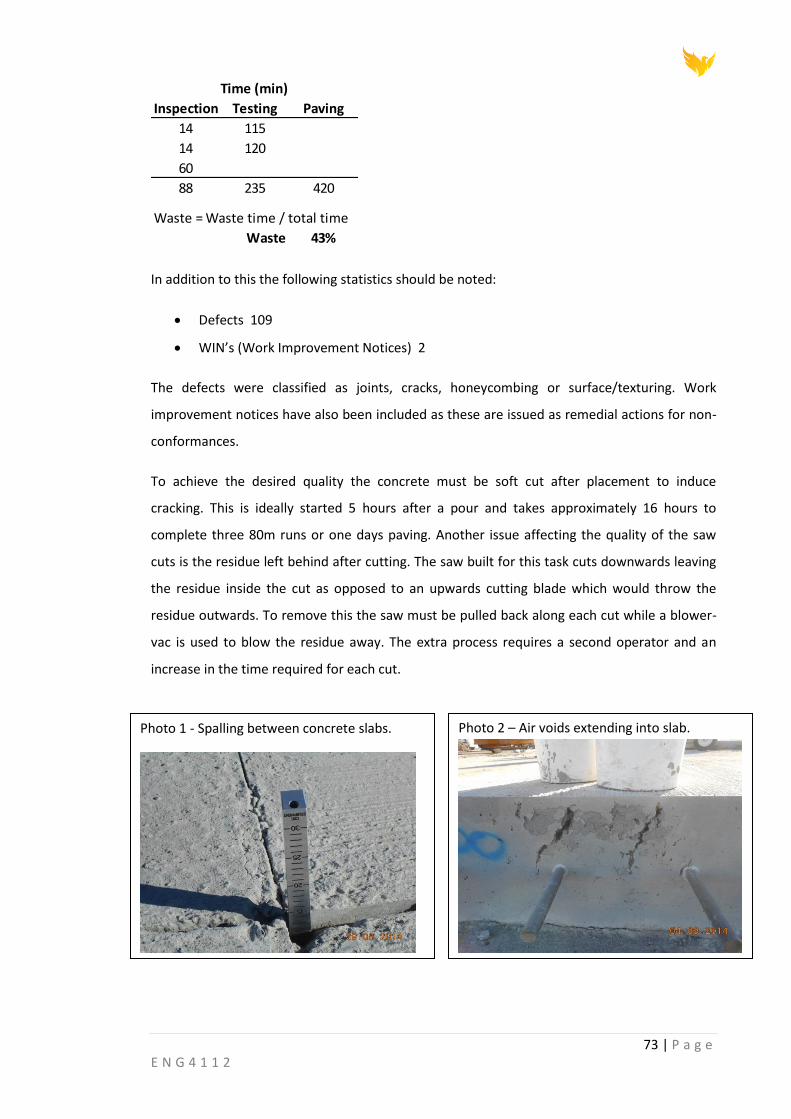
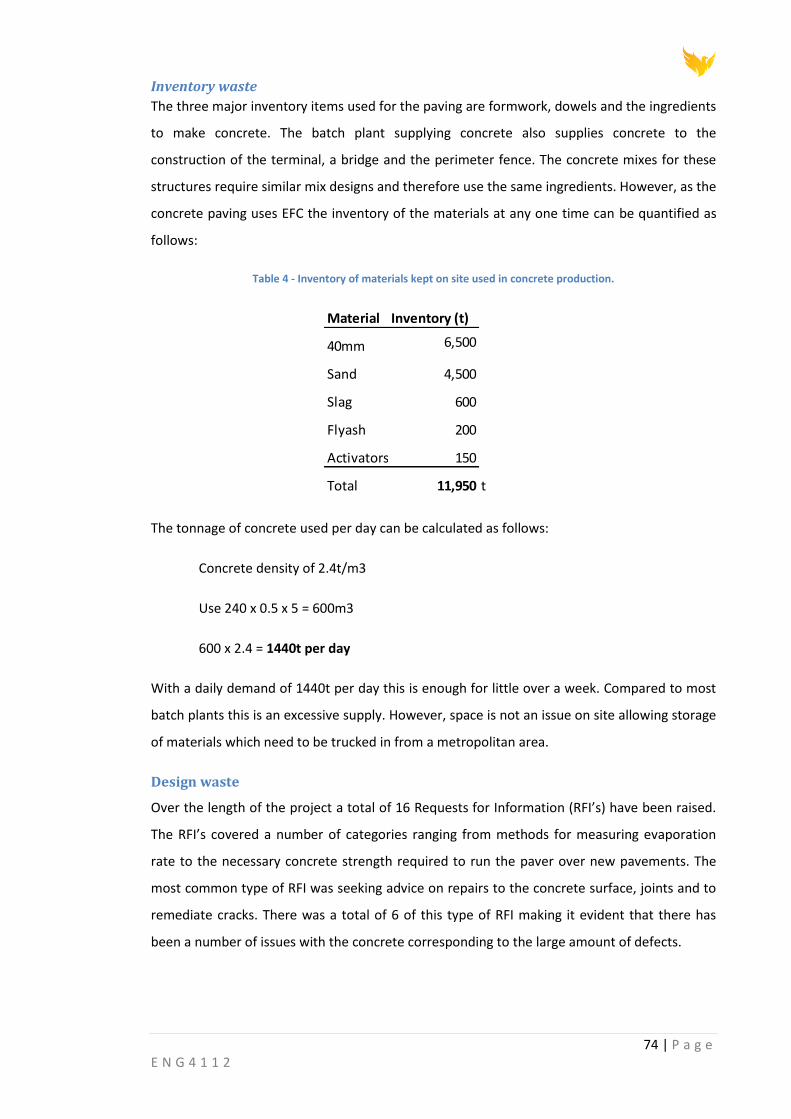
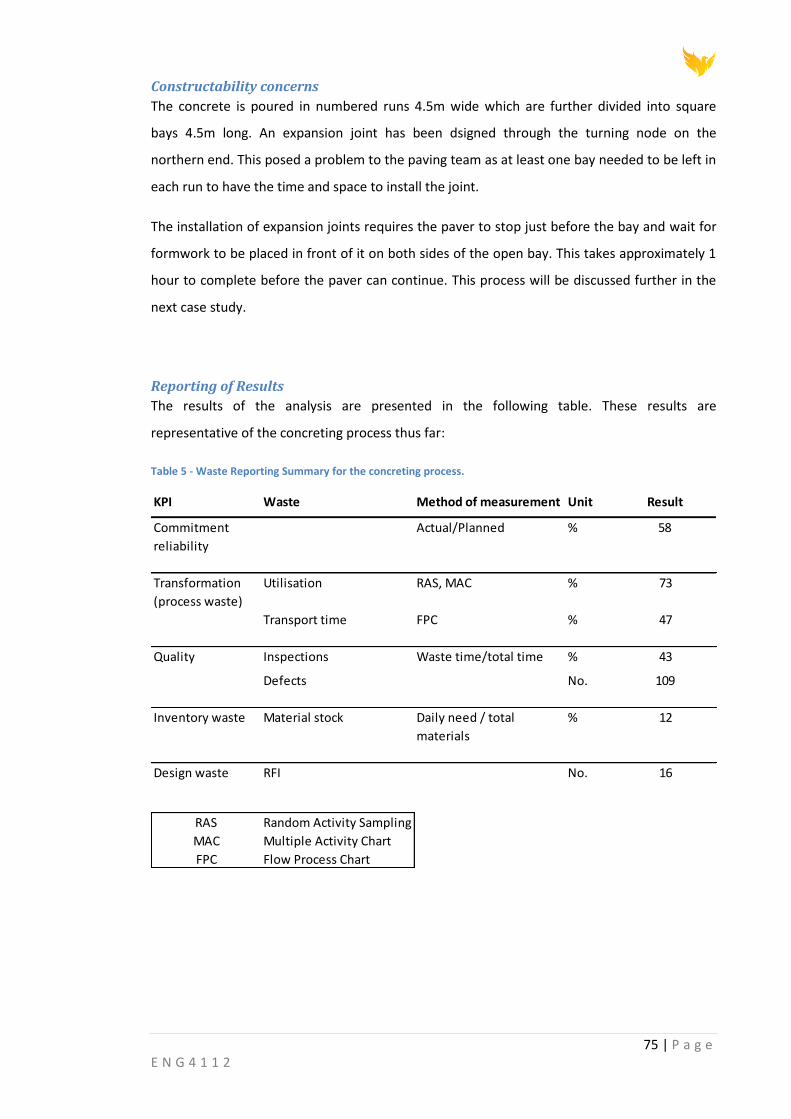

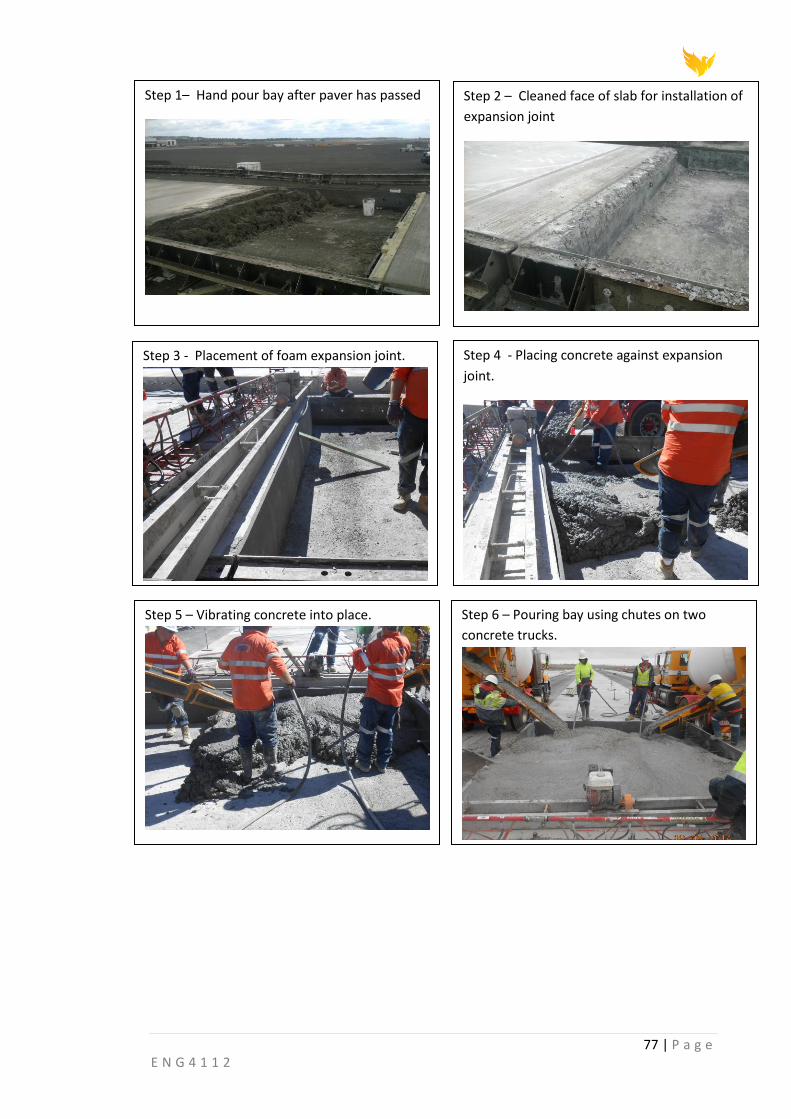


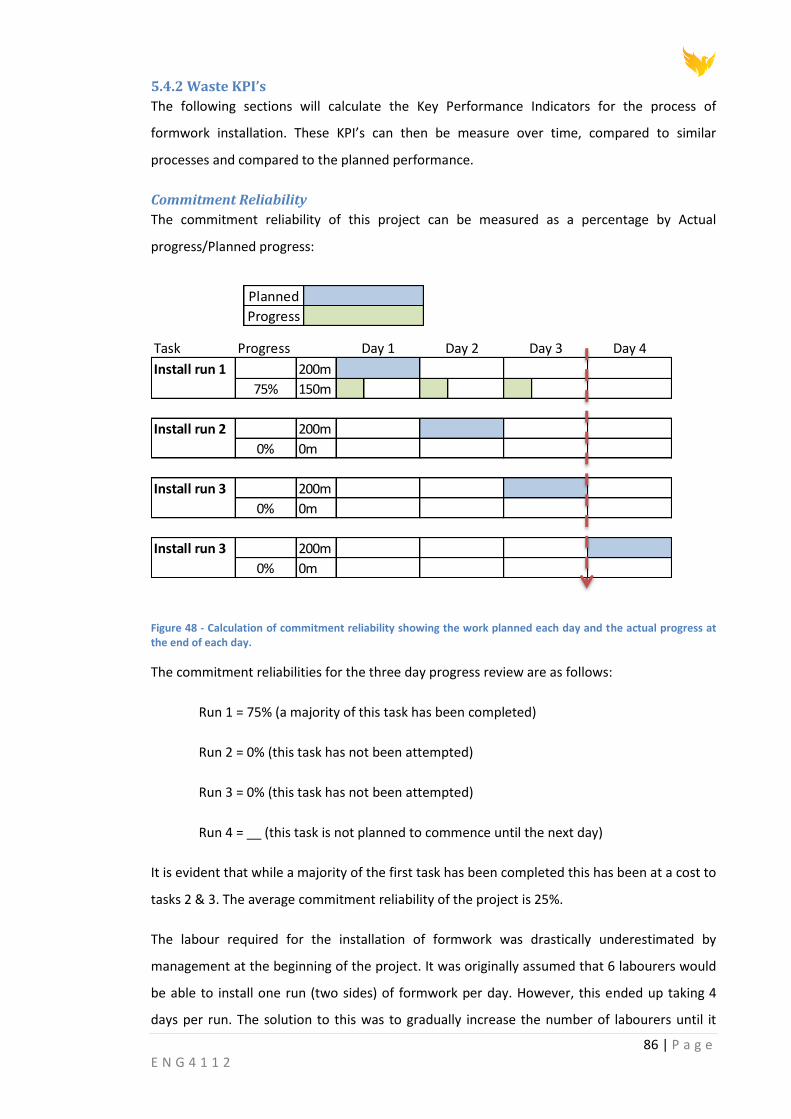


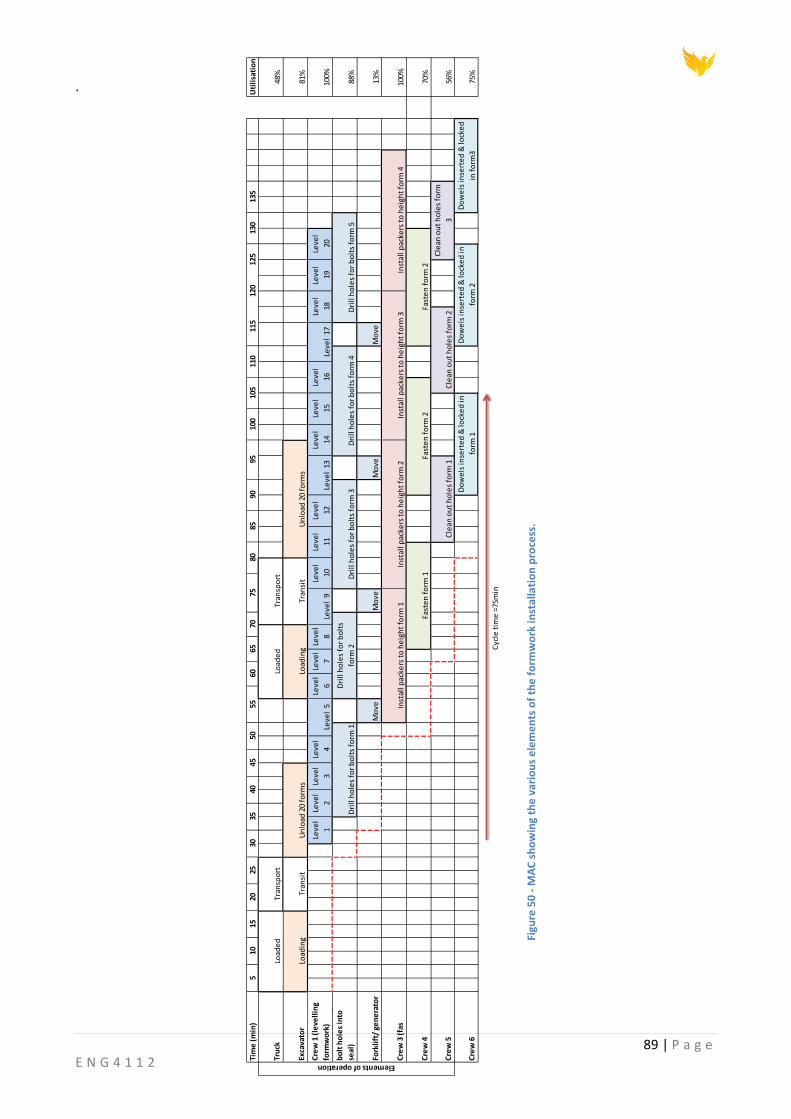


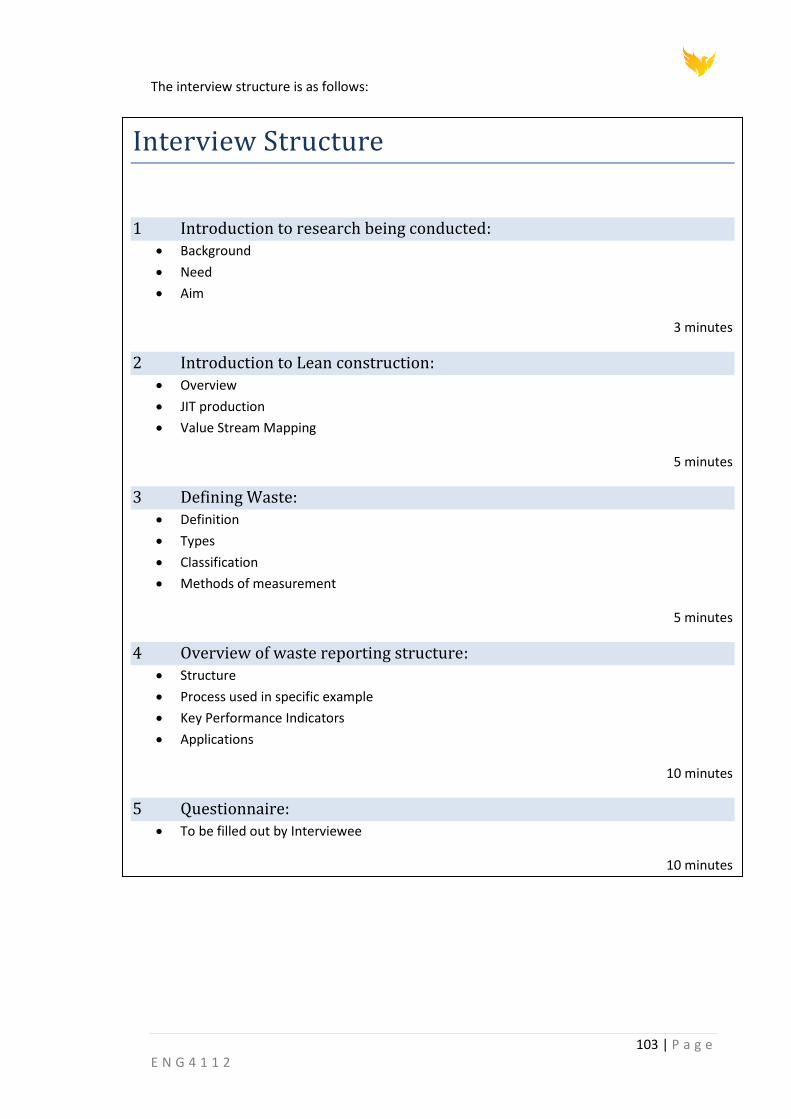


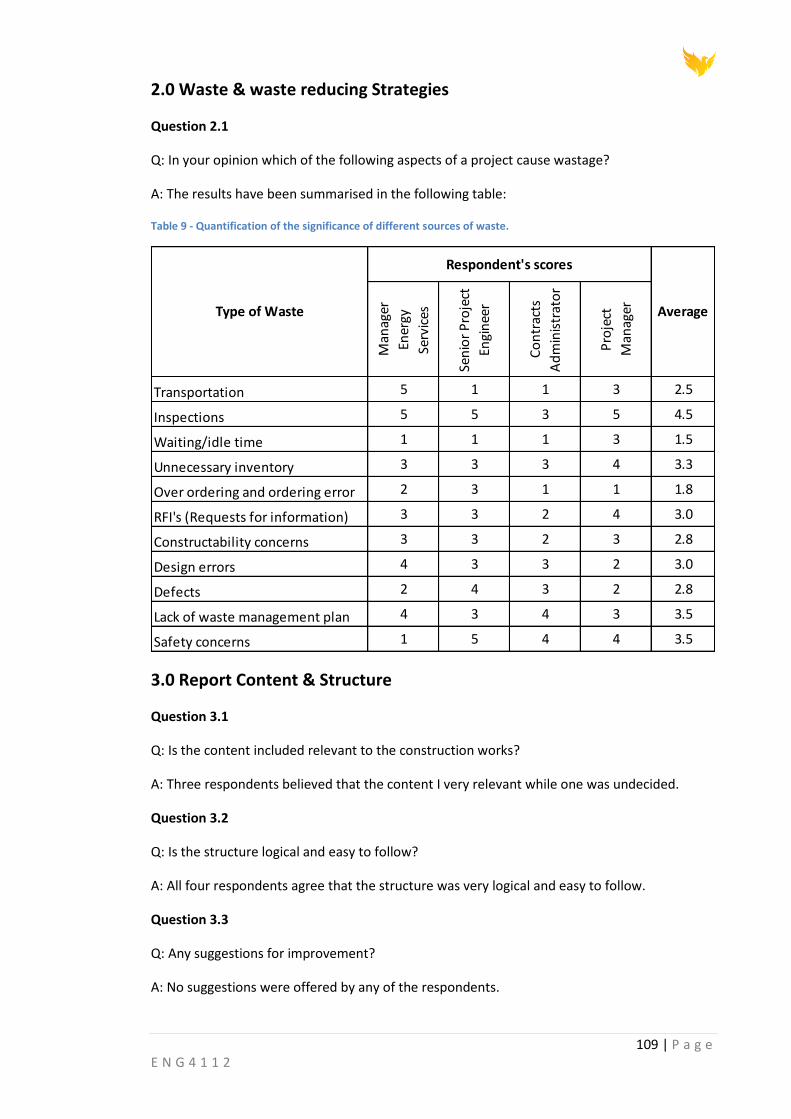


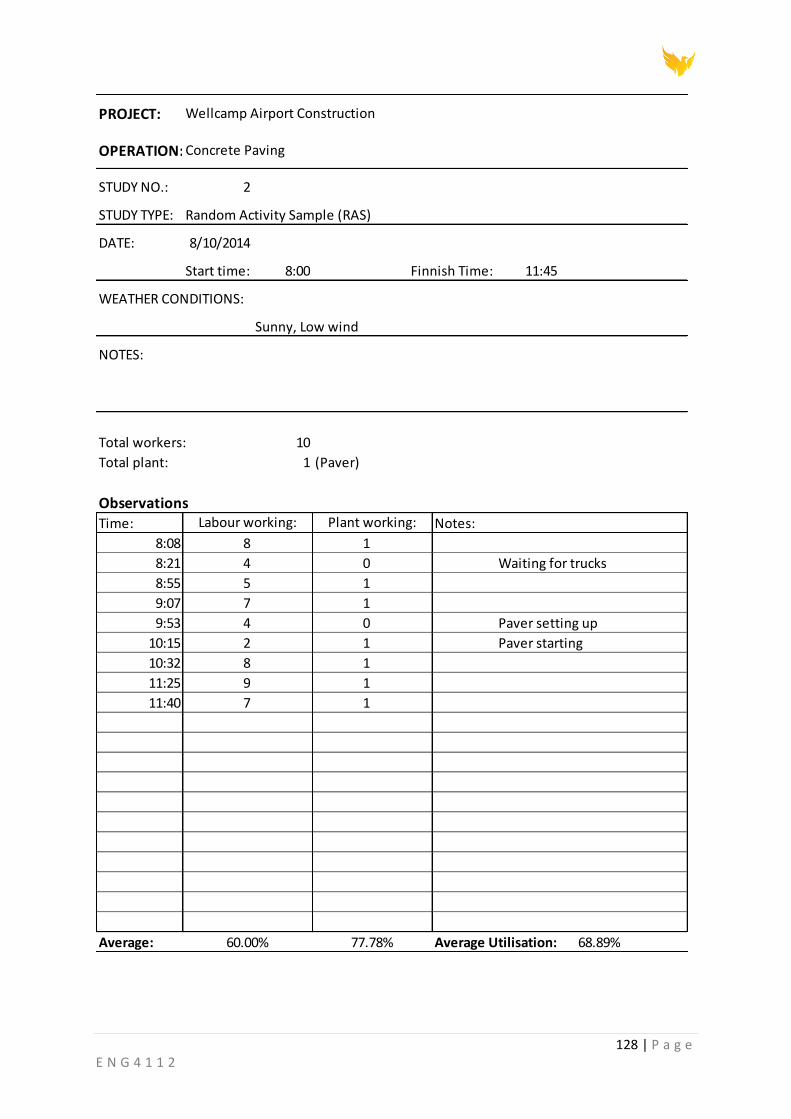
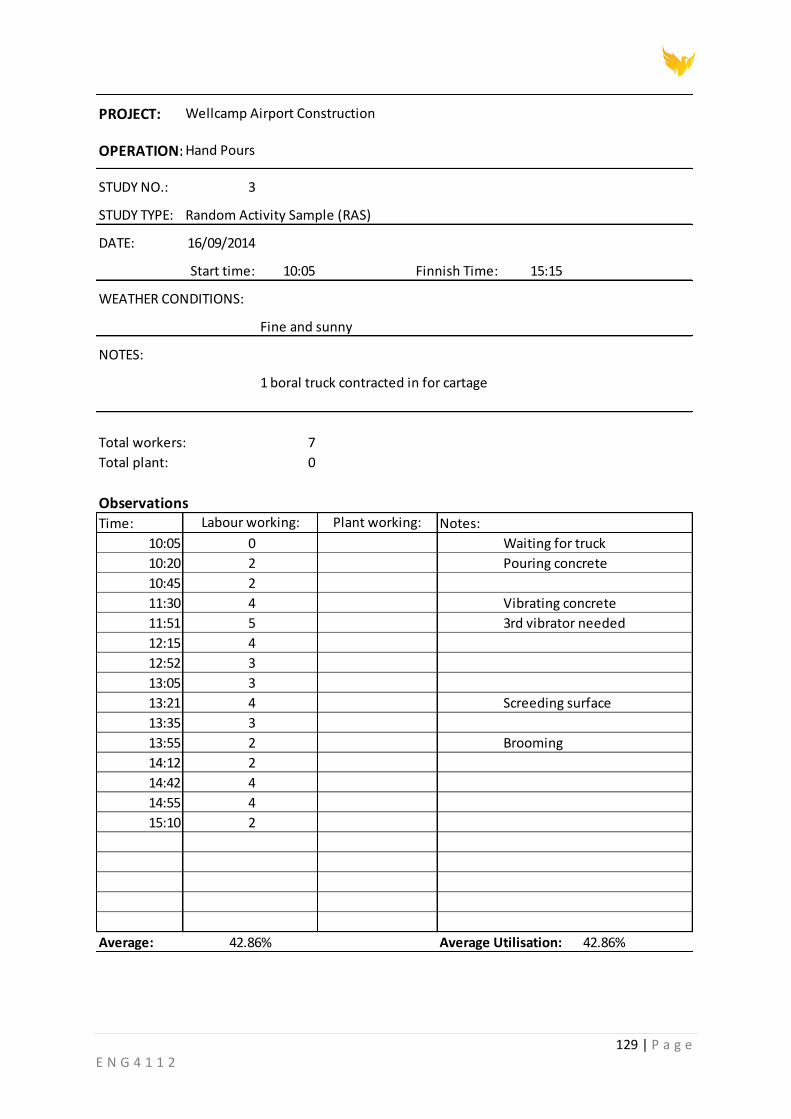
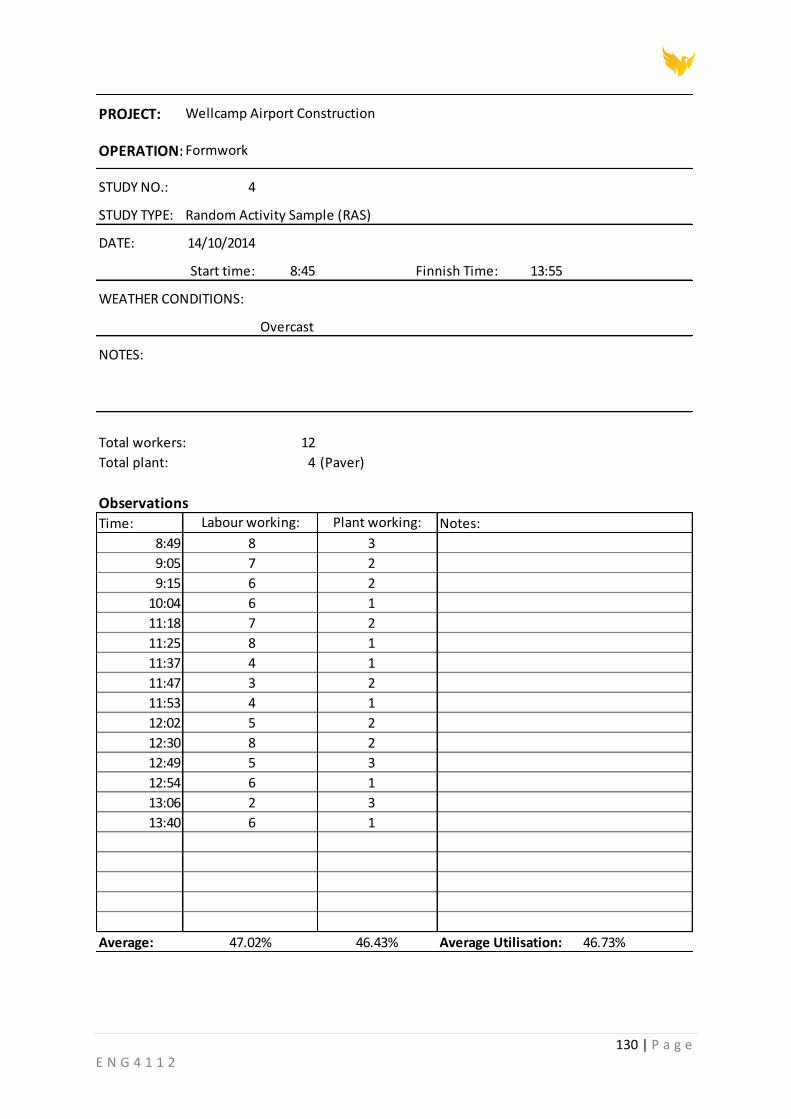


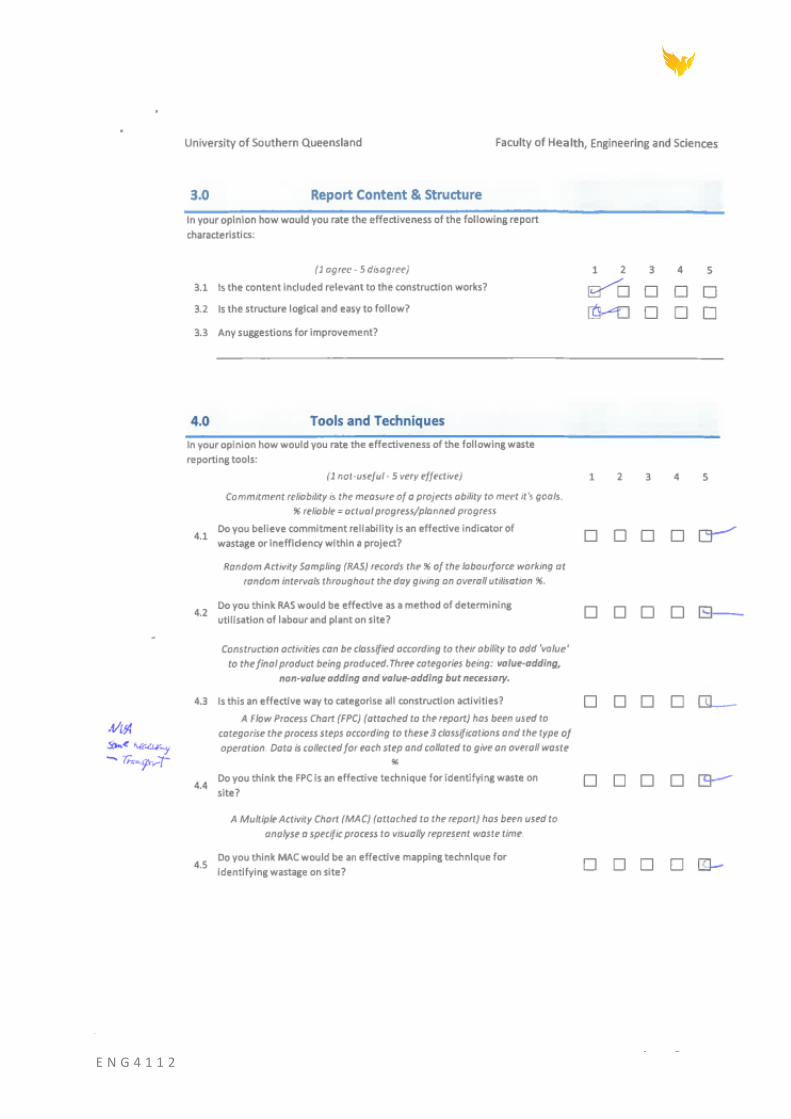

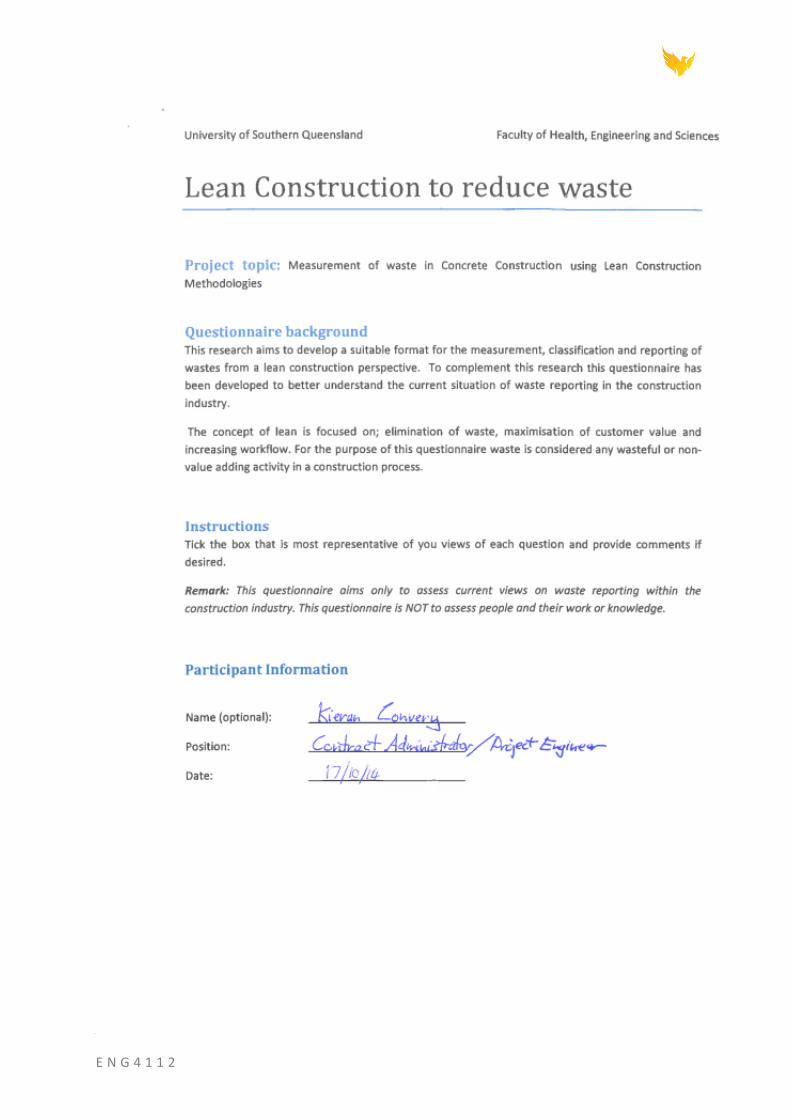

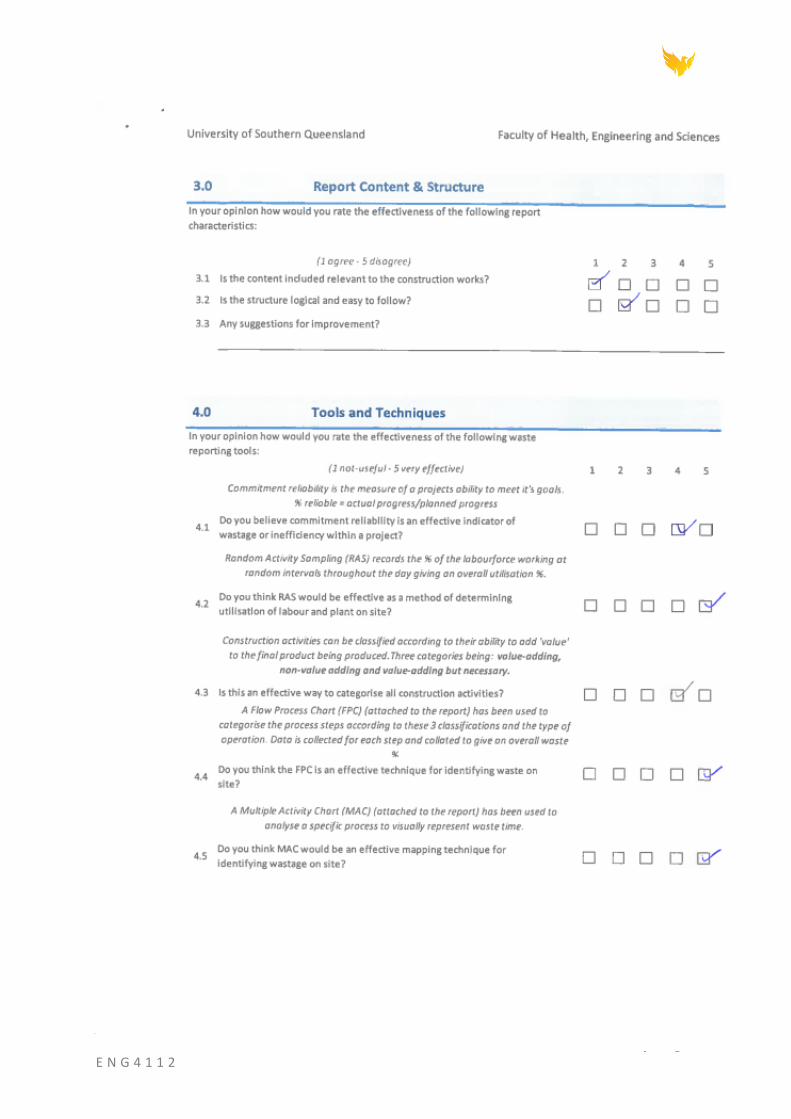


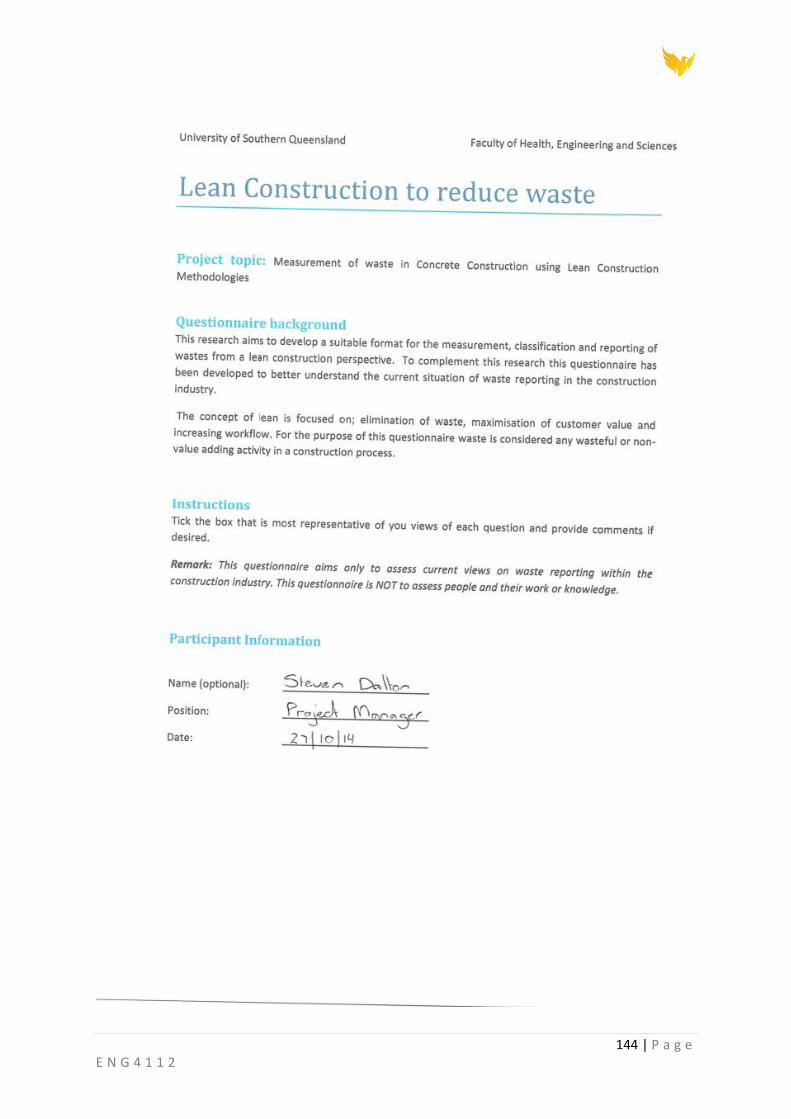


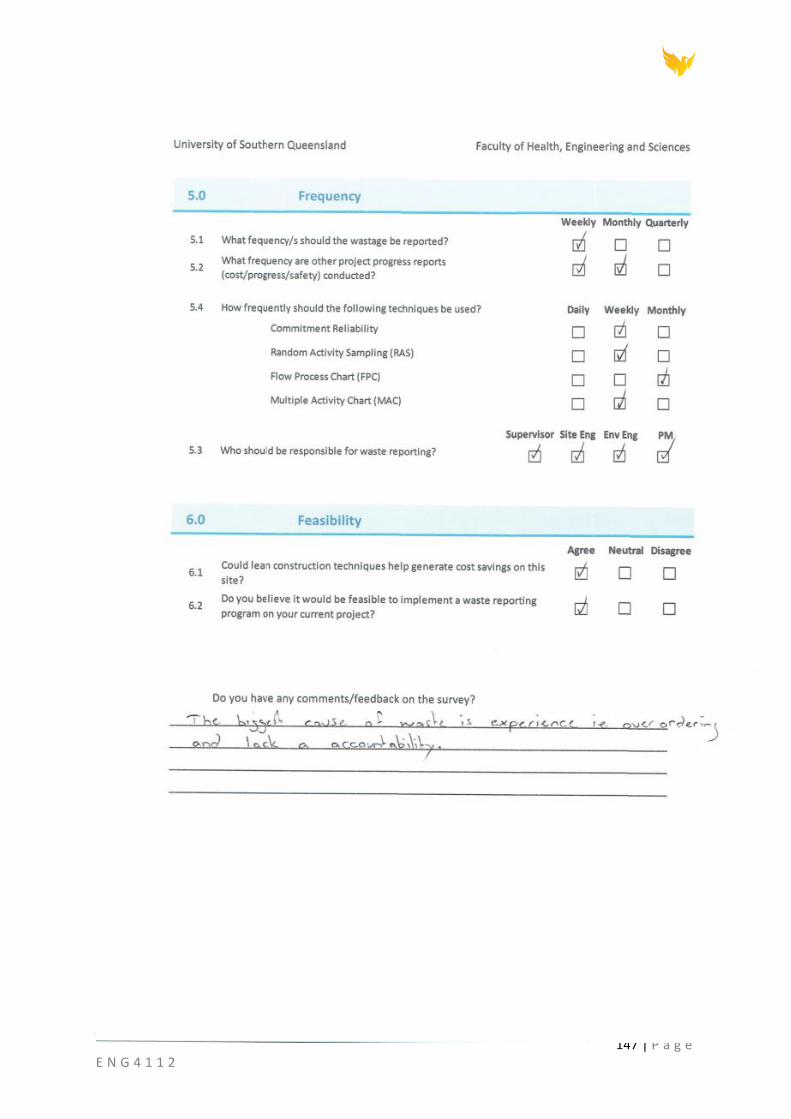


![LOESCHE Selective comminution of concrete waste … comminution of concrete waste ... the jaw crusher process [11] ... cess technology and mechanical equipment that is](https://static.documents.pub/doc/80x56/5ae056b17f8b9afd1a8dd243/loesche-selective-comminution-of-concrete-waste-comminution-of-concrete-waste.jpg)


![7-A. SU-02 June-2016 All Syllabus Science Facutly B.Sc. Computer … · · 2016-09-157-A. SU-02 June-2016 All Syllabus Science Facutly B.Sc. Computer Application [Optional] Sem.](https://static.documents.pub/doc/80x56/5ad9547a7f8b9ab8378e88f8/7-a-su-02-june-2016-all-syllabus-science-facutly-bsc-computer-su-02-june-2016.jpg)


