This paper presents an electrical resistivity method for measuring water absorption of very fine particles, making it easier to charac-terize stock materials that may be recycled in construction appli-cations. The fine particles of interest in this study come from recy-cled concrete, limestone, and natural sand sources, and retained on No. 100 and No. 200 sieves. The electrical resistivity of fines is used to indicate water content. The saturated surface-dry (SSD) state is defined as a percolation threshold that is detected using electrical resistance measurements. This study shows that recy-cled concrete fines exhibit a higher percolation threshold than of limestone and natural sand fines. The percolation threshold value of the water content is not sensitive to mold shape (cylinder and prism) and resistivity measurement method (two-probe and four-probe methods). The results suggest that this method is an easy and reproducible means for measuring the water absorption of recycled fines, thus addressing a serious barrier to their wide acceptance in practice.
Keywords: conductivity; limestone powder; percolation threshold; recy-cled concrete fines; resistivity; saturated surface-dry (SSD) condition; specific gravity; water absorption.
INTRODUCTIONDemand for recycled concrete materials is growing, and
many researchers have studied the incorporation of the waste materials in construction.1-5 The fine particles, however, of such waste materials are generally considered not suitable for use as aggregates in structural or pavement concretes. The most distinctive features of the fine particles from recy-cled concrete compared to natural fines are the presence of cement paste, which causes poorer properties of the fine particles, such as lower density and higher absorption. These properties of recycled fine particles have a negative effect on fresh and hardened properties of concrete.6,7 Furthermore, fine particles as fine aggregate in mixtures are difficult to characterize and are routinely discarded into landfills. With the growing emphasis on sustainability,8-10 construction materials such as controlled low-strength material (CLSM) can also be a suitable solution for the construction and demo-lition solid wastes.11-14 Better methods for characterizing the properties of recycled concrete fine particles are needed to further advance their acceptance in construction practice.
As with any fine aggregate, the specific gravity and water absorption of recycled fine particles need to be measured to facilitate mixture design and quality control of fresh and hardened concrete. To do so, the saturated surface-dry (SSD) state must be defined so that the total water content of the materials can be controlled and correct batch weights deter-mined.15 For successful use of the recycled fines in cementi-
tious construction materials, it is therefore essential that the SSD condition of the fines be determined accurately.
SSD is defined as the condition of aggregates in which all pores are filled with water, but there is no film of water on the surface.15 The SSD condition of fine aggregates can be determined using ASTM C128 specifications.16 As shown in Table 1, many researchers have studied the incor-poration of recycled concrete fines as fine aggregate in concrete,1,2,6,11-13,17-20 and then measured the properties using the standard method. The properties of recycled concrete fine aggregates reported in the literature have a wide range of values. Several problems arise when measuring recycled concrete aggregate. First, it is well known that the absorp-tion properties depend on the particle size as well as proper-ties of original concrete.19,21 Second, the standard method for preparing SSD condition of fines with angular-shaped parti-cles and a high proportion of fines are subjective because it is difficult to judge the SSD state by cone slump criterion due to the high interparticle friction of the fines. This problem becomes increasingly acute as particle sizes become small (that is passing the No. 200 sieve).22 As a result, the use of the standard methods for recycled fines leads to inaccurate
Title No. 114-M84
Measurement of Water Absorption of Very Fine Particles Using Electrical Resistivityby Jihwan Kim, Goangseup Zi, and David A. Lange
ACI Materials Journal, V. 114, No. 6, November-December 2017.MS No. M-2017-051, doi: 10.14359/51700994, received February 15, 2017, and
Table 1—Properties of recycled concrete fine aggregate, as published in the literature
ReferencesSpecific gravity
Absorption, %
Nominal size, mm (in.)
Evangelista and Brito2 2.165 13.1 1.19 to 0.074(0.046 to 0.003)
Etxeberria et al.12 2.01 13.1 2 (0.079)
Serpell et al.11 2.385 8.9 <5 (0.197)
Zega and Maio1 2.56 8.5 <5 (0.197)
Corinaldesi and Moriconi20 2.15 10 <5 (0.197)
Kou and Poon13 2.3 11.86 <5 (0.197)
Lee62.39 6.59
<5 (0.197)2.28 10.35
Yang et al.17 2.36 5.4 <5 (0.197)
Khatib18 2.34 6.25 <5 (0.197)
Ravindrarajah19 2.32 6.20 <5 (0.197)
958 ACI Materials Journal/November-December 2017
determination of the specific gravity and absorption values, thus degrading the quality of construction materials made with recycled aggregate.
Other alternative methods for measuring water absorp-tion values of coarse and fine aggregates are found in litera-ture.22-25 Tam et al.24 suggested that a novel method for testing the water absorption of recycled aggregates named “real-time assessment of water absorption.” The new approach provides an easier way to obtain the water absorption at different time intervals and without the need of soaking and drying the recy-cled coarse aggregate (5 to 40 mm [0.1968 to 1.5748 in.]). However, this method is not appropriate for high water-ab-sorption material such as recycled concrete fines because it is difficult to measure the initial mass of fines before absorption. Ueno et al.25 proposed a method to judge the SSD condition of fine aggregates. This is also based on the idea that the electric resistance of fine aggregates depends on the moisture content of the aggregates. They used fine aggregate (pit sand, crushed sand, and slag sands) with particle size between No. 4 and No. 200 sieves. However, investigations in the literature have not to date focused on characterization of very fine particles under 1 mm (0.04 in.).
In this study, therefore, the water content in SSD condition of the recycled and by-product fines retained on the No. 100 (150 μm [0.0059 in.]) and No. 200 (75 μm [0.0030 in.]) sieves was studied by electrical resistivity measurements. The resistivity measurements as a function of water contents were carried out to determine the SSD condition of recycled concrete, limestone, and natural sand fines. The test results were analyzed using the percolation theory to interpret the correct value for the SSD condition. The water absorption (the water content in SSD state) of different fines are presented and discussed, and the effects of mold shape (cylinder and prism) and resistivity measurement method (two-probe and four-probe methods) on the absorption values of fines are evaluated. Additionally, the absorption obtained from the resistivity measurements is compared with that measured from standard test methods.
RESEARCH SIGNIFICANCEVery fine particles produced when crushing concrete for
recycling purposes are notoriously difficult to characterize, and are routinely discarded into landfills. The fine particles
as fine aggregate in mixtures need to be characterized by density and water absorption to facilitate mixture design. The present study examines that the water absorption of recycled concrete, limestone, and natural sand fines was esti-mated using electrical resistivity measurement.
EXPERIMENTAL INVESTIGATIONMaterial preparation and characteristics
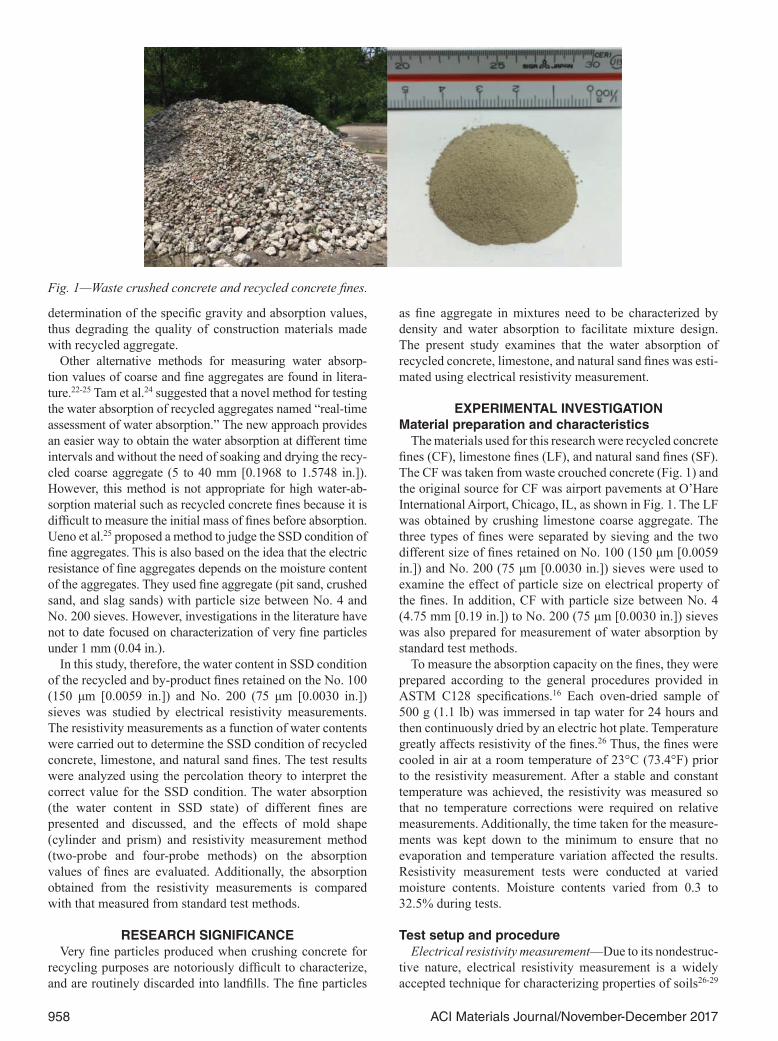
The materials used for this research were recycled concrete fines (CF), limestone fines (LF), and natural sand fines (SF). The CF was taken from waste crouched concrete (Fig. 1) and the original source for CF was airport pavements at O’Hare International Airport, Chicago, IL, as shown in Fig. 1. The LF was obtained by crushing limestone coarse aggregate. The three types of fines were separated by sieving and the two different size of fines retained on No. 100 (150 μm [0.0059 in.]) and No. 200 (75 μm [0.0030 in.]) sieves were used to examine the effect of particle size on electrical property of the fines. In addition, CF with particle size between No. 4 (4.75 mm [0.19 in.]) to No. 200 (75 μm [0.0030 in.]) sieves was also prepared for measurement of water absorption by standard test methods.
To measure the absorption capacity on the fines, they were prepared according to the general procedures provided in ASTM C128 specifications.16 Each oven-dried sample of 500 g (1.1 lb) was immersed in tap water for 24 hours and then continuously dried by an electric hot plate. Temperature greatly affects resistivity of the fines.26 Thus, the fines were cooled in air at a room temperature of 23°C (73.4°F) prior to the resistivity measurement. After a stable and constant temperature was achieved, the resistivity was measured so that no temperature corrections were required on relative measurements. Additionally, the time taken for the measure-ments was kept down to the minimum to ensure that no evaporation and temperature variation affected the results. Resistivity measurement tests were conducted at varied moisture contents. Moisture contents varied from 0.3 to 32.5% during tests.
Test setup and procedureElectrical resistivity measurement—Due to its nondestruc-
tive nature, electrical resistivity measurement is a widely accepted technique for characterizing properties of soils26-29
Fig. 1—Waste crushed concrete and recycled concrete fines.
959ACI Materials Journal/November-December 2017
and for assessing the performance of fresh and hardened concrete.27,30-35 For the measurement of volume resistivity of fines, ASTM G18736 and the TM 5-811-7 technical manual37 for the soil resistivity measurement were used. ASTM G187 and TM 5-811-7 technical manual suggest using a two- and four-electrode box to measure the soil resistivity, respec-tively. In this study, the resistivity measurements of fines with various water contents were carried out using both the two-probe and four-probe methods. Two different mold configurations were also used in this study—a cylinder mold with four-probe, and a prism mold with two-probe and four-probe—to determine if mold configuration affected the elec-trical measurement.
Both the clear acrylic cylinder and polyethylene prism molds were equipped with electrodes, which consisted of two copper end-plate electrodes and two pin electrodes inserted along the length (Fig. 2 to 4). The dimensions of the cylinder used were 36 mm (1.42 in.) in diameter and
152 mm (5.98 in.) in length, and the distance between two pin electrodes was 102 mm (4.02 in.). The prism mold for four-probe method was 40 mm (1.58 in.) in width, 30 mm (1.18 in.) in height, 178 mm (7.01 in.) in total length, and the distance between two pin electrodes was 120 mm (4.72 in.). The other prism mold, having a width and height of 25 mm (0.98 in.), and 60 mm (2.36 in.) in total length, which is the distance between two plate electrodes, was adopted for two-probe method. The dimensions of specimens are listed in Table 2.
In four-probe method, the end-plate electrodes were used to inject a current to the fines and connected to a 12-volt power source. The inner pin electrodes measured the elec-trical potential V, as shown in Fig. 2 and 3. Digital multime-ters were used to measure the current passing between the end-plate electrodes of the mold and to measure the voltage applied between the two pin electrodes. In the two-probe method, electrical resistance was measured directly by the
Fig. 2—Testing setup and equipment for four-probe method used in this study.
Fig. 3—Schematic diagram of four-probe method for measuring electrical resistivity of fines: (a) cylinder mold; and (b) prism mold.
960 ACI Materials Journal/November-December 2017
multimeter through the end electrodes. The experimental setup used is shown in Fig. 2, 3, and 4.
When a constant voltage is applied to the opposing end-plate electrodes placed in the fines, the resulting current that flows between the two pin probes is measured. Ohm’s law reveals the resistance. The resistivity ρ and the conduc-tivity σ are then
ρ cm)(Ω⋅ =ARd
(1)
σρ
( cmS ⋅ =−1 1) (2)
where A is exposed area of one electrode face, cm2; R is the resistance measured, ohms; and d is the distance between two pin electrodes, cm.
The resistivity of fines at the various moisture contents was measured as follows. ASTM C12816 and G18736 and were used for preparing a test specimen. A portion of the fines was loosely placed in the mold by filling until it over-flowed, and heaping additional material above the top of the mold. As shown in Fig. 4, the fines into the mold was compacted as densely as possible by a standard flat circular metal tamper 25 mm (0.98 in.) in diameter. The tamper was dropped approximately 5 to 10 times according to the mold shape and size. This filling procedure was continued until the mold was filled. The compacted fines were leveled off to conform to the total volume of the mold. The pin electrodes were inserted into the mold (refer to Fig. 2) after closing the cylinder mold with an end electrode cap. The voltage and current were simultaneously measured using digital multi-meters, and resistivity was calculated from Eq. (1). This procedure was repeated at various water contents to estab-
lish the relationship between water content and resistivity of the fines. The resistivity at each water content was measured twice to ensure reproducibility of the results.
Standard cone and paper towel method—An independent measurement of SSD condition was sought for purposes of comparison. Despite the shortcomings of methods when applied to very fine particles, as discussed earlier in this paper, the authors carefully used a standard cone (provi-sional cone test) test and hard-finish paper towel test methods, which have been recommended for aggregates that do not readily slump according to ASTM C128.16 The objec-tive of standard tests was to correlate the water absorption of CF obtained from resistivity measurement with that of the standard test. Tests for determination of absorption of fines were performed with different size particles. All tests were performed twice.
RESULTS, ANALYSIS, AND DISCUSSIONParticle morphology of fines
The particle morphology of three different fines on No. 200 sieve was observed by scanning electron microscopy (SEM), as shown in Fig. 5. It was observed that the CF had greater presence of superfine particles (~1 µm [3.9 × 10⁻⁵ in.] size scale) and the surfaces of CF particles appear rougher than the other materials (Fig. 5). These results reflect that fact that CF includes adhered cement paste in addition to original aggregate. The remnants of cement paste led to much higher water absorption and lower density compared with LF and SF samples.
Absorption of CF obtained from standard methodFigure 6 shows the results of absorption capacity of CF
obtained from the two standard methods at different sizes. Each plotted point is the average value of two measure-ments. Water absorption of CF increased with the decrease
Table 2—Dimension of molds used for electrical resistivity measurement
Mold type Diameter, mm (in.) Height, mm (in.) Width, mm (in.) Length, mm (in.)Distance between
Fig. 4—Test procedure and schematic diagram of two-probe method for measuring electrical resistivity of fines: (a) test proce-dure; and (b) schematic diagram.
961ACI Materials Journal/November-December 2017
in size of fines due to the higher amount of residual paste in smaller size fines. For the fines under 1 mm (0.0394 in.), the results from the cone test method provide slightly lower absorption than the paper towel method. This is because the paper towel method is related to the surface water of the fines, but the cone test method is related to the friction of the fines. The high amount of residual paste in CF leads to high interparticle friction, which underestimates the water content in SSD state of fines. These results indicate that the water absorption of very fine particles is affected by the test method even with the same material with same particle size due to the difficulty of determination of their SSD state by cone slump criterion of the fines. The water absorption of CF with a grain size smaller than 5 mm (0.197 in.) used in this study was measured (using standard cone test) to be 8.6%, which is similar with that obtained by Serpell et al.11 and Zega and Maio.1
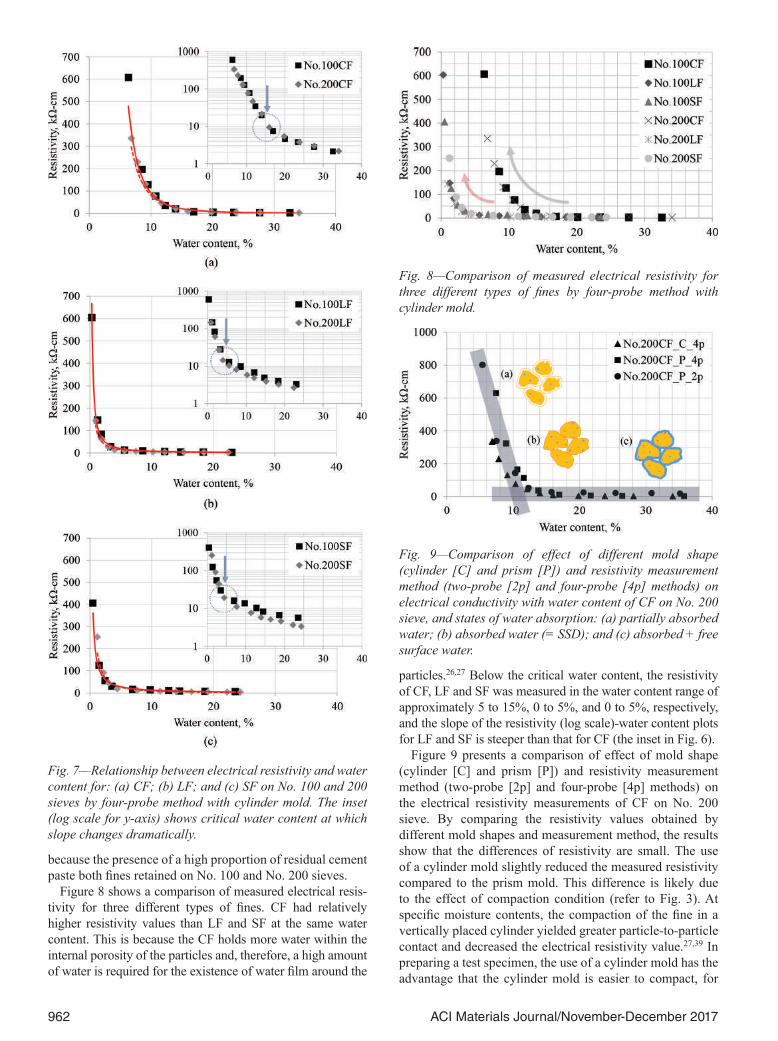
Electrical resistivity of finesThe relationships between DC electrical resistivity and
water content of CF, LF, and SF on No. 100 and 200 sieves are plotted in Fig. 7. In each fine, a distinct relationship between the measured resistivity and water content exists. The electrical resistivity values increased with decreasing total water content. At low water content, the resistivity is high, whereas the resistivity is lower at high water content. Similar relationships have been reported for sands28,38 and soils.26,27 It was also found, for all fines, that the resistivity (log scale)-water content plots exhibit a distinctive feature, having a critical water content at the point at which the slope changes dramatically, as shown in inset Fig. 7. Based
on the change of the resistivity of fines, the resistivity (log scale)-water content plots can be divided into two different regions, indicated by an arrow. At high water content, the resistivity values increase little with the decrease of the water content; below the critical water content, however, the resistivity values increase sharply with the decrease of the water content. In addition, Fig. 7 shows that the resistivity of LF and SF depends on the particle sizes at high water contents, in which the resistivity values decreased as the size decreased. When the size is decreased, the fine particles are closer to each other, greater contact points are available, and the resistivity is decreased. This trend was not clearly observed for CF used in this study. The main reason is
Fig. 5—Scanning electron microscope images of samples: (a) CF; (b) CF; (c) LF; and (d) SF on No. 200 sieve.
Fig. 6—Results of absorption capacity at different sizes of CF.
962 ACI Materials Journal/November-December 2017
because the presence of a high proportion of residual cement paste both fines retained on No. 100 and No. 200 sieves.
Figure 8 shows a comparison of measured electrical resis-tivity for three different types of fines. CF had relatively higher resistivity values than LF and SF at the same water content. This is because the CF holds more water within the internal porosity of the particles and, therefore, a high amount of water is required for the existence of water film around the
particles.26,27 Below the critical water content, the resistivity of CF, LF and SF was measured in the water content range of approximately 5 to 15%, 0 to 5%, and 0 to 5%, respectively, and the slope of the resistivity (log scale)-water content plots for LF and SF is steeper than that for CF (the inset in Fig. 6).
Figure 9 presents a comparison of effect of mold shape (cylinder [C] and prism [P]) and resistivity measurement method (two-probe [2p] and four-probe [4p] methods) on the electrical resistivity measurements of CF on No. 200 sieve. By comparing the resistivity values obtained by different mold shapes and measurement method, the results show that the differences of resistivity are small. The use of a cylinder mold slightly reduced the measured resistivity compared to the prism mold. This difference is likely due to the effect of compaction condition (refer to Fig. 3). At specific moisture contents, the compaction of the fine in a vertically placed cylinder yielded greater particle-to-particle contact and decreased the electrical resistivity value.27,39 In preparing a test specimen, the use of a cylinder mold has the advantage that the cylinder mold is easier to compact, for
Fig. 7—Relationship between electrical resistivity and water content for: (a) CF; (b) LF; and (c) SF on No. 100 and 200 sieves by four-probe method with cylinder mold. The inset (log scale for y-axis) shows critical water content at which slope changes dramatically.
Fig. 8—Comparison of measured electrical resistivity for three different types of fines by four-probe method with cylinder mold.
Fig. 9—Comparison of effect of different mold shape (cylinder [C] and prism [P]) and resistivity measurement method (two-probe [2p] and four-probe [4p] methods) on electrical conductivity with water content of CF on No. 200 sieve, and states of water absorption: (a) partially absorbed water; (b) absorbed water (= SSD); and (c) absorbed + free surface water.
963ACI Materials Journal/November-December 2017
making certain that voids are eliminated, than a prism mold. In addition, at high water content, the measured resistivity values for two-probe method (2p) were higher than those obtained using four-probe method (4p), due to the inclusion of the contact resistance when the two-probe method is used.
Despite the difference in resistivity values among the factors that may affect the electrical resistivity of fines, overall, the test results indicate that the resistivity was not sensitive to mold shape and the resistivity measurement method. It is noted that the three curves have a similar shape; presumably, they represent comparable critical water content at which the slope changes most rapidly. Although the measured resistivity values are slightly different from each other, it appears that for mold shape or resistivity measurement method used, the water absorption determined by the electrical resistivity of fines was not affected much. If both mold shape and the methods for the testing are different, reliable values for the water absorp-tion of the fines are obtained by the resistivity measurement method. Thus, measurements of electrical resistivity can be used to assess whether a fine particle has partially absorbed water or absorbed water. These results agree with some results obtained by Saarenketo.40
Determining saturated surface-dry condition of fines
Ueno et al.25 also proposed a method to judge the SSD condition of fine aggregates in a size range from 5 to 0.15 mm (0.197 to 0.006 in.), and reported that the rela-tionships between the electric resistance and the moisture content of fine aggregates show radical changes in the elec-tric resistances near the SSD condition. They described that the resistance (log scale) and total water content relation-ship can be approximated by two straight lines, and the fine aggregate attains the SSD condition at the crossing point of these lines.
From the observation of the experimental results (Fig. 7, 8, and 9), it appears that resistivity versus water content curves for three types of fines have typical features of perco-lation phenomenon.41 At high water content, the resistivity is almost zero and increases approximately in proportion to the water content until a critical value is reached. The measured resistivity of the fines increases dramatically at the certain water content. Below the threshold water content, the resis-tivity increases with decreasing water content. The critical water content is called the percolation threshold content.
The aforementioned phenomenon can be associated with the moisture states of fines. Below the threshold water content, the path connected by continuous water through the fines is disconnected (Fig. 9(a)). When the water content reaches the percolation threshold, the water clusters are able to contact each other (Fig. 9(b)) and form a conducting network through the system.41 Increases in water content above the percolation threshold provide greater free surface water and, thus, decrease resistivity (Fig. 9(c)). In this study, therefore, the critical amount of water needed to reach the beginning of the network was analyzed using the percolation theory and determined as absorbed water for SSD condition (Fig. 9(b)).
The essence of percolation theory is to define how a given set of sites, regularly or randomly positioned in space, is inter-connected.42 The conductivity of the system, above the perco-lation threshold, is predicted by the following equation43,44
σ = (p – pc)t for p > pc (3)
where σ is the electrical conductivity; p is the water content; pc is the critical water content corresponding to the perco-lation threshold; and t is the critical exponent of conduc-tivity. The value of percolation threshold, pc, was obtained by fitting experimental data to Eq. (3). To determine the threshold value pc of total water content in the fines, best-fit linear plots of log σ versus log (p – pc) for each fine were plotted in a way as to obtain the maximum correspondence between the theoretical curve and the experimental data, shown in inset of Fig. 10.
Fig. 10—Relationship between electrical conductivity (logs-cale) and water content, and insert is data and best-fit curve for conductivity, σ, and water content minus percolation threshold (p – pc) for: (a) CF (C is circular, P is prism); (b) LF; and (c) SF on No. 100 and 200 sieves by four-probe method with cylinder mold.
964 ACI Materials Journal/November-December 2017
The comparison of threshold values (water absorption) are summarized in Table 3. CF exhibits a higher percola-tion threshold than of LF and SF. The threshold value of all fines increases with decreasing particle sizes of fines. These results are in close agreement with the findings of Sarma and Rao.38 Furthermore, the absorption value obtained from the resistivity measurement method is slightly lower than the cone test method. It should be noted that the threshold values of CF on No. 200 measured by using different mold shapes and different test method are comparable, as listed in Table 3. It is obvious that the threshold values of fines is almost independent of the shape and size of mold, and resistivity measurement method. These results demonstrate that the threshold value may be identified with the SSD state, which serves as the basis for measuring absorption capacity. So, this implied that the electrical resistivity measurement is useful for accurately determining the water absorption of fines, and that the use of electrical resistivity as an indicator has been shown to be a good alternative for determining the water absorption of recycled and by-product fines as aggregates.
CONCLUSIONSThe interest in recycling very fine particles from concrete
crushing operations anticipates the need for easy quality control tests that can measure moisture stockpiles. A new approach using electrical resistivity of the fines is proposed to determine the water absorption of the fines. The new method has been demonstrated using recycled concrete fines (CF), limestone fines (LF), and natural sand fines (SF) retained on No. 100 and 200 sieves. The experimental results were analyzed using a percolation theory that defines the saturated surface-dry (SSD) condition as a point of disconnection of the water pathway through a sample. Based on the results of the study, the following conclusions can be made:
1. SEM images showed that CF used does not only consist of original aggregates but also comprises the remains of cement paste adhering to the aggregate surfaces.
2. Based on the test results obtained from standard test methods, the water absorption of CF increased with the decrease in size of fines. For the fines under 1 mm (0.0394 in.), large discrepancies between the results from standard cone and paper towel methods are observed. Test results indicate that the water absorption of very fine particles is affected by the test method even with the same material with same particle size.
3. For three types of fines tested in this study, a distinct relationship between the measured resistivity and water content exists. The electrical resistivity values increased with decreasing total water content. At low water contents,
the resistivity is high, whereas the resistivity is lower at high water contents. The resistivity values of LF and SF decreased as the size decreased; this trend was not clearly observed for CF in this study.
4. The relationship between resistivity and water content curves for three types of fines have typical features of perco-lation phenomenon. CF has a higher percolation threshold, which is defined as the water absorption of fines, than those of LF and SF. Although the measured resistivity values are slightly different from each other, it appears that for mold shape or resistivity measurement method used, the water absorption determined by the electrical resistivity of fines was not affected much. The water absorption of CF determined using resistivity measurement was slightly lower than those obtained from the standard methods, which are, admittedly, very difficult to conduct reliably on very fine particle systems.
5. The results demonstrate that the electrical resistivity measurement method has potential to be an accurate means for measuring the water absorption of very fine particles. Such advances in characterization methods for fine particles support the broader acceptance of recycled concrete.
AUTHOR BIOSJihwan Kim is a Senior Researcher at Korea Railroad Research Institute (KRRI), Republic of Korea. He received his BS, MS, and PhD from the Department of Civil, Environmental, and Architectural Engineering at Korea University, Seoul, Republic of Korea. His research interests include development of durable and sustainable construction materials, and behavior of concrete structures.
Goangseup Zi is a Professor in the School of Civil, Environmental, and Architectural Engineering at the Korea University. He received his PhD from Northwestern University, Evanston, IL, in 2002. His research interests include improvement of properties and performance of concrete, and the design of sustainable construction materials.
David A. Lange, FACI, is a Professor of civil and environmental engi-neering at the University of Illinois at Urbana-Champaign, Champaign, IL. He received his PhD from Northwestern University, Evanston, IL. He is an ACI Vice President and past Chair of the ACI Technical Activities Committee and ACI Committee 236, Material Science of Concrete, of which he is a current member. He also is a member of ACI Committees 237, Self-Consolidating Concrete, and 544, Fiber-Reinforced Concrete.
ACKNOWLEDGMENTSThis research was supported by a grant (Development of DCP [derail-
ment containment provision] within the gauge of a track in railway bridges, 17RTRP-B122273-02) from the Railway Technology Research Program funded by Ministry of Land, Infrastructure and Transport of Korean government, and by Korea University. It was also supported by the Center of Excellence for Airport Technology (CEAT) funding from the City of Chicago and Grant, IL.
REFERENCES1. Zega, C. J., and Di Maio, A. A., “Use of Recycled Fine Aggre-
gate in Concretes with Durable Requirements,” Waste Management (New York, N.Y.), V. 31, No. 11, 2011, pp. 2336-2340. doi: 10.1016/j.wasman.2011.06.011
2. Evangelista, L., and de Brito, J., “Mechanical Behaviour of Concrete Made with Fine Recycled Concrete Aggregates,” Cement and Concrete Composites, V. 29, No. 5, 2007, pp. 397-401. doi: 10.1016/j.cemconcomp.2006.12.004
3. Kim, J.; Yi, C.; and Zi, G., “Waste Glass Sludge as a Partial Cement Replacement in Mortar,” Construction and Building Materials, V. 75, 2015, pp. 242-246. doi: 10.1016/j.conbuildmat.2014.11.007
4. Otsuki, N.; Miyazato, S.; and Yodsudjai, W., “Influence of Recy-cled Aggregate on Interfacial Transition Zone, Strength, Chloride Pene-tration and Carbonation of Concrete,” Journal of Materials in Civil Engineering, ASCE, V. 15, No. 5, 2003, pp. 443-451. doi: 10.1061/(ASCE)0899-1561(2003)15:5(443)
Table 3—Comparison of water absorption of CF, LF, and SF obtained from resistivity measurement
5. Ramezanianpour, A. A.; Ghiasvand, E.; Nickseresht, I.; Mahdikhani, M.; and Moodi, F., “Influence of Various Amounts of Limestone Powder on Performance of Portland Limestone Cement Concretes,” Cement and Concrete Composites, V. 31, No. 10, 2009, pp. 715-720. doi: 10.1016/j.cemconcomp.2009.08.003
6. Lee, S.-T., “Influence of Recycled Fine Aggregates on the Resis-tance of Mortars to Magnesium Sulfate Attack,” Waste Management (New York, N.Y.), V. 29, No. 8, 2009, pp. 2385-2391. doi: 10.1016/j.wasman.2009.04.002
7. de Juan, M. S., and Gutiérrez, P. A., “Study on the Influence of Attached Mortar Content on the Properties of Recycled Concrete Aggre-gate,” Construction and Building Materials, V. 23, No. 2, 2009, pp. 872-877. doi: 10.1016/j.conbuildmat.2008.04.012
8. Lothenbach, B.; Scrivener, K.; and Hooton, R. D., “Supplementary Cementitious Materials,” Cement and Concrete Research, V. 41, No. 12, 2011, pp. 1244-1256. doi: 10.1016/j.cemconres.2010.12.001
9. Aydin, E., “Novel Coal Bottom Ash Waste Composites for Sustainable Construction,” Construction and Building Materials, V. 124, 2016, pp. 582-588. doi: 10.1016/j.conbuildmat.2016.07.142
10. Durán-Herrera, A.; Juárez, C. A.; Valdez, P.; and Bentz, D. P., “Evaluation of Sustainable High-Volume Fly Ash Concretes,” Cement and Concrete Composites, V. 33, No. 1, 2011, pp. 39-45. doi: 10.1016/j.cemconcomp.2010.09.020
11. Serpell, R.; Henschen, J.; Roesler, J.; and Lange, D., “Relative Proportioning Method for Controlled Low-Strength Material,” ACI Materials Journal, V. 112, No. 2, Mar.-Apr. 2015, pp. 179-188. doi: 10.14359/51687226
12. Etxeberria, M.; Ainchil, J.; Pérez, M. E.; and González, A., “Use of Recycled Fine Aggregates for Control Low Strength Materials (CLSMs) Production,” Construction and Building Materials, V. 44, 2013, pp. 142-148. doi: 10.1016/j.conbuildmat.2013.02.059
13. Kou, S. C., and Poon, C. S., “Properties of Self-Compacting Concrete Prepared with Coarse and Fine Recycled Concrete Aggregates,” Cement and Concrete Composites, V. 31, No. 9, 2009, pp. 622-627. doi: 10.1016/j.cemconcomp.2009.06.005
14. Achtemichuk, S.; Hubbard, J.; Sluce, R.; and Shehata, M. H., “The Utilization of Recycled Concrete Aggregate to Produce Controlled Low-Strength Materials without Using Portland Cement,” Cement and Concrete Composites, V. 31, No. 8, 2009, pp. 564-569. doi: 10.1016/j.cemconcomp.2008.12.011
15. Mindess, S.; Young, J. F.; and Darwin, D., Concrete, Prentice-Hall, Englewood Cliffs, NJ, 2003, 644 pp.
16. ASTM C128-15, “Standard Test Method for Relative Density (Specific Gravity) and Absorption of Fine,” ASTM International, West Conshohocken, PA, 2015, 6 pp.
17. Yang, K. H.; Chung, H. S.; and Ashour, A. F., “Influence of Type and Replacement Level of Recycled Aggregates on Concrete Properties,” ACI Materials Journal, V. 105, No. 3, May-June 2008, pp. 289-296.
18. Khatib, J. M., “Properties of Concrete Incorporating Fine Recycled Aggregate,” Cement and Concrete Research, V. 35, No. 4, 2005, pp. 763-769. doi: 10.1016/j.cemconres.2004.06.017
19. Ravindrarajah, R. S.; Loo, Y. H.; and Tam, C. T., “Recycled Concrete as Fine and Coarse Aggregates in Concrete,” Magazine of Concrete Research, V. 39, No. 141, 1987, pp. 214-220. doi: 10.1680/macr.1987.39.141.214
20. Corinaldesi, V., and Moriconi, G., “Influence of Mineral Additions on the Performance of 100% Recycled Aggregate Concrete,” Construction and Building Materials, V. 23, No. 8, 2009, pp. 2869-2876. doi: 10.1016/j.conbuildmat.2009.02.004
21. Padmini, A. K.; Ramamurthy, K.; and Mathews, M. S., “Influence of Parent Concrete on the Properties of Recycled Aggregate Concrete,” Construction and Building Materials, V. 23, No. 2, 2009, pp. 829-836. doi: 10.1016/j.conbuildmat.2008.03.006
22. Kasemchaisiri, R., and Tangtermsirikul, S., “A Method to Deter-mine Water Retainability of Porous Fine Aggregate for Design and Quality Control of Fresh Concrete,” Construction and Building Materials, V. 21, No. 6, 2007, pp. 1322-1334. doi: 10.1016/j.conbuildmat.2006.01.009
23. Tegguer, A. D., “Determining the Water Absorption of Recycled Aggregates Utilizing Hydrostatic Weighing Approach,” Construction and Building Materials, V. 27, No. 1, 2012, pp. 112-116. doi: 10.1016/j.conbuildmat.2011.08.018
24. Tam, V. W. Y.; Gao, X. F.; Tam, C. M.; and Chan, C. H., “New Approach in Measuring Water Absorption of Recycled Aggregates,” Construction and Building Materials, V. 22, No. 3, 2008, pp. 364-369. doi: 10.1016/j.conbuildmat.2006.08.009
25. Ueno, A.; Kokubu, K.; and Ohga, H., “Basic Study on the New Testing Method of Judging the Saturated Surface Dry Conditions of Fine Aggregates,” Fourth CANMET/ACI/JCI Conference: Advances in Concrete Technology, SP-179, V. M. Malhotra, ed., American Concrete Institute, Farmington Hills, MI, 1998, pp. 481-498.
26. Kibria, G., and Hossain, M. S., “Investigation of Geotechnical Parameters Affecting Electrical Resistivity of Compacted Clays,” Journal of Geotechnical and Geoenvironmental Engineering, ASCE, V. 138, No. 12, 2012, pp. 1520-1529. doi: 10.1061/(ASCE)GT.1943-5606.0000722
27. Abu-Hassanein, Z. S.; Benson, C. H.; and Blotz, L. R., “Elec-trical resistivity of compacted clays,” Journal of Geotechnical Engi-neering, ASCE, V. 122, No. 5, 1996, pp. 397-406. doi: 10.1061/(ASCE)0733-9410(1996)122:5(397)
28. Yoon, G. L., and Park, J. B., “Sensitivity of Leachate and Fine Contents on Electrical Resistivity Variations of Sandy Soils,” Journal of Hazardous Materials, V. 84, No. 2-3, 2001, pp. 147-161. doi: 10.1016/S0304-3894(01)00197-2
29. Samouëlian, A.; Cousin, I.; Tabbagh, A.; Bruand, A.; and Richard, G., “Electrical Resistivity Survey in Soil Science: A Review,” Soil & Tillage Research, V. 83, No. 2, 2005, pp. 173-193. doi: 10.1016/j.still.2004.10.004
30. Li, Z.; Xiao, L.; and Wei, X., “Determination of Concrete Setting Time Using Electrical Resistivity Measurement,” Journal of Materials in Civil Engineering, ASCE, V. 19, No. 5, 2007, pp. 423-427. doi: 10.1061/(ASCE)0899-1561(2007)19:5(423)
31. Ghods, P.; Alizadeh, A. R.; and Salehi, M., “Electrical Resistivity of Concrete,” Concrete International, V. 37, No. 5, May 2015, pp. 41-46.
32. ASTM C1760-12, “Standard Test Method for Bulk Electrical Conductivity of Hardened Concrete,” ASTM International, West Consho-hocken, PA, 2012, 5 pp.
33. Bentz, D. P.; Snyder, K. A.; and Ahmed, A., “Anticipating the Setting Time of High-Volume Fly Ash Concretes Using Electrical Measure-ments: Feasibility Studies Using Pastes,” Journal of Materials in Civil Engineering, ASCE, V. 27, No. 3, 2015, pp. 1-6. doi: 10.1061/(ASCE)MT.1943-5533.0001065
34. Aydin, E., and Doven, A. G., “Influence of Water Content on the Ultrasonic Pulse Echo Measurements through High Volume Fly Ash Cement Paste-Physicomechanical Characterization,” Research in Nondestructive Evaluation, V. 17, No. 4, 2006, pp. 177-189. doi: 10.1080/09349840600788004
35. Whiting, D. A., and Nagi, M. A., “Electrical Resistivity of Concrete—A Literature Review,” R&D Serial No. 2457, Portland Cement Association, Skokiw, IL, 2003.
36. ASTM G187-12a, “Standard Test Method for Measurement of Soil Resistivity Using the Two-Electrode Soil Box Method,” ASTM Interna-tional, West Conshohocken, PA, 2012, 6 pp.
37. TM 5-811-7, “Technical Manual Electrical Design, Cathodic Protec-tion,” Headquarters Department of the Army, Washington, DC, Apr. 1985.
38. Sarma, V. J., and Rao, V. B., “Variation of Electrical Resistivity of River Sands, Calcite, and Quartz Powders with Water Content,” Geophysics, V. 27, No. 4, 1962, pp. 470-479. doi: 10.1190/1.1439048
39. McCarter, W. J., “The Electrical Resistivity Characteristics of Compacted Clays,” Geotechnique, V. 34, No. 2, 1984, pp. 263-267. doi: 10.1680/geot.1984.34.2.263
40. Saarenketo, T., “Electrical Properties of Water in Clay and Silty Soils,” Journal of Applied Geophysics, V. 40, No. 1-3, 1998, pp. 73-88. doi: 10.1016/S0926-9851(98)00017-2
41. Stauffer, D., and Aharony, A., Introduction to Percolation Theory, CRC Press, Boca Raron, FL, 1994, 192 pp.
42. Pike, G. E., and Seager, C. H., “Percolation and Conductivity: A Computer Study. I,” Physical Review B: Condensed Matter and Materials Physics, V. 10, No. 4, 1974, pp. 1421-1434. doi: 10.1103/PhysRevB.10.1421
43. Kirkpatrick, S., “Percolation and Conduction,” Reviews of Modern Physics, V. 45, No. 4, 1973, pp. 574-588. doi: 10.1103/RevModPhys.45.574
44. Weber, M., and Kamal, M. R., “Estimation of the Volume Resistivity of Electrically Conductive Composites,” Polymer Composites, V. 18, No. 6, 1997, pp. 711-725. doi: 10.1002/pc.10324