HUCH Laboratory Diagnostics Hospital for Children and Adolescents Helsinki University Central Hospital, Finland Medix Laboratories Ltd. Espoo, Finland MEASUREMENT TOOLS FOR QUALITY ASSURANCE IN MEDICAL LABORATORIES by Solveig Linko Academic dissertation To be publicly discussed by permission of the Medical Faculty of the University of Helsinki, in the auditorium of Niilo Hallman, Helsinki University Central Hospital, Hospital for Children and Adolescents, Stenbäckinkatu 11, Helsinki on February, 8 th 2003, at 12 o'clock noon. Helsinki 2003
Transcript
HUCH Laboratory DiagnosticsHospital for Children and Adolescents
Helsinki University Central Hospital, Finland
Medix Laboratories Ltd.Espoo, Finland
MEASUREMENT TOOLS FOR QUALITY ASSURANCEIN MEDICAL LABORATORIES
by
Solveig Linko
Academic dissertation
To be publicly discussed by permission ofthe Medical Faculty of the University of Helsinki,
in the auditorium of Niilo Hallman,Helsinki University Central Hospital,
Hospital for Children and Adolescents, Stenbäckinkatu 11, Helsinkion February, 8th 2003, at 12 o'clock noon.
Helsinki 2003
Enfocus Software - Customer Support
Supervised by
Docent Jaakko-Juhani Himberg, MD, PhD
University of Helsinki
Faculty of Medicine
HUCH Laboratory Diagnostics
Helsinki University Central Hospital
Helsinki, Finland
Docent Eino Puhakainen, PhD
University of Helsinki
Department of Biosciences
HUCH Laboratory Diagnostics
Helsinki University Central Hospital
Helsinki, Finland
Reviewed by
Docent Hannu Jokela, PhD
University of Tampere
Department of Biosciences
Tampere, Finland
Docent Raija Puukka, PhD
University of Oulu
Department of Biochemistry
Oulu, Finland
Official opponent
Docent Erkki Seppälä, MD, PhD
University of Tampere
Faculty of Medicine
Tampere, Finland
ISBN 952-91-5530-1 (paperback)Grafia Oy, Turku 2003
ISBN 952-10-0897-0 (PDF-version)http://ethesis.helsinki.fi, Helsinki 2003
Enfocus Software - Customer Support
Per béllii ad astra
Enfocus Software - Customer Support
Enfocus Software - Customer Support
1
ACKNOWLEDGEMENTS
This study was carried out from 1998 to 2002 at Diacor, Deaconess Institute Clinical
Laboratory in Helsinki, Medix Laboratories Ltd. in Espoo, Institute for Reference
Materials and Measurements in Geel, and at HUCH Laboratory Diagnostics, (Hospital for
Children and Adolescents, Helsinki University Central Hospital).
I highly appreciate the opportunity given to me at HUCH Laboratory Diagnostics, Helsinki
University Central Hospital to finalize my work. My special thanks for support and
encouragement are given to Professor Lasse Viinikka, M.D., the Head of HUCH
Laboratory Diagnostics, to Professor Ulf-Håkan Stenman, M.D., and to Docent Martti
Syrjälä, M.D., at HUCH Laboratory Diagnostics.
My supervisors Docent Jaakko-Juhani Himberg, M.D., Ph.D. and Docent Eino
Puhakainen, Ph.D. are to thank for their precious time and good advice.
I wish to thank my co-workers Professor Linda Thienpont, Dr. Dietmar Stöckl, and Dr.
Andre De Leenheer at the University of Ghent, my sister Docent Linnéa Linko, Ph.D., at
the University of Turku, Docent Eero Taskinen, M.D., Dr. Päivi Kärkkäinen, M.D. and
Professor Seppo Sarna, M.D., at the University of Helsinki.
I am inspired to express my sincere gratitude to Professor Veikko Komppa, at VTT
Processes, Materials and Chemicals, who guided me to the footprints of metrology and
has supported my work in such a way that cannot be measured.
Dr. Philip D.P. Taylor at the Institute for Reference Materials and Measurements,
Enfocus Software - Customer Support
2
Docent Ulf Örnemark, Ph.D. at the University of Upsala, and Dr. Rüdiger Kessel made me
certain of one thing, which is most valuable: "We are still uncertain".
Docent Raija Puukka, Ph.D. and Docent Hannu Jokela, Ph.D. who reviewed my
manuscript supplied with good points and constructive criticism. I am grateful for this
advice.
I want to thank Ms. Aila Koponen for her invaluable technical help.
I am lucky to have so many friends. Special thanks for technical assistance, in its many
ways are given to Dr. Helene Markkanen, Med. Lic, Mrs. Liisa Pohjanen, Mrs. Marja
Leena Laipio M. Sc., Mrs. Marita Junna, Ms. Siiri Elomaa, Mrs. Liisa Melamies,
Phil.Lic, Paavo Tammisto, M.Sc., Mrs. Aino Salla. For the "material support" I wish to
thank my husband Hannu Vartiala, Mr. Esa Passi, Mr. Seppo Räisänen (U), Mr. Seppo
Tamminen, Mr. Sami Tuovinen, and Mr. Veikko Huhtaluoma. I wish to thank all the Medix
Diacor people who have allowed this thesis to be undertaken.
This study was supported by grants from Biomedicum-Helsinki Foundation, Suomen
Kemistiliitto, Association of Finnish Clinical Biochemists and funding from the European
Commission.
Finally, I want to express my warmest feelings to my family for their tremendous support
in such a many ways. Special thanks to Jaques le Roi.
Helsinki, December 2002
Enfocus Software - Customer Support
3
MEASUREMENT TOOLS FOR QUALITY ASSURANCE IN MEDICALLABORATORIES
ACKNOWLEDGEMENTS 1
LIST OF THE ORIGINAL COMMUNICATIONS 5
LIST OF ABBREVIATIONS AND ACRONYMS 6
1. Abbreviations for associations, committees, organisations and laboratories 6
2. Acronyms 62.1 Acronyms used in equations and calculations 62.2 Other acronyms 7
ABSTRACT 8
INTRODUCTION 10
REVIEW OF THE LITERATURE 12
1. Metrology in laboratory medicine 121.1 The infrastructure of metrology 121.2 The International System of Units (SI) 131.3 Traceability 131.4 Reference materials and reference methods 151.5 Measurements based on identification 18
2. The concept of quality and related issues 192.1 The definition of quality 192.2 Development of quality thinking 192.3 Quality management 212.4 Laboratory accreditation and certification 222.5 Requirements set for manufacturers and products 24
3. Evaluation and expression of measurement quality 263.1 Method validation 263.2 Analytical performance 273.3 Laboratory performance and quality goals 29
AIMS OF THE STUDY 33
MATERIALS AND METHODS 35
1. Material sampling 351.1 Serum samples 351.2 Other test material 36
2. Principles of measurements in routine methods 37
3. Reference methods 37
Enfocus Software - Customer Support
4
4. In Vitro Diagnostic Medical Devices 374.1 Calibration devices 374.2 Measurement devices 384.3 Control material 394.4 Reference materials 39
5. Software applications, statistical methods and calculations 39
6. Co-operating laboratories, institutes and commercial companies 41
7. International standards and guides 41
RESULTS 42
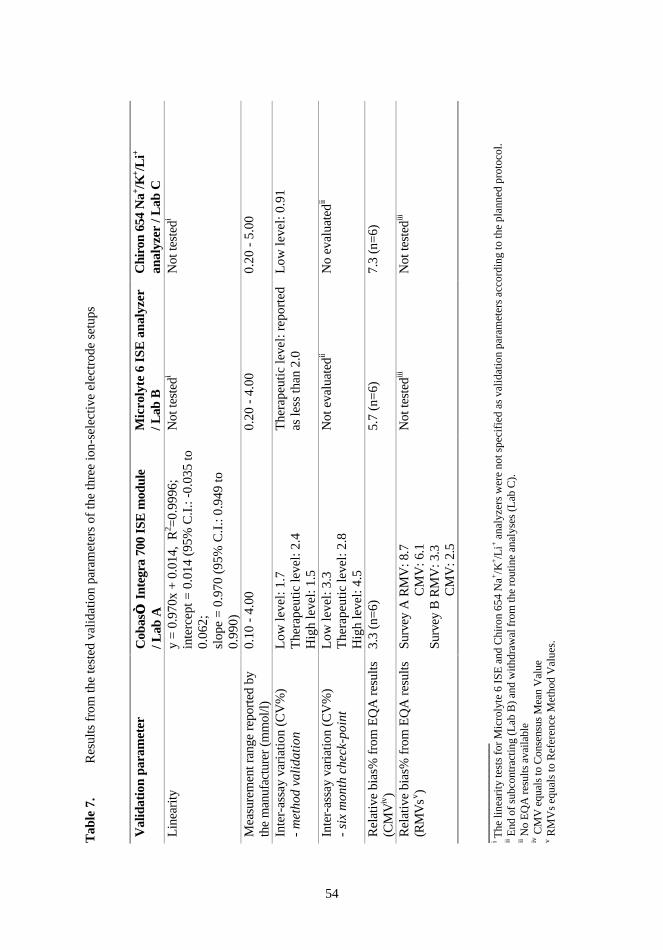
1. Primary results from the use of the tools I-VI 421.1 Use of reference methods and single donation sera (Tool I) 421.2 Evaluation of the uncertainty of measurement (Tool II) 431.3 Assessment of performance characteristics (Tool III) 501.4 Internal quality control (Tool IV) 501.5 Method validation and result level verification (Tool V) 531.6 Internal audits (Tool VI) 55
2. Results across the set of tools 55
DISCUSSION 58
SUMMARY AND CONCLUSIONS 71
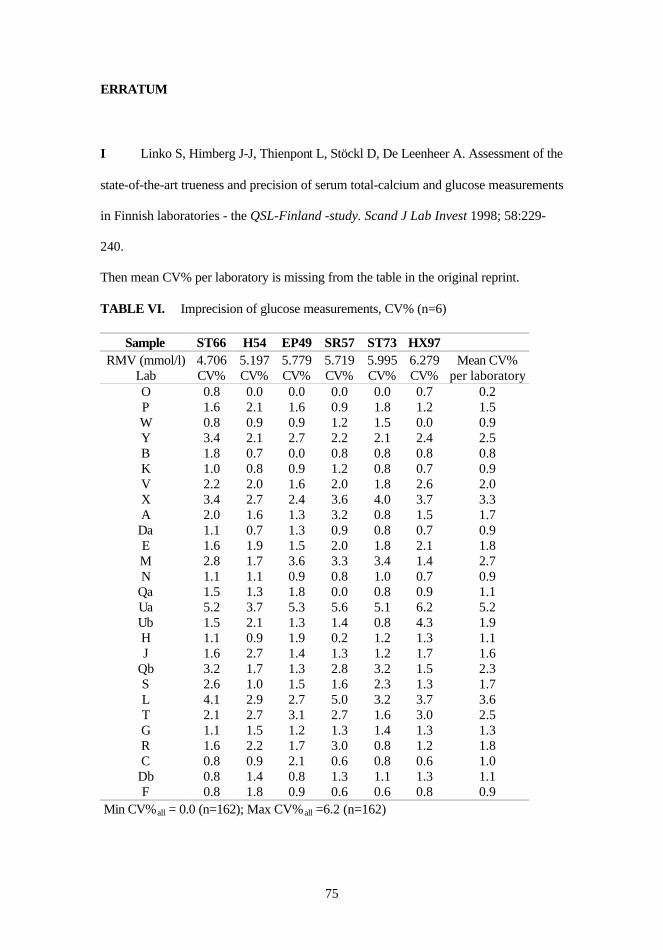
ERRATUM 75
REFERENCES 76
Enfocus Software - Customer Support
5
LIST OF THE ORIGINAL COMMUNICATIONS
I Linko S, Himberg J-J, Thienpont L, Stöckl D, De Leenheer A. Assessment of the
state-of-the-art trueness and precision of serum total-calcium and glucose
measurements in Finnish laboratories - the QSL-Finland -study. Scand J Lab
Invest 1998; 58:229-240.
II Linko S, Örnemark U, Kessel R, Taylor PDP. Evaluation of uncertainty of
measurement in routine clinical chemistry – applications to determinations of the
substance concentration of calcium and glucose in serum. Clin Chem Lab Med
2002; 40(4):391-398.
III Linko S, Linko L, Himberg J-J. Self-monitored blood glucose – the need for
quality goals and the role of clinical laboratory. Submitted for publication.
IV Linko S, Taskinen E, Sarna S, Kärkkäinen P. Factors affecting the cytology
outcome of Pap smears - a brief approach to internal quality control in private
V Linko S. Automated Ion Selective Measurement of Lithium in Serum. A Practical
Approach to Result Level Verification in a Two-way Method Validation. Accred
Qual Assur 2001; 6:31-36.
VI Linko S. Internal audits in private medical laboratory practice - a Finnish
experience. Accred Qual Assur 2002; 7:55-59.
Enfocus Software - Customer Support
6
LIST OF ABBREVIATIONS AND ACRONYMS
1. Abbreviations for associations, committees, organisations and laboratories
ANSI American National Standards InstituteBIPM International Bureau for Weights and MeasuresCAP College of American PathologistsC-AQ Committee for Analytical QualityCCHSA Canadian Council on Health Services AccreditationCCQM Consultative Committee for Amount of SubstanceCGPM Conférence Générale des Poids et MesuresCIPM Comité International des Poids et MesuresCITAC Co-Operation on International Traceability in Analytical ChemistryEA European co-operation for AccreditationEC European CommunityEGE-Lab European Group for the Evaluation of Reagents and Analytical Systems in
Laboratory MedicineEQALM European Committee for External Quality Assessment Programmes in
Laboratory MedicineEURACHEM European Association for Analytical ChemistryFDA U.S. Food and Drug AdministrationFINAS Finnish Accreditation ServiceGHTF Global Harmonization Task ForceIEC International Electrotechnical CommissionIFCC International Federation of Clinical Chemistry and Laboratory MedicineIRMM Institute for Reference Materials and MeasurementsISO International Organization for StandardizationJCAHO Joint Commission on Accreditation of Healthcare OrganizationsLAP Laboratory accreditation programmeNATA National Association of Testing AuthoritiesNCCLS National Committee for Clinical Laboratory StandardsNIST National Institute of Standards and Technology (U.S.)OECD Organisation for Economic Co-operation and DevelopmentSWEDAC Swedish AccreditationTAG Technical advisory groupTC Technical committeeWG Working group
2. Acronyms
2.1 Acronyms used in equations and calculations
BA Analytical biasC.I. Confidence IntervalCVA Analytical coefficient of variationCVG Inter-individual biological variationCVI Intra-individual biological variationCVPRE Pre-analytical variationFN False Negative
CLIA Clinical Laboratory Improvement AmendmentsEN European StandardEQA External Quality AssessmentGLP Good Laboratory PracticeGUM Guide to the expression of Uncertainty in MeasurementID-GC-MS Isotope Dilution- Gas Chromatography- Mass SpectrometryIMEP International Measurement Evaluation ProgrammeIQC Internal Quality ControlIVD In Vitro Diagnostic (medical) DevicePap Papanicolaou (smear)POCT Point-Of-Care-TestingPT Proficiency TestingSI System International d`UnitesSMBG Self Monitoring of Blood Glucose
Enfocus Software - Customer Support
8
ABSTRACT
Measurement quality in medical laboratories was studied with a set of six quality tools:
I Use of reference methods and single donation sera, II Evaluation of uncertainty of
measurement, III Assessment of performance characteristics, IV Internal quality control,
V Method validation and VI Internal audits.
Using single donation whole blood and sera, routine patient serum and cervical smear
samples, own observations from measurements and questionnaires, manufacturers'
specifications, and data from literature carried out material sampling.
Common clinical chemistry routine methodology for serum total calcium, glucose and
lithium, gynecological cytopathology for Papanicolaou tests and reference methodology
for total calcium and glucose served as the basis for the methods of measurement used.
The applied in vitro diagnostic medical devices consisted of system-dependent and
system-independent calibrators with automated analyzing systems, patient-of-care testing
meters intended for self-monitoring of glucose, control material for daily and proficiency
testing purposes, and traceable reference materials.
Fit-for-purpose statistical methods and software were applied to classify the obtained
data. The principles of international standards and guides were followed in all parts of the
study. The present work was accomplished under co-operation of several European
laboratories and institutes.
The use of the set of tools revealed common important characteristics and points of quality
assurance in medical laboratories across the study. Reference methods and single
donation sera were excellent tools for demonstrating laboratory performance in terms of
Enfocus Software - Customer Support
9
the state-of-the-art accuracy and trueness in Finnish laboratories. The importance of
personnel skills, method validation and feedback meetings from internal quality control
was emphasized. Need for training to perform internal audits was shown.
This study showed the necessity of the legislative control over the industry around in vitro
diagnostic medical devices. Measurement quality is closely related to traceability,
measurement hierarchy of metrology and evaluation of measurement uncertainty. The
acceptable levels of uncertainty should be expressed as quality goals, which should be
based on biological variation and medical needs.
Keywords: reference methods, quality, uncertainty, IQC, Pap smear, self-monitoring of
blood glucose, SMBG, in vitro diagnostic medical devices, IVDs, lithium, validation,
ISO/IEC 17025, internal audits
Enfocus Software - Customer Support
10
INTRODUCTION
The operation of laboratory medicine in patient care, monitoring and diagnosis is strongly
linked to measurements and observations applied to laboratory samples. Producing
reliable results within a reasonable turnaround time is the ultimate responsibility of
medical laboratories. The total quality of the laboratory service, from the pre-analytical
phase through the analytical phase to reporting, is to support the clinicians' decision-
making.
The proper management of laboratory processes needs supervised personnel doing the
right things in the right way. Well-defined rules are necessary for this management, as the
numerous processes range from sample taking to reporting. International standards, guides
and legislation support the establishment and implementation of quality systems. The
quality of laboratory results, as being the end products of the process, thus strongly
reflects the internal efficiency and the outcome of quality assurance.
Several hundreds of laboratory investigations exist in the production repertoire of modern
medical laboratories. Indeed, the analysing techniques vary from quantitative high
automation to qualitative manual observations, the latter being not of any less importance.
Awareness and demonstration of the existing quality level of all results is of the utmost
necessity. In the global harmonisation of medical laboratory results, demonstrating the
traceability when possible is of great importance.
Quality is not a recent concept and medical laboratories have long traditions in
demonstrating the reliability of the laboratory results. The primary objective of this study
was to introduce a set of quality assurance tools and to demonstrate the appropriate use of
Enfocus Software - Customer Support
11
them in quality assurance. The set of tools reflects only some, of the crucial quality actions
taken in medical laboratories.
In routine quantitative chemistry, the state-of-the-art accuracy of serum calcium and
glucose analyses was shown in Finnish medical laboratories utilising reference methods
and commutable control material (Tool I). In addition to accuracy, i.e. trueness and
precision, the reliability of these common chemistry analyses was evaluated and
expressed as the uncertainty of measurement utilising data and observations from
laboratory routine measurements and data from manufacturer combined to a software
application intended for this use (Tool II). Assessment of analytical performance
characteristics is proposed in the example from Self-Monitoring-of-Blood-Glucose
(SMBG) representing Point-Of-Care-Testing (POCT) (Tool III) and method validation
from therapeutic drug monitoring (Tool V). When introducing internal quality control
(IQC) to the set of tools, patient-related factors affecting re-screening of cytopathology
samples and agreement in senior pathologists´ reviews was highlighted (Tool IV).
In the context of implemented and accredited quality systems, continuous quality
improvement has to cover all quality processes including internal audits (Tool VI).
Amending and upgrading this quality assurance tool has to derive from the opinions of the
laboratory personnel.
Enfocus Software - Customer Support
12
REVIEW OF THE LITERATURE
1. Metrology in laboratory medicine
1.1 The infrastructure of metrology
Metrology is defined as `science of measurement´ including all aspects both theoretical
and practical with reference to measurements, whatever their uncertainty, and in whatever
fields of science of technology they occur1.
In 1875, the Convention of the Metre (Convention du Métra) was signed by 17 nations in
Paris as the necessity for global comparability was arisen2,3. Today, after slight
modifications in 1921, this diplomatic treaty between fifty-one member states outlines an
international measurement infrastructure with bodies/organizations and with links to
national measurement institutes. The Convention gives authority to the Conférence
Générale des Poids et Mesures (CGPM), the Comité International des Poids et Mesures
(CIPM) and Bureau International des Poids et Mesures (BIPM) to act in matters of world
metrology. Together with consultative committees the BIPM as being the international
center for metrology, organizes the daily work. The consultative committee for amount of
substance (CCQM) has existed since 1995. The demand for measurement standards of
ever-increasing accuracy, range and diversity and the need to demonstrate equivalence
between national measurement standards are of particular concern in this work. The
Mutual Recognition Arrangement linked to national measurement institutes aims to
increase the knowledge about the agreement between national measurement standards and
specific measurements. Inter-laboratory comparisons or key comparisons coordinated by
CCQM in the field of chemistry are important acts taken on this matter.
Enfocus Software - Customer Support
13
1.2 The International System of Units (SI)
In 1960, the System International d` Unites, SI became4. The seven dimensionally
independent base units are the meter, the kilogram, the second, the ampere, the Kelvin, the
mole, and the candela. Today, the kilogram, also known as `Le Grand K´, is the only
remaining base SI unit defined by a man-made artifact. The global comparability of
analytical results is in principal established by SI5. The International Federation of
Clinical Chemistry and Laboratory Medicine (IFCC) has recommended the use of SI in
laboratory medicine due to the general acceptance that standardization of routine
measurements should be done by agreement on common basis of metrology6.
1.3 Traceability
Traceability is internationally defined1 as `the property of the result of a measurement or
the value of a standard whereby it can be related to stated references, usually national or
international standards, through an unbroken chain of comparisons all having stated
uncertainties´. This concept can be understood as a property of the value of the result of a
measurement5, 7. Attaining traceability means providing measurement comparability, i.e.
the ability to compare measurements on a global basis. It is stated that comparability is not
only a problem of traceability to SI units or standards used. Moreover, the concept of
comparability is connected to reference materials, method validation, and proficiency
testing (PT)8.
Traceability in laboratory medicine is not a new issue. In practice, traceability to SI
means that measurement systems have to be designed in a way that they produce results
closely related to the true value. A meaningful measurement system in five distinct parts
has already been introduced in the 1970s9, 10:
Part 1. A rational, self-consistent system of units of measurement (e.g. the SI system)
Enfocus Software - Customer Support
14
Part 2. The material to realize in daily practice the defined units and their derivatives (e.g.
the certified reference materials)
Part 3. The availability of accurate methods of measurements, analysis, or test, based on
the well-characterized materials of part 2 (e.g. IFCC reference methods)
Part 4. Field or applied methods of measurement, analysis or test (i.e. the methods applied
on a large scale in everyday work)
Part 5. A method whereby the long-term integrity of the measurement system is assured
was used in the preparation of a 50 mM solution, then serially diluted and used for
linearity testing in a range between 0.06 mmol/l and 4.01 mmol/l of lithium (V).
5. Software applications, statistical methods and calculations
The GUM Workbench software, version 1.3 (Metrodata GmbH, Grenzach-Wyhlen,
Germany) was used to facilitate the calculations of the combined standard uncertainties,
uc and expanded uncertainties U (II).
Enfocus Software - Customer Support
40
The Analyse-It with Microsoft Excel 5.0 for Windows software (Analyse-It Software
Ltd., 40 Castle Ings Gardens, Leeds, U.K.) was used to:
• test the linearity by ordinary linear regression (V)
• test the normality of the laboratory test result data by Shapiro-Wilk W test (III, V)
• judge the agreement between the studied method setups with Altman-Bland plots
(V)
• compare between methods by Passing-Bablok regression analysis (V).
The Marchandise equation was applied in the evaluation of the biases from the PT
outcome (V).
The significant changes expressed in mmol/l were calculated using the generally
applicable quality specifications based on biological variation and subject-based
reference intervals (III).
SPSS for Windows version 8.0 (SPSS Inc., Chicago, IL, U.S.A) was used to:
• test the intra- and inter-observer variations by the Linear-by-linear Association
(IV)
• assess the effect of intra-uterine device, patient age and hormone replacement
treatment on re-screening parameters (IV)
• evaluate the re-viewing agreement between pathologists by cross-tabulating (IV).
Microsoft Excel for Windows version 5.0 (Microsoft Corporation, CA, U.S.A.) was
for all basic calculations and tabulating (I-VI).
Enfocus Software - Customer Support
41
6. Co-operating laboratories, institutes and commercial companies
Medical laboratories in 21 Finnish hospitals and clinical institutes participated
voluntarily in the QSL-Finland study (I). Other essential co-operators were:
• Helsinki University Central Hospital, Department of Clinical Chemistry (Helsinki,
Finland) (I)
• Laboratories for Analytical Chemistry and Medical Biochemistry and Clinical
Analysis, Faculty of Pharmaceutical Sciences, University of Gent (Gent, Belgium)
(I)
• Diacor, The Deaconess Institute Clinical Laboratory (Helsinki, Finland) (I, III)
• Medix Laboratories Ltd. (Espoo, Finland) (II, IV, V, VI)
• Kanta-Häme Central Hospital Laboratory (Hämeenlinna, Finland) (III)
• Rinnekoti Foundation Laboratory (Espoo, Finland) (V)
• IRMM, Joint Research Centre, European Commission (Geel, Belgium) (II)
• Roche Diagnostics (Mannheim, Germany and Espoo, Finland) (II).
7. International standards and guides
Outlines of pre-analytic and analytic technical and managerial procedures were tangent
to general requirements set to competent testing laboratories in the ISO Guide 2567 and
the standard EN 4500170 (I, III, IV, V, VI). The principles laid down in the
EURACHEM/CITAC Guide115 were followed in the evaluation of the uncertainty of
measurement (II). Good laboratory practice was followed in all experimental work (I-
VI).
Enfocus Software - Customer Support
42
RESULTS
1. Primary results from the use of the tools I-VI
1.1 Use of reference methods and single donation sera (Tool I)
Total calcium and glucose
The blood donors had a healthy background and they were fasting prior to blood
donation, which resulted in normal and quite similar concentration levels of total
calcium and glucose. The reference method values with uncertainties (Confidence
Interval, C.I. 95%) for the six single donation sera are summarized below in Table 1.
Ion chromatography was operated under the condition of a maximum bias of 0.7% and
ID-GC-MS under the condition of a maximum bias of 0.9%.
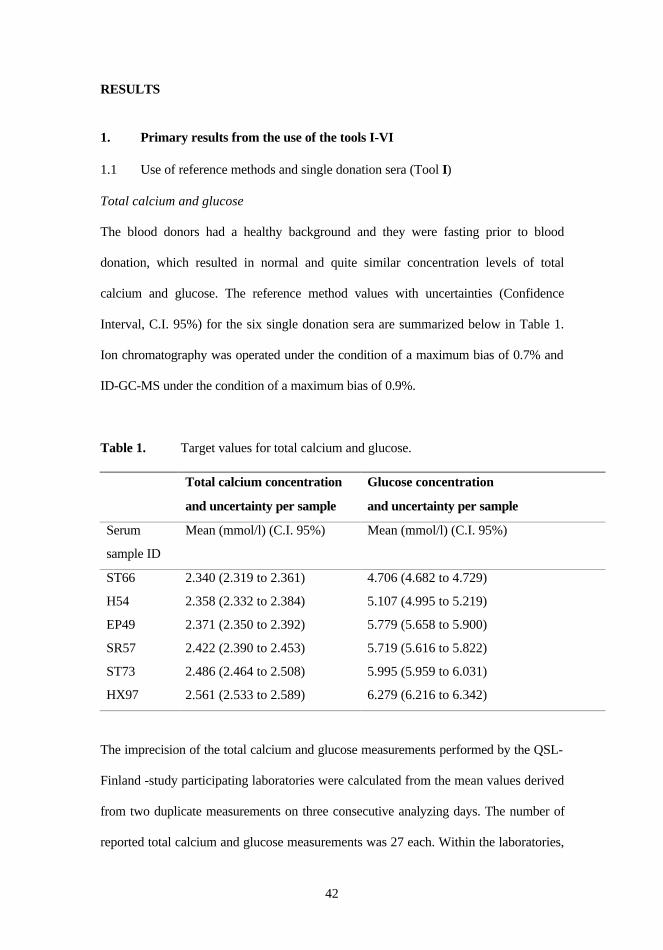
Table 1. Target values for total calcium and glucose.
Total calcium concentration
and uncertainty per sample
Glucose concentration
and uncertainty per sample
Serum
sample ID
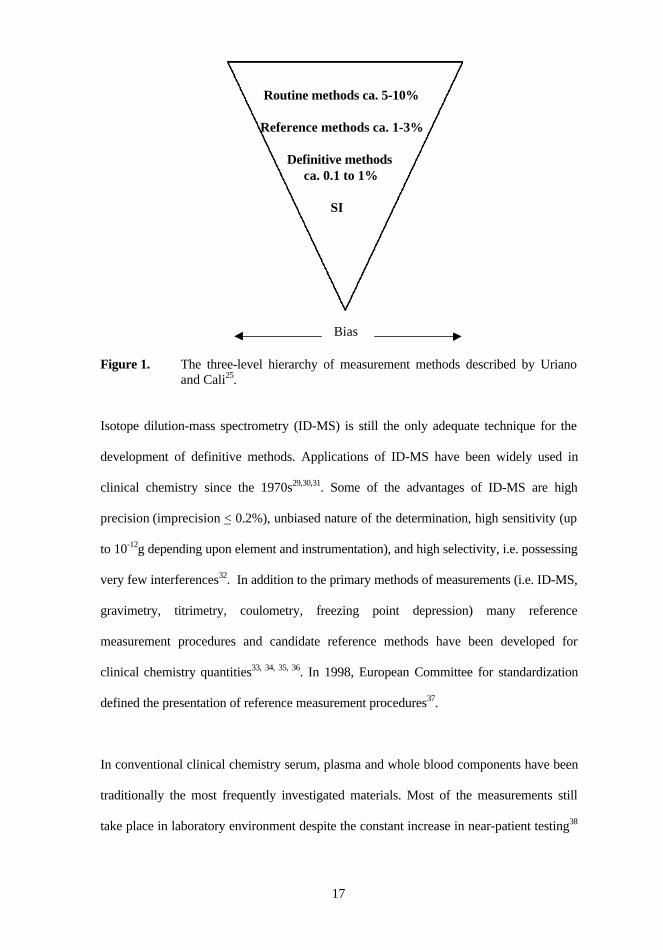
Mean (mmol/l) (C.I. 95%) Mean (mmol/l) (C.I. 95%)
ST66 2.340 (2.319 to 2.361) 4.706 (4.682 to 4.729)
H54 2.358 (2.332 to 2.384) 5.107 (4.995 to 5.219)
EP49 2.371 (2.350 to 2.392) 5.779 (5.658 to 5.900)
SR57 2.422 (2.390 to 2.453) 5.719 (5.616 to 5.822)
ST73 2.486 (2.464 to 2.508) 5.995 (5.959 to 6.031)
HX97 2.561 (2.533 to 2.589) 6.279 (6.216 to 6.342)
The imprecision of the total calcium and glucose measurements performed by the QSL-
Finland -study participating laboratories were calculated from the mean values derived
from two duplicate measurements on three consecutive analyzing days. The number of
reported total calcium and glucose measurements was 27 each. Within the laboratories,
Enfocus Software - Customer Support
43
the mean CV% varied from 0.2% to 4.4% in total calcium measurements, respectively
from 0.2% to 5.2% in glucose measurements.
The deviations from the target values were calculated as mean bias percentages per
laboratory. The lowest mean bias% found in total calcium measurements was -0.7%
while the highest mean bias% was 5.0%. As glucose was measured, the lowest mean
deviation from the reference method value was 0.0% and the highest 3.7%.
1.2 Evaluation of the uncertainty of measurement (Tool II)
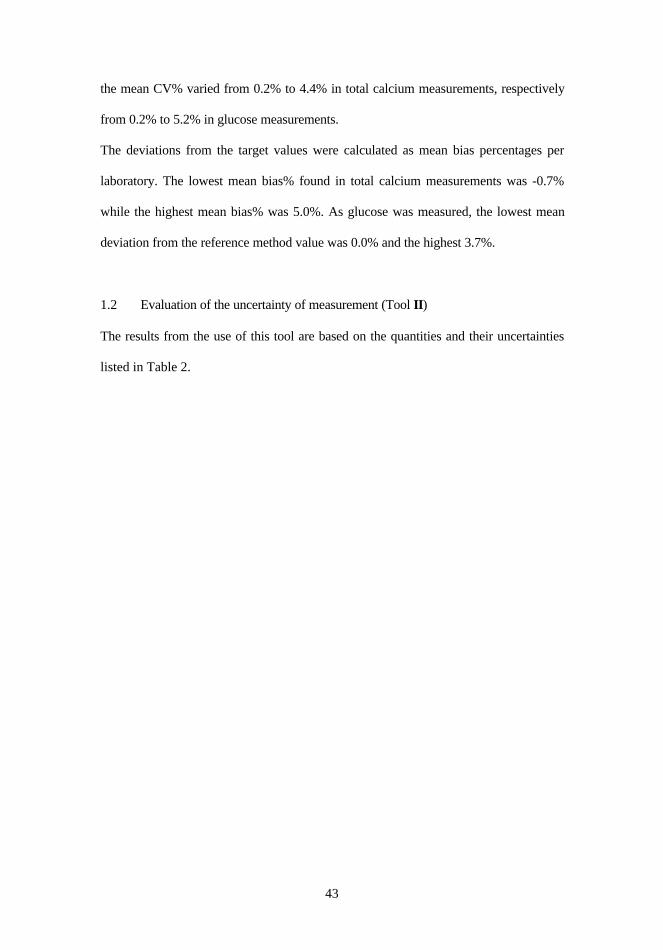
The results from the use of this tool are based on the quantities and their uncertainties
listed in Table 2.
Enfocus Software - Customer Support
Tab
le 2
. L
ist o
f qu
antit
ies
with
uni
ts a
nd d
escr
iptio
ns.
Qua
ntit
yU
nit
Des
crip
tion
c’x
mm
ol/l
The
mea
sura
nd, i
.e. s
ubst
ance
con
cent
ratio
n of
cal
cium
(c C
a) o
r gl
ucos
e (c
Glu
c) in
the
seru
m s
ampl
e
c xm
mol
/lSu
bsta
nce
conc
entr
atio
n of
cal
cium
or
gluc
ose
in th
e sa
mpl
e so
lutio
n
c 0m
mol
/lSu
bsta
nce
conc
entr
atio
n of
cal
cium
(or
glu
cose
) in
sol
utio
n us
ed to
est
ablis
h th
e ze
ro-p
oint
of
the
calib
ratio
n cu
rve
c cal
mm
ol/l
Subs
tanc
e co
ncen
trat
ion
of c
alci
um o
r gl
ucos
e in
cal
ibra
tor
As
AU
iN
orm
aliz
edii a
nd b
lank
-cor
rect
ed a
bsor
banc
e si
gnal
of
sam
ple
solu
tion
in th
e cu
vette
A0
AU
Abs
orba
nce
sign
al f
rom
sol
utio
n us
ed to
est
ablis
h th
e ze
ro-p
oint
of
the
calib
ratio
n cu
rve
Aca
lA
UN
orm
aliz
ed a
nd b
lank
-cor
rect
ed a
bsor
banc
e si
gnal
of
calib
rato
r so
lutio
n in
the
cuve
tte
dFa
ctor
des
crib
ing
the
poss
ible
sam
ple
dilu
tion
eith
er b
y th
e an
alys
t or
the
inst
rum
ent
k mat
rix
Fact
or d
escr
ibin
g th
e co
ntri
butio
n fr
om p
ossi
ble
mat
rix
effe
cts
(dif
fere
nce
in c
omm
utab
ility
of
sam
ple
and
calib
rato
r)
k dri
ftFa
ctor
des
crib
ing
the
cont
ribu
tion
from
an
allo
wed
dri
ft in
inst
rum
ent s
ensi
tivity
k pre
mm
ol/l
Ter
m d
escr
ibin
g th
e co
ntri
butio
n fr
om p
re-a
naly
tical
wor
k (l
osse
s, c
onta
min
atio
n et
c.)
k int
raFa
ctor
des
crib
ing
the
cont
ribu
tion
from
the
intr
a-in
divi
dual
bio
logi
cal v
aria
tion
of s
ubst
ance
con
cent
ratio
n of
cal
cium
(or
glu
cose
) in
seru
m
V2
µlT
he v
olum
e of
the
dilu
ent
V1
µlT
he v
olum
e of
the
sam
ple
to b
e di
lute
d
____
____
____
___
i AU
is a
bsor
banc
e un
itsii N
orm
aliz
ed a
bsor
banc
e si
gnal
is c
orre
cted
for
abs
orba
nces
of
an e
mpt
y cu
vett
e an
d a
wat
er-f
ille
d cu
vett
e at
the
requ
este
d w
avel
engt
h(s)
.
Enfocus Software - Customer Support
44
45
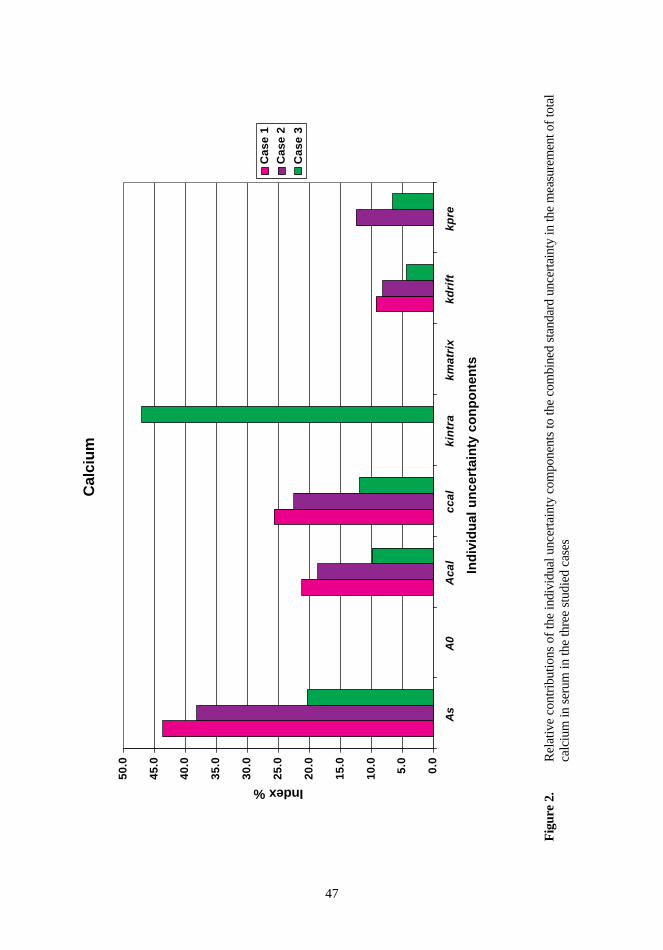
Total calcium
Three cases were studied:
• Case 1 - Uncertainty sources of the analytical phase were considered.
• Case 2 - Also the pre-analytical work (sampling, sample pretreatment and storage)
was considered.
• Case 3 - The patient-related uncertainty source (intra-individual biological
variation) was added in the evaluation.
The relative contributions of the uncertainty components per cases were expressed as
index percentages. The higher the index was, the stronger was the contribution to the
evaluated uncertainty budget. Both in case 1 and case 2, the standard uncertainties of the
normalized and blank-corrected absorbance signals of sample solution and calibrator in
cuvette and substance concentration of calcium in calibrator solution had the strongest
contributions to the combined standard uncertainties. In case 3, the intra-individual
effect had a dominant influence to the uncertainty budget (Figure 2).
The results from the evaluation of the uncertainty of total calcium measurement in serum
were calculated as combined standard uncertainties and relative expanded uncertainties
both expressed in mmol/l and percentages (Table 3).
Enfocus Software - Customer Support
46
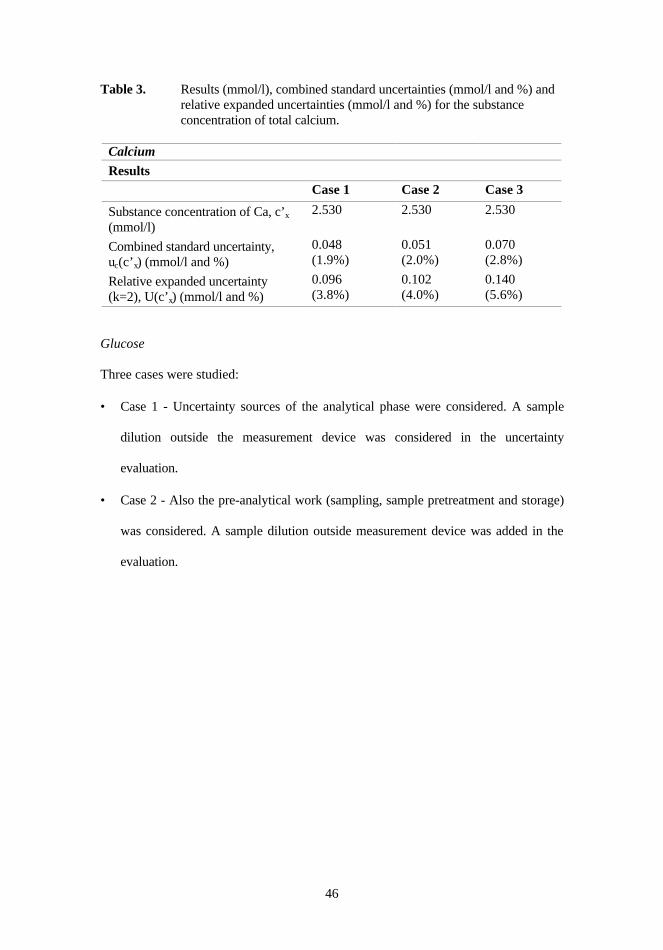
Table 3. Results (mmol/l), combined standard uncertainties (mmol/l and %) andrelative expanded uncertainties (mmol/l and %) for the substanceconcentration of total calcium.
Calcium
ResultsCase 1 Case 2 Case 3
Substance concentration of Ca, c’x
(mmol/l)2.530 2.530 2.530
Combined standard uncertainty,uc(c’x) (mmol/l and %)
0.048(1.9%)
0.051(2.0%)
0.070(2.8%)
Relative expanded uncertainty(k=2), U(c’x) (mmol/l and %)
0.096(3.8%)
0.102(4.0%)
0.140(5.6%)
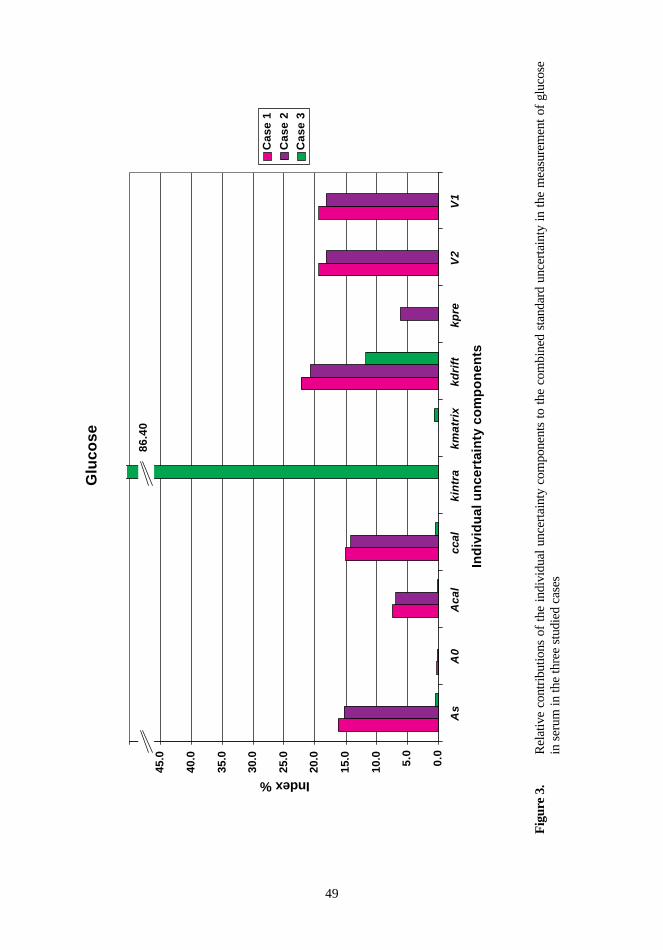
Glucose
Three cases were studied:
• Case 1 - Uncertainty sources of the analytical phase were considered. A sample
dilution outside the measurement device was considered in the uncertainty
evaluation.
• Case 2 - Also the pre-analytical work (sampling, sample pretreatment and storage)
was considered. A sample dilution outside measurement device was added in the
evaluation.
Enfocus Software - Customer Support
Fig
ure
2.
Rel
ativ
e co
ntri
butio
ns o
f th
e in
divi
dual
unc
erta
inty
com
pone
nts
to th
e co
mbi
ned
stan
dard
unc
erta
inty
in th
e m
easu
rem
ent o
f to
tal
calc
ium
in s
erum
in th
e th
ree
stud
ied
case
s
Cal
ciu
m
0.0
5.0
10.0
15.0
20.0
25.0
30.0
35.0
40.0
45.0
50.0
As
A0
Ac
al
cc
al
kin
tra
km
atr
ixk
dri
ftk
pre
Ind
ivid
ual
un
cert
ain
ty c
on
po
nen
ts
Index %
Cas
e 1
Cas
e 2
Cas
e 3
Enfocus Software - Customer Support
47
48
• Case 3 - The patient-related uncertainty source (intra-individual biological
variation) was added in the evaluation. The measured glucose concentration fell
within the expected range and no dilution was included in the analytical phase.
In case 1 and case 2, the uncertainty sources from the sample dilution and the allowed
drift in the instrument sensitivity had the strongest influence to the uncertainty budgets.
A distinct finding from the strong effect of intra-individual biological variation related
to other uncertainty sources was made (Figure 3). The uncertainty budgets of the
evaluation of the uncertainty of glucose measurement in serum in the three studied cases
are summarized in Table 4.
Table 4. Results (mmol/l), combined standard uncertainties (mmol/l and %) and
relative expanded uncertainties (mmol/l and %) for the substance
concentration of glucose.
Glucose
ResultsCase 1 Case 2 Case 3
Substance concentration of glucose, c’x
(mmol/l)45.83 45.83 6.027
Combined standard uncertainty, uc(c’x)(mmol/l and %)
0.562(1.2%)
0.580(1.3%)
0.421(7.0%)
Relative expanded uncertainty (k=2),U(c’x) (mmol/l and %)
1.12(2.4%)
1.16(2.6%)
0.842(5.6%)
Enfocus Software - Customer Support
Fig
ure
3.
Rel
ativ
e co
ntri
butio
ns o
f th
e in
divi
dual
unc
erta
inty
com
pone
nts
to t
he c
ombi
ned
stan
dard
unc
erta
inty
in
the
mea
sure
men
t of
glu
cose
in s
erum
in th
e th
ree
stud
ied
case
s
Glu
cose
0.0
5.0
10.0
15.0
20.0
25.0
30.0
35.0
40.0
45.0
50.0
As
A0
Ac
al
ccal
kin
tra
km
atr
ixk
dri
ftk
pre
V2
V1
Ind
ivid
ual
un
cert
ain
ty c
om
po
nen
ts
Index %
Cas
e 1
Cas
e 2
Cas
e 3
86.4
0
Enfocus Software - Customer Support
49
50
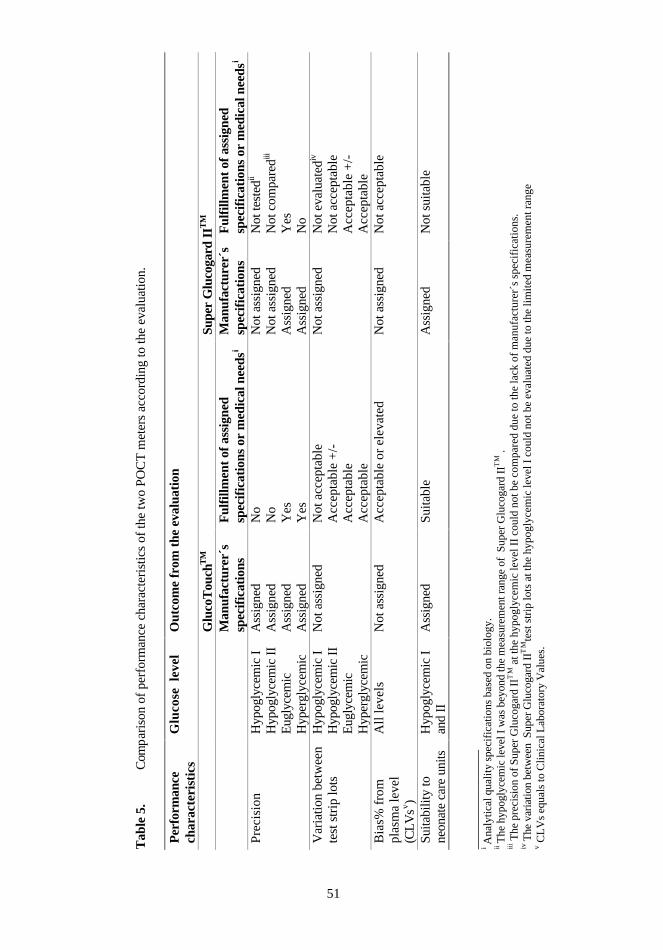
1.3 Assessment of performance characteristics (Tool III)
The analytical performance and suitability for the intended use of two POCT glucose
meters, GlucoTouchTM and Super Glucogard IITM, were studied. The outcome was
compared to the specifications informed by the manufacturers and/or to medical needs
(Table 5).
1.4 Internal quality control (Tool IV)
Primary double screening by cytotechnologists
The number of double-screened Pap smears out of the total number of investigated Pap
smears was 119/87409 during 1996-1999 at Medix. In the gynecological cytology IQC
processes following parameters were screened and evaluated:
• adequacy of diagnostic cellular material
• microbiological findings
• hormonal effects
• leukocyte count
• inflammatory reaction
• cellular atypia
• Papanicolaou classification.
First, excellent inter-observer (n=5) correlation was found in the primary double
screening. This resulted from the following findings during 1996-1999:
• estimation of the adequacy of diagnostic cellular material - 99% inter-observer
agreement
• estimation of microbiological flora - 95% inter-observer agreement
Enfocus Software - Customer Support
Tab
le 5
.C
omp
aris
on o
f pe
rfor
man
ce c
hara
cter
istic
s of
the
two
POC
T m
eter
s ac
cord
ing
to th
e ev
alua
tion.
Per
form
ance
char
acte
rist
ics
Glu
cose
lev
elO
utco
me
from
the
eval
uati
on
Glu
coT
ouch
TM
Supe
r G
luco
gard
IIT
M
Man
ufac
ture
r´s
spec
ific
atio
nsF
ulfi
llmen
t of a
ssig
ned
spec
ific
atio
ns o
r m
edic
al n
eeds
iM
anuf
actu
rer´
ssp
ecif
icat
ions
Ful
fillm
ent o
f ass
igne
dsp
ecif
icat
ions
or
med
ical
nee
dsi
Pre
cisi
onH
ypog
lyce
mic
IH
ypog
lyce
mic
II
Eug
lyce
mic
Hyp
ergl
ycem
ic
Ass
igne
dA
ssig
ned
Ass
igne
dA
ssig
ned
No
No
Yes
Yes
Not
ass
igne
dN
ot a
ssig
ned
Ass
igne
dA
ssig
ned
Not
test
edii
Not
com
pare
diii
Yes
No
Var
iatio
n be
twee
nte
st s
trip
lots
Hyp
ogly
cem
ic I
Hyp
ogly
cem
ic I
IE
ugly
cem
icH
yper
glyc
emic
Not
ass
igne
dN
ot a
ccep
tabl
eA
ccep
tabl
e +
/-A
ccep
tabl
eA
ccep
tabl
e
Not
ass
igne
dN
ot e
valu
ated
iv
Not
acc
epta
ble
Acc
epta
ble
+/-
Acc
epta
ble
Bia
s% f
rom
plas
ma
leve
l(C
LV
sv )
All
leve
lsN
ot a
ssig
ned
Acc
epta
ble
or e
leva
ted
Not
ass
igne
dN
ot a
ccep
tabl
e
Suita
bilit
y to
neon
ate
care
uni
tsH
ypog
lyce
mic
Ian
d II
Ass
igne
dS
uita
ble
Ass
igne
dN
ot s
uita
ble
160
____
____
____
___
i Ana
lyti
cal q
uali
ty s
peci
fica
tion
s ba
sed
on b
iolo
gy.
ii T
he h
ypog
lyce
mic
leve
l I w
as b
eyon
d th
e m
easu
rem
ent r
ange
of
Sup
er G
luco
gard
IIT
M .
iii T
he p
reci
sion
of
Sup
er G
luco
gard
IIT
M a
t the
hyp
ogly
cem
ic le
vel I
I co
uld
not b
e co
mpa
red
due
to th
e la
ck o
f m
anuf
actu
rer´
s sp
ecif
icat
ions
.iv
The
var
iatio
n be
twee
n S
uper
Glu
coga
rd I
ITM
test
str
ip lo
ts a
t the
hyp
ogly
cem
ic le
vel I
cou
ld n
ot b
e ev
alua
ted
due
to th
e li
mit
ed m
easu
rem
ent r
ange
v CL
Vs
equa
ls to
Clin
ical
Lab
orat
ory
Val
ues.
Enfocus Software - Customer Support
51
52
• estimation of hormonal effect - positive trend in inter-observer agreement, although
non-significant (p = 0.050)
• less than 10% intra-observer major disagreements
• significant improvement of accuracy in the inter-observer estimation of
inflammatory findings (p = 0.001).
Secondly, this study revealed significant individual differences in evaluating cellular
atypia, failure and disagreement in benign atypia estimations and failure in primary
classification as Papanicolaou class 2 versus class 3.
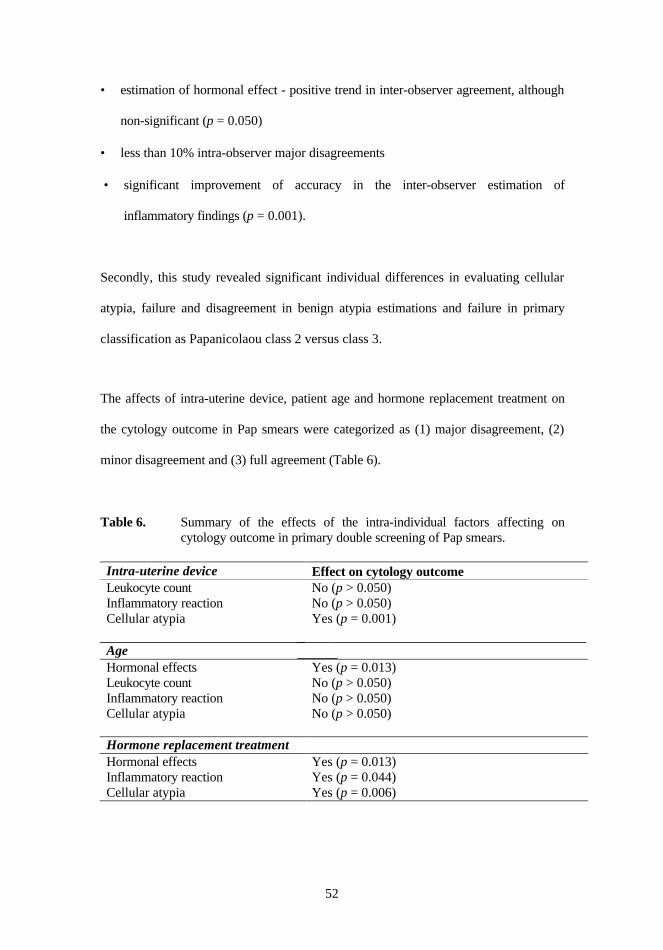
The affects of intra-uterine device, patient age and hormone replacement treatment on
the cytology outcome in Pap smears were categorized as (1) major disagreement, (2)
minor disagreement and (3) full agreement (Table 6).
Table 6. Summary of the effects of the intra-individual factors affecting oncytology outcome in primary double screening of Pap smears.
Intra-uterine device Effect on cytology outcomeLeukocyte count No (p > 0.050)Inflammatory reaction No (p > 0.050)Cellular atypia Yes (p = 0.001)
AgeHormonal effects Yes (p = 0.013)Leukocyte count No (p > 0.050)Inflammatory reaction No (p > 0.050)Cellular atypia No (p > 0.050)