15
Measurement While Drilling 13 An Overview Introduction to Well Engineering - 13 - Measurement While Drilling 1
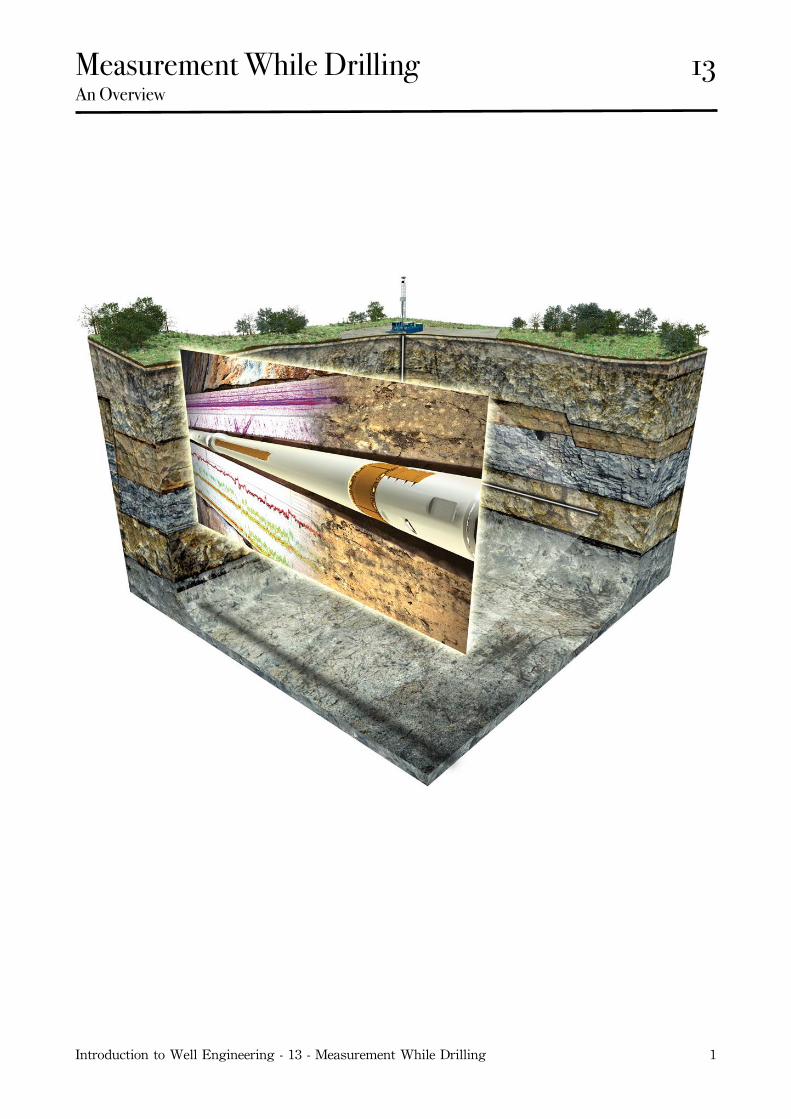
Measurement While Drilling! 13An Overview!
Introduction to Well Engineering - 13 - Measurement While Drilling 1
1. Introduction 3
2. MWD Systems 4
2.1 Power Sources 7
3. MWD - Directional Tools 8
3.1 Calculations for Inclination, Tool-Face & Azimuth 8
3.2 Normal Surveying Routine 11
3.3 Accuracy of MWD Surveys 11
4. MWD - Gamma Ray Tools 12
5. Transmission & Control Systems 14
6. Surface System 15
Contents
Introduction to Well Engineering - 13 - Measurement While Drilling 2
1. Introduction
A Measurement While Drilling (MWD) system allows the driller to gather and transmit information from the bottom of the hole back to the surface, without interrupting normal drilling operations. This information can include directional deviation data, data related to the petrophysical properties of the formations and drilling data, such as WOB and torque. The information is gathered and transmitted to surface by the relevant sensors and transmission equipment, which is housed in a non-magnetic drill collar in the bottom hole assembly (Figure 1). This tool is known as a Measurement While Drilling Tool (MWD). The data is transmitted through the mud column in the drill-string, to surface. At surface the signal is then decoded and presented to the driller in an appropriate format. The transmission system is known as mud pulse telemetry, and does not involve any wireline operations.
Commercial MWD systems were first introduced as a more cost effective method of taking directional surveys. To take a directional survey using conventional wireline methods may take 1-2 hours. Using an MWD system a survey takes less than 4 minutes. Although MWD operations are more expensive than wireline surveying an operating company can save valuable rig time, which is usually more significant in terms of cost.
More recently MWD companies have developed more complicated tools which will provide not only directional information and drilling parameters (e.g. torque, WOB), but also geological data (e.g. gamma ray, resistivity logs). The latter tools are generally referred to as Logging While Drilling (LWD) tools. As more sensors are added the transmission system must be improved, therefore MWD tools are becoming much more sophisticated. Great improvements have been made over the past few years, and MWD tools are now becoming a standard tool for drilling operations.
Introduction to Well Engineering - 13 - Measurement While Drilling 3
2. MWD Systems
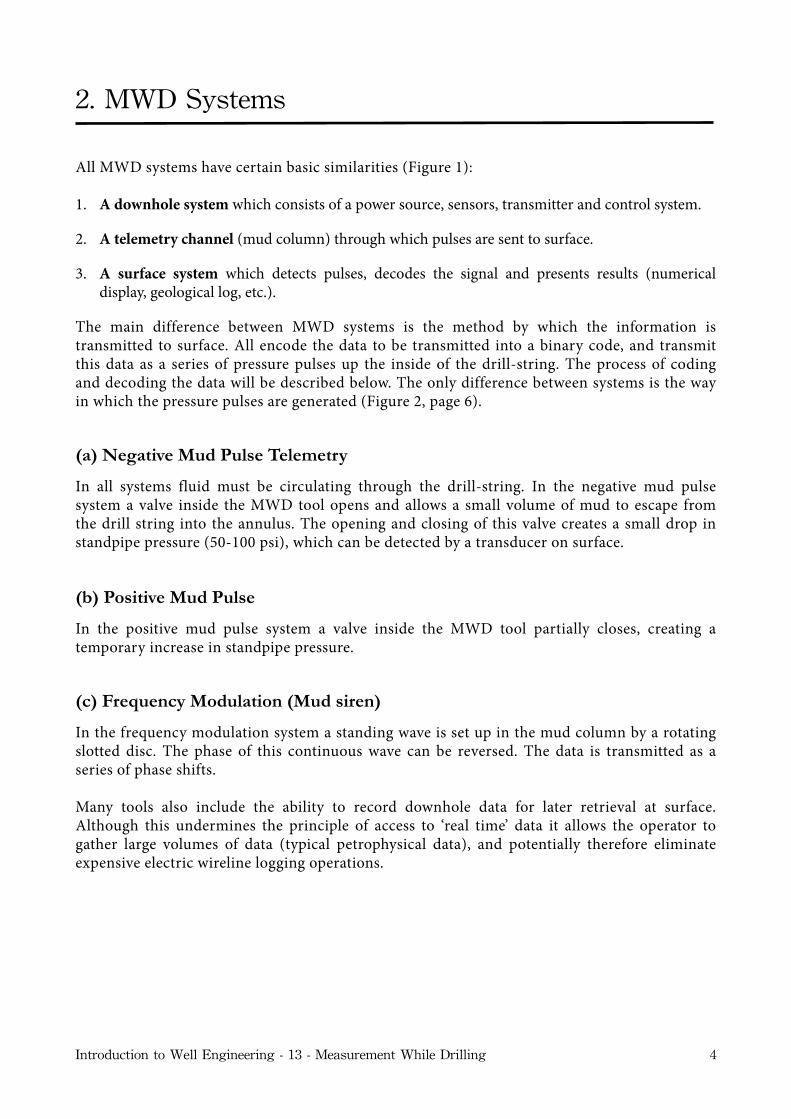
All MWD systems have certain basic similarities (Figure 1):
1. A downhole system which consists of a power source, sensors, transmitter and control system.
2. A telemetry channel (mud column) through which pulses are sent to surface.
3. A surface system which detects pulses, decodes the signal and presents results (numerical display, geological log, etc.).
The main difference between MWD systems is the method by which the information is transmitted to surface. All encode the data to be transmitted into a binary code, and transmit this data as a series of pressure pulses up the inside of the drill-string. The process of coding and decoding the data will be described below. The only difference between systems is the way in which the pressure pulses are generated (Figure 2, page 6).
(a) Negative Mud Pulse Telemetry
In all systems fluid must be circulating through the drill-string. In the negative mud pulse system a valve inside the MWD tool opens and allows a small volume of mud to escape from the drill string into the annulus. The opening and closing of this valve creates a small drop in standpipe pressure (50-100 psi), which can be detected by a transducer on surface.
(b) Positive Mud Pulse
In the positive mud pulse system a valve inside the MWD tool partially closes, creating a temporary increase in standpipe pressure.
(c) Frequency Modulation (Mud siren)
In the frequency modulation system a standing wave is set up in the mud column by a rotating slotted disc. The phase of this continuous wave can be reversed. The data is transmitted as a series of phase shifts.
Many tools also include the ability to record downhole data for later retrieval at surface. Although this undermines the principle of access to ‘real time’ data it allows the operator to gather large volumes of data (typical petrophysical data), and potentially therefore eliminate expensive electric wireline logging operations.
Introduction to Well Engineering - 13 - Measurement While Drilling 4
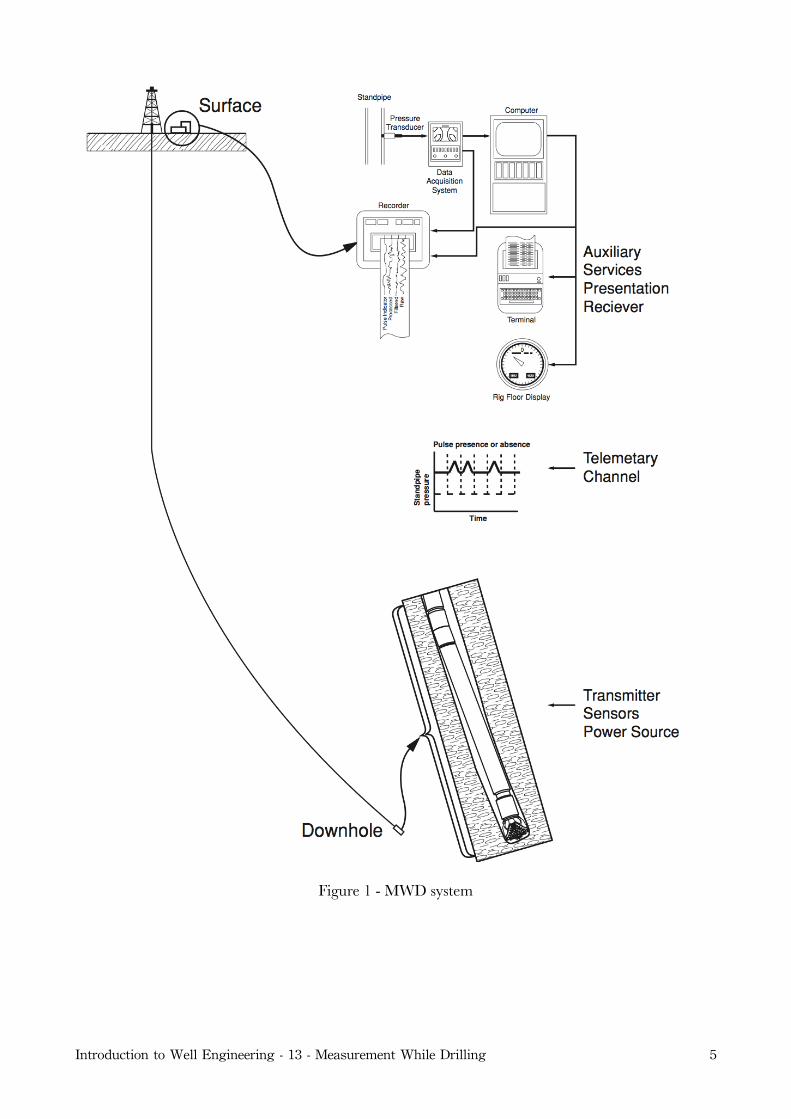
Figure 1 - MWD system
Introduction to Well Engineering - 13 - Measurement While Drilling 5
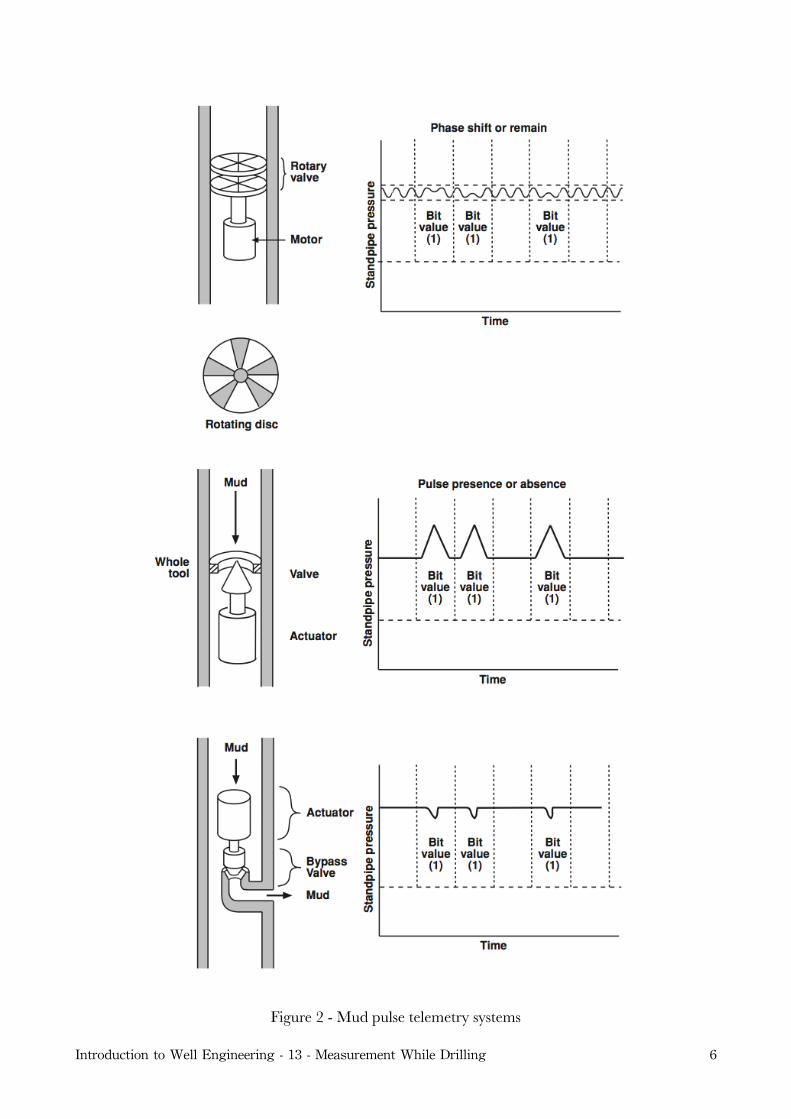
Figure 2 - Mud pulse telemetry systems
Introduction to Well Engineering - 13 - Measurement While Drilling 6
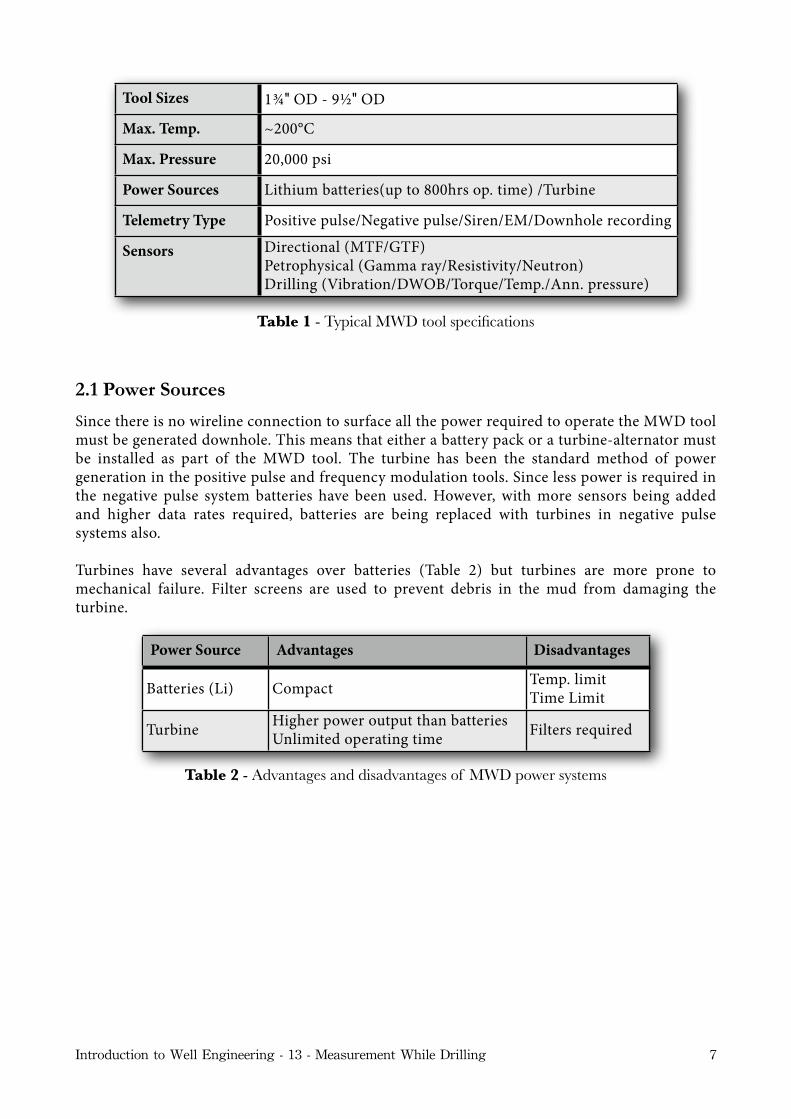
Tool Sizes
Max. Temp.
Max. Pressure
Power Sources
Telemetry Type
Sensors
1¾″ OD - 9½″ OD
~200°C
20,000 psi
Lithium batteries(up to 800hrs op. time) /Turbine
Positive pulse/Negative pulse/Siren/EM/Downhole recording
Directional (MTF/GTF)Petrophysical (Gamma ray/Resistivity/Neutron)Drilling (Vibration/DWOB/Torque/Temp./Ann. pressure)
Table 1 - Typical MWD tool specifications
2.1 Power Sources
Since there is no wireline connection to surface all the power required to operate the MWD tool must be generated downhole. This means that either a battery pack or a turbine-alternator must be installed as part of the MWD tool. The turbine has been the standard method of power generation in the positive pulse and frequency modulation tools. Since less power is required in the negative pulse system batteries have been used. However, with more sensors being added and higher data rates required, batteries are being replaced with turbines in negative pulse systems also.
Turbines have several advantages over batteries (Table 2) but turbines are more prone to mechanical failure. Filter screens are used to prevent debris in the mud from damaging the turbine.
Power Source Advantages Disadvantages
Batteries (Li) Compact Temp. limit Time Limit
Turbine Higher power output than batteriesUnlimited operating time Filters required
Table 2 - Advantages and disadvantages of MWD power systems
Introduction to Well Engineering - 13 - Measurement While Drilling 7
3. MWD - Directional Tools
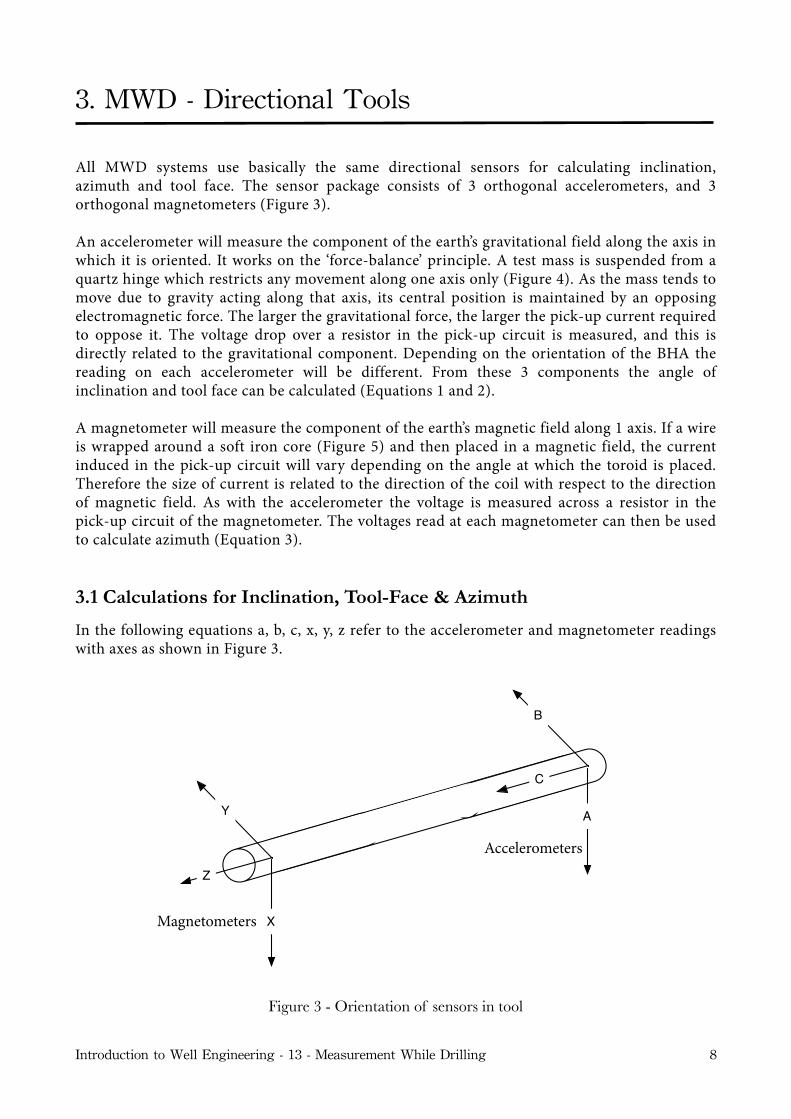
All MWD systems use basically the same directional sensors for calculating inclination, azimuth and tool face. The sensor package consists of 3 orthogonal accelerometers, and 3 orthogonal magnetometers (Figure 3).
An accelerometer will measure the component of the earth’s gravitational field along the axis in which it is oriented. It works on the ‘force-balance’ principle. A test mass is suspended from a quartz hinge which restricts any movement along one axis only (Figure 4). As the mass tends to move due to gravity acting along that axis, its central position is maintained by an opposing electromagnetic force. The larger the gravitational force, the larger the pick-up current required to oppose it. The voltage drop over a resistor in the pick-up circuit is measured, and this is directly related to the gravitational component. Depending on the orientation of the BHA the reading on each accelerometer will be different. From these 3 components the angle of inclination and tool face can be calculated (Equations 1 and 2).
A magnetometer will measure the component of the earth’s magnetic field along 1 axis. If a wire is wrapped around a soft iron core (Figure 5) and then placed in a magnetic field, the current induced in the pick-up circuit will vary depending on the angle at which the toroid is placed. Therefore the size of current is related to the direction of the coil with respect to the direction of magnetic field. As with the accelerometer the voltage is measured across a resistor in the pick-up circuit of the magnetometer. The voltages read at each magnetometer can then be used to calculate azimuth (Equation 3).
3.1 Calculations for Inclination, Tool-Face & Azimuth
In the following equations a, b, c, x, y, z refer to the accelerometer and magnetometer readings with axes as shown in Figure 3.
Figure 3 - Orientation of sensors in tool
B
C
AY
Z
X
Introduction to Well Engineering - 13 - Measurement While Drilling 8
Accelerometers
Magnetometers
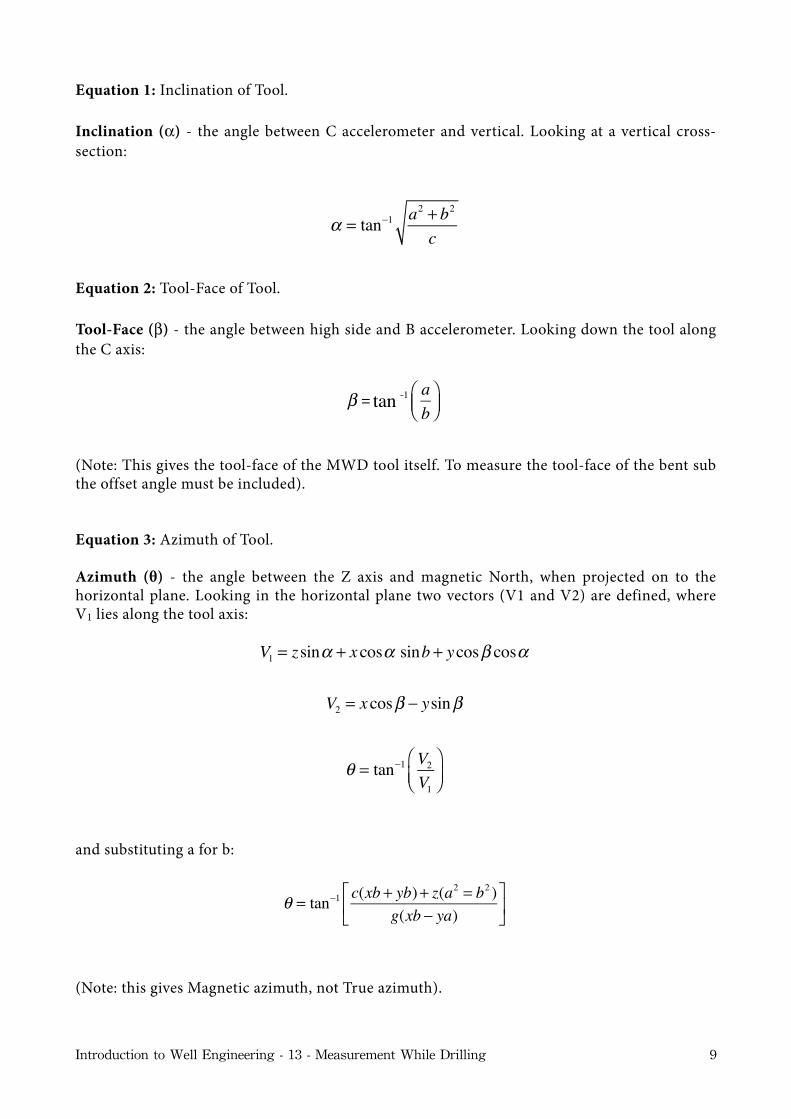
Equation 1: Inclination of Tool.
Inclination (α) - the angle between C accelerometer and vertical. Looking at a vertical cross-section:
Equation 2: Tool-Face of Tool.
Tool-Face (β) - the angle between high side and B accelerometer. Looking down the tool along the C axis:
(Note: This gives the tool-face of the MWD tool itself. To measure the tool-face of the bent sub the offset angle must be included).
Equation 3: Azimuth of Tool.
Azimuth (θ) - the angle between the Z axis and magnetic North, when projected on to the horizontal plane. Looking in the horizontal plane two vectors (V1 and V2) are defined, where V1 lies along the tool axis:
and substituting a for b:
(Note: this gives Magnetic azimuth, not True azimuth).
α = tan−1 a2 + b2
c
β = tan−1 ab
⎛⎝⎜
⎞⎠⎟
V1 = zsinα + xcosα sinb + ycosβ cosα
V2 = xcosβ − ysinβ
θ = tan−1 V2V1
⎛⎝⎜
⎞⎠⎟
θ = tan−1 c(xb + yb)+ z(a2 = b2 )g(xb − ya)
⎡
⎣⎢
⎤
⎦⎥
Introduction to Well Engineering - 13 - Measurement While Drilling 9
tan
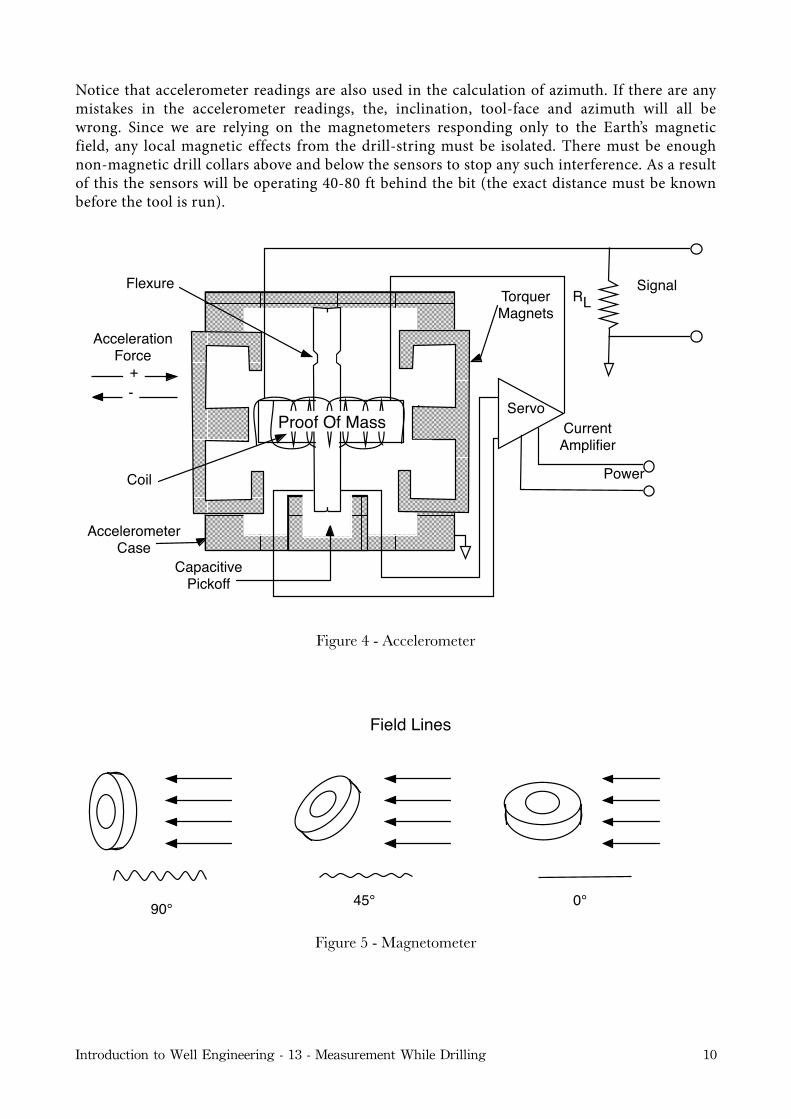
Notice that accelerometer readings are also used in the calculation of azimuth. If there are any mistakes in the accelerometer readings, the, inclination, tool-face and azimuth will all be wrong. Since we are relying on the magnetometers responding only to the Earth’s magnetic field, any local magnetic effects from the drill-string must be isolated. There must be enough non-magnetic drill collars above and below the sensors to stop any such interference. As a result of this the sensors will be operating 40-80 ft behind the bit (the exact distance must be known before the tool is run).
Figure 4 - Accelerometer
Field Lines
90° 45° 0°
Figure 5 - Magnetometer
Servo
Power
SignalRL
+-
AccelerationForce
FlexureTorquerMagnets
Coil
AccelerometerCase
CurrentAmplifier
CapacitivePickoff
Proof Of Mass
Introduction to Well Engineering - 13 - Measurement While Drilling 10
3.2 Normal Surveying Routine
The usual practice in taking a survey is to drill to kelly down, and make the connection. Run in the hole and tag bottom. Pick up 5-10 ft and keep pipe steady for 2 minutes (this allows survey data to be stored). Restart drilling, and survey data is transmitted to surface. In some tools the transmission is initiated by rotation, in others it senses pump pressure. During a steering run, where a mud motor is being used, an update of tool-face is usually transmitted every minute. This is of great value to the directional driller as they monitor progress of the well.
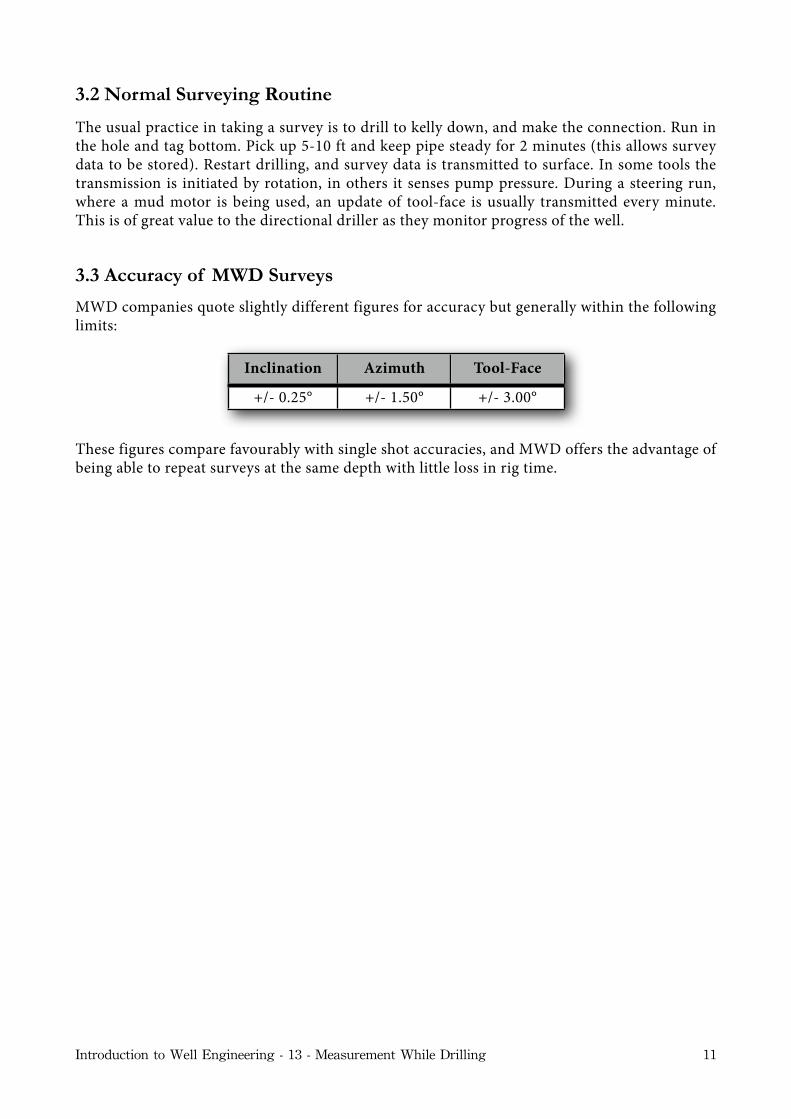
3.3 Accuracy of MWD Surveys
MWD companies quote slightly different figures for accuracy but generally within the following limits:
Inclination Azimuth Tool-Face
+/- 0.25° +/- 1.50° +/- 3.00°
These figures compare favourably with single shot accuracies, and MWD offers the advantage of being able to repeat surveys at the same depth with little loss in rig time.
Introduction to Well Engineering - 13 - Measurement While Drilling 11
4. MWD - Gamma Ray Tools
The Gamma Ray (GR) log is a long established part of formation evaluation. Gamma rays in the formation are emitted mainly by radioactive isotopes of Potassium, Thorium and Uranium. These elements occur primarily in shales, and so the GR log is a good shale indicator.
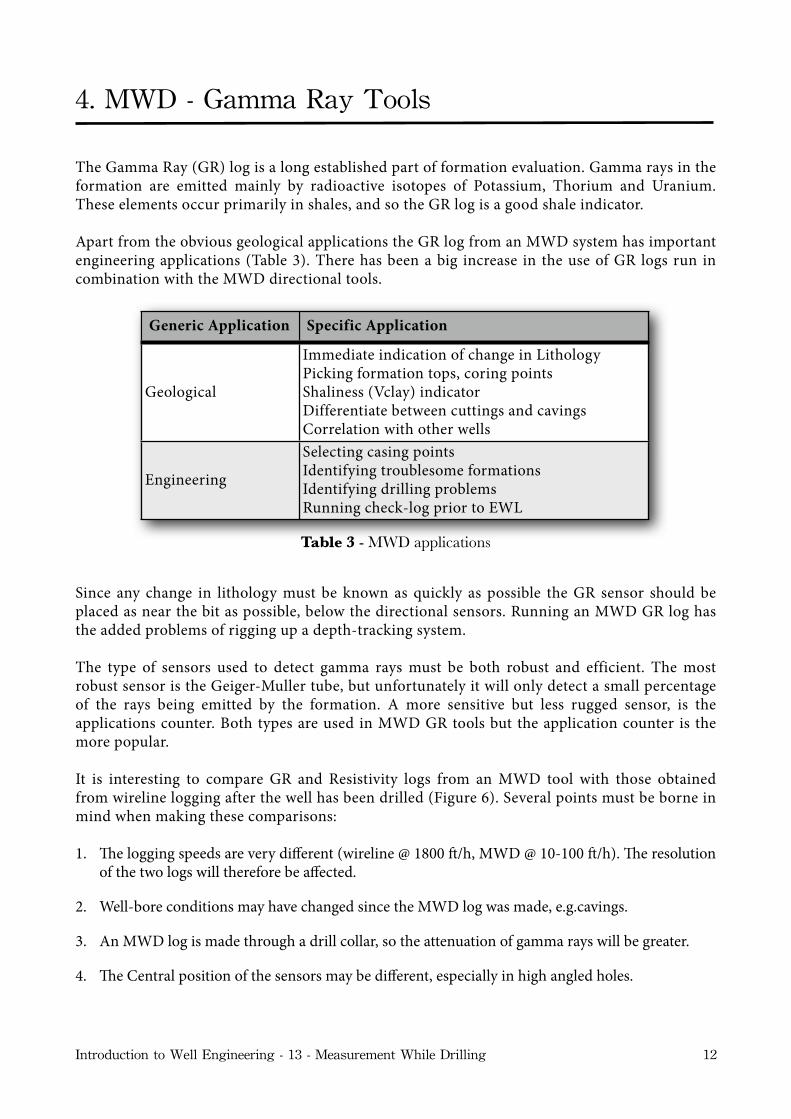
Apart from the obvious geological applications the GR log from an MWD system has important engineering applications (Table 3). There has been a big increase in the use of GR logs run in combination with the MWD directional tools.
Generic Application Specific Application
Geological
Immediate indication of change in LithologyPicking formation tops, coring pointsShaliness (Vclay) indicatorDifferentiate between cuttings and cavingsCorrelation with other wells
Engineering
Selecting casing pointsIdentifying troublesome formationsIdentifying drilling problemsRunning check-log prior to EWL
Table 3 - MWD applications
Since any change in lithology must be known as quickly as possible the GR sensor should be placed as near the bit as possible, below the directional sensors. Running an MWD GR log has the added problems of rigging up a depth-tracking system.
The type of sensors used to detect gamma rays must be both robust and efficient. The most robust sensor is the Geiger-Muller tube, but unfortunately it will only detect a small percentage of the rays being emitted by the formation. A more sensitive but less rugged sensor, is the applications counter. Both types are used in MWD GR tools but the application counter is the more popular.
It is interesting to compare GR and Resistivity logs from an MWD tool with those obtained from wireline logging after the well has been drilled (Figure 6). Several points must be borne in mind when making these comparisons:
1. e logging speeds are very different (wireline @ 1800 /h, MWD @ 10-100 /h). e resolution of the two logs will therefore be affected.
2. Well-bore conditions may have changed since the MWD log was made, e.g.cavings.
3. An MWD log is made through a drill collar, so the attenuation of gamma rays will be greater.
4. e Central position of the sensors may be different, especially in high angled holes.
Introduction to Well Engineering - 13 - Measurement While Drilling 12
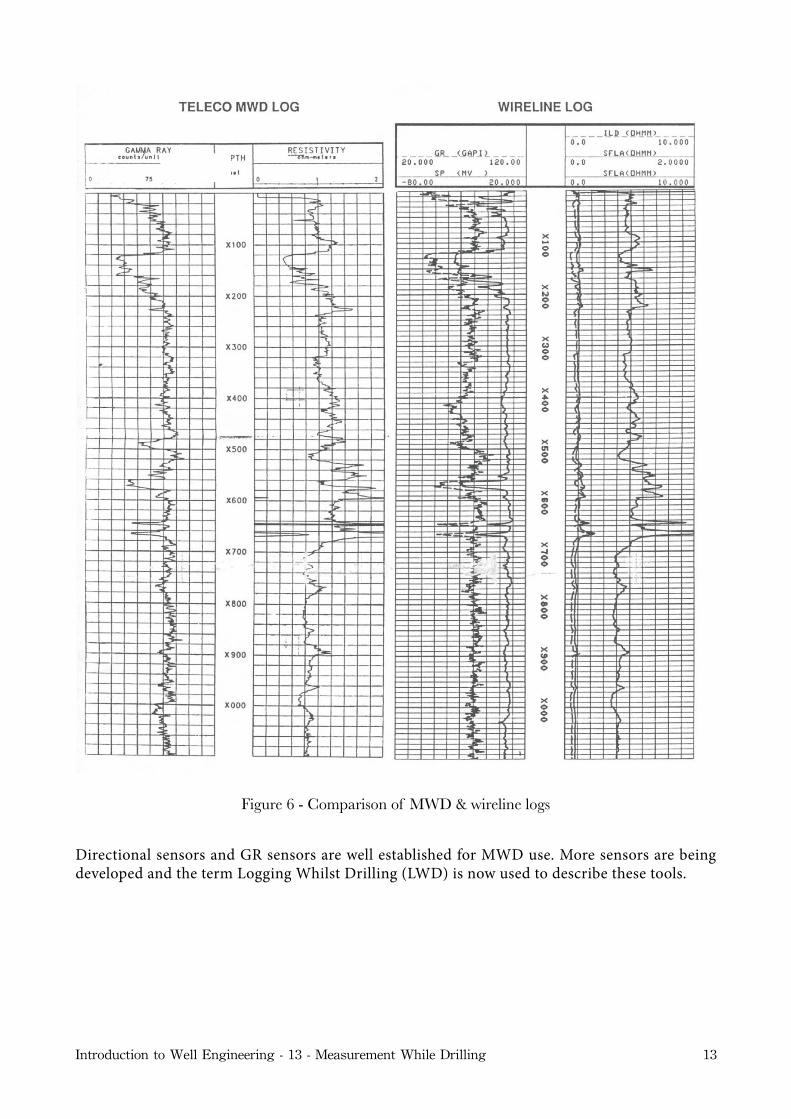
Figure 6 - Comparison of MWD & wireline logs
Directional sensors and GR sensors are well established for MWD use. More sensors are being developed and the term Logging Whilst Drilling (LWD) is now used to describe these tools.
Introduction to Well Engineering - 13 - Measurement While Drilling 13
5. Transmission & Control Systems
There is wide variation in the design of these electronic packages, and they are being continually upgraded. The voltages at each sensor must be read and stored in the memory until the tool is ready to transmit. The control system must co-ordinate the acquisition, storage and transmission of this data. Since there is no electrical on/off switch controlling the system from the surface the tool must react to some physical change (e.g. detecting an increase in pump pressure). Once transmission is initiated the data is sent to surface via the mud column as a series of pulses.
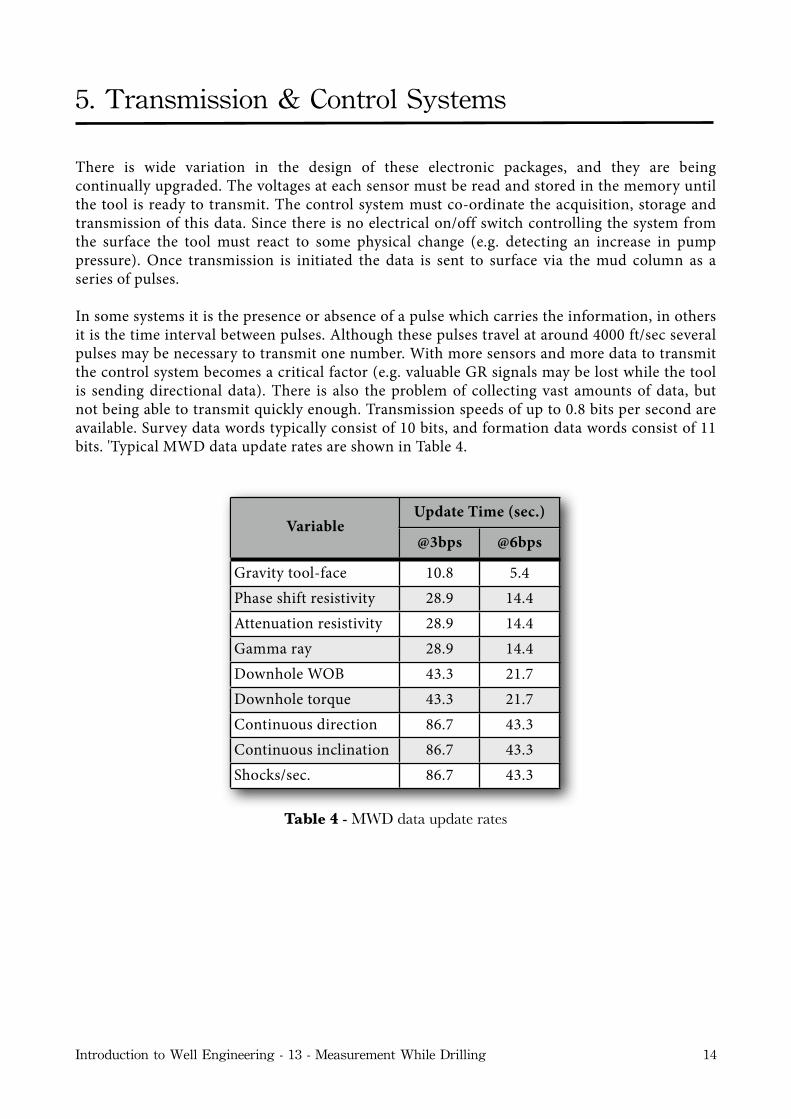
In some systems it is the presence or absence of a pulse which carries the information, in others it is the time interval between pulses. Although these pulses travel at around 4000 ft/sec several pulses may be necessary to transmit one number. With more sensors and more data to transmit the control system becomes a critical factor (e.g. valuable GR signals may be lost while the tool is sending directional data). There is also the problem of collecting vast amounts of data, but not being able to transmit quickly enough. Transmission speeds of up to 0.8 bits per second are available. Survey data words typically consist of 10 bits, and formation data words consist of 11 bits. 'Typical MWD data update rates are shown in Table 4.
VariableUpdate Time (sec.)Update Time (sec.)
Variable@3bps @6bps
Gravity tool-face 10.8 5.4Phase shift resistivity 28.9 14.4Attenuation resistivity 28.9 14.4Gamma ray 28.9 14.4Downhole WOB 43.3 21.7Downhole torque 43.3 21.7Continuous direction 86.7 43.3Continuous inclination 86.7 43.3Shocks/sec. 86.7 43.3
Table 4 - MWD data update rates
Introduction to Well Engineering - 13 - Measurement While Drilling 14
6. Surface System
All MWD systems have a pressure transducer connected to the standpipe manifold. This transducer must be sensitive enough to detect small pressure changes (50-100 psi) occurring for only ±/≤ 1 sec. The series of pulses must then be decoded and processed to give the required information.
The simplest surface system is positive pulse. This has a microprocessor included in the downhole tool so that only numerical values of azimuth inclination and tool-face need be transmitted to surface. A simple binary code is used whereby a pulse detected within a certain time period = 1, no pulse detected = 0. The binary number is then converted to a decimal number for the final result. The equipment necessary to do this can easily be installed in the driller’s ‘dog house’. In other systems only the raw data is sent to surface, in which case more sophisticated equipment is needed (electronic filters, computers, etc.). This equipment is usually housed in a special cabin or in the mud-logging unit. Since this cabin may be located some distance away, the survey results are relayed to a rig floor display unit where the directional driller can see them. Formation evaluation logs require plotting facilities which are also housed in the cabin.
Introduction to Well Engineering - 13 - Measurement While Drilling 15


