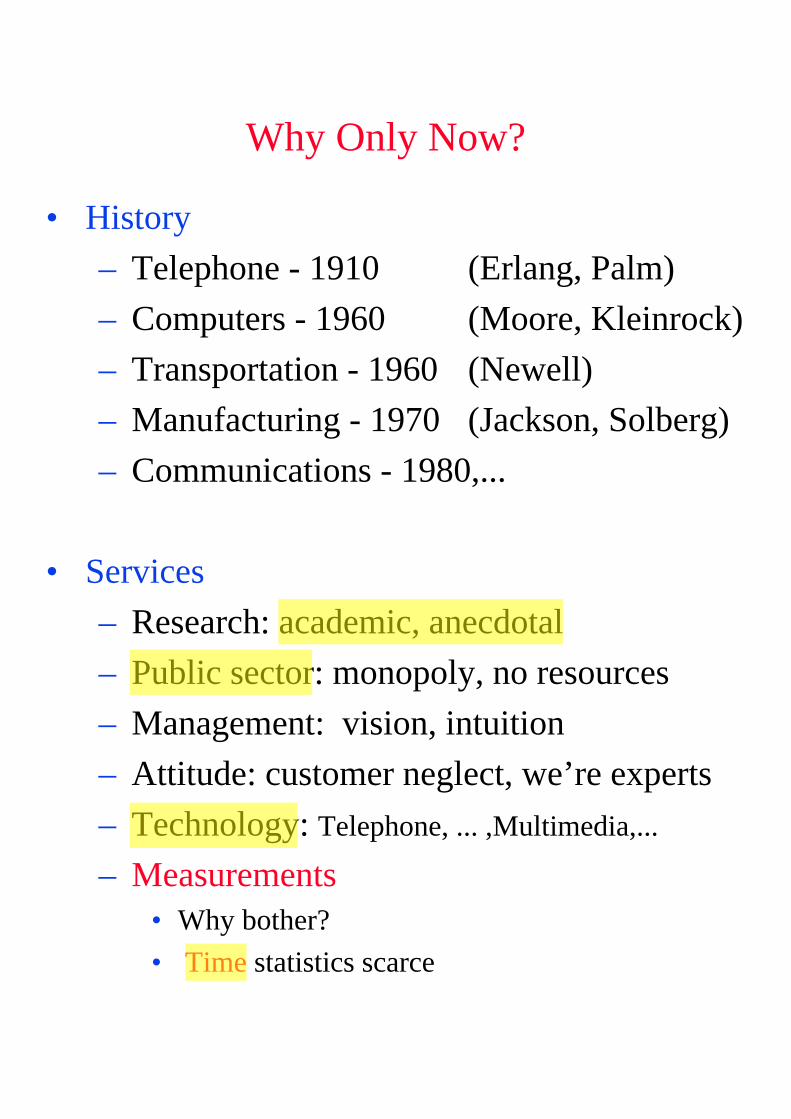
Service Engineering http://ie.technion.ac.il/serveng200· Measurements and MOP (Measures Of Performance) Why Now? Why Measure? Measurements - Some Empirical Axioms Transaction-based (Event-based) Data; Time statistics • Face-to-Face: The T, C, S, I, F, O methods. • Telephone: ACD, CTI/CRM, Surveys. • Internet: Log files. • Transportation: The Hertzel-Balfur intersection. • Administration: Project Management, Emergency Services, Government. • Healthcare: Emergency Departments,... Averages do NOT tell the whole story The Systems/Network View • Niagra Falls, A Bank, A Call Center. • Networks: Decentralized Call Centers, Haifa City Hall, Shouldice Hospital. Simple Tools: Pareto, Fishbone Diagrams, Histrograms. Sometimes enough, but often lead to the use of models and, moreover: Subtleties: What is Service Time, Customers Patience (later) Sample Size Matters Scales; Frequencies of use; Model-based Database (eg. DATA MOCCA = Data Models for Call Center Analysis; Extansions to Healthcare, Internert,...) The Fluid View: Introduction Lord Kelvin said (roughly) the following: “We can not understand (do science with, manage) that which we can not measure (quantify).” Galileo Galilei adds: “Measure what can be measured, and make measurable what can not be measured.” (Does this really apply when “measuring people”?) And Leonard Cohen sings in “The Future”: Won’t be nothing = Nothing you can measure anymore. 1
Transcript
Service Engineeringhttp://ie.technion.ac.il/serveng200·
Measurements and MOP (Measures Of Performance)
Why Now? Why Measure?
Measurements - Some Empirical Axioms
Transaction-based (Event-based) Data; Time statistics
• Face-to-Face: The T, C, S, I, F, O methods.
• Telephone: ACD, CTI/CRM, Surveys.
• Internet: Log files.
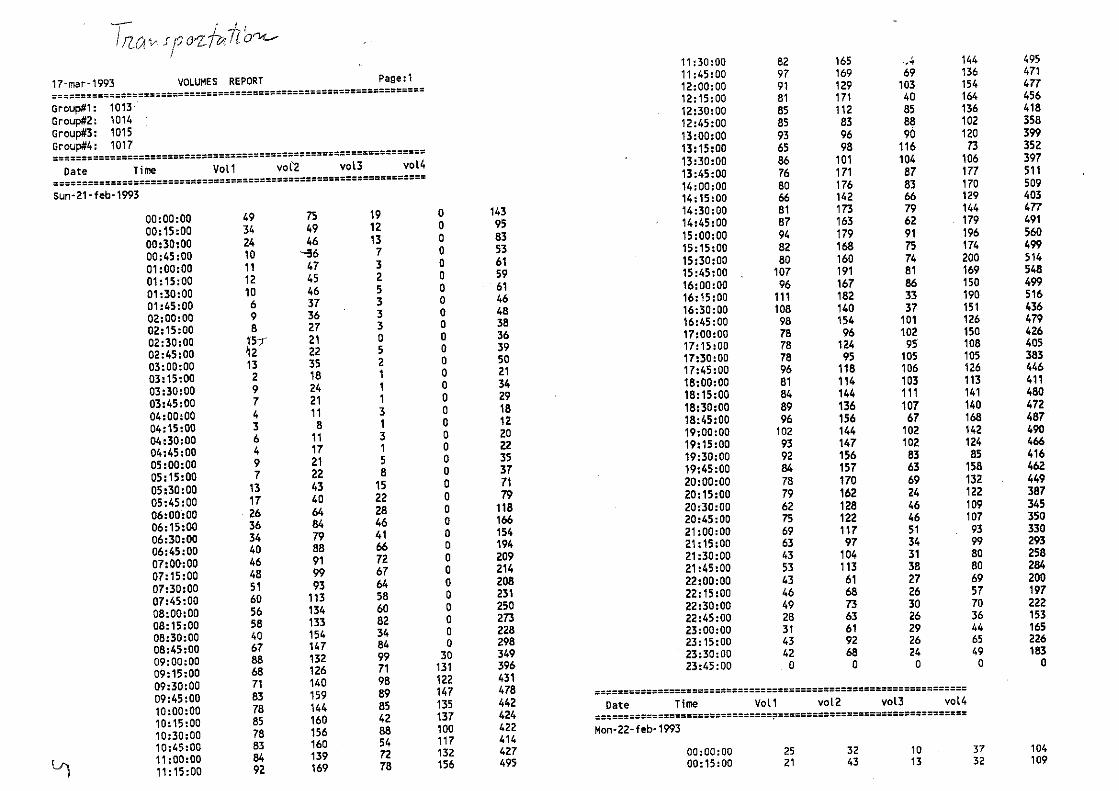
• Transportation: The Hertzel-Balfur intersection.
• Networks: Decentralized Call Centers, Haifa City Hall, Shouldice Hospital.
Simple Tools: Pareto, Fishbone Diagrams, Histrograms. Sometimes enough, butoften lead to the use of models and, moreover:
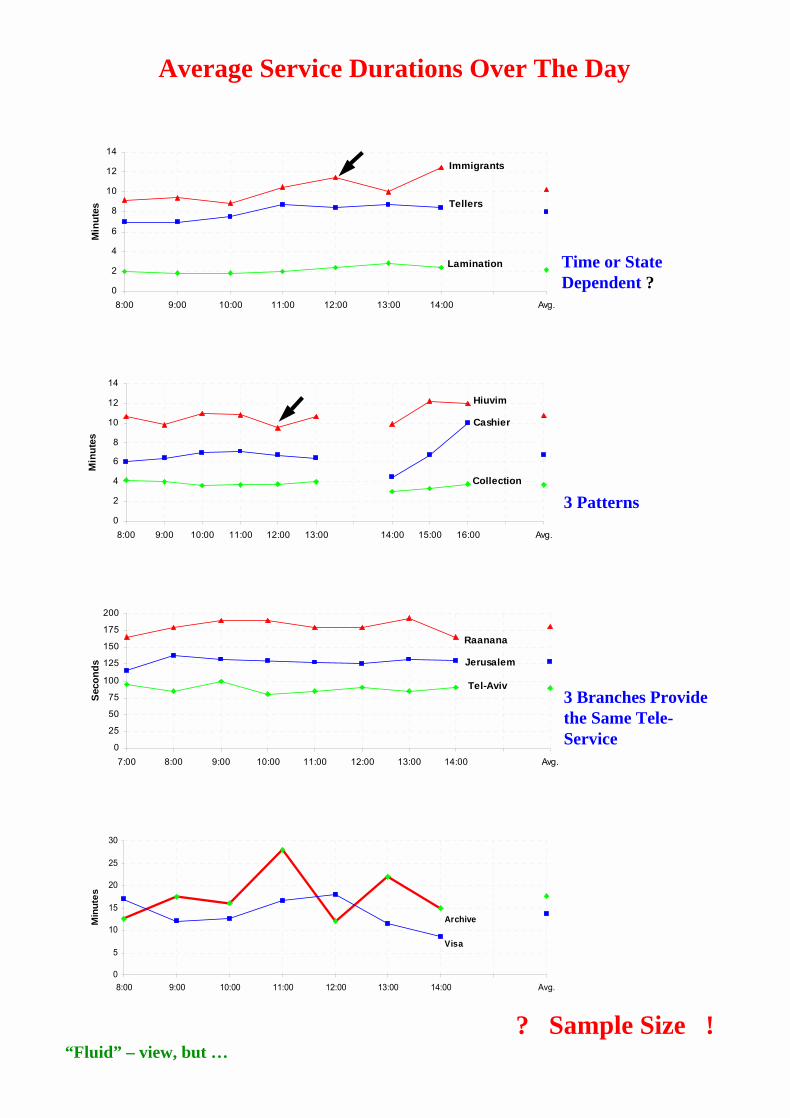
Subtleties: What is Service Time, Customers Patience (later)
Sample Size Matters
Scales; Frequencies of use; Model-based Database (eg. DATA MOCCA =Data Models for Call Center Analysis; Extansions to Healthcare, Internert,...)
The Fluid View: Introduction
Lord Kelvin said (roughly) the following: “We can not understand (do sciencewith, manage) that which we can not measure (quantify).” Galileo Galileiadds: “Measure what can be measured, and make measurable what can not bemeasured.” (Does this really apply when “measuring people”?) And LeonardCohen sings in “The Future”: Won’t be nothing = Nothing you can measureanymore.
– Measurements• Why bother? • Time statistics scarce
user
Highlight
user
Highlight
user
Highlight
user
Highlight
Service Engineeringhttp://ie.technion.ac.il/serveng200·
Call Center Measurements, Data Models and Data Analysis
Adapted from: Telephone Call Centers: Tutorial, Review, and Research Prospects
By Noah Gans (Wharton), Ger Koole (Vrije Universiteit) and Avishai Mandelbaum (Technion).Published in Manufacturing and Service Operations Management (M&SOM), 5 (2), 2003;
downloadable from http://ie.technion.ac.il/serveng/References/CCReview.pdf
Abstract: Telephone call centers are an integral part of many businesses, and their economicrole is significant and growing. They are also fascinating socio-technical systems in which thebehavior of customers and employees is closely intertwined with physical performance measures.In these environments traditional operational models are of great value – and at the same timefundamentally limited – in their ability to characterize system performance.
We review the state of research on telephone call centers. We begin with a tutorial on how callcenters function and proceed to survey academic research devoted to the management of their op-erations. We then outline important problems that have not been addressed and identify promisingdirections for future research.
1 Data Generation and Reporting
As it operates, a large call center generates vast amounts of data. Its IVR(s) and ACD are special-purpose computers that use data to mediate the flow of calls. (Acronyms are explained in theAppendix at the end.) Each time one of these switches takes an action, it records the call’sidentification number, the action taken, the elapsed time since the previous action, as well as otherpieces of information. As a call winds its way through a call center, a large number of these recordsmay be generated.
From these records, a detailed history of each call that enters the system can, in theory, bereconstructed: when it arrived; who was the caller; what actions the caller took in the IVR andhow long each action took; whether and how long the caller waited in queue; whether and for howlong a CSR served the call; who was the CSR. If the call center uses CTI, then additional datafrom the company’s information systems may be included in the record: what the call was about;the types of actions taken by a CSR; related account information.
In practice, call centers have not typically stored or analyzed records of individual calls, however.This may be due, in part, to the historically high cost of maintaining adequately large databases– a large call center generates many gigabytes of call-by-call data each month – but clearly thesequantities of data are no longer prohibitively expensive to store. It is also likely due to the factthat the software used to manage call centers – itself developed at a time when data storage wasexpensive – often uses only simple models which require limited, summary statistics. Finally, webelieve that it is due to lack of understanding of how and why more detailed analyses should becarried out.
Model Description and Introduction to User Interface
Dr Valery Trofimov
Professor Paul D. Feigin Professor Avishai Mandelbaum
Ms Eva Ishay Ms Ella Nadjharov
Created: August, 2004 Last Revised: July 29, 2006
7 A Vision: Central Repository for Call-Center Data and Exper-tise
A prerequisite for understanding the financial effects of operational decisions is the ability to analyzean integrated data set that includes both operational (ACD) and marketing / business (customerinformation systems) data. With this information, one can attempt to tease out the longer-term,financial effects of operational policies.
Our experience has been that both types of data are very difficult to access, however. Onereason for this is technical. Only recently have the manufacturers of telephone equipment givencustomers something of an “off the shelf” ability to capture, store, and retrieve detailed, call-by-call data. Similarly, the integration of these operational data with the business data capturedin customer information systems is only now becoming widely available. Another reason stemsfrom confidentiality concerns; companies are rightly wary of releasing customer information. Oncemanagers recognize the great untapped value of these data, we believe they will employ mechanismsfor preserving confidentiality in order to reap the benefit.
Ultimately, we envision a data-repository that is continuously fed by many call centers of varyingtypes. The collected data would be continuously and automatically analyzed, from both operationsand marketing perspectives. Then the data would be both archived and fed back to the originatingcall centers, who would use it (through visualization tools) to support ongoing operations, as wellas tactical and strategic goals.
Little imagination is required for appreciating the value of such a data-base. As a start, itsdeveloper could become a benchmark that sets industry standards, as far as customer-service qualityand call-center efficiency are concerned. As already mentioned, such a data-base would enable theidentification of success-drivers of call-center business transaction.
A Glossary of Call-Center Acronyms
Acronym Description DefinitionACD automatic call distributor p. ??ANI automatic number identification p. ??ASA average speed of answer p. ??CRM customer relationship management p. ??CSR customer service representative p. ??CTI computer-telephony integration p. ??DNIS dialed number identification service p. ??IVR interactive voice response unit (also called VRU) p. ??PABX private automatic branch exchange (also called PBX) p. ??PBX private automatic branch exchange (also called PABX) p. ??PSTN public switched telephone network p. ??QED Quality and Efficiency Driven (operational regime) p. ??TSF telephone service factor (also called the ‘service level’) p. ??VRU interactive voice response unit (also called IVR) p. ??WFM workforce management p. ??
7
user
Highlight
user
Highlight
user
Highlight
user
Highlight
user
Highlight
user
Highlight
user
Highlight
user
Highlight
user
Highlight
user
Highlight
user
Highlight
user
Highlight
“Production” Of Justice
Queue
Mile Stone
Activity
Appeal
Proceedings
Closure
Prepare AllocateOpen File
Avg. sojourn time ≈ in months / years
Processing time ≈ in mins / hours / days
Phase Transition
Phase
45 100
118
59
33
.
.
.
..
(6.2, 7.4) (13.5, 7.4)
(26.3, 4.5)
(12, 4.9)
(7.2, 4.6) 3
001
3
001
01
0
3
01
3
00
3
01
0
1
2
3
4
5
6
7
8
9
10
0 5 10 15 20 25 30
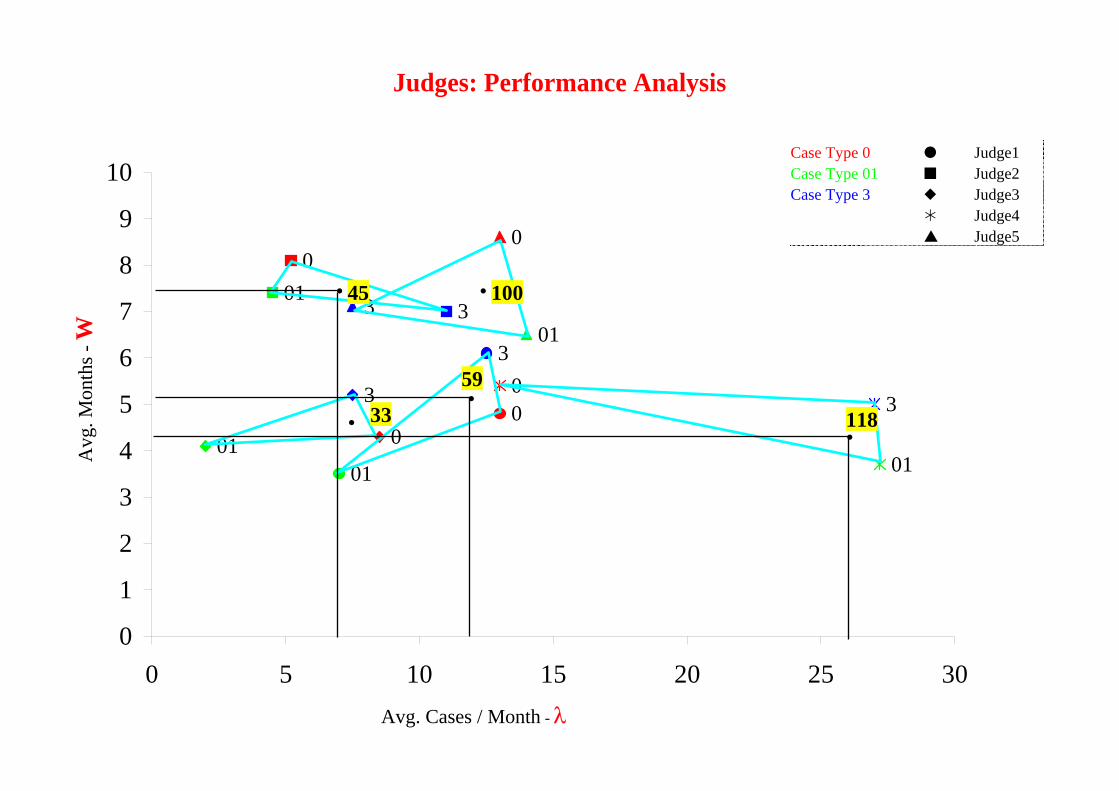
Judges: Performance Analysis
Case Type 0 Judge1 Case Type 01 Judge2 Case Type 3 Judge3 Judge4 Judge5
Judges: Performance Analysis Judges: Performance by Case-Type
Ave
rage
Num
ber o
f Mon
ths -
W
Average Number of Cases / Month - λ
Judges: Operational Performance – Base Case
45 100
118
59
33
.
.
.
..
(6.2, 7.4) (13.5, 7.4)
(26.3, 4.5)
(12, 4.9)
(7.2, 4.6) 3
001
3
001
01
0
3
01
3
00
3
01
0
1
2
3
4
5
6
7
8
9
10
0 5 10 15 20 25 30
Judges: Performance Analysis
Case Type 0 Judge1 Case Type 01 Judge2 Case Type 3 Judge3 Judge4 Judge5
Ave
rage
Num
ber o
f Mon
ths -
W
Average Number of Cases / Month - λ
Judges: Operational Performance – Base Case Judges: Performance Analysis Judges: Performance by Case-Type
(6.2, 7.4) (13.5, 7.4)
(26.3, 4.5)
(12, 4.9)
(7.2, 4.6)
.
.
.
..
3
001
3
001
01
0
3
01
3
00
3
01
0
1
2
3
4
5
6
7
8
9
10
0 5 10 15 20 25 30
Judges: Performance Analysis
Case Type 0 Judge1 Case Type 01 Judge2 Case Type 3 Judge3 Judge4 Judge5
Avg
. Mon
ths -
W
Avg. Cases / Month - λ
3
001
3
001
01
0
3
01
3
00
3
01
0
1
2
3
4
5
6
7
8
9
10
0 5 10 15 20 25 30
(6.2, 7.4) (13.5, 7.4)
(26.3, 4.5)
(12, 4.9)
(7.2, 4.6)
.
.
.
..
Judges: Performance Analysis
Case Type 0 Judge1 Case Type 01 Judge2 Case Type 3 Judge3 Judge4 Judge5
Avg
. Mon
ths -
W
Avg. Cases / Month - λ
(6.2, 7.4) (13.5, 7.4)
(26.3, 4.5)
(12, 4.9)
(7.2, 4.6) 3
001
3
001
01
0
3
01
3
00
3
01
0
1
2
3
4
5
6
7
8
9
10
0 5 10 15 20 25 30
.
.
.
..
45 100
118
59
33
Judges: Performance Analysis
Case Type 0 Judge1 Case Type 01 Judge2 Case Type 3 Judge3 Judge4 Judge5
RFID Journal - Where is RFID's ROI in Health Care?
RFID JOURNAL : THE WORLD'S RFID AUTHORITY
THE WORLD'S RFID AUTHORITY
Where is RFID's ROI in Health Care?
The most strategic benefits for radio frequency identification in health care aren't necessarily found in applications with the most apparent return on investment.
Feb. 13, 2006—The U.S. health-care industry represents a large percentage of the overall U.S. economy and an area well known for being a late adopter of information technology. In fact, according to the U.S. Department of Health and Human Services (HHS), at the end of the 1990s, the health-care industry was investing only about $1,000 per worker on IT, compared with about $8,000 per worker for most other industries.
Yet, despite its late-adopter nature, the industry can benefit tremendously from IT innovation in order to improve patient safety and streamline business processes. The HHS estimates IT can reduce health-care costs up to 20 percent per year by saving time and reducing duplication and waste. IT innovation can come either in the form of established technologies deployed in new ways, or as emerging technologies applied to support new or existing processes.
The innovation that has traditionally occurred purely on the clinical side of health care is now starting to branch out into health-care IT (see The Importance of Industry Parallels). Within the broad context of IT innovation, RFID is just one area that shows promise for the future. According to BearingPoint's recent "RFID in Healthcare" survey of more than 300 health-care professionals, carried out in collaboration with the National Alliance for Health Information Technology (ITAA), we have found a wealth of application opportunity areas for RFID in organizations providing health care. Application areas include access control and security, asset tracking, laboratory order management, medical-equipment tracking,
patient flow, patient safety (identification and medication administration), pharmaceutical order management, real-time location systems, supply chain, smart shelving, wireless commerce and worker identification. We have found that the top three applications, in terms of business benefit for today's provider organizations, are commonly mobile-asset tracking, patient-flow management and medication administration. Each of these application areas has its own unique business case, and we'll explore these here.
The business case for tracking mobile assets is related to the ability to find assets such as infusion pumps
file:///C|/Documents%20and%20Settings/Shimrit/Deskto...20Where%20is%20RFID's%20ROI%20in%20Health%20Care.htm (1 of 3)25/03/2007 23:59:41
RFID Journal - Where is RFID's ROI in Health Care?
quickly, and to minimize time searching for these assets within an emergency department or other hospital unit. Real-time location systems are able to locate these assets within a few feet, or within a particular room. The time savings may be realized by both clinical engineering staff and nursing staff, and can often amount to a couple of days per week per person. Additionally, these faster search times can help improve overall asset utilization and, in certain circumstances, enable more streamlined inventories of equipment and lower rental costs. Tracking technologies can help to lower shrinkage when items get accidentally misplaced for extended periods of time, while also serving as a deterrent to deliberate theft. The return on investment can be quantified by looking at all of these factors and comparing them with the initial and ongoing costs involved in implementation. In this example, the business case is fairly straightforward to determine, and investment decisions typically ride upon the infrastructure costs of the network deployment.
The business case for better patient-flow management is related to the ability to streamline patient flow, and thus patient throughput, throughout the continuum of care. If an emergency department can process more patients per year, it can help delay the need to expand the unit or build additional facilities. Improved patient flow can also have a positive effect on patient satisfaction and provider business processes and recordkeeping. The ability to capture procedure start and stop times and patient wait times can help automate previously manual measurement techniques. It can also be used for Six Sigma purposes and continuous improvement. An electronic record of patient flow greatly improves the time taken to perform chart audits and can feed into the patient electronic medical record. Patient status can be electronically communicated to family members in waiting rooms via displays, helping reduce call volumes and associated costs. Better flow management may also help to increase revenue by more accurately capturing services rendered, enabling full billing for those services and supplies.
Finally, diversions where patients are redirected to other hospitals can be reduced since optimizing patient flow provides more capacity in the system, allowing patients to be treated on the spot. In this example, the business case is more complex and the return on investment can be harder to estimate. Patient-flow management is a complex topic requiring strong knowledge of current health-care processes and a holistic approach to implementation that factors in change management and continuous improvement, along with the technical aspects of implementation.
The business case for RFID-enabled medication administration relates to the well-known "five rights" of medication administration: right patient, right medication, right dose, right time and right route. Like bar codes, RFID can help ensure these five rights are upheld and, hence, contribute toward reduced medical error rates. While only 7 percent of erroneously administered doses, on average, lead to "adverse drug events"—causes harm to the patient—these kinds of preventable events can lead to increased patient stays averaging over two extra days and costing around $4,600 per event. Litigation from ADEs can be much more significant in terms of cost, and negative publicity is equally damaging. In this example, the business case is again harder to determine in terms of hard ROI numbers, but it is obviously an area of the most importance, since it directly relates to patient safety.
To execute on these three business cases, it is important to take a holistic approach and consider which initiatives are quick wins versus longer-term strategies. Tracking assets and improving patient flow can be implemented in parallel in order to leverage the same infrastructure—typically indoor positioning
file:///C|/Documents%20and%20Settings/Shimrit/Deskto...20Where%20is%20RFID's%20ROI%20in%20Health%20Care.htm (2 of 3)25/03/2007 23:59:41
Administrator
Highlight
Administrator
Highlight
RFID Journal - Where is RFID's ROI in Health Care?
systems utilizing active RFID.
To measure success before a widespread rollout, providers can also target subsets of patients and assets. We have found that many providers are pursuing a phased approach from the emergency department to the operating room and beyond. This strategy helps focus deployments first where they have maximum benefit, and to expand later into other areas of value.
The business case for RFID-enabled medication administration, on the other hand, is more of a longer-term strategy because it requires more infrastructure to be in place, such as RFID-tagging at the item level, RFID-enabled patient wristbands for positive patient identification, and wireless devices and networks available to nursing staff throughout a facility. It also requires integration with existing clinical systems and software that supports RFID-enabled point of care.
These three application areas have strong business cases with the potential to improve patient safety and health-care service delivery significantly. While the return on investment is often readily apparent for quick wins such as mobile-asset tracking, the most strategic benefits appear to be found when RFID is applied to clinical transformation in terms of patient-flow management and medication administration. The return on investment is harder to quantify, yet the business benefits to patients and providers are immense.
Nicholas D. Evans is the global lead of emerging technology at BearingPoint. He is the author of Business Innovation and Disruptive Technology (Financial Times, Prentice Hall) and chairs the RFID Standards Task Group for the Information Technology Association of America (ITAA). He can be reached at mailto:[email protected]?subject=.
| Back to normal page view | Send this article to a friend |
.נ"תעו, IBM Research in Haifa, ם"רמב: OCRלקראת פרויקט במסגרת
וחים הםעיקר השימושים המדו. בתחום הרפואה צוברת תאוצהRFIDהשימוש ב טכנולוגיית ה
זיהוי ומעקב אחר חולים •
, אנשי צוותזיהוי ומעקב •
)מכונות הנשמה למשל (רגישמעקב אחר ציוד רפואי •
בדיקות דםזיהוי ומעקב •
)מנות דם פלסמה או מנות טסיות( שנשלחים מבנק הדם תוצרי דםזיהוי ומעקב •
.יקרות/ חשובות תרופות זיהוי ומעקב אחר •
הן ברמת , על מנת לייעל תהליכי טיפולRFIDיתן להפיק ממערכות ה הכוונה היא לנצל את המידע שנהן ברמת המעקב אחר הטיפול והן ברמת השליטה על זרימת , )כוח אדם וציוד(הקצעת המשאבים
).עד לרזולוציה של זרימת החולה הבודד(החולים
/ קסיקולוגי המוני אירוע טו= אטה / אירוע רב נפגעים =ן "אר(למתאריו השונים , אירוע רב נפגעיםמאופיין בהגעה של פצועים רבים , )אירוע ביולוגיה/ אירוע קרינה / חומרי לחימה כימיים = ך "חל
פתיחת אתרי , )על פי תורה מוסדרת מראש(היערכות מיוחדת של בית החולים , בפרק זמן קצר .הקצאת כוח אדם וציוד ייעודי ועוד, חירום
. ציוד ועוד, כוח אדם–לבין הדרישה , ין הצרכים הרגעייםכ במתארים השונים קיים פער ב"בדחשוב לקבל תמונה מהירה מדוייקת וזמינה של המשאבים ומאידך לרכז את בשלבים הראשונים
.הדרישות
:איסוף הנתונים יכלו להתבצע במספר דרכים
.RFID, איסוף מבר קוד או מתויות זהוי אחרות, הקלדה למחשב, רישום ידני
רישום ידני איטי ומצריך . הנובעות מרישום שגוי, דני קיימות טעויות אינהרנטיות לשיטהברישום הילסיכום שיטה זו איטית ובעלת . העברה למחשב על מנת שהמנהל יוכל לקבל תמונת מצב ברורה
.פוטנציאל גבוה לטעות
. סיכוי להקלדת טעות בעלתו גם היא איטית, הקלדה למחשב
הנתונים . יתרונות ברורים, שאינה תלויה בהקלדה ומתבצעת מיידיתRFIDלשאיבת נתונים במערכת מנותחים מיידית ומוצגים במערכות השליטה כמעת , ללא צורך בהקלדה, נשאבים בצורה אקטיבית
on‐line.
Mandelbaum
Highlight
Mandelbaum
Highlight
Mandelbaum
Highlight
Mandelbaum
Highlight
Mandelbaum
Highlight
Mandelbaum
Highlight
Mandelbaum
Highlight
Mandelbaum
Highlight
Mandelbaum
Highlight
Mandelbaum
Highlight
Mandelbaum
Highlight
.משתפרת יכולת השליטה של מנהלי האירוע, זמין ומדוייק יותר, ככל שהמידע אמין
בכל האירועים . ות רבה לצבירת המידע החל מהדקות הראשונותיש חשיב, מתערים שהוזכרובכלל כ .פצועים לאזורים שונים ולעיתים מרוחקים של בית החולים/ שמפנה חוליםtriageהללו מופעל
באנגלית נשמע יותר " ( הדברים הנכונים7עקרון "הצלחה במתארים אלו תתקבל אם נוכל לשמור על ):טוב
“Seven rights”: give the right medication to the right patient with the right dosage through the right route at the right time, and ensure that victims receive the right care at a mass casualty incident.
נות השימוש לבדוק היתכ,התרגיל הינו פלטפורמה מצויינת. ח"ך בביה"בסוף מאי מתקיים תרגיל חל .במתאר מרובה נפגעים, RFIDבטכנולוגיית ה
ואנשי הלוגיסטיקה ) אחים ורופאים(כמות המטפלים , באופן פרקטי נרצה ידע על כמות החולים .בכל אחד מהאתרים שנפרסים בתרגיל, )מנהלנים, משנעים, מאבטחים(
.נבדוק את האפשרות של הצגת המידע בצורה שתעזור לשליטה
).רישום ממוחשב( את המידע שמופק בטכנולוגיה זו למידע שמופק בעזרים הרגילים נוכל להשוות
MCE with RFID Support: Rambam Hospital, May 2010
Drill: Chemical Mass Casualty Event (MCE), Rambam Hospital