Measurements of absorption losses in T10 2 films by acollinear photothermal deflection technique
Mireille Commandr6 and Emile Pelletier
We review the principle of photothermal deflection for measuring absorption losses in TiO2films. A collineararrangement gives the best sensitivity for the detection of losses in a low absorbing film deposited on atransparent substrate. The nineteen TiO2 films produced by six different processes (electron beam evapora-tion, ion assisted deposition, ion beam sputtering, ion plating, ... ), discussed at the 1986 Optical Society ofAmerica annual meeting, are measured by this technique. The extinction coefficients of the different filmsdo not show obvious correlation with the deposition method. An important fact is that we have detected avariation in absorption as a function of time on some layers. This absorption shift is connected with theillumination conditions of the sample under study (wavelength: 600 nm; incident power: 400 W/cm2).Experimental results over time are given. The evolution of the photothermal signal is different from onesample to another. This phenomenon is partially reversible and depends on moisture degree of atmosphere.
1. IntroductionTo develop high quality optical coatings, extremely
accurate characterization methods have to be per-formed, such as very low loss measurements whichdetect losses less than 103 of the incident flux. Con-cerning scattering losses, our methods and experimen-tal setup have been described in detail elsewhere.1 2
We are interested here in absorption loss determina-tion. The photothermal deflection technique3 4 isquite adequate for obtaining the required sensitivity:absorption losses of a transparent single layer can easi-ly be measured. Furthermore, we can deduce by cal-culation the value of the extinction coefficient k of thematerial 5 knowing the values of refractive index (realpart) and thickness (determined elsewhere6).
In this paper, we first recall the principle of collinearphotothermal deflection spectroscopy (PDS) and thedescription of our apparatus. We then present a studyof the absorption losses, determined by photothermaldeflection, of nineteen samples prepared for the 1986Optical Society of America (OSA) annual meeting.The samples consist of thin films of titanium oxide of
The authors are with Ecole Nationale Superieure de Physique deMarseille, Laboratoire d'Optique des Surfaces et des CouchesMinces, UA 1120 CNRS, Domaine Universitaire de St. Jerome, F-13397 Marseille CEDEX 13, France.
approximately the same thickness and on similar sub-strates; however, six different deposition techniqueswere employed [electron beam (EB); ion assisted depo-sition (IAD); ion beam sputter deposition (IBSD); acti-vated reactive evaporation (ARE); ion plating (IP);and rf diode sputtering (RFS)]. The samples camefrom twelve different laboratories (including both in-dustrial and research). The aim of this operation wasto study the optical properties of titania thin films.Several studies have been performed on these sam-ples. 7 8 We try to correlate the optical constants (mea-sured refractive index and extinction coefficient) withdeposition conditions. We present the time-depen-dent photoinduced instability in the absorption thatwe have observed in some samples and discuss ourresults and preliminary conclusions on this problem.
11. Photothermal Deflection Spectroscopy
A. PrincipleThe sample under study is irradiated with a laser
beam (pump beam), modulated at the frequency v.The optical absorption inside the coating gives rise to atemperature gradient and so to a refractive index gra-dient, both modulated at the same frequency v. Pho-tothermal methods consist of detecting this index gra-dient owing to a mirage effect: a probe laser beam,propagating through the index gradient domain, isdeflected. According to theory,4 the deflection angleis proportional to the absorbed optical power. Onehas two ways to perform photothermal measurements:transverse and collinear PDS. In the first case, trans-verse PDS, the probe beam is parallel to the sample
surface and is deflected by the index gradient in theambient gas. We choose collinear PDS for which theradial gradient of index is probed in the three media:gas, coating, and substrate. In comparative testing ofthe two techniques, we found that collinear PDS is atleast twenty times more sensitive than transversePDS. Furthermore, the calibration of the transversearrangement is somewhat more critical because itneeds precise control of the probe beam to samplesurface distance.
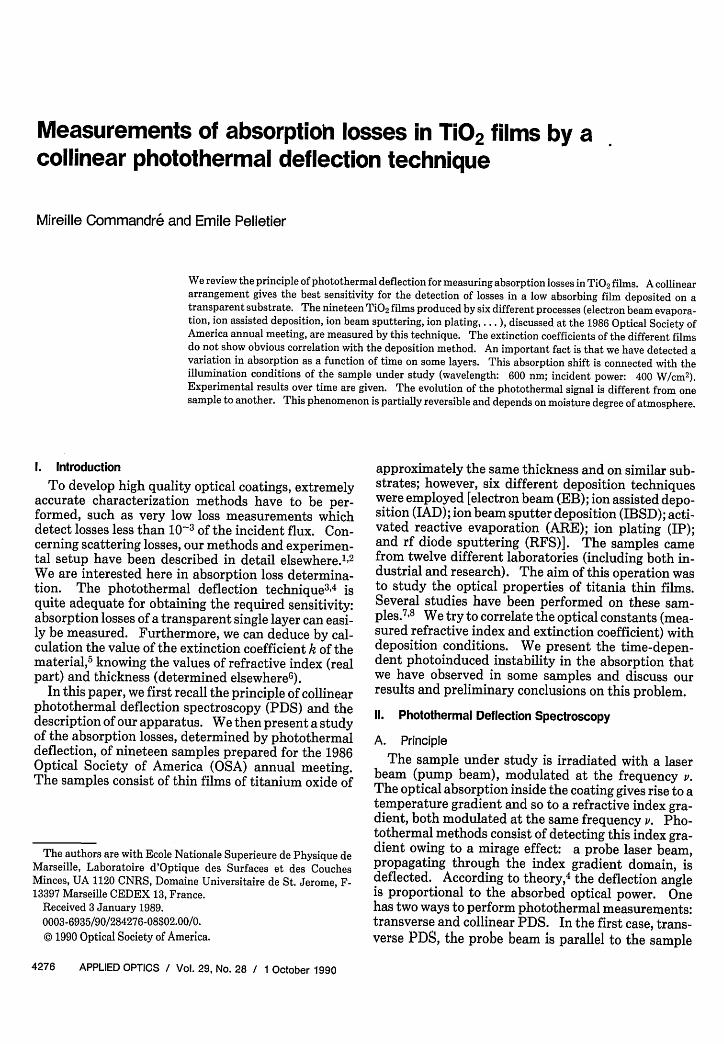
B. Collinear Photothermal Deflection TechniqueThe experimental setup is represented in Fig. 1.
The pump laser is a cw dye laser and, thus, allowswavelength scanning (in the 570-640-nm spectralrange for Rh6G dye). The pupnp and the probe beamare assumed to be Gaussian and are focused on thefront surface of the sample: beam waists are 130 ,gmfor the pump and 50 ,gm for the probe beam (diameterat lI/e2 ). The probe beam deflection is measured witha quadrant position sensor, the output signal of whichis directed to the differential input of a lock-in amplifi-er.
We have experimentally verified that the outputsignal of the lock-in amplifier SD is linearly related tothe pump beam power Ppump, according to theory.
Therefore, we define a photothermal signal PS, inarbitrary units, that is, proportional to the ratio SD/(Ppump X Pprobe), where Pprobe is the probe beam power.5
This photothermal signal PS is linearly related to theprobe beam deflection angle, and so the theory allowsus to assume that the PS is proportional to the absorp-tance A of the coating: A = ET X PS.
1. Photothermal Signal CalibrationThe proportionality coefficient ET which relates A
with the PS depends on many factors: optical align-ment, beam geometries, modulation frequency, andoptical and thermal properties of the substrate and ofthe layer. We must be careful in the determination ofET. In particular, we must emphasize that it is neces-sary to determine ET for each kind of substrate used.
We have shown that for enough thin layers, ET does
not depend on the optical and thermal properties ofthe layer. This allows us to compare different samplesand to perform the determination of ET on highlyabsorbing samples (A _ 10-2), the absorptance ofwhich is determined by classical spectrophotometricmeasurements 5 (scattering can be neglected A = 1 - R-T).
However, the spot diameter on the sample surface inthe case of photothermal measurement is small (pumpbeam diameter at li/e2
= 130 Am) compared with thewidth of the illuminated area in the case of spectropho-tometric measurements (width of -5 mm). There-fore, the determination of ET for a given sample de-pends strongly on the uniformity of the sample, that is,on relative variations of absorptance at differentpoints of the sample surface. Thus, for each calibra-tion sample, we must compare the spectrophotometricmeasurement with a mean value of photothermal sig-nals recorded at different points of the sample. Therepeatability of ET measured with six samples from A_ 6 X 10⁻³ to A 10-1 is better than 20%.
2. Limit of DetectivityThe lowest absorptance that we can detect is related
to the background noise in the case of a nonabsorbingsample. Thus, the noise equivalent absorptanceequals 1 X 10⁻⁶ for an incident pump beam power of 50mW. The origin of this noise is the beam pointinginstability of the probe laser.
We can measure the absorptance of a thin film as lowas the limit of detectivity only if the film is depositedon a substrate whose absorption is negligible. Indeed,in the collinear PDS, the bulk absorption in the sub-strate contributes to the photothermal deflection ofthe probe beam. In practice, for measuring very lowabsorption losses, we must use perfectly polished fusedsilica substrates.
3. Determination of Extinction Coefficient ofSingle Layer Films
It is necessary to take into account the interferenceeffect in the layer. Borgogno et al. have shown9 that inthis case the extinction coefficient k1 (X) of the layer
can be calculated from the following limited expan-sion:
A nli= k, [fo(Q2 + 1) - (Q2 - 1) sin 0 lJT 2~ nn2-s2
+ 2 _ 12 2 + c 1soo ' I + k2e(kj),2 ~ cos 0-
where
T 2- S); =47re 22;Q2 = r /(ni-2;t X i;,
r2 = n2 cosO2; s = no sinO0
no = air refractive index; n2 = substrate refractiveindex; nj - jk = complex index of the layer; 00 =incident angle in air; 02 = incident angle in the sub-strate; and T is the transmittance in the appropriateillumination conditions (30°, S-polarization).
If we know the layer refractive index, its thickness,and transmittance, it is possible, with the absorptancemeasured with the PDS method, to calculate the ex-tinction coefficient k, of the layer.
The collinear photothermal deflection techniquegives an absolute measurement of absorptance for acoating deposited on a transparent substrate. For asingle layer, we can deduce5 the value of the extinctioncoefficient k of the deposited material (knowing therefractive index and thickness values). Photothermalmeasurements presented in this paper have been madein the following conditions: X = 600 nm; Pdye _ 50mW, diameter of the pump beam at l/e2 = 130 um;oblique incidence is 30°, S-polarization. Our appara-tus can detect absorption losses as low as 1 X 10⁻⁶ ofthe incident flux (i.e., a k value of a few 10-7) for asingle layer of high index material whose optical thick-ness is approximately the wavelength.
Ill. Extinction Coefficients of Titanium Dioxide FilmsPrepared Using Different Techniques
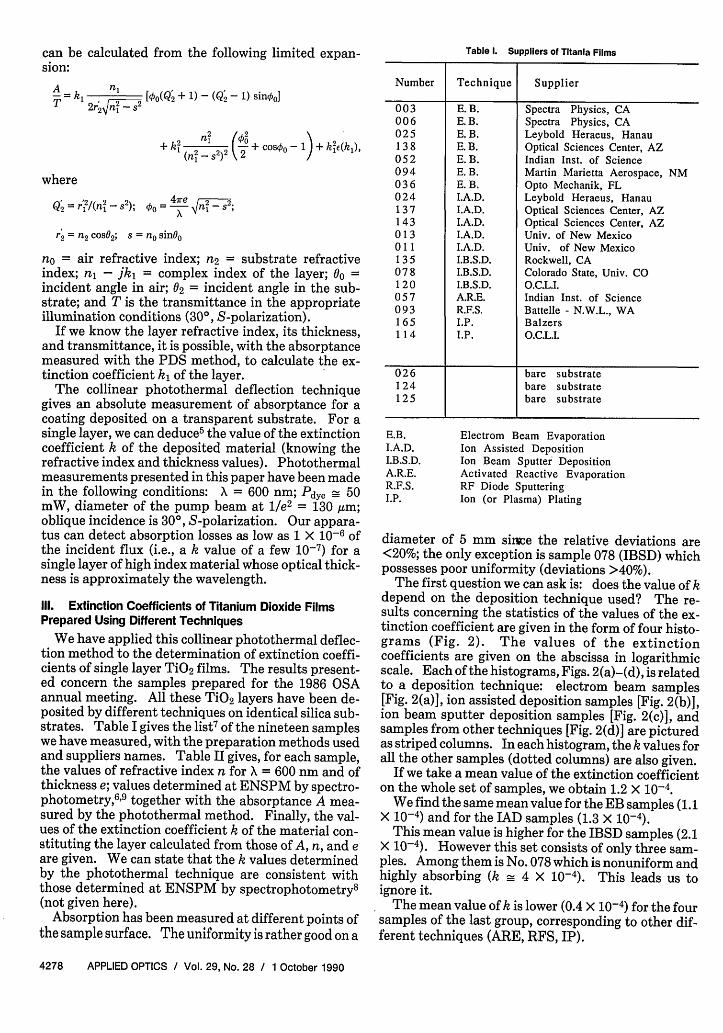
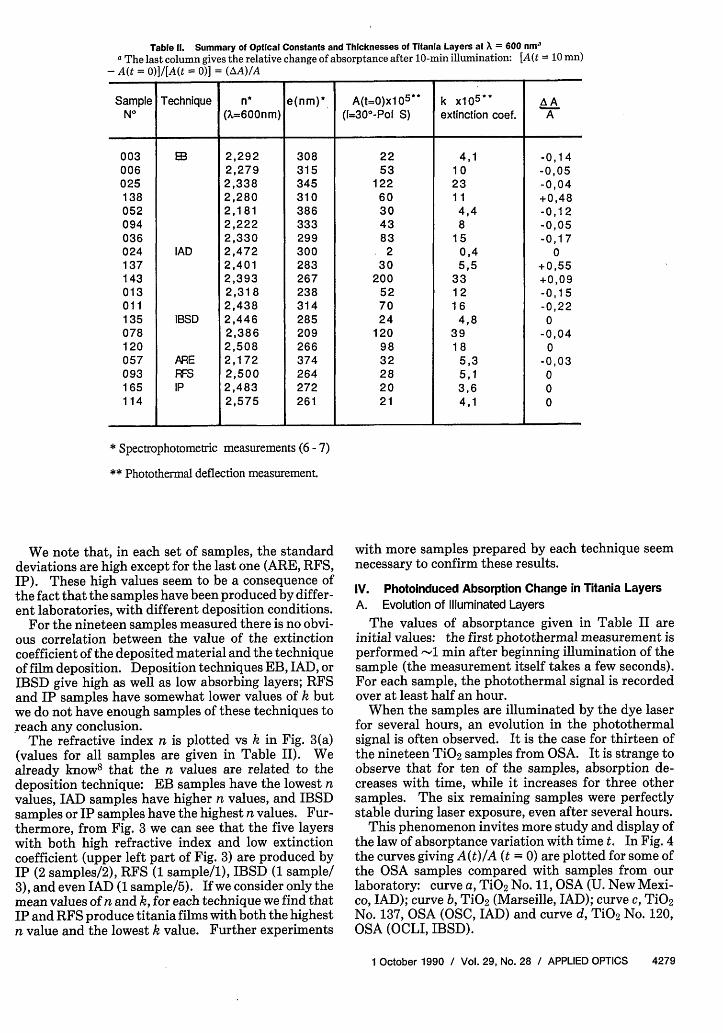
We have applied this collinear photothermal deflec-tion method to the determination of extinction coeffi-cients of single layer TiO2 films. The results present-ed concern the samples prepared for the 1986 OSAannual meeting. All these TiO2 layers have been de-posited by different techniques on identical silica sub-strates. Table I gives the list7 of the nineteen sampleswe have measured, with the preparation methods usedand suppliers names. Table II gives, for each sample,the values of refractive index n for X = 600 nm and ofthickness e; values determined at ENSPM by spectro-photometry,6 9 together with the absorptance A mea-sured by the photothermal method. Finally, the val-ues of the extinction coefficient k of the material con-stituting the layer calculated from those of A, n, and eare given. We can state that the k values determinedby the photothermal technique are consistent withthose determined at ENSPM by spectrophotometry8
(not given here).Absorption has been measured at different points of
the sample surface. The uniformity is rather good on a
Table 1. Suppliers of Titanla Films
Number Technique Supplier
003 E.B. Spectra Physics, CA006 E. B. Spectra Physics, CA025 E. B. Leybold Heraeus, Hanau1 38 E. B. Optical Sciences Center, AZ052 E. B. Indian Inst. of Science094 E. B. Martin Marietta Aerospace, NM036 E. B. Opto Mechanik, FL024 I.A.D. Leybold Heraeus, Hanau137 I.A.D. Optical Sciences Center, AZ143 I.A.D. Optical Sciences Center, AZ0 1 3 I.A.D. Univ. of New MexicoO 11 I.A.D. Univ. of New Mexico135 I.B.S.D. Rockwell, CA078 I.B.S.D. Colorado State, Univ. CO120 I.B.S.D. O.C.L.I.057 A.R.E. Indian Inst. of Science093 R.F.S. Battelle - N.W.L., WA1 65 I.P. Balzers114 I.P. O.C.L.I.
026 bare substrate1 24 bare substrate1 25 bare substrate
diameter of 5 mm simte the relative deviations are<20%; the only exception is sample 078 (IBSD) whichpossesses poor uniformity (deviations >40%).
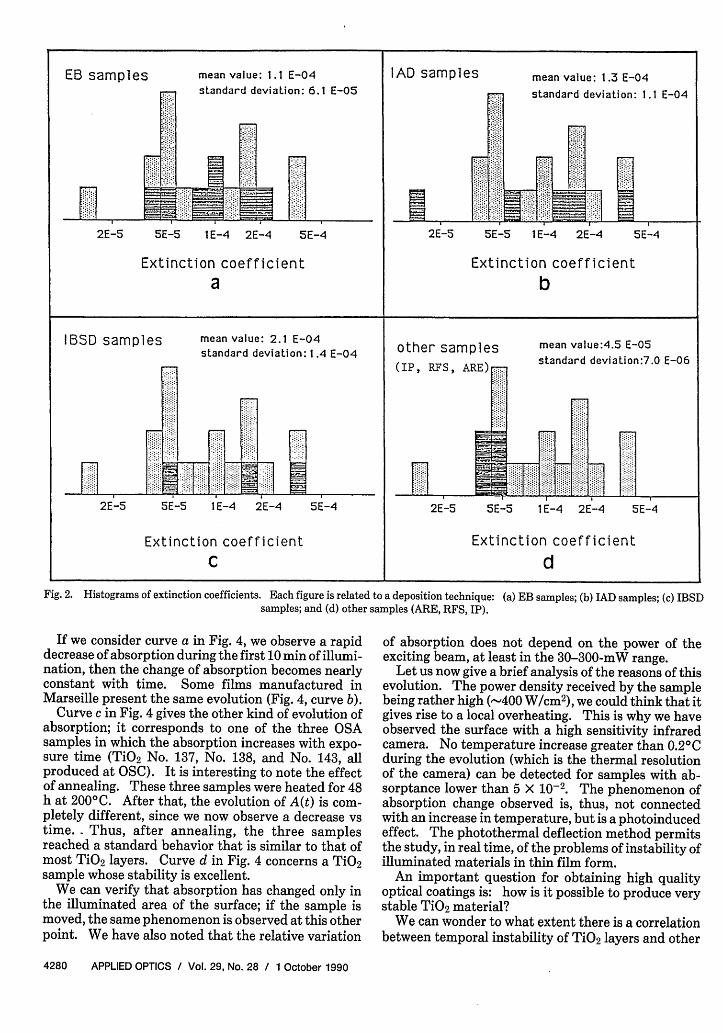
The first question we can ask is: does the value of kdepend on the deposition technique used? The re-sults concerning the statistics of the values of the ex-tinction coefficient are given in the form of four histo-grams (Fig. 2). The values of the extinctioncoefficients are given on the abscissa in logarithmicscale. Each of the histograms, Figs. 2(a)-(d), is relatedto a deposition technique: electrom beam samples[Fig. 2(a)], ion assisted deposition samples [Fig. 2(b)],ion beam sputter deposition samples [Fig. 2(c)], andsamples from other techniques [Fig. 2(d)] are picturedas striped columns. In each histogram, the k values forall the other samples (dotted columns) are also given.
If we take a mean value of the extinction coefficienton the whole set of samples, we obtain 1.2 X 10⁻⁴.
We find the same mean value for the EB samples (1.1X 10⁻⁴) and for the IAD samples (1.3 X 10⁻⁴).
This mean value is higher for the IBSD samples (2.1X 10⁻⁴). However this set consists of only three sam-ples. Among them is No. 078 which is nonuniform andhighly absorbing (k _ 4 X 10⁻⁴). This leads us toignore it.
The mean value of k is lower (0.4 X 10⁻⁴) for the foursamples of the last group, corresponding to other dif-ferent techniques (ARE, RFS, IP).
Table 1. Summary of Optical Constants and Thicknesses of Titanla Layers at X = 600 nmaa The last column gives the relative change of absorptance after 10-min illumination: [A(t =10 mn)
-A(t = 0)]/[A(t = 0)] = (AA)/A
Sample Technique n* e(nm)* A(t=O)xl05** k x10 5 AAN0 (X=600nm) (i=300 -Pol S) extinction coef. A
We note that, in each set of samples, the standarddeviations are high except for the last one (ARE, RFS,IP). These high values seem to be a consequence ofthe fact that the samples have been produced by differ-ent laboratories, with different deposition conditions.
For the nineteen samples measured there is no obvi-ous correlation between the value of the extinctioncoefficient of the deposited material and the techniqueof film deposition. Deposition techniques EB, IAD, orIBSD give high as well as low absorbing layers; RFSand IP samples have somewhat lower values of k butwe do not have enough samples of these techniques toreach any conclusion.
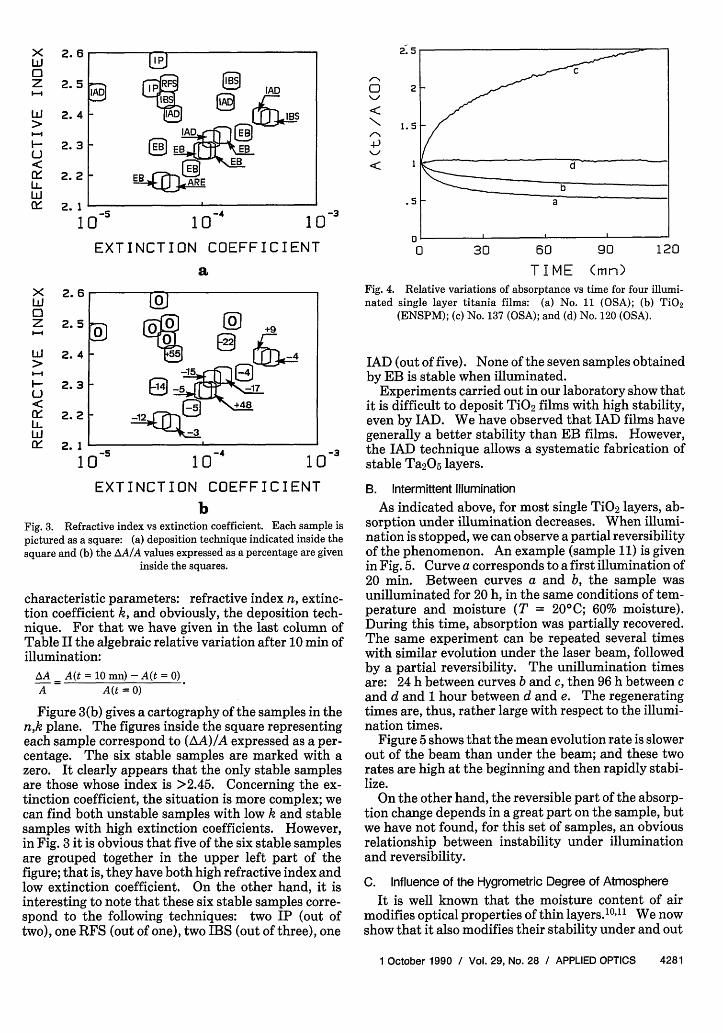
The refractive index n is plotted vs k in Fig. 3(a)(values for all samples are given in Table II). Wealready know8 that the n values are related to thedeposition technique: EB samples have the lowest nvalues, IAD samples have higher n values, and IBSDsamples or IP samples have the highest n values. Fur-thermore, from Fig. 3 we can see that the five layerswith both high refractive index and low extinctioncoefficient (upper left part of Fig. 3) are produced byIP (2 samples/2), RFS (1 sample/1), IBSD (1 sample/3), and even IAD (1 sample/5). If we consider only themean values of n and k, for each technique we find thatIP and RFS produce titania films with both the highestn value and the lowest k value. Further experiments
with more samples prepared by each technique seemnecessary to confirm these results.
IV. Photoinduced Absorption Change in Titania LayersA. Evolution of Illuminated Layers
The values of absorptance given in Table II areinitial values: the first photothermal measurement isperformed -1 min after beginning illumination of thesample (the measurement itself takes a few seconds).For each sample, the photothermal signal is recordedover at least half an hour.
When the samples are illuminated by the dye laserfor several hours, an evolution in the photothermalsignal is often observed. It is the case for thirteen ofthe nineteen TiO2 samples from OSA. It is strange toobserve that for ten of the samples, absorption de-creases with time, while it increases for three othersamples. The six remaining samples were perfectlystable during laser exposure, even after several hours.
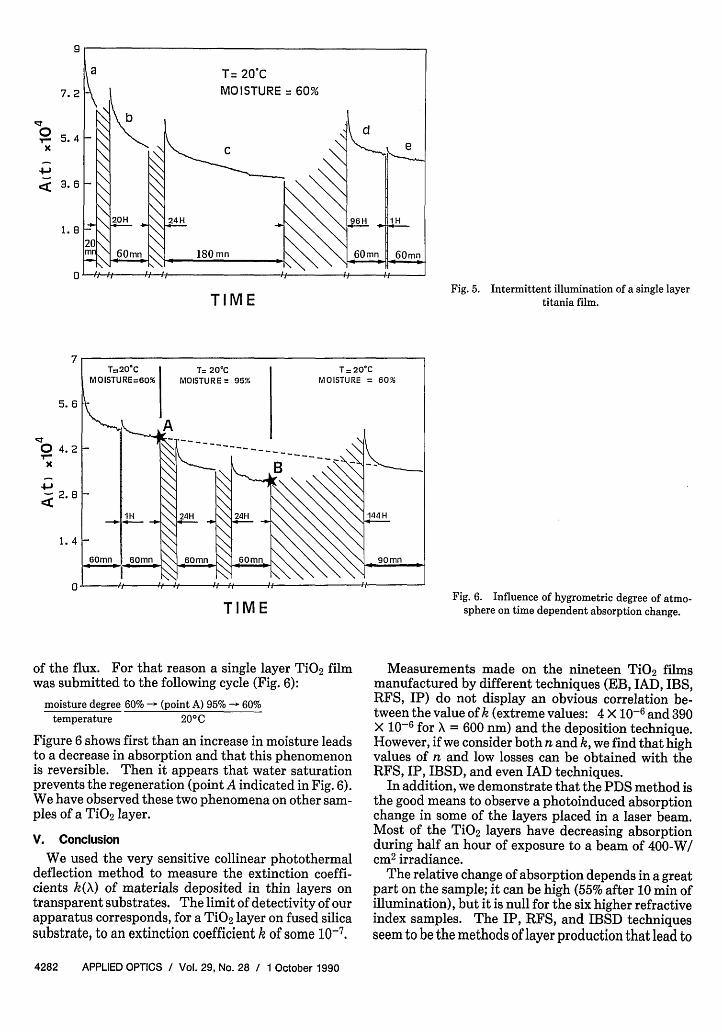
This phenomenon invites more study and display ofthe law of absorptance variation with time t. In Fig. 4the curves giving A(t)/A (t = 0) are plotted for some ofthe OSA samples compared with samples from ourlaboratory: curve a, TiO2 No. 11, OSA (U. New Mexi-co, IAD); curve b, TiO2 (Marseille, IAD); curve c, TiO2No. 137, OSA (OSC, IAD) and curve d, TiO2 No. 120,OSA (OCLI, IBSD).
Fig. 2. Histograms of extinction coefficients. Each figure is related to a deposition technique: (a) EB samples; (b) IAD samples; (c) IBSDsamples; and (d) other samples (ARE, RFS, IP).
If we consider curve a in Fig. 4, we observe a rapiddecrease of absorption during the first 10 min of illumi-nation, then the change of absorption becomes nearlyconstant with time. Some films manufactured inMarseille present the same evolution (Fig. 4, curve b).
Curve c in Fig. 4 gives the other kind of evolution ofabsorption; it corresponds to one of the three OSAsamples in which the absorption increases with expo-sure time (TiO2 No. 137, No. 138, and No. 143, allproduced at OSC). It is interesting to note the effectof annealing. These three samples were heated for 48h at 2000C. After that, the evolution of A(t) is com-pletely different, since we now observe a decrease vstime. - Thus, after annealing, the three samplesreached a standard behavior that is similar to that ofmost TiO2 layers. Curve d in Fig. 4 concerns a TiO2sample whose stability is excellent.
We can verify that absorption has changed only inthe illuminated area of the surface; if the sample ismoved, the same phenomenon is observed at this otherpoint. We have also noted that the relative variation
of absorption does not depend on the power of theexciting beam, at least in the 30-300-mW range.
Let us now give a brief analysis of the reasons of thisevolution. The power density received by the samplebeing rather high (400 W/cm2), we could think that itgives rise to a local overheating. This is why we haveobserved the surface with a high sensitivity infraredcamera. No temperature increase greater than 0.21Cduring the evolution (which is the thermal resolutionof the camera) can be detected for samples with ab-sorptance lower than 5 X 10⁻². The phenomenon ofabsorption change observed is, thus, not connectedwith an increase in temperature, but is a photoinducedeffect. The photothermal deflection method permitsthe study, in real time, of the problems of instability ofilluminated materials in thin film form.
An important question for obtaining high qualityoptical coatings is: how is it possible to produce verystable TiO2 material?
We can wonder to what extent there is a correlationbetween temporal instability of TiO2 layers and other
T I ME (mn)Fig. 4. Relative variations of absorptance vs time for four illumi-nated single layer titania films: (a) No. 11 (OSA); (b) TiO2
(ENSPM); (c) No. 137 (OSA); and (d) No. 120 (OSA).
IAD (out of five). None of the seven samples obtainedby EB is stable when illuminated.
Experiments carried out in our laboratory show thatit is difficult to deposit TiO2 films with high stability,even by IAD. We have observed that IAD films havegenerally a better stability than EB films. However,
_3 the IAD technique allows a systematic fabrication of0 stable Ta2O5 layers.
EXTINCTION COEFFICIENTb
Fig. 3. Refractive index vs extinction coefficient. Each sample ispictured as a square: (a) deposition technique indicated inside thesquare and (b) the AA/A values expressed as a percentage are given
inside the squares.
characteristic parameters: refractive index n, extinc-tion coefficient k, and obviously, the deposition tech-nique. For that we have given in the last column ofTable II the algebraic relative variation after 10 min ofillumination:
AA A(t = 10 mn)-A(t = 0)A A(t = 0)
Figure 3(b) gives a cartography of the samples in then,k plane. The figures inside the square representingeach sample correspond to (A)/A expressed as a per-centage. The six stable samples are marked with azero. It clearly appears that the only stable samplesare those whose index is >2.45. Concerning the ex-tinction coefficient, the situation is more complex; wecan find both unstable samples with low k and stablesamples with high extinction coefficients. However,in Fig. 3 it is obvious that five of the six stable samplesare grouped together in the upper left part of thefigure; that is, they have both high refractive index andlow extinction coefficient. On the other hand, it isinteresting to note that these six stable samples corre-spond to the following techniques: two IP (out oftwo), one RFS (out of one), two IBS (out of three), one
B. Intermittent Illumination
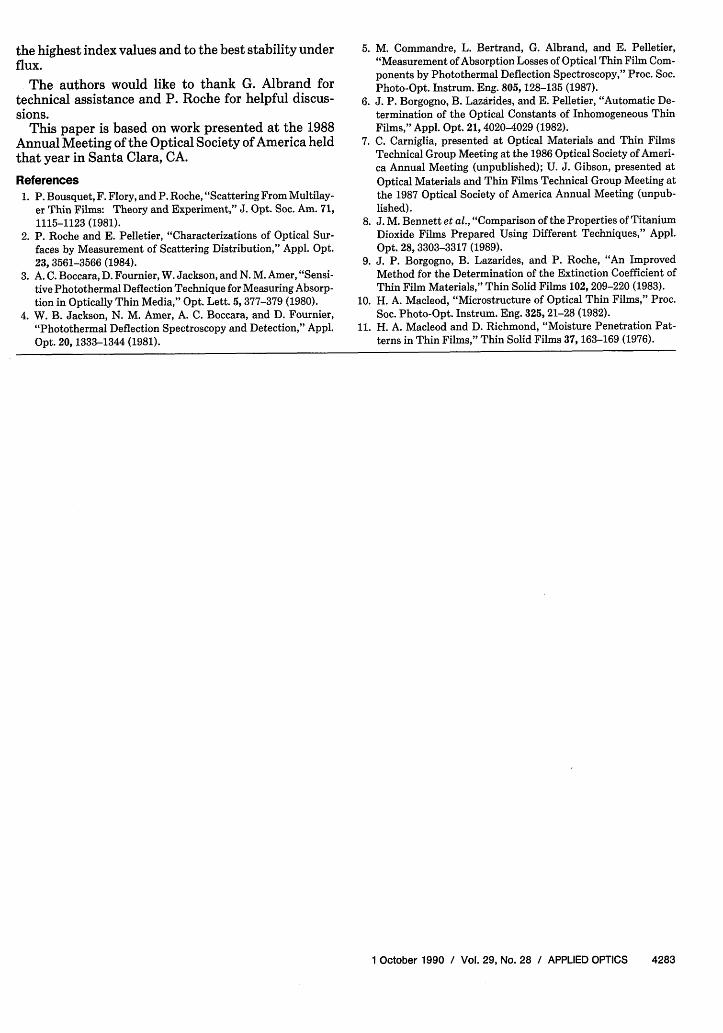
As indicated above, for most single TiO2 layers, ab-sorption under illumination decreases. When illumi-nation is stopped, we can observe a partial reversibilityof the phenomenon. An example (sample 11) is givenin Fig. 5. Curve a corresponds to a first illumination of20 min. Between curves a and b, the sample wasunilluminated for 20 h, in the same conditions of tem-perature and moisture (T = 20'C; 60% moisture).During this time, absorption was partially recovered.The same experiment can be repeated several timeswith similar evolution under the laser beam, followedby a partial reversibility. The unillumination timesare: 24 h between curves b and c, then 96 h between cand d and 1 hour between d and e. The regeneratingtimes are, thus, rather large with respect to the illumi-nation times.
Figure 5 shows that the mean evolution rate is slowerout of the beam than under the beam; and these tworates are high at the beginning and then rapidly stabi-lize.
On the other hand, the reversible part of the absorp-tion change depends in a great part on the sample, butwe have not found, for this set of samples, an obviousrelationship between instability under illuminationand reversibility.
C. Influence of the Hygrometric Degree of Atmosphere
It is well known that the moisture content of airmodifies optical properties of thin layers.10" l We nowshow that it also modifies their stability under and out
Fig. 5. Intermittent illumination of a single layertitania film.
Fig. 6. Influence of hygrometric degree of atmo-sphere on time dependent absorption change.
of the flux. For that reason a single layer TiO2 filmwas submitted to the following cycle (Fig. 6):
moisture degree 60% - (point A) 95% - 60%temperature 200C
Figure 6 shows first than an increase in moisture leadsto a decrease in absorption and that this phenomenonis reversible. Then it appears that water saturationprevents the regeneration (point A indicated in Fig. 6).We have observed these two phenomena on other sam-ples of a TiO 2 layer.
V. ConclusionWe used the very sensitive collinear photothermal
deflection method to measure the extinction coeffi-cients k(X) of materials deposited in thin layers ontransparent substrates. The limit of detectivity of ourapparatus corresponds, for a TiO2 layer on fused silicasubstrate, to an extinction coefficient k of some 10O7.
Measurements made on the nineteen TiO2 filmsmanufactured by different techniques (EB, IAD, IBS,RFS, IP) do not display an obvious correlation be-tween the value of k (extreme values: 4 X 10⁻⁶ and 390X 10-6 for X = 600 nm) and the deposition technique.However, if we consider both n and k, we find that highvalues of n and low losses can be obtained with theRFS, IP, IBSD, and even IAD techniques.
In addition, we demonstrate that the PDS method isthe good means to observe a photoinduced absorptionchange in some of the layers placed in a laser beam.Most of the TiO2 layers have decreasing absorptionduring half an hour of exposure to a beam of 400-W/cm2 irradiance.
The relative change of absorption depends in a greatpart on the sample; it can be high (55% after 10 min ofillumination), but it is null for the six higher refractiveindex samples. The IP, RFS, and IBSD techniquesseem to be the methods of layer production that lead to
the highest index values and to the best stability underflux.
The authors would like to thank G. Albrand fortechnical assistance and P. Roche for helpful discus-sions.
This paper is based on work presented at the 1988Annual Meeting of the Optical Society of America heldthat year in Santa Clara, CA.
References1. P. Bousquet, F. Flory, and P. Roche, "Scattering From Multilay-
er Thin Films: Theory and Experiment," J. Opt. Soc. Am. 71,1115-1123 (1981).
2. P. Roche and E. Pelletier, "Characterizations of Optical Sur-faces by Measurement of Scattering Distribution," Appl. Opt.23, 3561-3566 (1984).
3. A. C. Boccara, D. Fournier, W. Jackson, and N. M. Amer, "Sensi-tive Photothermal Deflection Technique for Measuring Absorp-tion in Optically Thin Media," Opt. Lett. 5, 377-379 (1980).
4. W. B. Jackson, N. M. Amer, A. C. Boccara, and D. Fournier,"Photothermal Deflection Spectroscopy and Detection," Appl.Opt. 20, 1333-1344 (1981).
5. M. Commandre, L. Bertrand, G. Albrand, and E. Pelletier,"Measurement of Absorption Losses of Optical Thin Film Com-ponents by Photothermal Deflection Spectroscopy," Proc. Soc.Photo-Opt. Instrum. Eng. 805, 128-135 (1987).
6. J. P. Borgogno, B. Lazarides, and E. Pelletier, "Automatic De-termination of the Optical Constants of Inhomogeneous ThinFilms," Appl. Opt. 21, 4020-4029 (1982).
7. C. Carniglia, presented at Optical Materials and Thin FilmsTechnical Group Meeting at the 1986 Optical Society of Ameri-ca Annual Meeting (unpublished); U. J. Gibson, presented atOptical Materials and Thin Films Technical Group Meeting atthe 1987 Optical Society of America Annual Meeting (unpub-lished).
8. J. M. Bennett et al., "Comparison of the Properties of TitaniumDioxide Films Prepared Using Different Techniques," Appl.Opt. 28, 3303-3317 (1989).
9. J. P. Borgogno, B. Lazarides, and P. Roche, "An ImprovedMethod for the Determination of the Extinction Coefficient ofThin Film Materials," Thin Solid Films 102, 209-220 (1983).
10. H. A. Macleod, "Microstructure of Optical Thin Films," Proc.Soc. Photo-Opt. Instrum. Eng. 325, 21-28 (1982).
11. H. A. Macleod and D. Richmond, "Moisture Penetration Pat-terns in Thin Films," Thin Solid Films 37, 163-169 (1976).