CO2, H2O, CH4, CO, N2O, NO, NO2, HNO3, F-11, F-12, NH3, SO2, HF, and HC1) against atmospheric background has been studied from IR limb emission spectra (4-100 μm) at various tangent heights in the middle atmosphere. The corresponding report is now available and may be obtained by writing to the authors.1
Line-by-line calculations for a multilayer atmosphere were used to produce synthetic spectra for spectral resolutions of 1 and 0.1 cm -1 and to select spectral features (individual lines or unresolved groups of lines) that can be observed in the atmospheric spectrum. If line parameters were not available, observed atmospheric and laboratory spectra as well as band model parameters have been used to account for the contributions of the corresponding trace species. Contributions by CO2 were studied using both a Lorentzian and a sub-Lorent-zian line shape. Radiance profiles for 1-cm-1 resolution were plotted for selected spectral features indicating the emission of the molecule of interest and of interfering species. Based on the experimental conditions of a He-cooled Ebert-Fastie spectrometer (EFS) developed for the German Infrared Laboratory (GIRL) telescope on the Space Shuttle,2 altitude ranges were estimated in which each constituent can be measured within defined accuracy limits. If the desired accuracy cannot be achieved with the EFS, the study indicates the sensitivities and spectral resolutions that would be needed to measure these less abundant species.
Although the work was done as part of the contribution of the Meteorological Institute Munich (MIM) to the EFS experiment, the study may be of general interest as a survey of the capabilities and limitations of the IR emission spectroscopy for measuring minor constituents in the middle atmosphere. An essential part of the study is the presentation of ~40 synthetic emission spectra of typically 10-cm_1 width in the mid- and far-IR region (4-100 μm) for tangent heights between 10 and ~100 km (see Table I).
After the first two sections, Introduction and Calculation Procedure, the study discusses in detail the detectability of the 15 molecules mentioned above. First, the main properties of the mid- and/or far-IR bands of the molecule under investigation are compared, and specific problems (e.g., sparseness of atmospheric measurements, lack of line data, line wing shape) are indicated. Afterwards the results of our investigations are discussed separately for each band or portion of a band. The calculations are mainly presented as graphs generally consisting of three types of figure for each species: (1) so-called S*m spectra; (2) emission spectra for the two
spectral resolutions of 0.1 and 1 cm-1; (3) radiance profiles for selected spectral features corresponding to the 1-cm-1 resolution.
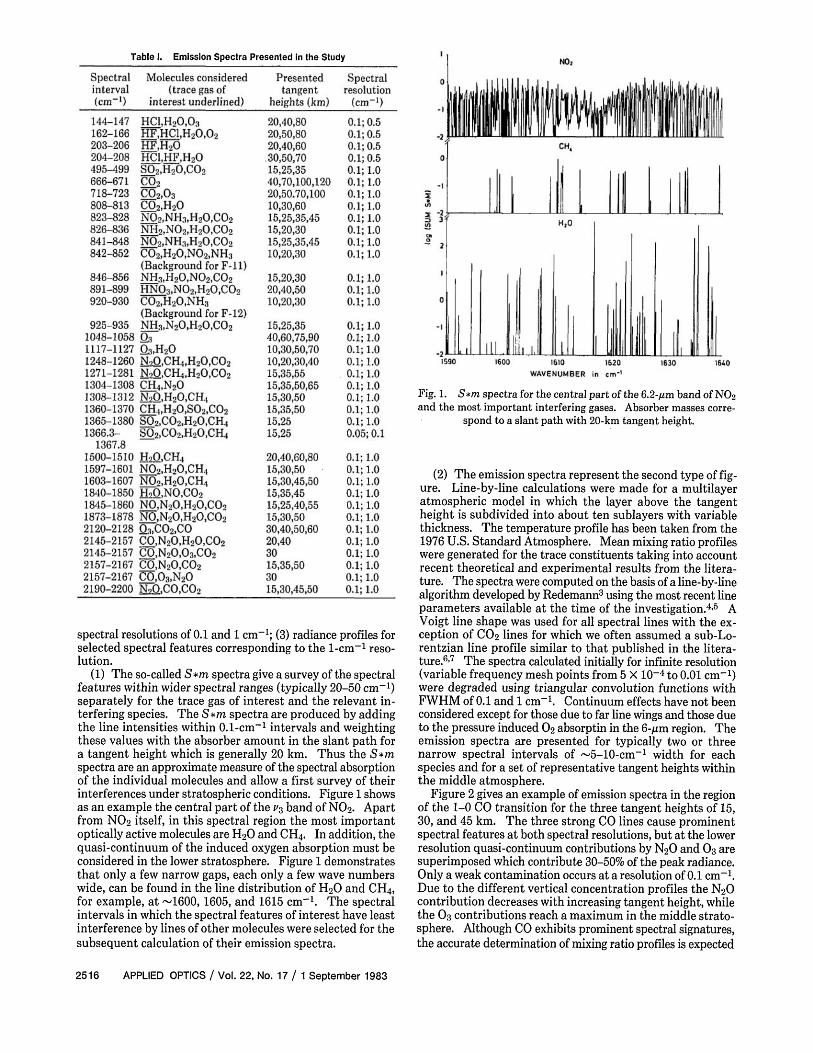
(1) The so-called S*m spectra give a survey of the spectral features within wider spectral ranges (typically 20-50 cm-1) separately for the trace gas of interest and the relevant interfering species. The S*m spectra are produced by adding the line intensities within 0.1-cm-1 intervals and weighting these values with the absorber amount in the slant path for a tangent height which is generally 20 km. Thus the S*m spectra are an approximate measure of the spectral absorption of the individual molecules and allow a first survey of their interferences under stratospheric conditions. Figure 1 shows as an example the central part of the v3 band of NO2. Apart from NO2 itself, in this spectral region the most important optically active molecules are H2O and CH4. In addition, the quasi-continuum of the induced oxygen absorption must be considered in the lower stratosphere. Figure 1 demonstrates that only a few narrow gaps, each only a few wave numbers wide, can be found in the line distribution of H2O and CH4, for example, at ~1600,1605, and 1615 cm-1. The spectral intervals in which the spectral features of interest have least interference by lines of other molecules were selected for the subsequent calculation of their emission spectra.
Fig. 1. S*m spectra for the central part of the 6.2-μm band of NO2 and the most important interfering gases. Absorber masses corre
spond to a slant path with 20-km tangent height.
(2) The emission spectra represent the second type of figure. Line-by-line calculations were made for a multilayer atmospheric model in which the layer above the tangent height is subdivided into about ten sublayers with variable thickness. The temperature profile has been taken from the 1976 U.S. Standard Atmosphere. Mean mixing ratio profiles were generated for the trace constituents taking into account recent theoretical and experimental results from the literature. The spectra were computed on the basis of a line-by-line algorithm developed by Redemann3 using the most recent line parameters available at the time of the investigation.4,5 A Voigt line shape was used for all spectral lines with the exception of CO2 lines for which we often assumed a sub-Lo-rentzian line profile similar to that published in the literature.6,7 The spectra calculated initially for infinite resolution (variable frequency mesh points from 5 × 10⁻⁴ to 0.01 cm-1) were degraded using triangular convolution functions with FWHM of 0.1 and 1 cm-1. Continuum effects have not been considered except for those due to far line wings and those due to the pressure induced O2 absorptin in the 6-μm region. The emission spectra are presented for typically two or three narrow spectral intervals of ~5-10-cm-1 width for each species and for a set of representative tangent heights within the middle atmosphere.
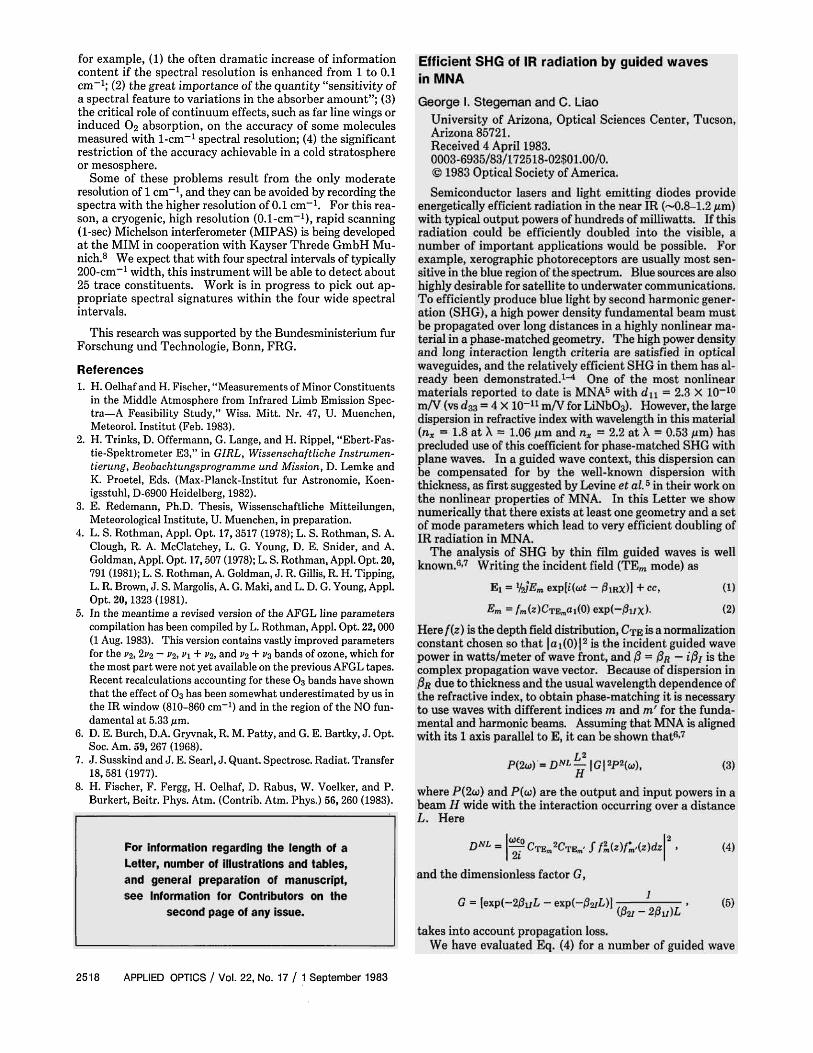
Figure 2 gives an example of emission spectra in the region of the 1-0 CO transition for the three tangent heights of 15, 30, and 45 km. The three strong CO lines cause prominent spectral features at both spectral resolutions, but at the lower resolution quasi-continuum contributions by N2O and O3 are superimposed which contribute 30-50% of the peak radiance. Only a weak contamination occurs at a resolution of 0.1 cm-1. Due to the different vertical concentration profiles the N2O contribution decreases with increasing tangent height, while the O3 contributions reach a maximum in the middle stratosphere. Although CO exhibits prominent spectral signatures, the accurate determination of mixing ratio profiles is expected
Fig. 2. Synthetic emission spectra showing the R3, R4, and R5 lines of the 1-0 CO band and the interference by lines of H2O, N2O, and
O3 at three tangent heights.
to be difficult due to the low energy content of the lines at these short wavelengths and the low sensitivity of the lines to variations in the stratospheric CO absorber amount.
The spectra enabled us to select those emission features which are marked by a high energy content together with low blending effects and whose absorption is, if possible, in the linear region.
(3) The radiance profiles—the third type of figure—are presented for selected spectral features of each trace species for a spectral resolution of 1 cm - 1 . The vertical scale normally covers the range from the tropopause up to that altitude where the radiance profile comes close to the detection limit defined below. In general, for each selected feature, we show the radiance profile of the species of interest and the radiance contributions of the interfering gases. These profiles demonstrate how the variation with height depends on the vertical distribution of the trace gas involved. In most cases additional profiles are presented which indicate the sensitivity of the spectral features to a variation in the absorber amount of the target gas of 50%. This information is required for estimating altitude ranges in which the trace species can be detected. Radiance profiles obtained from band models (e.g., F - l l , F-12, O2 continuum) are computed separately from the line-by-line calculations. They are based on a lower spectral resolution.
By examining the emission spectra, the radiance profiles, and the sensitivity of the spectral features, those features of each species were selected which seemed most appropriate for detection under the conditions defined above. For these features altitude ranges were estimated in which the pertinent trace species can be measured within defined accuracy limits. Of course, this estimate is correlated with the design characteristics of the EFS 2 [spectral resolution of ≤ 1 cm - 1 ; NER of ~ 2 × 10 - 1 0 W/(cm2 sr)]. Figure 3 shows the results for an accuracy limit of 20% in mixing ratio. About 11 trace species can be measured in more or less extended altitude regions; CO2,O3, H2O, HF are detectable in the entire mesosphere with good accuracy. If the accuracy limit is reduced to 50%, additionally, NO, CO, and HC1 are observable.
In addition to the general task of the investigation, the study has yielded specific statements of interest concerning,
Fig. 3. Altitude ranges of detectability and positions of pertinent spectral features of trace constituents for the EFS. The accuracy limit is assumed to be 20% of the mixing ratio. Dotted lines indicate the results for the O3 nighttime
for example, (1) the often dramatic increase of information content if the spectral resolution is enhanced from 1 to 0.1 cm - 1 ; (2) the great importance of the quantity "sensitivity of a spectral feature to variations in the absorber amount"; (3) the critical role of continuum effects, such as far line wings or induced O2 absorption, on the accuracy of some molecules measured with 1-cm-1 spectral resolution; (4) the significant restriction of the accuracy achievable in a cold stratosphere or mesosphere.
Some of these problems result from the only moderate resolution of 1 cm - 1 , and they can be avoided by recording the spectra with the higher resolution of 0.1 cm - 1 . For this reason, a cryogenic, high resolution (0.1-cm -1), rapid scanning (1-sec) Michelson interferometer (MIPAS) is being developed at the MIM in cooperation with Kayser Threde GmbH Munich.8 We expect that with four spectral intervals of typically 200-cm -1 width, this instrument will be able to detect about 25 trace constituents. Work is in progress to pick out appropriate spectral signatures within the four wide spectral intervals.
This research was supported by the Bundesministerium fur Forschung und Technologie, Bonn, FRG.
References 1. H. Oelhaf and H. Fischer, "Measurements of Minor Constituents
in the Middle Atmosphere from Infrared Limb Emission Spectra—A Feasibility Study," Wiss. Mitt. Nr. 47, U. Muenchen, Meteorol. Institut (Feb. 1983).
2. H. Trinks, D. Offermann, G. Lange, and H. Rippel, "Ebert-Fas-tie-Spektrometer E3," in GIRL, Wissenschaftliche Instrumen-tierung, Beobachtungsprogramme und Mission, D. Lemke and K. Proetel, Eds. (Max-Planck-Institut fur Astronomie, Koen-igsstuhl, D-6900 Heidelberg, 1982).
3. E. Redemann, Ph.D. Thesis, Wissenschaftliche Mitteilungen, Meteorological Institute, U. Muenchen, in preparation.
4. L. S. Rothman, Appl. Opt. 17, 3517 (1978); L. S. Rothman, S. A. Clough, R. A. McClatchey, L. G. Young, D. E. Snider, and A. Goldman, Appl. Opt. 17, 507 (1978); L. S. Rothman, Appl. Opt. 20, 791 (1981); L. S. Rothman, A. Goldman, J. R. Gillis, R. H. Tipping, L. R. Brown, J. S. Margolis, A. G. Maki, and L. D. G. Young, Appl. Opt. 20, 1323 (1981).
5. In the meantime a revised version of the AFGL line parameters compilation has been compiled by L. Rothman, Appl. Opt. 22, 000 (1 Aug. 1983). This version contains vastly improved parameters for the v2, 2v2 — v2, v1 + v2, and v2 + v3 bands of ozone, which for the most part were not yet available on the previous AFGL tapes. Recent recalculations accounting for these O3 bands have shown that the effect of O3 has been somewhat underestimated by us in the IR window (810-860 cm-1) and in the region of the NO fundamental at 5.33 μm.
6. D. E. Burch, D.A. Gryvnak, R. M. Patty, and G. E. Bartky, J. Opt. Soc. Am. 59, 267 (1968).
7. J. Susskind and J. E. Searl, J. Quant. Spectrosc. Radiat. Transfer 18, 581 (1977).
8. H. Fischer, F. Fergg, H. Oelhaf, D. Rabus, W. Voelker, and P. Burkert, Beitr. Phys. Atm. (Contrib. Atm. Phys.) 56, 260 (1983).