Measurements of temperature of brake disks in hoisting machines of mine shaft hoists by L. Kowal*, K. Turewicz* and T. Kruczek** * KOMAG Institute of Mining Technology, Pszczyńska 37, 44-101 Gliwice, Poland, [email protected]** Institute of Thermal Technology, Silesian University of Technology, Konarskiego 22, 44-100 Gliwice, Poland, [email protected]Abstract The hoisting machines of mine shaft hoists are the heavy machines of high operational parameters designed for transportation of run-of-mine, machines, materials and people between the mine surface and mine underground workings. In some special conditions the hoisting machine, which is in operation, must be stopped by a mechanical brake. In the state-of-the-art hoisting machines these are the disk brakes, which are able to stop the operating machine of energy from 30 even up to 150 MJ, with heat generation. Excessive temperature can cause deformation of brake components or loss of frictional properties in a disk – brake shoe system. It can be the reason of a failure of the machine, which is the only transportation way between mine underground workings and the surface. The tested machines are described in the paper and the results of measurements taken on real objects and in the laboratory are given. Quantitative identification of operational parameters that occur during braking will enable to design new solutions of brake disks for the hoisting machines of higher operational parameters, at the same time maintaining reliable operation of these machines. 1. Introduction In the Polish mines the hoisting depth is up to 1000 m. More often the hoisting machines, which can guarantee the range of hoisting up to 1300 – 1500 m, are demanded. This is not too excessive demand in comparison to the deepest mines in the world. However, in conjunction with higher and higher expectations as regards capacity, these machines put new challenges to the designers as regards properly configured brakes of machines ensuring safe stoppage of the entire shaft hoist that is in operation. In the Polish mines the hoisting machines transport the loads of weight 20 – 30 Mg, with speed 16 – 20 m/s. Growing demands set by investors increase these parameters to the hoisting capacity 40 Mg and speed even up to 25 m/s, and the power of drive motors installed in such machines is of 6 – 9 MW. In some special conditions the hoisting machine, which is in operation, must be stopped by its mechanical brake. In the state-of-the-art hoisting machines these are the disk brakes equipped with hydraulic brake cylinders, which are able to stop the operating hoisting machine that drives the system of high kinetic and potential energy. The sum of those energies is from 30 even up to 150 MJ. In emergency situations the energy must be absorbed by the mechanical brake. This energy during braking is almost in 100% transformed into heat, which is absorbed by the brake disks and by the lining of brake cylinders. Heat generated during braking warms up both brake disks and frictional materials of brake jaws. In the case of brake disks excessive temperature can cause their deformation and in the case of lining of brake jaws it can cause loss of their frictional properties and significant decrease in friction coefficient, and the same decrease of braking efficiency. It can be the reason of a serious failure of the machine, which is often the only transportation way between mine underground workings and the surface. Stoppage of the hoist due to the failure can be a reason of stopping the mining process and serious financial losses. Thus, in the case of designing the hoisting machines of high power it is important to predict thermal processes that can occur during machine braking with use of mechanical brake. Very simplified analytical methods for determination of temperature of brake disks during braking process were used so far. State-of-the-art calculation tools give much better possibilities. Work aiming at use of state-of-the-art calculation tools, which are based on the Finite Elements Method, to analyze thermal phenomena in mechanical brakes of hoisting machines was undertaken at the KOMAG Institute of Mining Technology. This work is realized together with the Institute of Thermal Technology and Institute of Mining Mechanization at the Silesian University of Technology. The scope of work included: - measurements of temperature of brake disks by infrared camera in selected real objects during braking the machine with use of mechanical brake, in defined operational conditions, - construction of numerical model of braking process using the brake of hoisting machine to make analyses with use of the Finite Elements Method, - verification of model on the basis of measurements taken on real objects, - use of the results of numerical analyses of heating the brake disks for configuration of brake of hoisting machine of determined operational parameters. 11 th International Conference on Quantitative InfraRed Thermography
Transcript
Measurements of temperature of brake disks in hoist ing machines of mine shaft hoists
by L. Kowal*, K. Turewicz* and T. Kruczek**
* KOMAG Institute of Mining Technology, Pszczyńska 37, 44-101 Gliwice, Poland, [email protected] ** Institute of Thermal Technology, Silesian University of Technology, Konarskiego 22, 44-100 Gliwice, Poland,
The hoisting machines of mine shaft hoists are the heavy machines of high operational parameters designed for transportation of run-of-mine, machines, materials and people between the mine surface and mine underground workings. In some special conditions the hoisting machine, which is in operation, must be stopped by a mechanical brake. In the state-of-the-art hoisting machines these are the disk brakes, which are able to stop the operating machine of energy from 30 even up to 150 MJ, with heat generation. Excessive temperature can cause deformation of brake components or loss of frictional properties in a disk – brake shoe system. It can be the reason of a failure of the machine, which is the only transportation way between mine underground workings and the surface. The tested machines are described in the paper and the results of measurements taken on real objects and in the laboratory are given. Quantitative identification of operational parameters that occur during braking will enable to design new solutions of brake disks for the hoisting machines of higher operational parameters, at the same time maintaining reliable operation of these machines.
1. Introduction
In the Polish mines the hoisting depth is up to 1000 m. More often the hoisting machines, which can guarantee the range of hoisting up to 1300 – 1500 m, are demanded. This is not too excessive demand in comparison to the deepest mines in the world. However, in conjunction with higher and higher expectations as regards capacity, these machines put new challenges to the designers as regards properly configured brakes of machines ensuring safe stoppage of the entire shaft hoist that is in operation.
In the Polish mines the hoisting machines transport the loads of weight 20 – 30 Mg, with speed 16 – 20 m/s. Growing demands set by investors increase these parameters to the hoisting capacity 40 Mg and speed even up to 25 m/s, and the power of drive motors installed in such machines is of 6 – 9 MW.
In some special conditions the hoisting machine, which is in operation, must be stopped by its mechanical brake. In the state-of-the-art hoisting machines these are the disk brakes equipped with hydraulic brake cylinders, which are able to stop the operating hoisting machine that drives the system of high kinetic and potential energy. The sum of those energies is from 30 even up to 150 MJ. In emergency situations the energy must be absorbed by the mechanical brake. This energy during braking is almost in 100% transformed into heat, which is absorbed by the brake disks and by the lining of brake cylinders.
Heat generated during braking warms up both brake disks and frictional materials of brake jaws. In the case of brake disks excessive temperature can cause their deformation and in the case of lining of brake jaws it can cause loss of their frictional properties and significant decrease in friction coefficient, and the same decrease of braking efficiency. It can be the reason of a serious failure of the machine, which is often the only transportation way between mine underground workings and the surface. Stoppage of the hoist due to the failure can be a reason of stopping the mining process and serious financial losses.
Thus, in the case of designing the hoisting machines of high power it is important to predict thermal processes that can occur during machine braking with use of mechanical brake. Very simplified analytical methods for determination of temperature of brake disks during braking process were used so far. State-of-the-art calculation tools give much better possibilities. Work aiming at use of state-of-the-art calculation tools, which are based on the Finite Elements Method, to analyze thermal phenomena in mechanical brakes of hoisting machines was undertaken at the KOMAG Institute of Mining Technology. This work is realized together with the Institute of Thermal Technology and Institute of Mining Mechanization at the Silesian University of Technology. The scope of work included: − measurements of temperature of brake disks by infrared camera in selected real objects during braking the machine
with use of mechanical brake, in defined operational conditions, − construction of numerical model of braking process using the brake of hoisting machine to make analyses with use of
the Finite Elements Method, − verification of model on the basis of measurements taken on real objects, − use of the results of numerical analyses of heating the brake disks for configuration of brake of hoisting machine of
determined operational parameters.
11th International Conference on
Quantitative InfraRed Thermography
2. Characteristics of objects
Real objects as well as problems associated with braking process with use of mechanical brake of hoisting machine, i.e. the entire shaft hoist, are discussed and identified, when specifying the problems of presented task.
2.1. General description of design of mechanical pa rt of hoisting machine
A model of exemplary four-rope hoisting machine with two motors of power 3600 kW is presented in Fig. 1. Main shaft installed in rolling bearings and slide bearings fixed to the foundation frame with the Koepe pulley is the main component of the mechanical part of such machine. Rotors of low-speed DC motors and the Koepe pulley, through which the hoisting ropers with conveyances at their ends roll, are installed at the ends of the shaft. Brake disks, which are under pressure of brake cylinders equipped with frictional lining ensuring stable, predetermined friction coefficient between them and brake disk, are fixed on both sides of the drum. Brake cylinders are hydraulically released from brake disks, and pressure to disks is generated by the springs installed inside the cylinders bodies.
A diameter of the Koepe pulley depends on a diameter of hoisting ropes, which are selected as regards the weight suspended at their ends, i.e. weight of conveyances, weight of transported load, weight of hoisting ropes and weight of balance ropes hanging in a shaft of mine shaft hoist. Brakes of hoisting machines that are configured at present have two brake disks fixed to the side surface of the Koepe pulley coat (on its both sides), of diameters similar to external diameter of the Koepe pulley. The number of brake cylinders indispensable to ensure required stability of machine during parking is selected depending on degree of forces unbalancing in ropes on both sides of the Koepe pulley, including proper coefficients of stability of the system, which are required by the regulations, and parameters of the cylinders, i.e. pressing force generated by them.
2.2. Description of the process of braking with use of mechanical brake
Brakes in the state-of-the-art hoisting machines do not play a significant role in the process of deceleration of these machines during their regular operation. Deceleration of operating hoisting machine is realized by braking with electric motor with recovery of energy to the electric grid. Mechanical brakes are activated at the moment when the speed is equal to 0 m/s and they keep the machine and the whole hoist at rest.
However, ability to stop the hoisting machine mechanically, i.e. due to friction of brake lining of brake cylinders by brake disks of hoisting machine, and the same time, ability to stop the whole system of mine shaft hoist in emergency situation, is a very important task of brakes in hoisting machines. Such activation of brake takes place in exceptional situations, e.g. when improper operation of some machine sub-systems is found by the control systems or when this process is initiated by the operator of hoisting machine who found that it is necessary to stop the machine in such way. In such braking mode of hoisting machine the whole energy of operating shaft hoist must be absorbed by mechanical brakes.
Total energy of operating hoisting machine during braking can be calculated acc. to the relationship 1:
sNvm
EEE rpkc ±±±±====±±±±==== ∑∑∑∑
2
2
(1)
where: kE – kinetic energy of operating hoist, J; rm – sum of weight of all hoist components which are in operation
reduced to the rope winding diameter, kg; v – hoist speed, m/s; pE – potential energy of ascended or descended not
balanced weight on both sides of the Koepe pulley (static overweight), J; N – differences of forces in a rope on both sides of the Koepe pulley resulting from the volume of transported load, N; s – hoist braking distance, m.
11th International Conference on Quantitative InfraRed Thermography, 11-14 June 2012, Naples Italy
Heat stream generated during braking can be determined from the relationship (2):
)()( tvFtvFq dt µ======== (2)
where: tF – friction force between lining of brake shoe and brake disk, N; )(tv – speed of hoist during braking, m/s;
dF – force pressing the brake shoes to the disk, N; µ – coefficient of friction between lining of brake shoe and brake
disk.
Parameters of braking tests, carried out on real objects, during which temperature of brake disks was measured during braking of mine shaft hoists by infrared camera, were determined by the relationships (1) and (2).
Table 1. Characteristic parameters of tested hoists and braking process
Type of machine 4L-5500/2×3600 kW 2L-6000/2×2000 kW 2L-5000/2000 kW Sum of hoist weights, which is in
operation 180 000 kg 163 000 kg 108 000 kg
Not balanced weight 30 000 kg 21 000 kg 12 500 kg Maximal speed 16 m/s 10 m/s 10 m/s
Characteristic parameters of hoist braking - maxima l Maximal total energy of the system
during braking (descending of overweight)
36.6 MJ 25.5 MJ 9.8 MJ
Maximal heat stream at the moment of starting the barking
8.6 MW 4.6 MW 2.7 MW
Characteristic parameters of braking in testing con ditions Option of movement during the
measurement ascending not
balanced weight travel with empty
conveyances travel with empty
conveyances Volume of not balanced weight 30 000 kg 0 kg 0 kg
Speed at the moment of starting the braking
14 m/s 10 m/s 10 m/s
Total energy of the system during braking
11.6 MJ 11.9 MJ 4.8 MJ
Maximal heat stream at the moment of starting the braking
8.6 MW 4.6 MW 2.7 MW
3. Tests on real objects
The tests on hoisting machines used in real conditions were carried out within the research work. The tests included the measurements of emissivity of brake surface and the measurements of brake temperature during simulated emergency braking. The tests were made during normal operation of the machine and thus there were some limitations in access to the machine as well as limitations as regards the range of testing. The schedule of tests could not include too high operational parameters of the machine to avoid its failure.
3.1. Characteristics of objects and range of tests
The measurements were taken on three objects. Basic data for these objects are given in Table 1. A view of tested hoisting machine (2L-6000/2×2000 kW) and measuring station are presented in Fig. 2. During the measurements the temperature on the surface of brake disk was measured by infrared camera as well as mechanical parameters of braking process (load weight, pressing force of brake shoes, braking distance and rotary speed of Koepe pulley) were measured. Environmental radiation conditions, which are generally non-isothermal, had an impact on the quality of thermovision measurements of temperature. The impact is especially important at low values of emissivity [3, 4] (disks of brakes have such emissivity). A suitable sleeve protecting the place of measurement against impact of thermally diversified environment was used to reduce the impact of environment on the measurement results, Fig. 2.
11th International Conference on Quantitative InfraRed Thermography, 11-14 June 2012, Naples Italy
Fig. 2 View of tested 2L-6000/2×2000 hoisting machine
and measuring station (source: KOMAG’s report)
Fig. 3. Exemplary result of thermovision testing of emissivity of disks surface; white stripe with painted black
LI01line of high emissivity; above LI02 line on real surface of brake disk (source: KOMAG’s report)
3.2. Analysis of results of tests in real condition s
Distribution of temperature of disk during simulated emergency braking was tested during the measurements and coefficient of emissivity of disk surface was determined. Emissivity of disk surface was tested by warming the disk up with external heater, and then the temperature of disk surface was measured by touch thermocouple and infrared camera. Moreover, changeability of disk surface emissivity was tested along disk radius by covering the disk with a paint stripe of high known emissivity. Then, after warming up the disk, the results of measurements of its temperature taken with use of measuring area and line were compared. Measurements taken on the painted stripe and close to it on the disk surface are presented in Fig. 3. Emissivity was determined from comparison of both temperatures, Fig. 4b.
a)
b)
55
60
65
70
75
Fig. 4. Result of tests of structure and radiation properties of the surface of brake disk; a) photograph presenting the stripe structure of disk surface; b) distribution of temperature on disk surface in radial direction, regular black line – distribution of temperature along LI01 line, irregular red line – fluctuations of apparent temperature of the
disk along LI02 line, Fig. 3 (source: KOMAG’s report)
The disk temperature along LI01 line on a stripe and the distribution of temperature measured on a real disk surface along LI02 line was compared, Fig. 3 and 4b. Due to vicinity of lines LI01 and LI02, it can be assumed that the temperature along both lines is the same. Temperature differences that were found for both lines (Fig. 4b) are apparent differences and they result from differentiation of coefficient of real emissivity of disk surface. This technology was used to compare the size of differentiation of disk emissivity in radial direction. It was found that the structure of disk operational surface is of stripe character formed during brake operation by granular structure of brake shoe material. This phenomenon makes it difficult to take the correct measurement of disk temperature by infrared camera.
Exemplary time distribution of average temperature of disk surface during the tests of brake of 2L-6000/2×2000 kW machine is presented in Fig. 5. Time before starting the brake, time of braking and time after braking (cooling of fixed
11th International Conference on Quantitative InfraRed Thermography, 11-14 June 2012, Naples Italy
disk) were distinguished. Rapid increase of temperature, which was kept for about 2 s, was observed during braking, just after starting the brake. Then drop of surface temperature caused by reduced stream of generated heat in a result of decreasing rate of disk movement was observed.
60
65
70
75
80
85
90
95
100
-2 -1 0 1 2 3 4 5 6 7 8Braking time, s
Ave
rage
tem
pera
ture
of d
isc
surfa
ce,
oC
T_avg-before braking
T_avg-braking time
T_avg-after braking
Fig. 5. Exemplary distribution of average temperature of brake disk during braking (2L-6000/2×2000kW)
(source: KOMAG’s report)
4. Laboratory tests
A series of measurements at the laboratory stand were taken to study better thermal phenomena, which occur during braking process, and to collect data for numerical verifications of computational models. The stand is presented in Fig. 6.
4.1. Laboratory stand and range of tests
The laboratory stand had one ventilated brake disk with a single two-sided brake clamp. The brake shoes were made in a form of cylinder. Two holes of diameter 0.6 mm and depth equal to half of cylinder diameter were made from one side of brake shoe base for testing purposes. Two jacket thermocouples of 0.5 mm diameter, which were used for the measurement of temperature in brake shoe geometrical axis, were installed in those holes. The distance of the first thermocouple (marked as T1) from the brake shoe basis was equal to 2.0 mm, while the distance of the second thermocouple (T2) was equal to 4.0 mm, Fig. 7. A diameter of brake shoe was equal to 27.3 mm, and disk diameter was equal to 310 mm. The brake clamp was placed on a pitch diameter 280 mm.
27.3
2.0
0.6
T1
T2
4.0
brak
e di
sc
Fig. 6. Laboratory stand for tests of braking parameters (source: KOMAG’s report)
Fig. 7. View of brake shoe (source: KOMAG’s report)
Measuring system of the system enabled to measure and record the following parameters: a. disk speed at the braking point, b. pressing forces of rake shoes, c. friction force.
The above mentioned parameters of braking process were recorded during the measurements. Additionally, the measurement of brake shoe temperature was taken by thermocouples T1 and T2, the measurement of disc surface
11th International Conference on Quantitative InfraRed Thermography, 11-14 June 2012, Naples Italy
temperature was taken by infrared camera, and ambient temperature was measured. The results of temperature measurements taken by infrared camera (ThermaCAM SC2000) were recorded every 0.15 s, and the results of temperature measurements taken by thermocouples were recorded every 1.0 s.
Observation and recording of changes in temperature on the surface of disk and inside brake shoes (thermocouples T1 and T2) during braking of disk driven by the motor were made during the tests. Braking was realized till the moment when set temperature (200 oC) was reached in the brake shoe (thermocouple T1). This case (measurement BC_25_1) is described in further part of the paper [2].
Additionally the measurement of disk surface emissivity was taken before each measurement. The measurement of disk temperature was taken by touch thermocouple and at the same time by infrared camera. Due to the fact that significant differentiation of disk surface emissivity was found, this measurement was repeated many times at four places on a disk circumference, Fig. 8.
4.2. Analysis of laboratory measurement results
In Fig. 8 arrangement of the places of brake disk emissivity measurement is shown. In each cross-section few measurements were taken. None of relationships between emissivity and temperature or a position of measuring point on brake disk surface were found. Working surface of the disk is differentiated as regards its color what has an important impact on its emissivity. In Fig. 9 the photo of brake disk fragment is presented. A significant difference between active surface of the disk and its inactive part can be seen. Besides the striped and inhomogeneous structure of active disk surface can be seen. This fact makes obtaining reliable measurement of emissivity difficult.
In Fig. 10 exemplary results of emissivity measurements are given. Additionally the range of standard deviation [1] above and below mean value of emissivity coefficient is shown. This area is characterized by a degree of dispersion of measurement results. On the active disk surface some dissipation of emissivity measurements was found. However the dissipation is not so high. Experimental standard deviation )(εs was determined using relationship (3) and it was
equal to 0.025.
11
2
−−−−
−−−−====
∑∑∑∑====
ns
n
ii )(
)(εε
ε (3)
where: ε =0.49 – average emissivity (arithmetic mean), n - number of measurements.
B
A
D
C
Fig. 8. Diagram of brake disk with the places of
surface emissivity measurements
Fig. 9. Photo of working surface of brake disk
The presented exemplary measurement (marked with symbol BC_25 1), was taken at the following conditions: • brake shoe pressing force 400 N, • rate of disk movement 12 m/s. In Fig. 11 the exemplary thermogram (thermovision photo) of warmed up brake disk during the test is
presented. All temperature readings were made for the AR01 measuring area put on the mentioned thermogram. Direction of brake disk rotation and the position of brake clamp were marked on the thermogram. It should be stated that due to the testing facility design a direct measurement of temperature of disk brake surface just after leaving the jaws was not possible. The measurement was taken at a distance of 3/4 of disk revolution.
11th International Conference on Quantitative InfraRed Thermography, 11-14 June 2012, Naples Italy
0,40
0,44
0,48
0,52
0,56
0,60
80 90 100 110 120 130
Temperature, oC
Em
issi
vity
A
B
C
D
1 (avg)
2 (avg+std)
3 (avg-std)
Fig. 10. Results of measurement of brake disk emissivity with area covering a single standard deviation; 1-
average emissivity ε ; 2, 3- emissivity area )(εε s±±±±
In Fig. 12 an exemplary distribution of temperature in cross-section of AR01 through the area of brake disk area cooperating with the brake shoe is presented. The mentioned temperature distributions are given for the time moments specified in the figure legend. Entire braking process lasted 72.61 seconds. Temperature profile, first from the top in Fig. 12, is one of end results recorded during the entire test. Presented temperature distributions were determined for the average disk emissivity equal to ε =0.49. On the basis of Fig. 12 we can draw the following conclusions:
• there is a significant differentiation in surface temperature of brake disk along its radius, • probably the disk is not warming up evenly along its radius, • there is a repeatability of shape of recorded temperature profiles (e.g. always at the same place there is
maximal temperature) despite the fact that for sure they were measured at different points of disk circumference,
• there is a significant temperature drop in vicinity of edges of disk operational area. The following can be a reason of temperature drop in vicinity of edges of disk operational area: • less amount of generated frictional heat at edge of brake shoe caused by shorter contact time of given
point of disk circumference with the brake shoe, (brake shoe has a cylindrical shape, see Fig. 7), • more intensive heat outflow through transmission from the edges of disk working area in comparison with
the middle part of this area, • lower real emissivity of this surface than it was accepted in analysis of thermograme, • the mentioned above factors altogether. In the summary we have to say that adding the boundary area to calculations of average temperature of disk
working surface will significantly lower the temperature. In further part of the paper the changes in maximal temperature in time, observed in the accepted AR01 measuring area (Fig. 11) as well as average temperatures for this area was presented, Fig. 13.
110
120
130
140
150
160
170
180
190
200
210
0 3 6 9 12 15 18 21 24 27
Distance from edge of brake block, mm
Tem
pera
ture
of d
isk
surfa
ce,
oC
70.58s
68.16s
63.60s
58.00s
54.43s
50.31s
45.09s
Fig. 11. Exemplary thermogram of brake disk, indication a
direction of disk rotation and position of brake clamp Fig. 12. Distribution of temperature along the disk radius
(position AR01) on the surface cooperating with brake shoe for time measured from the beginning of braking
given in the legend
In Fig 13 the results of measurement of temperature on the disk surface taken by infrared camera are given and in Fig. 14 the results of measurement of temperature in brake shoe taken by T1 and T2 thermocouple are shown, see also Fig. 7. In Fig. 13 maximal temperature, observed in AR01 measuring area (Fig. 11), set of points “1” and approximation curve “2” as well as average temperature for AR01 area, presented by set of points “3” and approximation curve “4”, determined by least squares method, are given. The diagram covers entire time of the test, as the last result
11th International Conference on Quantitative InfraRed Thermography, 11-14 June 2012, Naples Italy
was recorded after 72.61 s from the moment of staring the braking process. The highest temperature that was observed in AR01 measuring area was 208oC (set of points “1” Fig. 13), but according to the approximation curve “2” the highest temperature for all points after averaging was 200oC (end of braking, Fig. 13). The results are coherent with brake shoe temperature measurements taken by thermocouples T1 and T2, Fig. 14. The highest temperature indicated by thermocouple T1 was 207 oC (peak of the curve on diagram in Fig. 14). The temperature was observed after 72 s from the beginning of braking process. It would seem that temperature of brake disk surface should be higher as temperatures at the place of contact of cooperating brake shoe and disk are the same. However, it should be remembered that temperature measurement was taken with a delay, after 3/4 revolution made by the disk after its run out of the brake jaws. At that time there was a reduction in surface temperature due to heat transmission into the disk material and heat exchange with environment.
40
60
80
100
120
140
160
180
200
220
0 20 40 60 80
Braking time, s
Tem
pera
ture
of b
raki
ng d
isc
surfa
ce,
oC
1 (T_max)
3 (T_avg)
2 (T_max, approximation)
4 (T_avg, approximation)
30
50
70
90
110
130
150
170
190
210
0 20 40 60 80 100
Braking time, s
Bra
ke b
lock
tem
pera
ture
, oC
T1,oC
T2, oC
Fig. 13 . Increase of temperature on the disk surface in function of braking time for the average brake disk emissivity ε =0.49; 1,2- points of measurement of
maximal temperature in AR01 area and approximation by the curve; 3, 4- points of measurement of average
temperature in AR01 area and approximation by the curve, respectively
Fig. 14. Increase of brake shoe temperature in T1 and T2 measuring points as a function of time
4.3. Impact of emissivity measurement on the result of measurement of brake disk surface temperature
To identify quantitative impact of brake disk emissivity on the result of its temperature measurement, the range of changes in disk temperature during braking was determined using different emissivity coefficient for the brake disk surface. Change of average and maximal temperature for AR01 measurement area was analyzed (Fig. 11). Two extreme emissivity coefficient calculated according to the relationship )(εεε s±±±±==== were accepted. Calculation results are given
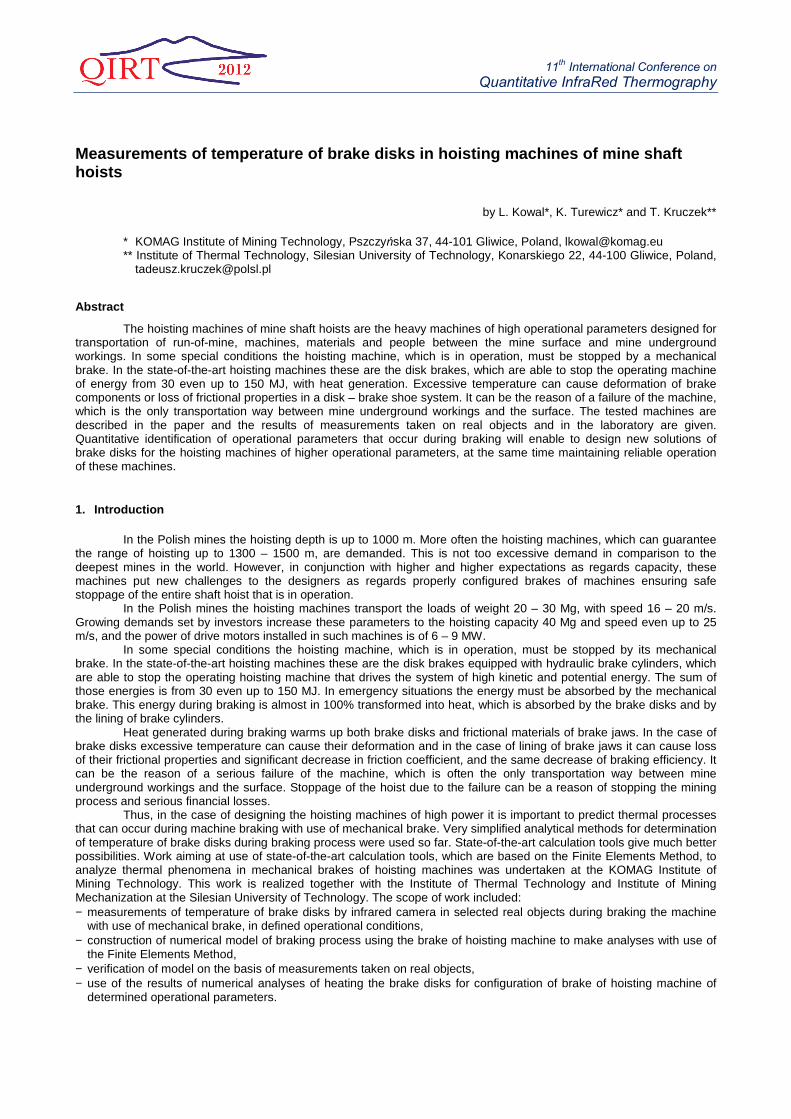
in Fig. 15 and 16. In Fig. 15 change in maximal temperature observed in AR01 area is shown. The changes are presented in a
form of set of measuring points and in the form of approximation curve determined by the least squares method (Fig. 15). The maximal temperature observed during the test was equal to 215oC, and the maximal temperature determined by the approximation curve for end of the test was 208oC (curve „3”, Fig. 15). It means that reduction of emissivity by the value of standard deviation )(εs =0.025 caused temperature increase by 8 oC (see curve “3” in Fig. 15 and curve “2” in Fig.
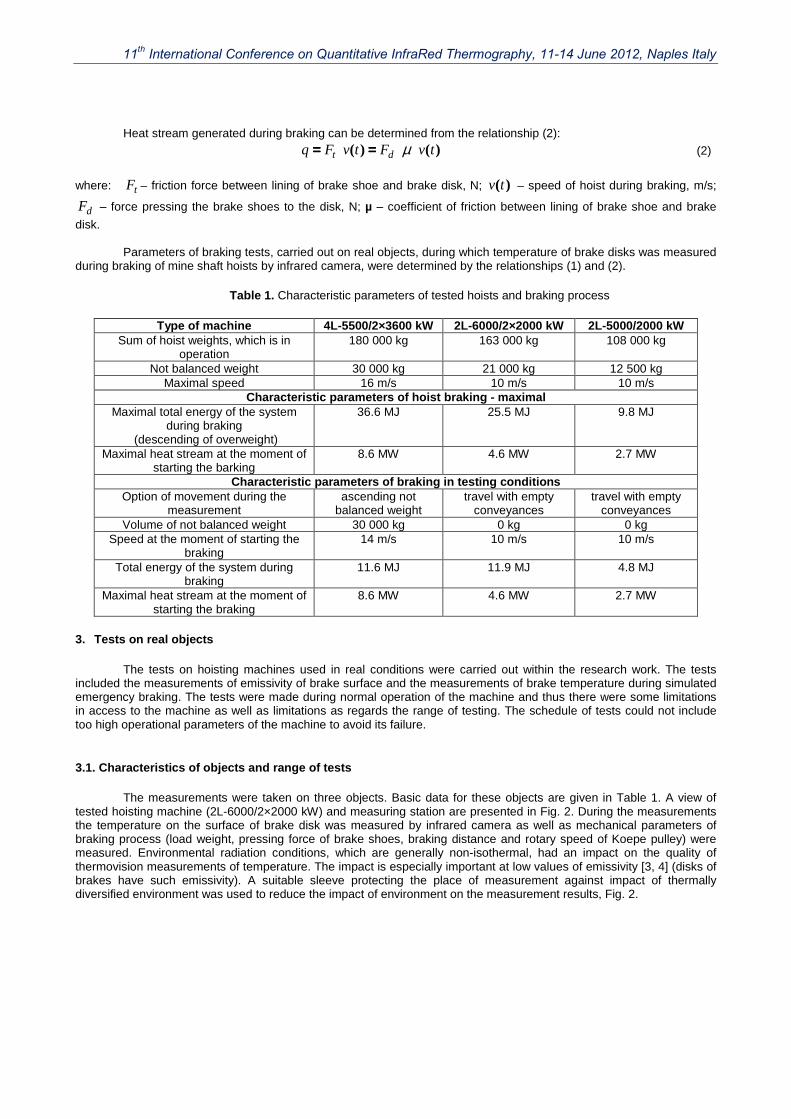
13). Fig. 16 gives the results of similar analysis but made for average temperatures in AR01 measuring area. The
average temperature for the above mentioned measuring area is on average by 20 oC lower than previously analyzed maximal temperature.
In the case of increase of emissivity by the standard deviation the quantitative result is similar, but in such case we have decrease of temperature. That concerns both maximal temperature in AR01 measuring area (Fig. 15) and the average temperatures, Fig. 16.
The calculations as well as their analysis indicate for the impact of brake disk emissivity on temperature measurements.
11th International Conference on Quantitative InfraRed Thermography, 11-14 June 2012, Naples Italy
40
60
80
100
120
140
160
180
200
220
0 20 40 60 80
Braking time, s
Hig
hest
tem
pera
ture
in c
onsi
dere
d ar
ea,
oC
2 (e_avg-std)
4 (e_avg+std)1 (e_avg)
3 (e_avg-std)
5 (e_avg+std)40
60
80
100
120
140
160
180
200
220
0 20 40 60 80Braking time, s
Ave
rage
tem
pera
ture
in c
onsi
dere
d ar
ea,
oC
2 (e_avg-std)
4 (e_avg+std)1 (e_avg)
3 (e_avg-std)5 (e_avg+std)
Fig. 15. Change in maximal temperature observed in AR01 area on the disk surface as a function of braking time; 1- disk emissivity ε = ε =0.49; 2, 3-points of measurement of maximal temperature in AR01 area and
approximation by a curve at emissivity ε = )(εε s−−−− =0.465; 4, 5- points of measurement of
maximal temperature in AR01 area and approximation by a curve at emissivity ε = )(εε s++++ =0.515, respectively
Fig. 16. Change in average temperature for AR01 area on the disk surface as a function of braking time; 1-
disk emissivity ε = ε =0.49; 2, 3- points of measurement of average temperature in AR01 area and approximation by a curve at emissivity ε = )(εε s−−−− =0.465; 4, 5- points of
measurement of average temperature in AR01 area and approximation by a curve at emissivity
ε = )(εε s++++ =0.515, respectively
5. Numerical analyses
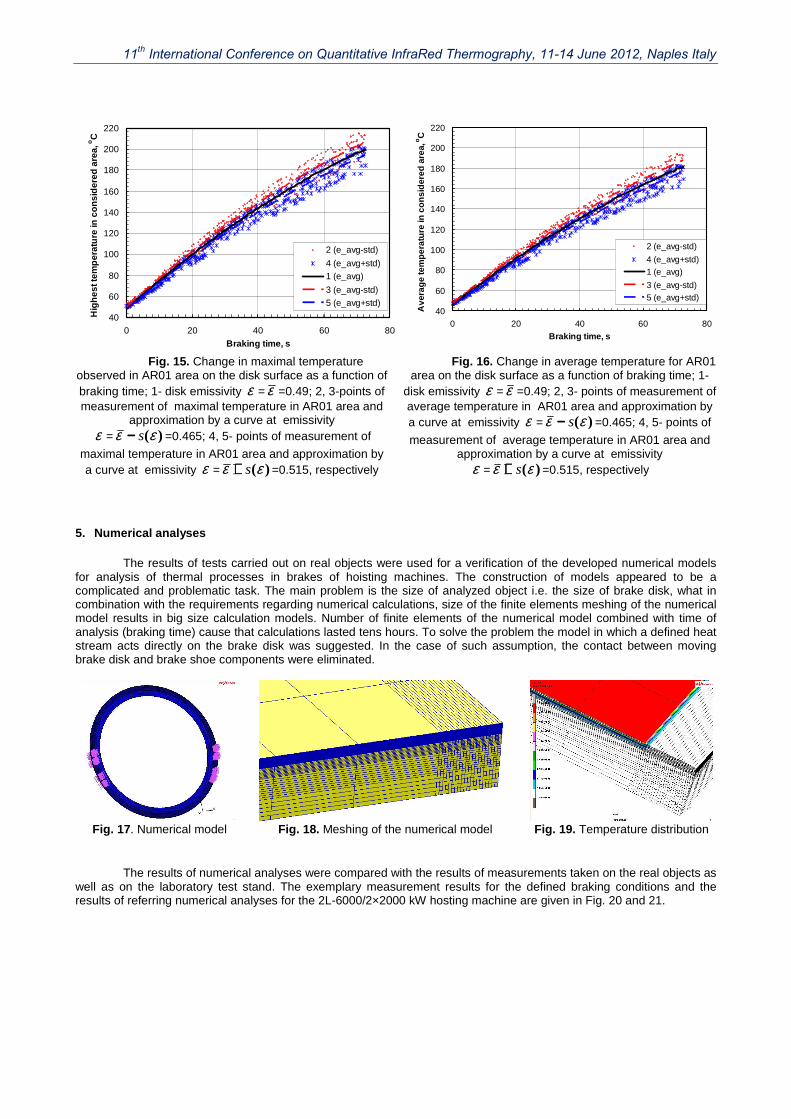
The results of tests carried out on real objects were used for a verification of the developed numerical models for analysis of thermal processes in brakes of hoisting machines. The construction of models appeared to be a complicated and problematic task. The main problem is the size of analyzed object i.e. the size of brake disk, what in combination with the requirements regarding numerical calculations, size of the finite elements meshing of the numerical model results in big size calculation models. Number of finite elements of the numerical model combined with time of analysis (braking time) cause that calculations lasted tens hours. To solve the problem the model in which a defined heat stream acts directly on the brake disk was suggested. In the case of such assumption, the contact between moving brake disk and brake shoe components were eliminated.
Fig. 17 . Numerical model Fig. 18. Meshing of the numerical model Fig. 19. Temperature distribution
The results of numerical analyses were compared with the results of measurements taken on the real objects as
well as on the laboratory test stand. The exemplary measurement results for the defined braking conditions and the results of referring numerical analyses for the 2L-6000/2×2000 kW hosting machine are given in Fig. 20 and 21.
11th International Conference on Quantitative InfraRed Thermography, 11-14 June 2012, Naples Italy
Fig. 20. Recording of disk brake surface
temperature by infrared camera in 5 tests of machine braking
Fig. 21. Results of numerical analysis; maximal temperature on the surface of disk segment
The results of thermal analyses are the input data for strength analysis of brake disk and of brake configuration as well as for optimization of its operational parameters. The results of the work will be used in designing of hoisting machines especially those machines of increased output and operational parameters.
6. Summary
The results from tests of friction brakes have been presented. The tests were carried out on the real objects and on the laboratory test stand. During tests temperature of brake disks surface and brake shoe (laboratory stand) were measured using infrared camera as well as brake operational parameters i.e. speed of brake disk movement, braking distance, brake shoe pressing force and other were also measured.
Coefficient of emissivity of the tested surface is the main factor which has an impact on thermovision measurements. During laboratory measurements it was found that after long-time continuous braking process emissivity of disk surfaces changes. That results from the change of disk surface structure and from deposition of particles from the brake shoe material. This phenomenon will occur in brakes of smaller dimensions if during the entire braking process there is repeated rotation of the brake disk. This information is important in the case of testing of small size brakes e.g. brakes in cars. The phenomenon does not occur in the case of big brakes installed in mine hoisting machines due to big diameter of disk (6÷7m) which makes only 2-3 revolutions during entire braking process.
Collected measurement results are useful for identification of thermal-and- mechanical phenomena during braking. They are also indispensable for verification of mathematical models used in numerical simulations of the phenomena, which occur during brake operation. Further it will enable better using of advanced numerical methods for thermal and strength calculations in designing of brakes of higher technical parameters.
REFERENCES
[1] Guide, “Guide to the Expression of Uncertainty in Measurement”, International Organization for Standarization (ISO), Geneva, 1995.
[2] Kruczek T., Białecki R.: “Examination of temperature distributions on brake discs of laboratory and real brakes and analysis of measurement results” (in Polish). Unpublished Report, Project No NR03 0006 06, Gliwice. 2011.
[3] Kruczek T.: “Determination of radiative ambient temperature during thermovision measurements in open air space”, (in Polish). Measurement, Automation and Monitoring, No 11, pp. 882-885, 2009.
[4] Minkina W., Dudzik S.: Infrared Thermography, Errors and Uncertainties. John Wiley & Sons, UK, 2009. [5] Kowal L., Turewicz A., Turewicz K.: Modelling of thermal phenomena during braking of hoisting machine with
disk brake (in Polish). Shaft Transportation. Monograph of the KOMAG Institute of Mining Technology, pp. 247-264, Gliwice, 2011.
[6] Kowal L., Turewicz K., Helmrich P, Nyga K., Kruczek T., Żołnierz M.: Testing of thermal resistance of brakes in hoisting machines – realized with the project: Operational safety of transportation machines used in the mining industry (in Polish). Monograph, scientific editors: Andrzej Tytko, Marian Wójcik, Centrum Badań i Dozoru Górnictwa Podziemnego sp. z o.o., pp. 155-161, Lędziny, 2011.
[7] Ścieszka S.F.: Friction brakes. Material, design and tribological problems (in Polish). Library of Operational Problems. Silesian University of Technology, pp. 193, Gliwice, 1998.
This work has been performed within the project No N R03 0006 06 supported financially by the Polish Ministry of Science and Higher Education, 2009-2012
11th International Conference on Quantitative InfraRed Thermography, 11-14 June 2012, Naples Italy