80
MEASURES OF CENTRAL TENDENCY 2/1/2015 1 MICHAEL KAKU MINLAH,ASSISTANT LECTURER, INSTITUTE OF PROFESSIONAL STUDIES

MEASURES OF CENTRAL TENDENCY
2/1/2015 1MICHAEL KAKU MINLAH,ASSISTANT
LECTURER, INSTITUTE OF PROFESSIONAL STUDIES

Chapter goals
• Compute and interpret the mean, median, and mode for a set grouped and ungrouped frequency distribution data.
• Compute the range, variance, and standard deviation and know what these values mean
• Compute and explain the coefficient of variation
2/1/2015MICHAEL KAKU MINLAH,ASSISTANT
LECTURER, INSTITUTE OF PROFESSIONAL STUDIES
2

Definition-measures of central
tendency
• Although frequency distributions may becomplex at times, it is often very useful to beable to summarize or describe the distributionwith a single numerical value.
• However, we need to take care to select avalue that is the most representative of theentire distribution, that is of all of theindividuals.
2/1/2015 3MICHAEL KAKU MINLAH,ASSISTANT
LECTURER, INSTITUTE OF PROFESSIONAL STUDIES
Definition-measures of central tendency
• Central tendency is a statistical measure thatidentifies a single score as representative of anentire distribution. The central tendency ofthe set of measurements-that is, the tendencyof the data to cluster, or center, about certainnumerical values.
2/1/2015 4MICHAEL KAKU MINLAH,ASSISTANT
LECTURER, INSTITUTE OF PROFESSIONAL STUDIES

Definition-measures of central
tendency
• The goal of central tendency is to find the single score that is most typical or most representative of the entire group.
• There are three main measures of centraltendency: the mean, median, and mode.
2/1/2015 5MICHAEL KAKU MINLAH,ASSISTANT
LECTURER, INSTITUTE OF PROFESSIONAL STUDIES
MEAN
• Mean of a raw data
• Mean of a single value frequency
• Mean of a grouped frequency distribution
2/1/2015 6MICHAEL KAKU MINLAH,ASSISTANT
LECTURER, INSTITUTE OF PROFESSIONAL STUDIES
Definition of mean
• The arithmetic mean, or simply the mean oraverage is the central tendency of a collection ofnumbers taken as the sum of the numbers dividedby the size of the collection.
• The arithmetic mean is a practical tool for comparing andmeasuring business data. It provides a way of assigningan average value to a set of numerical quantities. Thisaverage amount determines the midpoint of a data setalso known as Central Tendency
2/1/2015 7MICHAEL KAKU MINLAH,ASSISTANT
LECTURER, INSTITUTE OF PROFESSIONAL STUDIES

Definition of mean
• While the arithmetic mean is often used to report central tendencies, it is greatly influenced by outliers.
2/1/2015 8MICHAEL KAKU MINLAH,ASSISTANT
LECTURER, INSTITUTE OF PROFESSIONAL STUDIES

Formula for arithmetic mean
• The formula for the arithmetic mean for a raw data set is given by:
• For samples
• Where n is the sample size.
1
n
i
i
X
xn
2/1/2015 9MICHAEL KAKU MINLAH,ASSISTANT
LECTURER, INSTITUTE OF PROFESSIONAL STUDIES

formula
2/1/2015MICHAEL KAKU MINLAH,ASSISTANT
LECTURER, INSTITUTE OF PROFESSIONAL STUDIES
10

Example of arithmetic mean for samples
• The data represent the number of days off per year for a sample of individuals selected from nine different countries. Find the mean.
20, 26, 40, 36, 23, 42, 35, 24, 30
2/1/2015MICHAEL KAKU MINLAH,ASSISTANT
LECTURER, INSTITUTE OF PROFESSIONAL STUDIES
11

solution
2/1/2015MICHAEL KAKU MINLAH,ASSISTANT
LECTURER, INSTITUTE OF PROFESSIONAL STUDIES
12
Formula for arithmetic mean
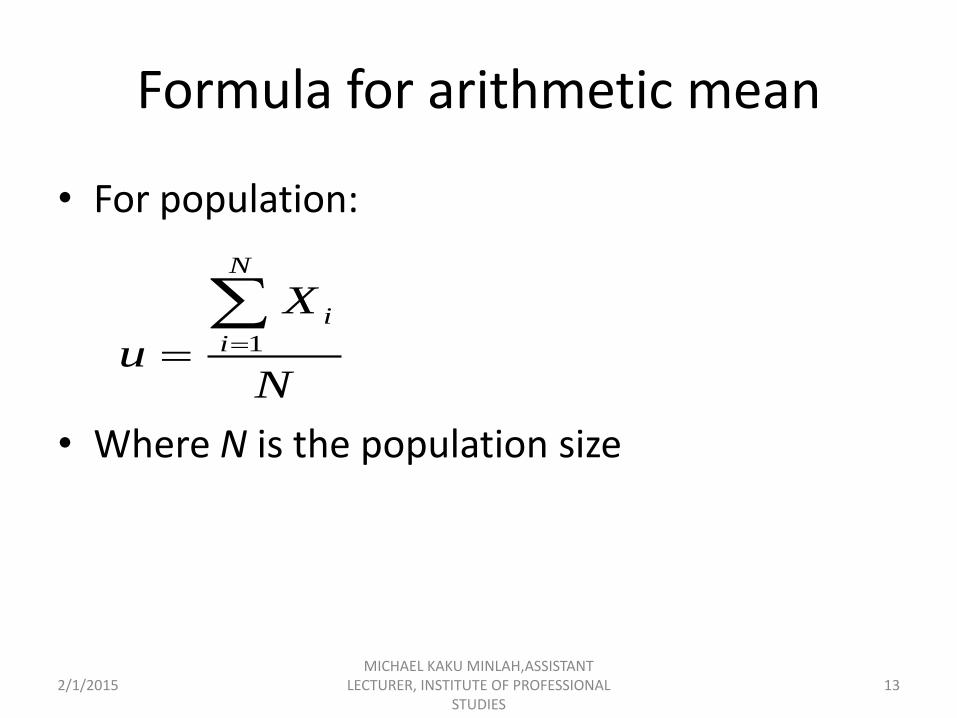
• For population:
• Where N is the population size
1
N
i
i
X
uN
2/1/2015 13MICHAEL KAKU MINLAH,ASSISTANT
LECTURER, INSTITUTE OF PROFESSIONAL STUDIES

Arithmetic mean of a single value frequency distribution
• Example of a single value frequency distribution is given by the table below.
Number of vehicles serviceable (x) Number of days(f)
0 2
1 5
2 11
3 4
4 4
5 1
2/1/2015 14MICHAEL KAKU MINLAH,ASSISTANT
LECTURER, INSTITUTE OF PROFESSIONAL STUDIES

Arithmetic mean of a single value frequency distribution
• The formula for arithmetic mean of single valued frequency distribution is given by:
1
1
*n
i i
i
n
i
f x
x
f
2/1/2015 15MICHAEL KAKU MINLAH,ASSISTANT
LECTURER, INSTITUTE OF PROFESSIONAL STUDIES

Calculation
2/1/2015 16MICHAEL KAKU MINLAH,ASSISTANT
LECTURER, INSTITUTE OF PROFESSIONAL STUDIES

calculation
• The mean number of cars serviceable is given by 60/27=2.22
2/1/2015 17MICHAEL KAKU MINLAH,ASSISTANT
LECTURER, INSTITUTE OF PROFESSIONAL STUDIES
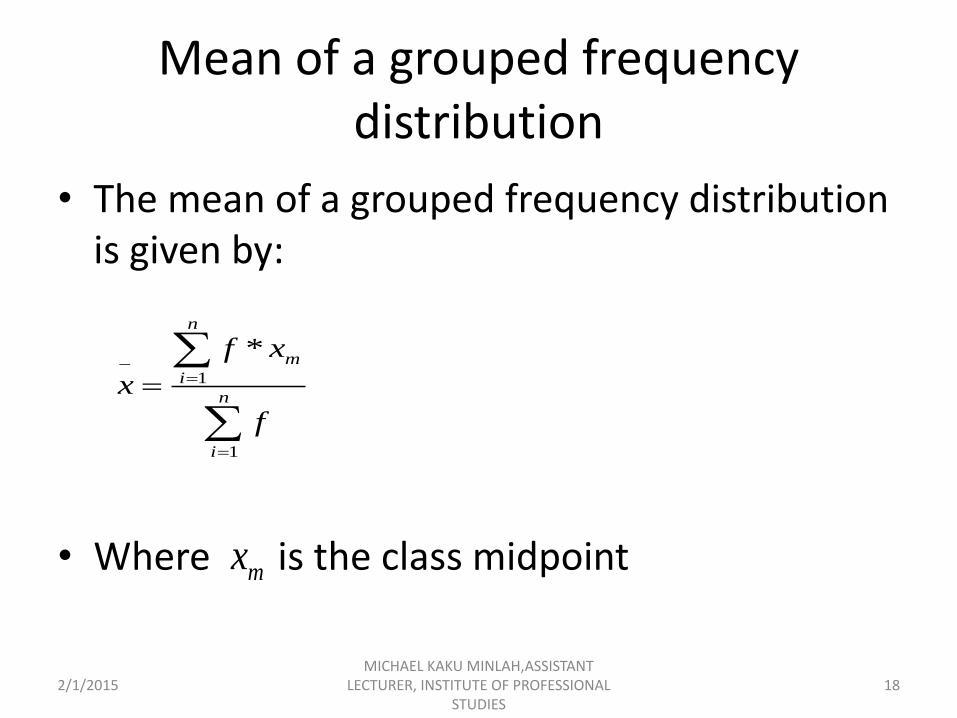
Mean of a grouped frequency distribution
• The mean of a grouped frequency distribution is given by:
• Where is the class midpoint
1
1
*n
m
i
n
i
f x
x
f
mx
2/1/2015 18MICHAEL KAKU MINLAH,ASSISTANT
LECTURER, INSTITUTE OF PROFESSIONAL STUDIES

example
• Consider an example
• The following data relates to the number of successful sales made by the salesmen employed by a large microcomputer firm in a particular quarter.
2/1/2015 19MICHAEL KAKU MINLAH,ASSISTANT
LECTURER, INSTITUTE OF PROFESSIONAL STUDIES

example
2/1/2015 20MICHAEL KAKU MINLAH,ASSISTANT
LECTURER, INSTITUTE OF PROFESSIONAL STUDIES

solution
2/1/2015 21MICHAEL KAKU MINLAH,ASSISTANT
LECTURER, INSTITUTE OF PROFESSIONAL STUDIES

interpretation
• The mean number of sales for that particular quarter is 15. 3125
2/1/2015MICHAEL KAKU MINLAH,ASSISTANT
LECTURER, INSTITUTE OF PROFESSIONAL STUDIES
22

Weighted mean
• The weighted mean is calculated as :
• Where the weights are denoted by
*
1
1
n
i i
i
n
i
i
w x
w
w
x
2/1/2015 23MICHAEL KAKU MINLAH,ASSISTANT
LECTURER, INSTITUTE OF PROFESSIONAL STUDIES
iw

formula
2/1/2015MICHAEL KAKU MINLAH,ASSISTANT
LECTURER, INSTITUTE OF PROFESSIONAL STUDIES
24

example
The costs of three models of helicopters are shown here. Find the weighted mean of the costs of the models.
2/1/2015MICHAEL KAKU MINLAH,ASSISTANT
LECTURER, INSTITUTE OF PROFESSIONAL STUDIES
25

example
2/1/2015MICHAEL KAKU MINLAH,ASSISTANT
LECTURER, INSTITUTE OF PROFESSIONAL STUDIES
26

solution
2/1/2015MICHAEL KAKU MINLAH,ASSISTANT
LECTURER, INSTITUTE OF PROFESSIONAL STUDIES
27
9($427,000) 6($365,000) 12($725,000)$545,666.67
27x

Geometric mean
• It is mostly used in finding the averages of percentages, ratios, indexes or growth rates .
• It is given by the formula:
1 2 3 4
1 2 3 4
( * * * *........* )
1(log log log log ........ log )
Nn
n
GM X X X X X
X X X X Xn
2/1/2015 28MICHAEL KAKU MINLAH,ASSISTANT
LECTURER, INSTITUTE OF PROFESSIONAL STUDIES

example
• The profits earned by IPS company limited on four recent projects were 3%,2%, 4% and 6%. What is the geometric mean?
• The answer is given as: 4 (3*2*4*6)
1(log3 log 4 log 2 log 6)
4
3.46%
GM
2/1/2015 29
MICHAEL KAKU MINLAH,ASSISTANT LECTURER, INSTITUTE OF PROFESSIONAL STUDIES

median
• This refers to the midpoint of the data after the data has been ordered (preferably from lowest to highest).
• For a set of n observations arranged in order of magnitude, there are two cases:
– If n is odd, then the median is given by the
Observation.
1( 1)
2n th
2/1/2015 30MICHAEL KAKU MINLAH,ASSISTANT
LECTURER, INSTITUTE OF PROFESSIONAL STUDIES

median
• If on the other hand, n is even then the median is given by the mean of the
1 1 11 _
2 2 2n n th observation
2/1/2015 31MICHAEL KAKU MINLAH,ASSISTANT
LECTURER, INSTITUTE OF PROFESSIONAL STUDIES
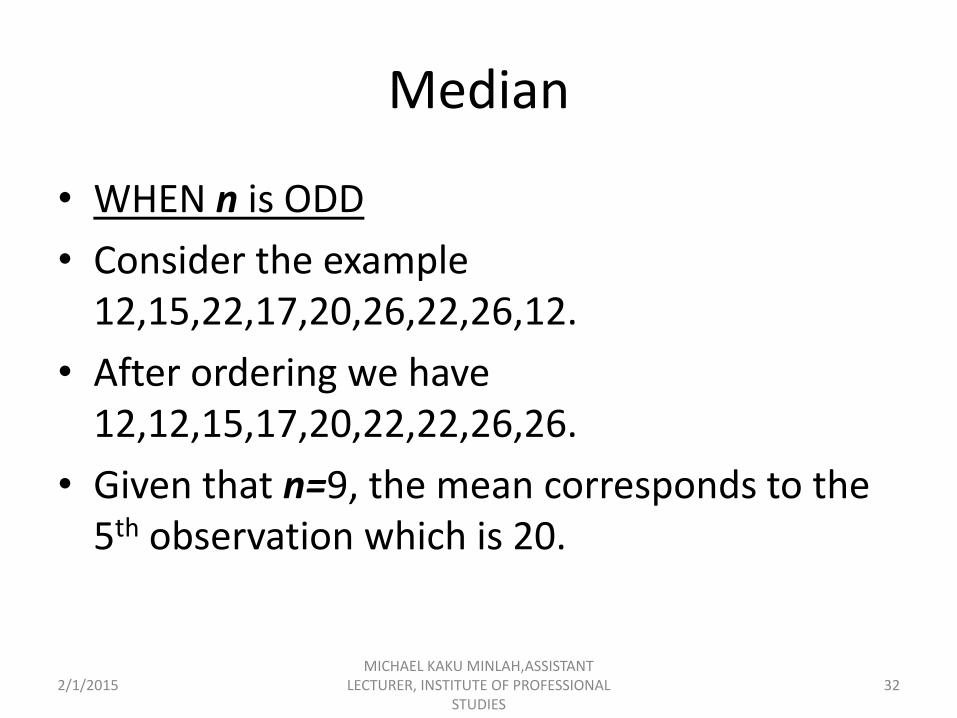
Median
• WHEN n is ODD
• Consider the example 12,15,22,17,20,26,22,26,12.
• After ordering we have 12,12,15,17,20,22,22,26,26.
• Given that n=9, the mean corresponds to the 5th observation which is 20.
2/1/2015 32MICHAEL KAKU MINLAH,ASSISTANT
LECTURER, INSTITUTE OF PROFESSIONAL STUDIES

Median
• WHEN n is EVEN
• Consider the example. Given the data:
• 4,7,9,10,5,1,3,4,12,10
• Arranging in order of magnitude gives:
• 1,3,4,4,5,7,9,10,10,12
• The , which is the 5th observation corresponds to 5 and the observation corresponds to 7. The median is therefore 6.
1
2nth
11
2n
2/1/2015 33MICHAEL KAKU MINLAH,ASSISTANT
LECTURER, INSTITUTE OF PROFESSIONAL STUDIES

Median of a single value frequency distribution
2/1/2015 34MICHAEL KAKU MINLAH,ASSISTANT
LECTURER, INSTITUTE OF PROFESSIONAL STUDIES

solution
• Since n is even the median will lie between the and the observation. The
Observation, from the cumulative frequency corresponds to 5 and the observation corresponds to 6. the median is therefore the average of 5 and 6 which is 5.5
1
2nth
11
2n
1
2nth
11
2n
2/1/2015 35MICHAEL KAKU MINLAH,ASSISTANT
LECTURER, INSTITUTE OF PROFESSIONAL STUDIES

Median of a grouped frequency distribution
• Steps to follow;
• 1. find the median class. This is the class which corresponds to the observation.
• 2. after finding the median class, apply the formula for the median which is given by:
1
2nth
2c
m
nF
median L cf
2/1/2015 36MICHAEL KAKU MINLAH,ASSISTANT
LECTURER, INSTITUTE OF PROFESSIONAL STUDIES

Median of a grouped frequency distribution
• Where is the lower class limit of the median class. n is the sample size. F is the cumulative frequency of the class before the median class. is the frequency of the median class and c is the class width of the median class.
cL
mf
2/1/2015 37MICHAEL KAKU MINLAH,ASSISTANT
LECTURER, INSTITUTE OF PROFESSIONAL STUDIES

example
2/1/2015 38MICHAEL KAKU MINLAH,ASSISTANT
LECTURER, INSTITUTE OF PROFESSIONAL STUDIES
solution
2/1/2015 39MICHAEL KAKU MINLAH,ASSISTANT
LECTURER, INSTITUTE OF PROFESSIONAL STUDIES

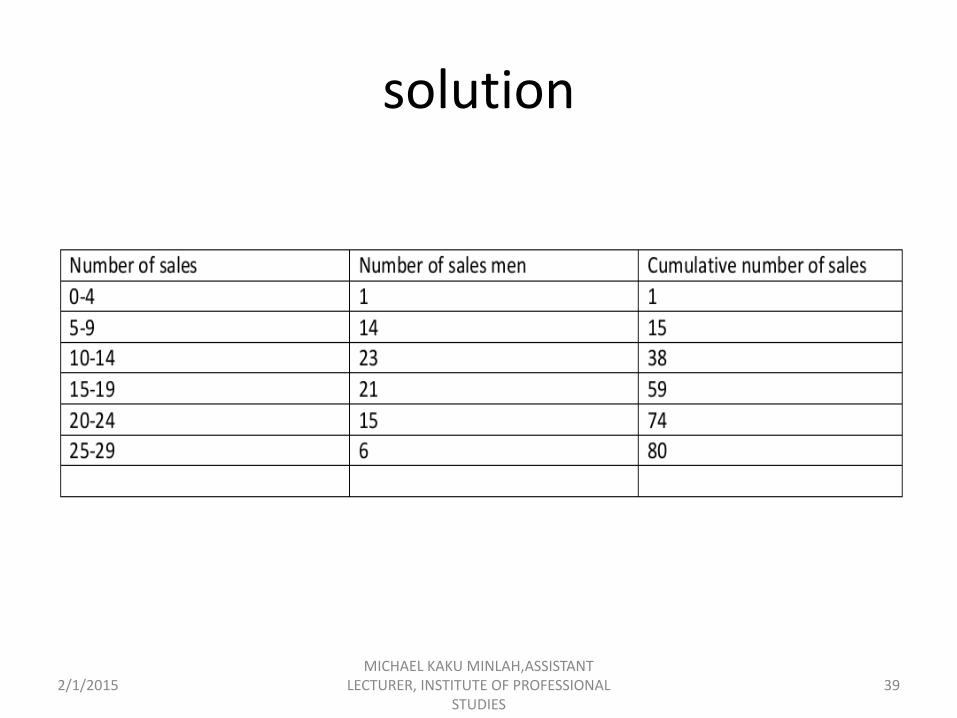
solution
• The median class corresponds to n/2, which is given by 80/2=40. checking the cumulative frequency we observe that the median class corresponds to {15-19}. F=38. is 21. c=5.
is 14.5. the median is therefore :mf cL
2/1/2015 40MICHAEL KAKU MINLAH,ASSISTANT
LECTURER, INSTITUTE OF PROFESSIONAL STUDIES
40 3814.5 5 14.9762
21cl

mode
• A measure of central tendency
• Value that occurs most often
• Not affected by extreme values (outliers)
• Used for either numerical or categorical data
• There may be no mode
• There may be several modes( uni-modal, bi-modal or multi-modal)
2/1/2015 41MICHAEL KAKU MINLAH,ASSISTANT
LECTURER, INSTITUTE OF PROFESSIONAL STUDIES
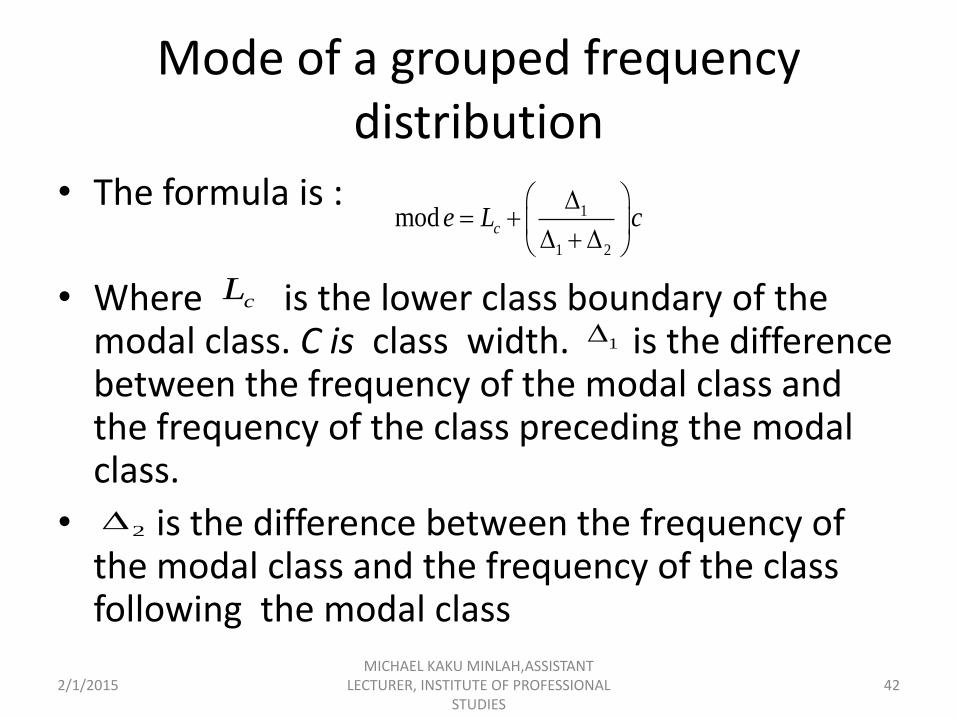
Mode of a grouped frequency distribution
• The formula is :
• Where is the lower class boundary of the modal class. C is class width. is the difference between the frequency of the modal class and the frequency of the class preceding the modal class.
• is the difference between the frequency of the modal class and the frequency of the class following the modal class
1
1 2
mod ce L c
cL
1
2
2/1/2015 42MICHAEL KAKU MINLAH,ASSISTANT
LECTURER, INSTITUTE OF PROFESSIONAL STUDIES
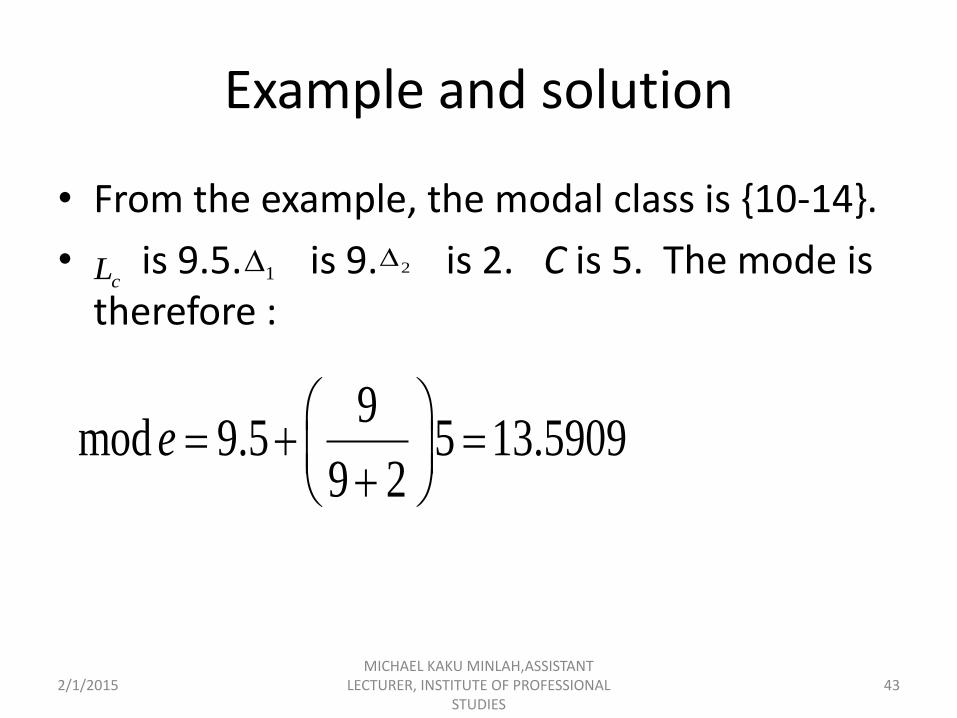
Example and solution
• From the example, the modal class is {10-14}.
• is 9.5. is 9. is 2. C is 5. The mode is therefore :
cL 1 2
2/1/2015 43MICHAEL KAKU MINLAH,ASSISTANT
LECTURER, INSTITUTE OF PROFESSIONAL STUDIES
9mod 9.5 5 13.5909
9 2e

Shape of distribution
• Describes how data is distributed
• Is the data Symmetric or skewed?
• Histogram gives an idea about the shape of distribution
• What is the relation between mean, mode and median for symmetrical and skewed data
• For symmetric distributions the mean divides the distribution into two equal halves
2/1/2015MICHAEL KAKU MINLAH,ASSISTANT
LECTURER, INSTITUTE OF PROFESSIONAL STUDIES
44

Normal distribution
2/1/2015MICHAEL KAKU MINLAH,ASSISTANT
LECTURER, INSTITUTE OF PROFESSIONAL STUDIES
45

Right- skewed data
• The tail of the distribution is to the right
• More data occurs to the left
• Mode <median<mean
2/1/2015MICHAEL KAKU MINLAH,ASSISTANT
LECTURER, INSTITUTE OF PROFESSIONAL STUDIES
46

Right- skewed distribution
2/1/2015MICHAEL KAKU MINLAH,ASSISTANT
LECTURER, INSTITUTE OF PROFESSIONAL STUDIES
47

Left-skewed distribution
• The tail of the distribution is to the left
• More data occurs to the right
• mean<median< Mode
2/1/2015MICHAEL KAKU MINLAH,ASSISTANT
LECTURER, INSTITUTE OF PROFESSIONAL STUDIES
48

Left –skewed distribution
2/1/2015MICHAEL KAKU MINLAH,ASSISTANT
LECTURER, INSTITUTE OF PROFESSIONAL STUDIES
49

Measures of dispersion
• Measures the amount of dispersion in a given data set. It gives degree to which numerical data tend to spread about an average value. Examples include:
• Range
• Mean deviation
• Variance
• Coefficient of variation
2/1/2015 50MICHAEL KAKU MINLAH,ASSISTANT
LECTURER, INSTITUTE OF PROFESSIONAL STUDIES

range
• It is defines as the difference between the highest and the lowest value in the data set.
2/1/2015 51MICHAEL KAKU MINLAH,ASSISTANT
LECTURER, INSTITUTE OF PROFESSIONAL STUDIES
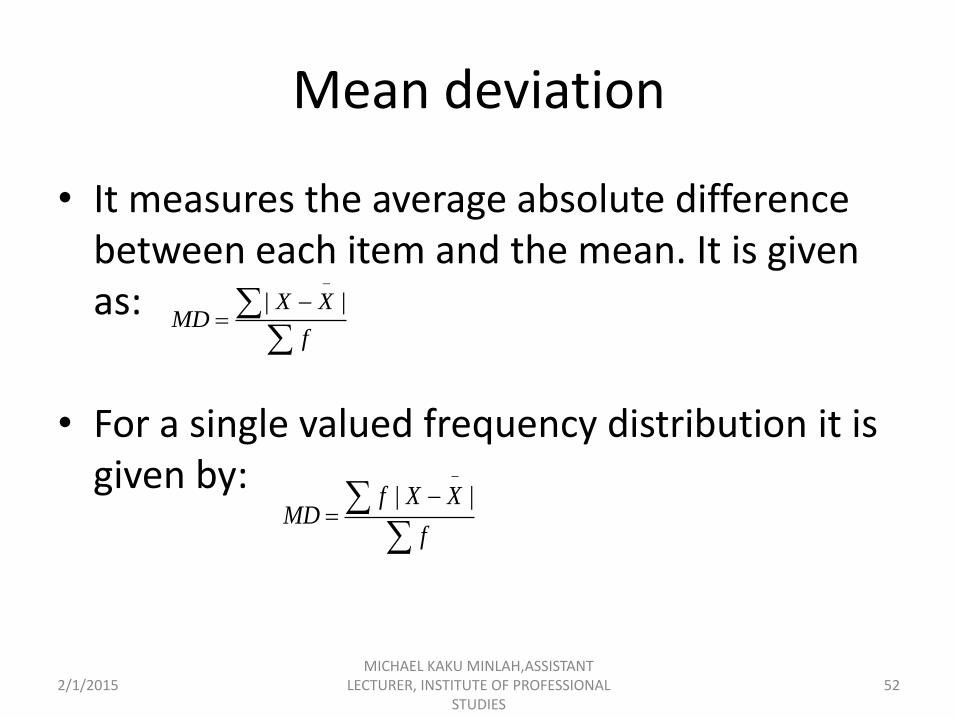
Mean deviation
• It measures the average absolute difference between each item and the mean. It is given as:
• For a single valued frequency distribution it is given by:
| |X XMD
f
| |f X XMD
f
2/1/2015 52MICHAEL KAKU MINLAH,ASSISTANT
LECTURER, INSTITUTE OF PROFESSIONAL STUDIES
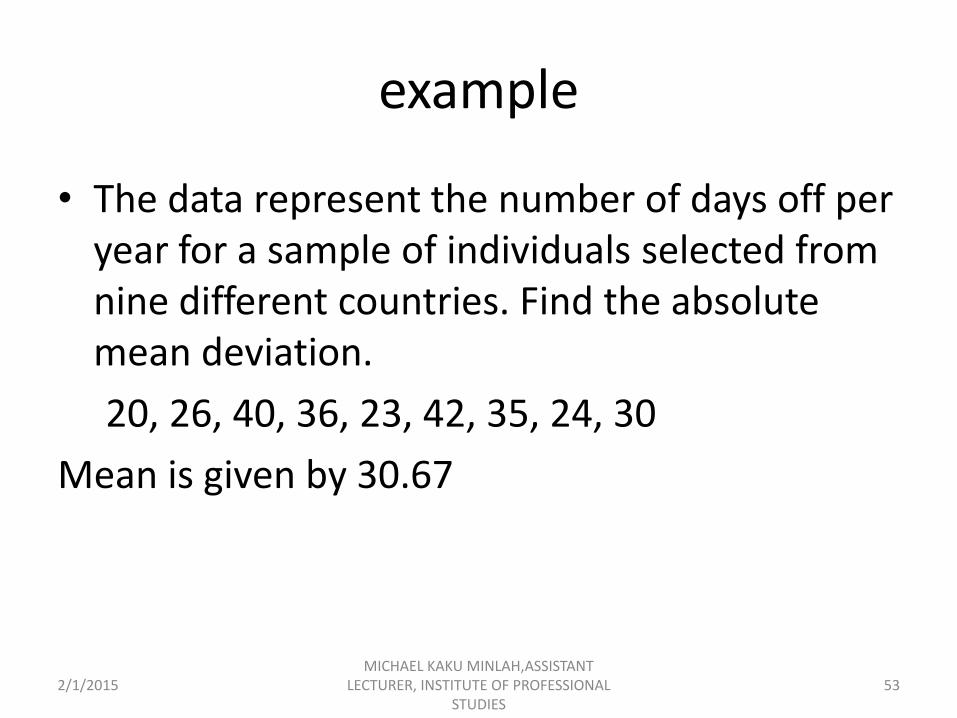
example
• The data represent the number of days off per year for a sample of individuals selected from nine different countries. Find the absolute mean deviation.
20, 26, 40, 36, 23, 42, 35, 24, 30
Mean is given by 30.67
2/1/2015MICHAEL KAKU MINLAH,ASSISTANT
LECTURER, INSTITUTE OF PROFESSIONAL STUDIES
53

solution
2/1/2015MICHAEL KAKU MINLAH,ASSISTANT
LECTURER, INSTITUTE OF PROFESSIONAL STUDIES
54

Mean deviation for grouped frequency distribution
• Formula: | |mf X X
MDf
2/1/2015 55MICHAEL KAKU MINLAH,ASSISTANT
LECTURER, INSTITUTE OF PROFESSIONAL STUDIES

variance
• Measures how spread out the data are around the mean. A high value depicts high variability whereas low value depicts low variability.
• We can calculate variance for both population and sample.
• Population variance is given by:
•
or 2
2 1
( )N
i
i
X u
N
2
2 1
2 1
( )N
iNi
i
i
X
XN
N
2/1/2015 56MICHAEL KAKU MINLAH,ASSISTANT
LECTURER, INSTITUTE OF PROFESSIONAL STUDIES

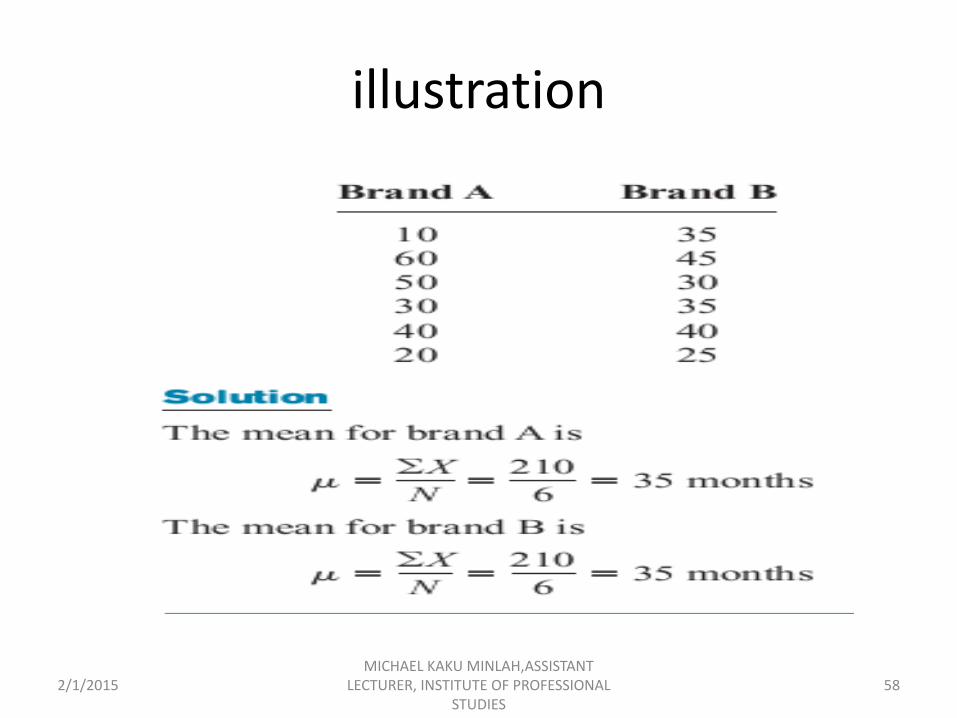
illustration
• A testing lab wishes to test two experimental brands of outdoor paint to see how long each will last before fading. The testing lab makes 6 gallons of each paint to test. Since different chemical agents are added to each group and only six cans are involved, these two groups constitute two small populations. The results (in months) are shown. Find the mean of each group.
2/1/2015MICHAEL KAKU MINLAH,ASSISTANT
LECTURER, INSTITUTE OF PROFESSIONAL STUDIES
57
illustration
2/1/2015MICHAEL KAKU MINLAH,ASSISTANT
LECTURER, INSTITUTE OF PROFESSIONAL STUDIES
58
illustration
• Since both populations have the same mean, how can we determine which is more variable?
• We thus employ the concept of variation
2/1/2015MICHAEL KAKU MINLAH,ASSISTANT
LECTURER, INSTITUTE OF PROFESSIONAL STUDIES
59

Graphical depiction of variation: Same mean, different variance
2/1/2015MICHAEL KAKU MINLAH,ASSISTANT
LECTURER, INSTITUTE OF PROFESSIONAL STUDIES
60

Example-calculation of population variance
• Find the sample variance and standard deviation for the amount of European auto sales for a sample of 6 years shown. The data are in millions of dollars.
11.2, 11.9, 12.0, 12.8, 13.4, 14.3
2/1/2015MICHAEL KAKU MINLAH,ASSISTANT
LECTURER, INSTITUTE OF PROFESSIONAL STUDIES
61

SOLUTION
2/1/2015MICHAEL KAKU MINLAH,ASSISTANT
LECTURER, INSTITUTE OF PROFESSIONAL STUDIES
62

Population variances for a simple frequency distribution
Or
2
2 1
2 1
( )N
i iNi
i i
i
f X
f XN
N
2
2 1
( )N
i i
i
f X U
N
2/1/2015 63MICHAEL KAKU MINLAH,ASSISTANT
LECTURER, INSTITUTE OF PROFESSIONAL STUDIES

example
2/1/2015MICHAEL KAKU MINLAH,ASSISTANT
LECTURER, INSTITUTE OF PROFESSIONAL STUDIES
64
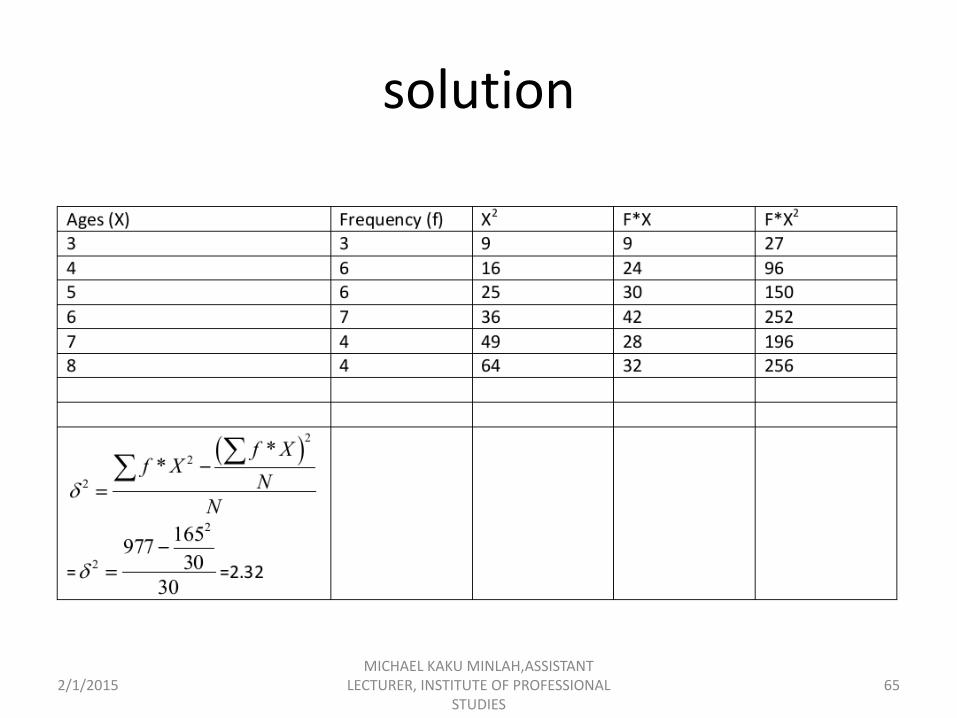
solution
2/1/2015MICHAEL KAKU MINLAH,ASSISTANT
LECTURER, INSTITUTE OF PROFESSIONAL STUDIES
65

Population variances for a grouped frequency distribution
or
2
2 1
( )N
i mi
i
f X U
N
2
2 1
12
N
i miNi
i mi
i
f X
f Xf
N
2/1/2015 66MICHAEL KAKU MINLAH,ASSISTANT
LECTURER, INSTITUTE OF PROFESSIONAL STUDIES

example
2/1/2015MICHAEL KAKU MINLAH,ASSISTANT
LECTURER, INSTITUTE OF PROFESSIONAL STUDIES
67

solution
2/1/2015MICHAEL KAKU MINLAH,ASSISTANT
LECTURER, INSTITUTE OF PROFESSIONAL STUDIES
68

Sample variance
• or
• Sample variance for single value frequency distribution is given as:
• or
2
2 1
( )
1
n
i
i
X X
sn
2
2 1
( )
1
n
i i
i
f X X
sn
2
2 1
2 1
1
n
ni
i
i
X
Xn
sn
2
2 1
2 1
1
n
ini
i i
i
f X
f Xn
sn
2/1/2015 69MICHAEL KAKU MINLAH,ASSISTANT
LECTURER, INSTITUTE OF PROFESSIONAL STUDIES

Sample variance for raw data
2/1/2015MICHAEL KAKU MINLAH,ASSISTANT
LECTURER, INSTITUTE OF PROFESSIONAL STUDIES
70

Sample variance for simple frequency distribution
2/1/2015MICHAEL KAKU MINLAH,ASSISTANT
LECTURER, INSTITUTE OF PROFESSIONAL STUDIES
71

Sample variance for a grouped frequency distribution
• or 2
2 1
2 1
1
n
i mini
i mi
i
f X
f Xn
sn
2/1/2015 72MICHAEL KAKU MINLAH,ASSISTANT
LECTURER, INSTITUTE OF PROFESSIONAL STUDIES
2
2 1
( )
1
n
i mi
i
f X X
sn

Sample variance for grouped data
2/1/2015MICHAEL KAKU MINLAH,ASSISTANT
LECTURER, INSTITUTE OF PROFESSIONAL STUDIES
73

Comparing distributions
• When distributions have the same mean, the distribution with the larger variance is more variable
• What if the distributions have different means?
– We employ the co efficient of variation
2/1/2015MICHAEL KAKU MINLAH,ASSISTANT
LECTURER, INSTITUTE OF PROFESSIONAL STUDIES
74

Coefficient of Variation
• Measures relative variation
• Always in percentage (%)
• Shows variation relative to mean
• Is used to compare two or more sets of data
measured in different units
2/1/2015MICHAEL KAKU MINLAH,ASSISTANT
LECTURER, INSTITUTE OF PROFESSIONAL STUDIES
75

Co efficient of variation
• For population
• For samples
*100CVu
*100s
CV
x
2/1/2015 76MICHAEL KAKU MINLAH,ASSISTANT
LECTURER, INSTITUTE OF PROFESSIONAL STUDIES
example
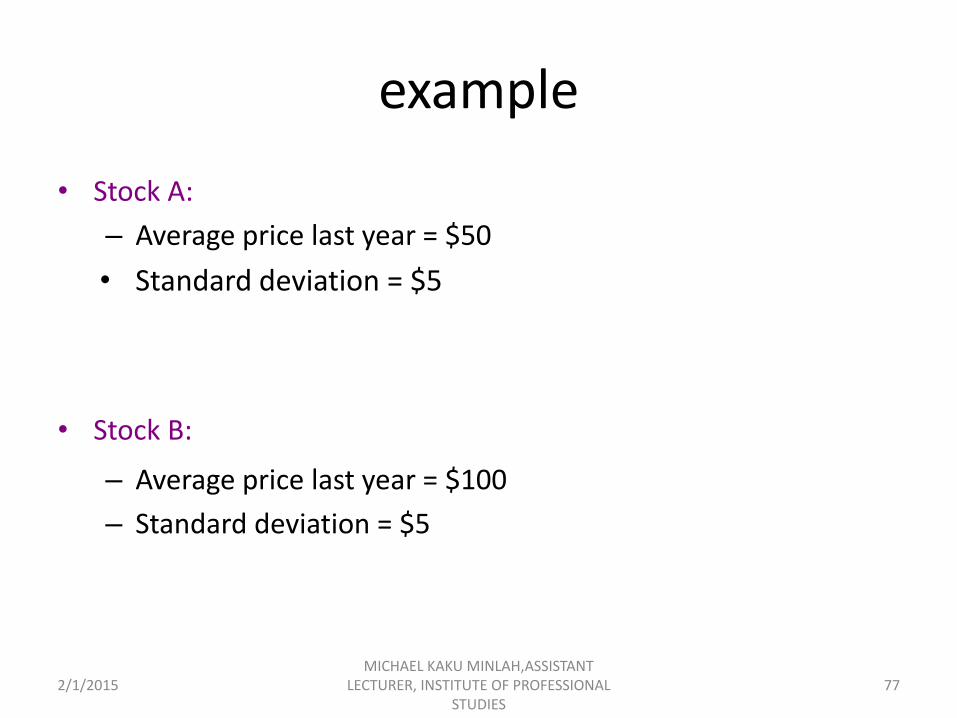
• Stock A:
– Average price last year = $50
• Standard deviation = $5
• Stock B:
– Average price last year = $100
– Standard deviation = $5
2/1/2015 77MICHAEL KAKU MINLAH,ASSISTANT
LECTURER, INSTITUTE OF PROFESSIONAL STUDIES

solution
2/1/2015 78MICHAEL KAKU MINLAH,ASSISTANT
LECTURER, INSTITUTE OF PROFESSIONAL STUDIES
$5*100 *100 10%
$50A
SCV
X
$5*100 *100 5%
$100B
SCV
X

example
• The mean of the number of sales of cars over a 3-month period is 87, and the standard deviation is 5. The mean of the commissions is $5225, and the standard deviation is $773. Compare the variations of the two.
• The co efficient of variation is given by:
2/1/2015MICHAEL KAKU MINLAH,ASSISTANT
LECTURER, INSTITUTE OF PROFESSIONAL STUDIES
79
*100s
CV
x

solution
• Sales:
• Commission:
2/1/2015MICHAEL KAKU MINLAH,ASSISTANT
LECTURER, INSTITUTE OF PROFESSIONAL STUDIES
80
5*100 5.75%
87salesCV
773*100 14.79%
5225commissionCV


