Contemporary Educational Psychology 27, 51–79 (2002) doi:10.1006/ceps.2001.1091, available online at http://www.idealibrary.com on Measures of Children’s Knowledge and Regulation of Cognition Rayne A. Sperling The Pennsylvania State University Bruce C. Howard NASA Classroom of the Future, Wheeling Jesuit University Lee Ann Miller West Virginia University and Cheryl Murphy University of Arkansas Published online October 2, 2001 Two studies were conducted to investigate measures of children’s metacognition. Experiment 1 presented two versions of a self-report inventory, the Jr. MAI, appro- priate for assessing metacognition in children in grades 3–9. Factor analyses are interpreted that illustrate how the items measure components of metacognition. Ex- periment 2 further addressed properties of the two versions and compared the instru- ment to other inventories, teacher ratings of children’s metacognition, and student achievement scores. Findings indicated high correlations between the Jr. MAI and an existing metacognitive problem-solving inventory (Fortunato, Hecht, Tittle, & Alvarez, 1991). Moderate correlations between the Jr. MAI and other self-report instruments of metacognition while reading (Jacobs & Paris, 1987; Schmitt, 1990) and low correlations between the Jr. MAI and teacher ratings of metacognition and Data presented in this article were collected while the first author was a faculty member at West Virginia University. Portions of data from Experiment 1 were presented at the annual meeting of the American Educational Research Association, 1996. Portions of data from Ex- periment 2 were presented at the annual meeting of the American Educational Research Asso- ciation, 1998. Address correspondence and reprint requests to Rayne Sperling, 201 CEDAR Building, The Pennsylvania State University, University Park, PA 16801. E-mail: [email protected]. 51 0361-476X/01 $35.00 2001 Elsevier Science (USA) All rights reserved.
doi:10.1006/ceps.2001.1091, available online at http://www.idealibrary.com on
Measures of Children’s Knowledge and Regulationof Cognition
Rayne A. Sperling
The Pennsylvania State University
Bruce C. Howard
NASA Classroom of the Future, Wheeling Jesuit University
Lee Ann Miller
West Virginia University
and
Cheryl Murphy
University of Arkansas
Published online October 2, 2001
Two studies were conducted to investigate measures of children’s metacognition.Experiment 1 presented two versions of a self-report inventory, the Jr. MAI, appro-priate for assessing metacognition in children in grades 3–9. Factor analyses areinterpreted that illustrate how the items measure components of metacognition. Ex-periment 2 further addressed properties of the two versions and compared the instru-ment to other inventories, teacher ratings of children’s metacognition, and studentachievement scores. Findings indicated high correlations between the Jr. MAI andan existing metacognitive problem-solving inventory (Fortunato, Hecht, Tittle, &Alvarez, 1991). Moderate correlations between the Jr. MAI and other self-reportinstruments of metacognition while reading (Jacobs & Paris, 1987; Schmitt, 1990)and low correlations between the Jr. MAI and teacher ratings of metacognition and
Data presented in this article were collected while the first author was a faculty memberat West Virginia University. Portions of data from Experiment 1 were presented at the annualmeeting of the American Educational Research Association, 1996. Portions of data from Ex-periment 2 were presented at the annual meeting of the American Educational Research Asso-ciation, 1998.
Address correspondence and reprint requests to Rayne Sperling, 201 CEDAR Building, ThePennsylvania State University, University Park, PA 16801. E-mail: [email protected].
510361-476X/01 $35.00
2001 Elsevier Science (USA)All rights reserved.
52 SPERLING ET AL.
overall achievement scores were also found. Gender and grade level differences inmetacognition are presented and discussed. The instruments are appended. 2001
Elsevier Science (USA)
One goal of education is to promote and develop self-regulated learners.Both practitioners and researchers are interested in the extent and develop-ment of self-regulatory abilities, such as metacognitive knowledge and regu-lation, in school-age learners. There is a current need for measures of meta-cognition as well as measures of other self-regulatory constructs (Winne &Perry, 2000). There are two main reasons for this need. First, many teachers,administrators, and researchers are interested in facilitating self-regulatedlearning and therefore need to assess the effects of learning strategy interven-tions on learners’ metacognitive processing and strategy use. For example,when planning and testing various interventions, clear information about thestatus of metacognitive skills in learners could facilitate effective targetingof metacognitive and other self-regulatory weaknesses. If such weaknesseswere related to reading comprehension, for instance, instruction could befocused to develop more effective planning and monitoring skills (Cross &Paris, 1988; Manning, Glasner, & Smith, 1996; Paris, Cross, & Lipson, 1987;Schraw & Dennison, 1994). Effectively identifying metacognitive and self-regulatory skills is crucial to the appropriate design of subsequent interven-tions.
Second, there is a need to further understand the components of self-regu-lated learning. Currently relatively little is known about the relationshipsamong constructs comprising self-regulation, such as strategy use, metacog-nition, and motivation (Brownlee, Leventhal, & Leventhal, 2000; DeCorte,Verschaffel, & Op ’t Eynde, 2000; Weinstein, Husman, & Dierking, 2000).Understanding of the interrelationships among self-regulatory constructs,through effective measurement, can facilitate needed further theory devel-opment and testing (Winne & Perry, 2000). The current work addressesthese two needs by examining measures of metacognition in learners ingrades 3–9.
Several methods of measuring metacognition and self-regulation havebeen implemented both for research and practice with children. Some haverelied on standardized achievement scores. Achievement scores are some-times used as dependent measures in intervention studies with special andgeneral education children (see as one example, Feitler & Hellekson, 1993).It is important in school-based settings to determine if interventions mayimpact standardized test scores. Standardized achievement scores, however,can be problematic when used as measures of self-regulatory constructs suchas strategy use, motivation, and metacognition, since research indicates thatthe relationship between standardized achievement scores and metacognitionis not direct. Metacognitive training programs, for example, have been shownto be effective for teaching reading and problem-solving strategies regardless
MEASURING CHILDREN’S METACOGNITION 53
of learning aptitude or achievement (Delclos & Harrington, 1991; Jacobs &Paris, 1987; Palincsar & Brown, 1984). Also, Swanson (1990) indicated thatmetacognitive knowledge and intellectual aptitude were unrelated and thatmetacognitive skills helped children of lower aptitude compensate onproblem-solving tasks. Similarly, Pintrich, Smith, Garcia, and McKeachie(1991) indicated that metacognition and strategy use were not highly corre-lated with academic achievement. In addition, Pressley and Ghatala (1989)also found metacognition to be unrelated to verbal ability and further indi-cated that achievement and ability measures are not a good proxy for meta-cognitive skills. Additional research also illustrates a lack of significant cor-relation between aptitude measures and metacognition. For example, Allonand others (Allon, Gutkin, & Bruning, 1999) found no relationship betweenmetacognition and IQ in a ninth-grade sample. Therefore, based on severalstudies, the relationship between achievement or aptitude and metacognitiveconstructs is unclear.
One would hypothesize that metacognitive knowledge and regulationwould facilitate learning and have an effect on academic achievement; how-ever, as illustrated, research findings do not always support that hypothesis.As such, the use of achievement measures as indications of metacognitiveknowledge or other self-regulatory constructs is unwarranted.
Measures that directly assess metacognition and broader self-regulatoryconstructs have also been used. H. Lee Swanson (1990), for example, usedan interview technique with learners in the intermediate grades to assessmetacognition. Similarly, Zimmerman (Zimmerman & Martinez-Pons, 1986,1988) employed a structured interview technique to measure self-regulation.Others have employed monitoring checklists (e.g., Manning, 1996) to pro-mote and measure metacognition. Newman (1984a, 1984b; Newman &Wick, 1987), Pressley and colleagues (Pressley & Ghatala, 1989; Pressley,Levin, Ghatala, & Amhad, 1987), and more recently Tobias and colleagues(e.g., Tobias, Everson, & Laitusis, 1999) have used calibration techniquesto assess learners’ metacognitive regulation. Teacher ratings have also beenemployed to measure metacognitive and self-regulatory processes. Zimmer-man and Martinez-Pons (1988) found teacher ratings of self-regulation tobe slightly correlated with student ratings of their own self-regulation andmoderately related with achievement measures. Although Zimmerman andMartinez-Pons used teacher ratings as measures of self-regulation, othershave employed teacher ratings as measures of metacognition alone (Tobias,Everson, & Laitusis, 1999). Additionally, inventories have also been usedto measure metacognitive processes in school-age learners (e.g., Fortunatoet al., 1991; Jacobs & Paris, 1987; Pereira-Laird & Deane, 1997; Schmitt,1990).
Each of the methods of measurement has advantages and disadvantages.The main reason for many disadvantages is that it is difficult to capture meta-
54 SPERLING ET AL.
cognitive processing via direct observation. Achievement scores are particu-larly limited as a measure, as noted, because gains in content knowledge andabilities may or may not reflect changes in metacognition, strategic knowl-edge, or other regulatory constructs. Interviews and other rich data sources,such as journals and open-ended responses, are problematic because of therelatively lengthy time to administer and time-consuming process of dataanalysis. Sometimes these data are reduced to a relatively small numericalscale, which may decrease the benefits of such rich measures (e.g., Craig &Yore, 1995). Think-aloud protocol measures are often similarly cumbersomein administration and scoring. The strengths and weaknesses of such proto-cols were addressed in reviews both by Nisbett and Wilson (1977) and Erics-son and Simon (1980, 1993). Pressley and Afflerbach’s (1995) critique ofEricsson and Simon’s work and their own contributions provide suggestionsfor effective use of protocols and their subsequent analyses. Difficulties re-main, however, and at times learners’ level of strategies and skills may pre-clude them from also thinking aloud while engaging in learning and monitor-ing tasks (Cavanaugh & Perlmutter, 1982; Pressley & Afflerbach, 1995).
Monitoring checklists, where learners check off target activities during orafter a learning task, provide a systematic means to assess both metacognitiveclassroom academic learning and self-regulation of behavior in interventions(Manning, 1984, 1991; Reid & Harris, 1993). Calibration techniques, wherelearners make a judgment of their learning or of their performance that isthen compared to their actual performance, also have served as a measureof metacognitive processing across age and ability levels (Pressley & Gha-tala, 1989; Pressley, Levin, Ghatala, & Amhad, 1987; Schraw & Roedel,1994). In calibration measures, the difference between the rating and actualperformance is calculated as either a bias or accuracy measure. The magni-tude of this difference is taken as a measure of a learner’s ability to monitorand evaluate her learning. The benefits of the calibration technique are thatcalibrations may be less subjective but are also easily administered andscored. Although often used, one concern with calibration techniques is theirclose similarity to self-efficacy ratings. Pajares (1996) provided discussionof measures of self-efficacy that are very similar to calibration assessments. Itmay be that calibration techniques capture self-efficacy or other motivationalconstructs rather than metacognition. Winne and Perry (2000) further addressthe limitations of various approaches to measurement of metacognition andother self-regulatory constructs.
Self-report inventories as measures of metacognitive processing are per-haps, in some ways, the least problematic technique. In terms of their bene-fits, these inventories are easily administered and scored, which makes themuseful large-scale assessment tools for determining which learners may needinterventions in metacognition, strategy use, or superordinate self-regulation.Self-report inventories may also be helpful for use in theoretical research.
MEASURING CHILDREN’S METACOGNITION 55
For instance, research has demonstrated that both the knowledge and regula-tion components of metacognition can be measured via self-report inven-tories (Pereira-Laird & Deane, 1997; Schraw & Dennison, 1994). As self-regulatory constructs are further delineated, researchers will need measuresof metacognitive processes to facilitate theoretical and predictive modelsof self-regulation.
Unlike inventories used with older learners, such as the MetacognitiveAwareness Inventory (MAI) (Schraw & Dennison, 1994) or the MotivatedStrategies for Learning Questionnaire (MSLQ) (Pintrich, Smith, Garcia, &McKeachie, 1991), and the Learning and Study Strategies Inventory (LASSI)(Weinstein, Schulte, & Palmer, 1987) that have undergone assessment forpsychometric properties, less is known regarding self-report inventories ofmetacognition for use with younger learners. Such inventories are often de-veloped for a specific one-time use and are rarely compared to other mea-sures of metacognitive processing or to achievement.
Research on children’s metacognition generally employs one of twoframeworks although other conceptions of metacognition are present in theliterature (e.g., Nelson & Narnes, 1996). One framework, initiated by Flavell(Flavell, 1979; Flavell, Miller, & Miller, 1993), presents metacognition asincluding metacognitive knowledge and metacognitive experiences. Meta-cognitive knowledge includes task, person, and strategy components. Meta-cognitive experiences include feelings of understanding and may be the im-petus for strategy implementation (Flavell, 1979). In later writings Flavelland colleagues referred to these components as metacognitive monitoringand self-regulation (1993).
The second framework initiated by Brown (1978), and further delineatedand discussed in later work (Baker & Brown, 1984; Cross & Paris, 1988;Jacobs & Paris, 1987; Paris, Cross, & Lipson, 1984; Pireira-Laird & Deane,1987) also suggests two components: Knowledge of cognition and regulationof cognition. The knowledge component includes declarative, procedural,and conditional knowledge of cognition. The regulation of cognition compo-nent includes constructs such as planning, monitoring, and evaluation. Thecurrent study employs the Brown framework of metacognition as the theoret-ical foundation.
The Brown framework was chosen for several reasons. First, the instru-ments developed and tested in the current work are based on an adult measureof metacognition that was developed conceptually from the Brown frame-work. Second, in Experiment 2, the new instrument, the Jr. MAI, is examinedin an initial construct validity study. The other instruments used in Experi-ment 2 were either developed based on the Brown framework of metacogni-tion or the items on the instruments can be readily classified into the Brownframework. In this way, the Brown framework provides a consistent con-struct definition for the initial validity examination. Third, the current study
56 SPERLING ET AL.
addresses metacognition within the context of an academic setting. TheBrown framework provides direct application to academic learning settings(e.g., Baker & Brown, 1984).
The current work addresses three main goals. First, both experiments ad-dress the development of a self-report inventory measure of metacognitiveprocesses. Based on the Brown (1978) framework of metacognition two ver-sions of the Jr. MAI were created to assess the metacognitive skills in learn-ers in grades 3 through 9. Second, the second experiment investigates rela-tionships among measures of metacognitive processing in school-agelearners and examines four self-report inventories of metacognitive pro-cessing as well as teacher ratings of metacognitive processing. Third, thesecond experiment also considers the relationship between measures of meta-cognition and standardized achievement measures, gender differences, andgrade-related developmental changes in metacognition.
EXPERIMENT 1
The first study was conducted to assess the psychometric properties oftwo versions of a metacognitive instrument, titled the Junior MetacognitiveAwareness Inventory, or Jr. MAI, developed for use with younger popula-tions. The Jr. MAI was developed from a previous instrument, the Metacog-nitive Awareness Inventory (MAI), used with adult populations (Schraw &Dennison, 1994).
Methods
Participants
Participants included all 344 children in third through ninth grades from a rural K–9 gradeschool. Less than 1% minorities reside in the district and therefore few minorities were in-cluded in the study. Fifty-one percent of the children in the school qualified for free or reducedlunch programs.
Materials
Two self-report inventories were developed. The first inventory (Jr. MAI, Version A) in-cluded 12 items with a three-choice response (never, sometimes, or always) for use with learn-ers in grades 3 through 5 (Jr. MAI, Version A is presented in Appendix A). The secondinventory (Jr. MAI, Version B) included the same 12 items but also included 6 additionalitems and used a 5-point Likert scale for use with learners in grades 6 through 9. The additional6 items were added to reflect higher levels of regulation that would likely be evidenced inolder, more experienced learners (Jr. MAI Version B is presented in Appendix B).
The Schraw and Dennison (1994) measure for adults (the MAI) was used as a referencemeasure. First, items that loaded strongly on the knowledge of cognition and regulation ofcognition factors of the MAI were examined. After selecting those items that most stronglyrepresented the two factors, each item was first checked for relevance to a younger population.For example, an item from the MAI, which was less appropriate for the current population,was I understand my intellectual strengths and weaknesses. Second, most items were reworded
MEASURING CHILDREN’S METACOGNITION 57
to represent language understandable to younger populations. In addition, some items weregiven more of a context to assist young learners’ understanding. For example, on the MAIan item that loaded heavily on the regulation factor stated, I ask myself how well I accomplishedmy goals once I’m finished. The item was reworded for the current population as, I ask myselfif I learned as much as I could have when I finish a task. Third, items were further consideredbased on their loadings on the original eight components of metacognition represented in theSchraw and Dennison inventory. Consistent with Brown’s theory, the Schraw and Dennisoninventory, and related work, three components of knowledge of cognition (declarative knowl-edge, conditional knowledge, and procedural knowledge), and five components of regulationof cognition (planning, monitoring, information management, evaluation, and debugging) wereconsidered. Fourth, two classroom teachers from the school from which the sample was drawn,a third-grade teacher and a fifth-/sixth-grade teacher, were consulted prior to administration.Both teachers felt the items would be answerable by their learners. The third-grade teacherconfirmed some of the Version B items would be too complex for her learners.
Table 1 provides Jr. MAI item number, the original MAI item number, and item. The load-ings from the original scale as reported by Schraw and Dennison (1994, Experiment 1) arepresented and the item affiliation is included. Appendix A and Appendix B present the twoversions of the Jr. MAI and can be referenced to illustrate changes in the items from theiroriginal form as found in the MAI.
Procedures
All learners in grades 3 through 9 were included in the study. In all classes the instrumentwas administered as part of normal class procedures. Although not part of the protocol, teachersadministered the inventory in grade 3 by reading each item aloud in a group setting. All otherlearners completed the inventory at their own pace. The classroom teacher or paraprofessionalgave additional assistance to those in need of it. The Jr. MAI, Version A, was administeredto grades 3 through 5; the Jr. MAI, Version B, was administered to grades 6 through 9.
Results
The primary goals when developing the Jr. MAI were to create a short,easily administered instrument for use to screen learners for potential meta-cognitive and cognitive strategy interventions and for use as an assessmenttool to determine the effectiveness of ongoing interventions. First, all itemswere checked to assure no items were nonnormal given Skewness or Kurto-sis. All items were within criteria for meeting normality (Fabriger, MacCal-lum, Wegener, & Strahan, 1999; Tabachnick & Fidell, 1996). Communalityestimates were examined for the items in each of the inventories. Two itemsfor Version A (Item 4 and Item 5) indicated communality estimates near 1,perhaps indicating some redundancy in those items. No items warranted con-cern based on communality estimates in Version B. Next, separate explor-atory factor analyses were conducted using an orthogonal varimax rotationwith a principal components extraction method for each of the instruments.Oblique analyses were also conducted but are not reported as they yieldedvery similar results. This is consistent with findings from Schraw and Den-nison (1994) in factor analyses conducted with the MAI.
58 SPERLING ET AL.
TA
BL
E1
Jr.
MA
IIt
ems
and
MA
IO
rigi
nal
Item
s,Fa
ctor
Loa
ding
s,an
dT
heor
etic
alC
orre
spon
denc
e
Jr.
Fact
orlo
adin
gfr
omM
AI
Exp
erim
ent
1ite
mM
AI:
item
num
ber
and
item
(Sch
raw
and
Den
niso
n,19
94)
Item
conc
eptu
alaf
filia
tion
132
:I
ama
good
judg
eof
how
wel
lI
unde
rsta
ndso
met
hing
.70
Kno
wle
dge
ofco
gniti
on(K
)D
ecla
rativ
ekn
owle
dge
226
:I
can
mot
ivat
em
ysel
fto
lear
nw
hen
Ine
edto
..6
6K
now
ledg
eof
cogn
ition
(K)
Con
ditio
nal
know
ledg
e3
3:I
try
tous
est
rate
gies
that
have
wor
ked
inth
epa
st.5
5K
now
ledg
eof
cogn
ition
(K)
Proc
edur
alkn
owle
dge
416
:I
know
wha
tth
ete
ache
rex
pect
sm
eto
lear
n..5
3K
now
ledg
eof
cogn
ition
(K)
Dec
lara
tive
know
ledg
e5
15:
Ile
arn
best
whe
nI
alre
ady
know
som
ethi
ngab
out
the
topi
c.5
3K
now
ledg
eof
cogn
ition
(K)
Con
ditio
nal
know
ledg
e6
37:
Idr
awpi
ctur
esor
diag
ram
sto
help
me
unde
rsta
ndw
hile
.38
Reg
ulat
ion
ofco
gniti
on(R
)le
arni
ngIn
form
atio
nm
anag
emen
tsk
ill7
50:
Ias
km
ysel
fif
Ile
arne
das
muc
has
Ico
uld
have
once
Ifin
ish
a.6
5R
egul
atio
nof
cogn
ition
(R)
task
Eva
luat
ion
811
:I
ask
mys
elf
ifI
have
cons
ider
edal
lop
tions
whe
nso
lvin
ga
.46
Reg
ulat
ion
ofco
gniti
on(R
)pr
oble
mM
onito
ring
96:
Ith
ink
abou
tw
hat
Ire
ally
need
tole
arn
befo
reI
begi
na
task
.59
Reg
ulat
ion
ofco
gniti
on(R
)Pl
anni
ng
MEASURING CHILDREN’S METACOGNITION 5910
49:
Ias
km
ysel
fqu
estio
nsab
out
how
wel
lI
amle
arni
ngw
hile
Iam
.55
Reg
ulat
ion
ofco
gniti
on(R
)le
arni
ngso
met
hing
new
Mon
itori
ng11
30:
Ifo
cus
onth
em
eani
ngan
dsi
gnifi
canc
eof
new
info
rmat
ion
.59
Reg
ulat
ion
ofco
gniti
on(R
)In
form
atio
nm
anag
emen
tsk
ill12
46:
Ile
arn
mor
ew
hen
Iam
inte
rest
edin
the
topi
c.5
7K
now
ledg
eof
cogn
ition
(K)
Dec
lara
tive
know
ledg
e13
29:
Ius
em
yin
telle
ctua
lst
reng
ths
toco
mpe
nsat
efo
rm
yw
eakn
esse
s.5
4K
now
ledg
eof
cogn
ition
(K)
Con
ditio
nal
know
ledg
e14
18:
Ius
edi
ffer
ent
lear
ning
stra
tegi
esde
pend
ing
onth
esi
tuat
ion
.43
Kno
wle
dge
ofco
gniti
on(K
)C
ondi
tiona
lkn
owle
dge
151:
Ias
km
ysel
fpe
riod
ical
lyif
Iam
mee
ting
my
goal
s.6
2R
egul
atio
nof
cogn
ition
(R)
Mon
itori
ng16
33:
Ifin
dm
ysel
fus
ing
help
ful
lear
ning
stra
tegi
esau
tom
atic
ally
.48
Kno
wle
dge
ofco
gniti
on(K
)Pr
oced
ural
know
ledg
e17
19:
Ias
km
ysel
fif
ther
ew
asan
easi
erw
ayto
doth
ings
afte
rI
fin-
.44
Reg
ulat
ion
ofco
gniti
on(R
)is
ha
task
Eva
luat
ion
188:
Ise
tsp
ecifi
cgo
als
befo
reI
begi
na
task
.68
Reg
ulat
ion
ofco
gniti
on(R
)Pl
anni
ng
60 SPERLING ET AL.
Version A
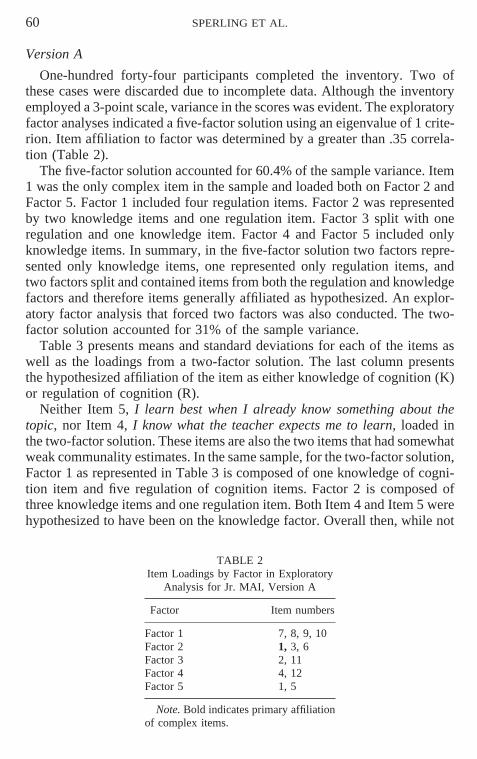
One-hundred forty-four participants completed the inventory. Two ofthese cases were discarded due to incomplete data. Although the inventoryemployed a 3-point scale, variance in the scores was evident. The exploratoryfactor analyses indicated a five-factor solution using an eigenvalue of 1 crite-rion. Item affiliation to factor was determined by a greater than .35 correla-tion (Table 2).
The five-factor solution accounted for 60.4% of the sample variance. Item1 was the only complex item in the sample and loaded both on Factor 2 andFactor 5. Factor 1 included four regulation items. Factor 2 was representedby two knowledge items and one regulation item. Factor 3 split with oneregulation and one knowledge item. Factor 4 and Factor 5 included onlyknowledge items. In summary, in the five-factor solution two factors repre-sented only knowledge items, one represented only regulation items, andtwo factors split and contained items from both the regulation and knowledgefactors and therefore items generally affiliated as hypothesized. An explor-atory factor analysis that forced two factors was also conducted. The two-factor solution accounted for 31% of the sample variance.
Table 3 presents means and standard deviations for each of the items aswell as the loadings from a two-factor solution. The last column presentsthe hypothesized affiliation of the item as either knowledge of cognition (K)or regulation of cognition (R).
Neither Item 5, I learn best when I already know something about thetopic, nor Item 4, I know what the teacher expects me to learn, loaded inthe two-factor solution. These items are also the two items that had somewhatweak communality estimates. In the same sample, for the two-factor solution,Factor 1 as represented in Table 3 is composed of one knowledge of cogni-tion item and five regulation of cognition items. Factor 2 is composed ofthree knowledge items and one regulation item. Both Item 4 and Item 5 werehypothesized to have been on the knowledge factor. Overall then, while not
all items loaded in the two-factor solution, the findings are still fairly consis-tent with expectations. That is, Factor 1 represents primarily regulation ofcognition and Factor 2 better represents knowledge of cognition.
It was expected that the factors would be highly correlated, as was foundin the factor solution of the MAI and as is hypothesized in the literature. Ifhigh relationships between the factors were indicated it would indicate thatthe factor structure might shift some in subsequent samples. To assess therelationships among factors, the five-factor solution was further examined.Scales were created from each of the factors. Items were only placed on thescale with their primary affiliation to reduce inflation of the relationships.That is, complex items were only included on one scale. As expected, therewere significant correlations between some of the factors. Significant correla-tions were found among Factors 1, 2, and 4. A significant correlation wasalso indicated between Factor 3 and Factor 5. While significant, these corre-lations were much smaller than those found in a college sample with theMAI and ranged between r 5 .19 and r 5 .24.
Grade level means and standard deviations are presented in Table 4. A
TABLE 4Means and Standard Deviations by Grade Level
one-way ANOVA indicated significant differences between grade-level per-formance on the overall inventory, F(2, 141) 5 6.67, p , .05. Tukey HSDpost hoc analyses revealed that grade 3 outperformed grade 4. This is likelydue to administration differences. Teachers in grade 3, but not in grades 4or 5, read the inventory aloud.
Version B
Two hundred participants in grades 6 through 9 completed the Jr. MAIVersion B. Four of these cases were discarded due to incomplete data. Again,first an exploratory analysis was examined and five factors were again re-vealed. These factors accounted for 55% of the sample variance.
Table 5 presents the item affiliation by factor. Several items in this sampleloaded on more than one factor and represent complex items. No items, how-ever, loaded on more than two factors. Table 5 presents all of the items thatloaded on each factor as indicated by a .35 or greater correlation. Complexitems are represented by bold print for their primary affiliation. All itemsloaded on at least one of the five factors.
Factor 1 was the least clear of the five factors and represented items repre-senting both knowledge of cognition and regulation of cognition almostequally. For Factor 2, two of the eight items represent knowledge of cogni-tion items while the remaining six items are regulation of cognition items.The two items that primarily load on Factor 3 include one knowledge ofcognition item and one regulation item. With Factor 4, both Items 5 and 12represented knowledge of cognition while for Factor 5, two of the three itemsrepresented knowledge of cognition, but Item 15 represented a regulationof cognition item. Therefore, items generally loaded as expected with theexception of Factor 1, which contained items developed to measure bothknowledge and regulation.
As with the younger sample, an exploratory analysis that forced two fac-tors was also conducted. It was expected in a two-factor solution that Items1, 2, 3, 4, 5, 12, 13, 14, and 16 would represent knowledge of cognition.
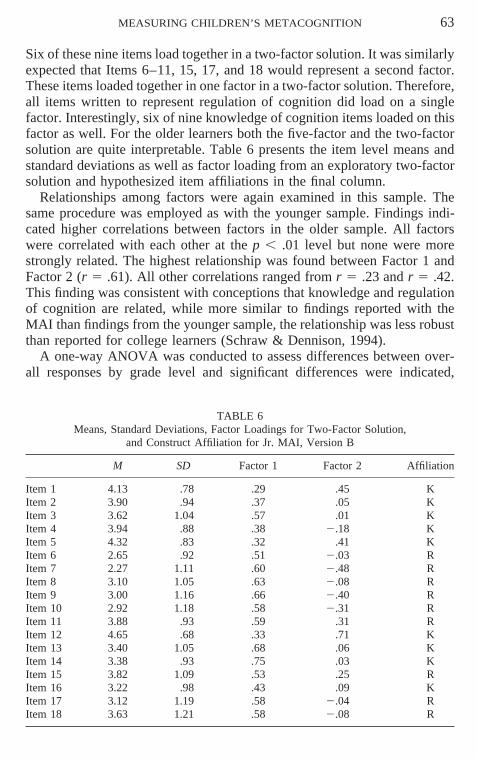
Six of these nine items load together in a two-factor solution. It was similarlyexpected that Items 6–11, 15, 17, and 18 would represent a second factor.These items loaded together in one factor in a two-factor solution. Therefore,all items written to represent regulation of cognition did load on a singlefactor. Interestingly, six of nine knowledge of cognition items loaded on thisfactor as well. For the older learners both the five-factor and the two-factorsolution are quite interpretable. Table 6 presents the item level means andstandard deviations as well as factor loading from an exploratory two-factorsolution and hypothesized item affiliations in the final column.
Relationships among factors were again examined in this sample. Thesame procedure was employed as with the younger sample. Findings indi-cated higher correlations between factors in the older sample. All factorswere correlated with each other at the p , .01 level but none were morestrongly related. The highest relationship was found between Factor 1 andFactor 2 (r 5 .61). All other correlations ranged from r 5 .23 and r 5 .42.This finding was consistent with conceptions that knowledge and regulationof cognition are related, while more similar to findings reported with theMAI than findings from the younger sample, the relationship was less robustthan reported for college learners (Schraw & Dennison, 1994).
A one-way ANOVA was conducted to assess differences between over-all responses by grade level and significant differences were indicated,
TABLE 6Means, Standard Deviations, Factor Loadings for Two-Factor Solution,
F(3, 195) 5 4.27, p , .05. Tukey HSD post hoc analyses indicated grades8 and 9 outperformed grade 7. No other differences were indicated. Table7 presents means and standard deviations by grade level.
The first experiment represented the initial phases of instrument develop-ment for two metacognitive inventories appropriate for grade school andmiddle school children as an assessment and screening device. Generallyitems loaded as expected. Some factors did split and contain items fromboth the knowledge of cognition and regulation of cognition constructs. Thisfinding is consistent with similar work with the MAI (Schraw & Dennison,1994) and is likely due to the high correlation between knowledge and regu-lation aspects of metacognition. Overall, all items did load on a factor inthe exploratory analyses. Neither instrument, therefore, was altered from theoriginal form found in Appendix A and Appendix B. The second experimentfurther tested the factor structure of the instruments and examined the instru-ments through an initial validity investigation.
EXPERIMENT 2
Method
Participants
Students enrolled in one of two schools in a rural school district participated in the study.The first school’s total enrollment was 255 in grades 5 through 8. All of these children wereadministered the materials by either their science (grades 5–6) or math (grades 7–8) teachersduring class time as part of normal class procedures. The second school had a total enrollmentof 405 students in grades pre-K through 8. All children in grades 3 through 8 participated inthe study as part of their class activities (n 5 157). To facilitate comparisons across samples,as in the first experiment, learners in third grade were read the instruments aloud, and anylearners in need of additional assistance to complete the inventories were assisted by the class-room teacher or paraprofessional.
The instruments were administered in the math and science classes in grades 7 and 8 ofthe second school for consistency with the subject pool of the first school. Since both theseschools are within the same district, the data for these two schools were combined for analyses(total n 5 416). Students in this sample were from a rural county. The number of childrenreceiving free or reduced lunch in the countywide district was just over 60%. As with theExperiment 1 sample, a small minority population (approximately 1%) resided in the county.
MEASURING CHILDREN’S METACOGNITION 65
Materials
Materials included a teacher information sheet, a teacher rating scale, an administrationrecord sheet, and the two versions of the Jr. MAI. Additional measures of metacognitionincluded the Strategic Problem Solving Inventory (Fortunato, Hecht, Tittle, & Alvarez, 1991),the Metacomprehension Strategies Index (Schmitt, 1990), and the Index of Reading Awareness(Jacobs & Paris, 1987). These instruments were chosen because each was published in conjunc-tion with articles on measuring or promoting metacognition and were previously administeredto similar-age learners. In addition to the teacher ratings and the inventories, data were alsocollected from subscales from a fall administration of the Stanford 9 (Stanford AchievementTest Series, Ninth Edition, 1996). Demographic data collected included gender, grade level,school, and teacher. Prior to administration, the inventory materials were piloted on eightsimilar-age children to assure that the items were clearly presented and answerable. No changeswere made to the instruments based upon the pilot administration.
Teacher information sheet. Prior to rating students, teachers were provided a summary de-scription of metacognition and characteristics of metacognitive learners to consistently definemetacognition to all teachers.
Teacher rating. The teacher rating instrument, developed for this study and included inAppendix C, required teachers to rate each of their students on a scale of 1–6 for metacogni-tion. Examples of student behaviors were provided for each point on the scale to assist teachersin rating. For the third grade, two teachers made ratings; for the fourth and fifth grades,one teacher made ratings; for the sixth and eighth grades, three teachers made ratings; andfor the seventh grade, four teachers made ratings. A total of eight teachers, therefore, maderatings for the entire sample of students. The average ratings by teacher ranged from 3.5 to4.0 on the 6-point scale. No significant differences by teacher were indicated in the ratings,F(8, 356) 5 1.47, p 5 .17.
Administration record. Teachers administered the inventories as part of classroom proce-dures. To ensure consistency in administration, and to assure no anomalies in administration,a report form was developed to record length of time of administration, date of administration,as well as anomalies in administration and any questions asked by learners. Nothing worthyof concern was indicated from the administration records and no data were removed from thesample.
Each of the inventories was administered in the same sequence to all children. Descriptionsof the inventories follow in the order in which they were administered.
Jr. MAI. Two separate versions of the Jr. MAI were administered: Version A for grades3–5 and Version B for grades 6–8. In this study the internal consistency reliability of the Jr.MAI was .76 for the younger and .82 for the older learners.
Strategic Problem Solving Inventory (Fortunato et al., 1991). The full 21-item inventorywas administered, but was slightly modified for this study. In the original inventory a 3-point(yes, no, and maybe) response was used. In the current study the 3-point and the 5-point Likertscales used for the two versions of the Jr. MAI were employed. The internal consistencyreliability of this instrument in this study was .82 for younger and .87 for older learners.
Metacomprehension Strategies Index (Schmitt, 1990). This 25-item multiple-choice inven-tory required learners to identify behaviors they engage in while planning to read, monitoringreading, and evaluating reading. Items are scored as correct or incorrect. From a metacognitiveperspective the inventory focused on regulation of cognition. The internal consistency reliabil-ity for this instrument in this study was .60 for the younger and .57 for the older learners.
Index of Reading Awareness (Jacobs & Paris, 1987). The inventory was used with a slightmodification made to the directions for greater clarity. This 20-item multiple-choice inventoryrequired learners to rate activities they engage in while reading and again focused on regulationof cognition. The internal consistency reliability for this instrument was .53 for the youngerand .38 for the older learners.
choice and open-ended assessment to measure students’ performance in several content areas.The scores accessed for the current study included overall achievement, reading comprehen-sion, and mathematical problem solving.
Results
The initial analyses were conducted to examine characteristics of the in-ventories and the consistency of the factor structure of the Jr. MAI invento-ries in a second sample. Again, exploratory factor analysis was employed tounderstand the underlying structure of the items. Again, five-factor solutionsemerged from both data sets. Again, two-factor solutions were also forcedon the data. A varimax orthogonal rotation with a principal components ex-traction method was again implemented. All items were checked for normal-ity and communality deviations. No items on either version in this samplewarranted concern.
In the five-factor solution for Version A, approximately 61.8% of the sam-ple variance was accounted for by the items. Table 8 presents the item affili-ation by factor. Several items in this sample loaded on more than one factorbut no items loaded on more than two factors. Table 8 presents all of theitems that loaded at .35 or greater. Bold print illustrates primary affiliationfor complex items. Item 5 did not load on any of the five factors. For Factor1, all items represented knowledge of cognition items. For Factor 2, twoitems were knowledge of cognition items while two were regulation of cogni-tion items. For Factor 3 and for Factor 4 all items were regulation of cogni-tion items. Finally, Factor 5, represented by only Item 4, was classified asa knowledge of cognition item. Therefore, except for Factor 2, all itemsloaded with their affiliation, though in more than two factors.
A two-factor exploratory analysis was also conducted. The two-factor so-lution was also quite interpretable. Factor 1 was represented by five regula-tion items and one knowledge item. This item was Item 4, which did notload in the two-factor solution in Experiment 1 and represented a singlefactor in the five-factor solution in this sample. Factor 2 included five knowl-
edge items and one regulation item. The regulation item was the only com-plex item in the factor and actually also loaded on Factor 1 with the re-maining regulation items. The two-factor solution accounted for 46% of thesample variance. Both the five-factor and the two-factor solutions appearto support distinctions between knowledge of cognition and regulation ofcognition. As expected, however, relationships among items were strong,providing support for measurement of metacognition generally.
Table 9 presents means, standard deviations, and factor loadings from atwo-factor solution for the items in the second administration of the Jr. MAI,Version A. The item means and standard deviations are consistent with thefirst administration.
For Version B, an exploratory factor analysis again yielded a five-factorsolution. In this solution, 52% of the sample variance was accounted for bythe five factors. In contrast, 36% was accounted for by a subsequent explor-atory two-factor solution. For the five-factor solution, Factor 1 represented6 items, all of which are regulation of cognition items. Factor 5 representedonly knowledge of cognition. Factor 4 contained 3 knowledge of cognitionitems and 1 regulation item. The regulation item on Factor 4, Item 11, wasa complex item and also loaded more strongly on Factor 2. Factor 3 splitand had 2 knowledge items and 1 regulation item. Factor 2 had both knowl-edge (n 5 3) and regulation (n 5 5) items. Table 10 presents the item load-ings by factor for the five factor solution.
Again, a two factor exploratory solution was conducted. Factor 1 in thetwo-factor solution contained 10 items. These were 7 of the 9 regulationitems on the scale and 3 additional knowledge items. These 3 knowledgeitems all were complex items and also loaded on Factor 2. Factor 2 in this
TABLE 9Means, Standard Deviations, and Factor Loadings for Items
solution was represented by all of the knowledge items and 2 additionalregulation items. Therefore, the items generally grouped as was expected inboth the five- and the two-factor solutions. Table 11 presents the means,standard deviations, and factor loadings for the two-factor solution for theJr. MAI, Version B.
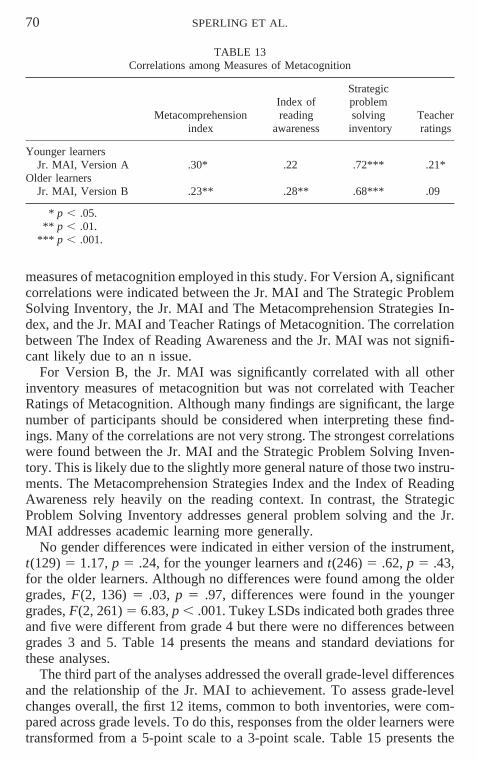
The second part of the analyses was conducted as an initial construct valid-ity investigation of the Jr. MAI. Table 12 presents the means and standarddeviations by grade for all instruments. Table 13 presents correlations among
TABLE 11Means, Standard Deviations, and Factor Loadings for Items
Younger learnersJr. MAI, Version A .30* .22 .72*** .21*
Older learnersJr. MAI, Version B .23** .28** .68*** .09
* p , .05.** p , .01.
*** p , .001.
measures of metacognition employed in this study. For Version A, significantcorrelations were indicated between the Jr. MAI and The Strategic ProblemSolving Inventory, the Jr. MAI and The Metacomprehension Strategies In-dex, and the Jr. MAI and Teacher Ratings of Metacognition. The correlationbetween The Index of Reading Awareness and the Jr. MAI was not signifi-cant likely due to an n issue.
For Version B, the Jr. MAI was significantly correlated with all otherinventory measures of metacognition but was not correlated with TeacherRatings of Metacognition. Although many findings are significant, the largenumber of participants should be considered when interpreting these find-ings. Many of the correlations are not very strong. The strongest correlationswere found between the Jr. MAI and the Strategic Problem Solving Inven-tory. This is likely due to the slightly more general nature of those two instru-ments. The Metacomprehension Strategies Index and the Index of ReadingAwareness rely heavily on the reading context. In contrast, the StrategicProblem Solving Inventory addresses general problem solving and the Jr.MAI addresses academic learning more generally.
No gender differences were indicated in either version of the instrument,t(129) 5 1.17, p 5 .24, for the younger learners and t(246) 5 .62, p 5 .43,for the older learners. Although no differences were found among the oldergrades, F(2, 136) 5 .03, p 5 .97, differences were found in the youngergrades, F(2, 261) 5 6.83, p , .001. Tukey LSDs indicated both grades threeand five were different from grade 4 but there were no differences betweengrades 3 and 5. Table 14 presents the means and standard deviations forthese analyses.
The third part of the analyses addressed the overall grade-level differencesand the relationship of the Jr. MAI to achievement. To assess grade-levelchanges overall, the first 12 items, common to both inventories, were com-pared across grade levels. To do this, responses from the older learners weretransformed from a 5-point scale to a 3-point scale. Table 15 presents the
MEASURING CHILDREN’S METACOGNITION 71
TABLE 14Means and Standard Deviations by Grade for the
means and standard deviations for the first 12 items common to both versionsof the Jr. MAI. ANOVA indicated significant differences between groups,F(5, 393) 5 4.09, p , .001. Post hoc comparisons not illustrated aboveindicated differences between grade 3 and 6 and grades 3 and 8 with thirdgrade outperforming both sixth and eighth grades. Additional significant dif-ferences were also indicated between grade 4 and grades 6 and 7, differencesbetween grade 5 and all of the older grades were also indicated with grade5 outperforming each of the older grades. It was expected that there wouldbe consistent grade level progression in scores on the Jr. MAI and this wasthe primary justification for a second version of the instrument for olderlearners. Expected differences were not indicated. Contrary to a priori be-liefs, it may be that Version B is also appropriate for a younger sample.
The final analyses illustrated the relationships between the Jr. MAI andstandardized achievement measures. As discussed, previous work has notconsistently indicated relationships between these variables. It was expectedthat in the older grades, metacognitive knowledge and regulation might berelated to better achievement. Table 16 presents the correlations between theJr. MAI and achievement scores. These correlations are rather low and indi-
TABLE 15Means and Standard Deviations for Jr. MAI,
TABLE 16Correlations between the Jr. MAI and Achievement Measures
Overall Problem solving Reading comprehension
Jr. MAI (Version A) *.18 *.17 *.20Jr. MAI (Version B) 2.03 2.08 2.00
* p , .05.
cate no meaningful relationship between achievement and metacognition inthis sample.
Discussion
The results of Experiment 2 provide further information about the Jr. MAI.The Jr. MAI inventories developed and presented here are based upon theoften-referenced Brown theoretical framework of metacognition (Brown,1978). Both of the theoretical constructs of knowledge of cognition and regu-lation of cognition were represented through exploratory factor analysis. Inthis study, an initial construct examination of the Jr. MAI indicated statisti-cally significant correlations with all other inventories of metacognition inolder learners and significant correlations with two other inventory measuresand teacher ratings of metacognition in the younger learners. Gender differ-ences were not indicated and grade-level differences were reported.
Although Version A was significantly correlated with achievement thecorrelations were not likely meaningfully significant as they were rathermodest. Correlations between Version B and achievement were very lowand some were negative.
GENERAL DISCUSSION
The current research sought to add to the knowledge base regarding themeasurement of metacognitive skills for classroom assessment and to facili-tate further development of theoretical models of self-regulation. Additionalgoals of this research were to develop a new measure of general metacogni-tion for use in grades 3–9 learning settings, to provide information as to thestrength of the instrument to represent metacognitive constructs, and to ad-dress the relationship between achievement and metacognition.
Experiment 1 addressed the development of two versions of the Jr. MAI.The development process included constructing items based on an existingmeasure composed of two factors: Knowledge of cognition and regulationof cognition. Experiment 2 further examined the inventories and also pre-sented an initial validity investigation of the instruments. Exploratory factoranalyses were conducted in both experiments for both samples of learners.Across both samples and both versions of the instrument these analyses dem-
MEASURING CHILDREN’S METACOGNITION 73
onstrated that the preponderance of items loaded strongly on five factors andaccounted for large sample variance. Further, there were many consistenciesin the factor structure across samples. As knowledge and regulation of cogni-tion are related it was expected that some items might shift in their factoraffiliation. This is consistent with findings from the MAI as reported bySchraw and Dennison (1994). It is promising that across both samples thefactors were quite interpretable and appear to measure both knowledge andregulation of cognition. Given some shift, however, those who use the Jr.MAI might best employ the inventories as a measure of knowledge and regu-lation of cognition overall and not rely heavily on individual factor scores.The Jr. MAI inventories are an important addition to research and instrumen-tation regarding metacognition since the factor structure across samples indi-cates that the Jr. MAI measures metacognition more broadly than existingmeasures, which often focus solely on regulation components.
Experiment 2 examined the correlations between the Jr. MAI and othermetacognitive instruments, teacher ratings, and achievement scores. Find-ings indicated significant correlations between the Jr. MAI Versions A andB and the Strategic Problem-Solving Inventory (Fortunato et al., 1991) (A:r 5 .72; B: r 5 .68); moderate significant correlations between both versionsof the Jr. MAI and the Metacomprehension Strategies Index (Schmitt, 1990)(A: r 5 .30; B: .23); moderate correlations, but significant for Version B,between the Index of Reading Awareness (Jacobs & Paris, 1987) (A: r 5.22; B: r 5 .28); and low correlations, although statistically significant forVersion A, between the Jr. MAI and teacher ratings of metacognition (A:r 5 .21; B: r 5 .09). The correlations between achievement scores and theJr. MAI were statistically significant, but low, for Version A and nonsignifi-cant, and sometimes negative, for Version B. Overall, these results providevaluable support for the construct validity of the Jr. MAI.
The relationships between the Jr. MAI, Version A, and other inventoriesshowed fewer significant correlations than did those for Version B. The dis-parity may be due to instruction that emphasizes learning discrete knowledgeand regulation of strategies within specific contexts in the lower grades. Ina related sense, the two metacognitive reading measures were generally lesscorrelated with the Jr. MAI than was the Strategic Problem Solving Inventory(Fortunato et al., 1991). It is likely that the reading context provided a morespecific reference point for the learners. The children may have deemed theJr. MAI and the Strategic Problem Solving Inventory as less specific.
Interestingly, the teacher rating measure was significantly correlated withthe Jr. MAI, Version A, but was the only measure not correlated with theJr. MAI, Version B. This finding may be due to the teachers of the youngerlearners making their ratings of student metacognition based on the skillsthey had observed within multiple content areas. In the older learners, theteachers were restricted to observations of students in a specific subject area.
74 SPERLING ET AL.
As such, the teacher rating measure provides validity to the notion that theJr. MAI measures metacognition broadly and across subject areas.
The relationship between metacognitive skills and achievement is compli-cated and not well addressed in previous research. Findings are inconsistent.Researchers strive to be able to measure metacognitive processes separatefrom achievement. The appeal of this approach is that if we can measurethe constructs separately we can more clearly target metacognitive skills andother self-regulation constructs. The contrasting view is that when promotinggeneral self-regulation and specifically metacognitive skills, such as monitor-ing, researchers assume that an increase in these skills should lead to anincrease in academic achievement. That is, within more advanced learners,metacognitive skills should drive academic achievement. If this hypothesizedrelationship exists between metacognitive skills and processes and achieve-ment, correlations between measures of metacognitive processes andachievement should be less strong in the younger academic years than inmore advanced learners. The current work lacks support for this hypothesis.The findings from the current study, however, are consistent with previousfindings that indicate either small or nonsignificant findings between meta-cognition and aptitude and achievement (e.g., Allon, Gutkin, & Bruning,1995).
The correlations between the Jr. MAI versions and achievement are gener-ally low. They actually decrease in the older population. A favorable view ofthis finding is that the Jr. MAI measures something other than achievement.Swanson’s (1990) research would support this notion. It is more likely thatas learners age and gain more content-specific knowledge, strategic pro-cesses also become more domain-specific. Hence, a more domain-generalmeasure of metacognitive processes loses its predictive power. Findingsfrom two studies of the development and subsequent initial validation of areading strategy and metacognitive measure for use with slightly older learn-ers found higher correlations between that measure and reading achievementthan for other achievement areas such as mathematics or study skills (Peirera-Laird & Deane, 1997). A competing view of domain-specific versus generalviews of metacognitive processes is presented in Schraw’s work (e.g.,Schraw, 1997; Schraw & Neitfield, 1998).
Based on the findings from these two studies, the Jr. MAI appears to bea reliable measure of metacognition and initial construct validation is promis-ing. Further work examining the instruments is necessary. Such work shouldinclude a stability analysis. In addition the inventories should be tested forgeneralizability in a more diverse sample. These are both weaknesses in thecurrent study. Additional work should also include longitudinal studies withschool-age learners. Studies that address the validity of the instruments withadditional measures of metacognitive processing, such as calibration tech-niques, self-graphing, or perhaps interviews, are also needed.
MEASURING CHILDREN’S METACOGNITION 75
The Jr. MAI can be used as a tool for classroom diagnosis and interventionand for future construct development for those studying self-regulatory con-structs. It is easily administered and scored. The data presented here indicateevidence for validity and the general nature of the instrument is appropriatefor use in assessing ongoing interventions. The authors have already receivednumerous requests from researchers and practitioners to use the instrumentin their work. In addition, researchers at the NASA Classroom of the Futurehave used the instrument in four studies and have found it to be a validpredictor of learning in on-line environments (Schwartz, Andersen, Howard,Hong, & McGee, 1998), success in problem solving (Hong & Jonassen,1999), effectiveness in cooperative learning (Howard, 1998), and highergrade point averages and science-related attitudes (Howard, 1998).
The two current studies further both theoretical and pragmatic work inthe area of self-regulatory constructs. Future research should examine meansof measuring metacognitive processing as well as other self-regulatoryabilities in young learners for both theory development and effectiveinstructional practice and should also continue to focus on more clearlyunderstanding the relationship between metacognitive processing and achie-vement.
APPENDIX A
Grade level: 3 4 5
We are interested in what learners do when they study. Please read the following sen-tences and circle the answer that relates to you and the way you are when you are doingschool work or home work. Please answer as honestly as possible.
1 5 Never 2 5 Sometimes 3 5 Always
1. I know when I understand something. Never Sometimes Always2. I can make myself learn when I need to. Never Sometimes Always3. I try to use ways of studying that have worked for me Never Sometimes Always
before.4. I know what the teacher expects me to learn. Never Sometimes Always5. I learn best when I already know something about the Never Sometimes Always
topic.6. I draw pictures or diagrams to help me under- Never Sometimes Always
understand while learning.7. When I am done with my schoolwork, I ask myself if Never Sometimes Always
I learned what I wanted to learn.8. I think of several ways to solve a problem and then Never Sometimes Always
choose the best one.9. I think about what I need to learn before I start working. Never Sometimes Always
10. I ask myself how well I am doing while I am learning Never Sometimes Alwayssomething new.
11. I really pay attention to important information. Never Sometimes Always12. I learn more when I am interested in the topic. Never Sometimes Always
APPENDIX B
Grade level: 6 7 8 9
We are interested in what learners do when they study. Please read the following sen-tences and circle the answer that relates to you and the way you are when you are doingschool work or home work. Please answer as honestly as possible.
1 5 Never 2 5 Seldom 3 5 Sometimes 4 5 Often 5 5 Always
1. I know when I understand something. 1 2 3 4 52. I can make myself learn when I need to. 1 2 3 4 53. I try to use ways of studying that have worked for me before. 1 2 3 4 54. I know what the teacher expects me to learn. 1 2 3 4 55. I learn best when I already know something about the topic. 1 2 3 4 56. I draw pictures or diagrams to help me understand while learning. 1 2 3 4 57. When I am done with my schoolwork, I ask myself if I learned what 1 2 3 4 5
I wanted to learn.8. I think of several ways to solve a problem and then choose the best 1 2 3 4 5
one.9. I think about what I need to learn before I start working. 1 2 3 4 5
10. I ask myself how well I am doing while I am learning something 1 2 3 4 5new.
11. I really pay attention to important information. 1 2 3 4 512. I learn more when I am interested in the topic. 1 2 3 4 513. I use my learning strengths to make up for my weaknesses. 1 2 3 4 514. I use different learning strategies depending on the task. 1 2 3 4 515. I occasionally check to make sure I’ll get my work done on time. 1 2 3 4 516. I sometimes use learning strategies without thinking. 1 2 3 4 517. I ask myself if there was an easier way to do things after I finish a 1 2 3 4 5
task.18. I decide what I need to get done before I start a task. 1 2 3 4 5
APPENDIX C
Teacher Rating of Student Metacognition
Metacognition refers to one’s thinking about thinking or one’s knowing about knowing. Stu-dents who are HIGHLY metacognitive tend to exhibit cognitive behaviors that are differentfrom LOW metacognitive students. Listed below are several behavioral descriptors that woulddistinguish students who are HIGH and LOW in metacognition.
HIGH Metacognition LOW Metacognition1. Focuses attention 1. Attends randomly2. Studies purposefully 2. Studies haphazardly3. Makes study plans 3. Doesn’t plan much4. Judges own performance accurately 4. Inaccurate about own performance5. Asks questions to insure understanding 5. Continues work without understanding
Using the following scale, rate each student in your class regarding your best judgment ofhis or her level of metacognition.
6 5 Very High Metacognition 3 5 Below Average Metacognition5 5 High Metacognition 2 5 Low Metacognition4 5 Above Average Metacognition 1 5 Very Low Metacognition
Class:
Student Name Rating (1–6) Student Name Rating (1–6)
MEASURING CHILDREN’S METACOGNITION 77
REFERENCES
Allon, M., Gutkin, T. B., & Bruning, R. (1994). The relationship between metacognition andintelligence in normal adolescents: Some tentative but surprising findings. Psychologyin the Schools, 31, 93–96.
Brown, A. L. (1978). Knowing when, where, and how to remember: A problem of metacogni-tion. Advances in Instructional Psychology, 1, 77–165.
Baker, L., & Brown, A. (1984). Metacognitive skills and reading. In P. D. Pearson, M. Kamil,R. Barr, & P. Mosenthal (Eds.), Handbook of reading research (pp. 353–394). NewYork: Longman.
Brownlee, S., Leventhal, H., & Leventhal, E. A. (2000). Regulation, self-regulation, and con-struction of the self in the maintenance of physical health. In M. Boekaerts, P. R. Pin-trich, & M. Zeidner (Eds.), Handbook of self-regulation (pp. 369–409). San Diego, CA:Academic Press.
Cavanaugh, J. C., & Perlmutter, M. (1982). Metamemory: A critical examination. Child Devel-opment, 53(1), 11–28.
Craig, M. T., & Yore, L. D. (1995). Middle school students’ metacognitive knowledge aboutscience reading and science text: An interview study. Reading Psychology: An Interna-tional Quarterly, 16, 169–213.
Cross, D. R., & Paris, S. G. (1988). Developmental and instructional analyses of children’smetacognition and reading comprehension. Journal of Educational Psychology, 80(2),131–142.
De Corte, E., Verschaffel, L., & Op ’t Eynde, P. (2000). Self-regulation: A characteristic anda goal of mathematics education. In M. Boekaerts, P. R. Pintrich, & M. Zeidner (Eds.),Handbook of self-regulation (pp. 687–722). San Diego, CA: Academic Press.
Delclos, V. R., & Harrington, C. (1991). Effects of strategy monitoring and proactive instruc-tion on children’s problem-solving performance. Journal of Educational Psychology,83(1), 35–42.
Ericsson, K. A., & Simon, H. A. (1980). Verbal reports as data. Psychological Review, 87(3),215–259.
Ericsson, K. A., & Simon, H. A. (1993). Protocol analysis: Verbal reports as data. Cambridge,MA: MIT Press.
Fabriger, L. R., MacCallum, R. C., Wegener, D. T., & Strahan, E. J. (1999). Evaluating theuse of exploratory factor analysis in psychological research. Psychological Methods, 4(3),272–299.
Feitler, F. C., & Hellekson, L. E. (1993). Active verbalization plus metacognitive awarenessyields positive achievement gains in at-risk first graders. Reading Research and Instruc-tion, 33(1), 1–11.
Flavell, J. H. (1979). Metacognition and cognitive monitoring: A new area of cognitive devel-opmental inquiry. American Psychologist, 34(10), 906–911.
Flavell, J. H., Miller, P. H., & Miller, S. A. (1993). Cognitive development (3rd ed.). Engle-wood Cliffs, NJ: Prentice Hall.
Fortunato, I., Hecht, D., Tittle, C. K., & Alvarez, L. (1991). Metacognition and problem solv-ing. Arithmetic Teacher, 39(4), 38–40.
Hong, N., & Jonassen, D. H. (April 1999). Well-structured and ill-structured problem solving
78 SPERLING ET AL.
in a multimedia simulation. Paper presented at the annual meeting of the American Educa-tional Research Association, Montreal, Canada.
Howard, B. C. (1998). Metacognitive Awareness Inventories: NASA COTF Research Results.Technical Report, NASA Classroom of the Future.
Howard, B. C., McGee, S., Hong, N., & Shia, R. (April, 2000). Student Self-Regulated Learn-ing and Scientific Problem Solving in Computer Based Learning Environments. Paperpresented at the annual meeting of the American Educational Research Association, NewOrleans, LA.
Jacobs, J. E., & Paris, S. G. (1987). Children’s metacognition about reading: Issues in defini-tion, measurement, and instruction. Educational Psychologist, 22(3&4), 235–278.
Manning, B. H. (1984). A self-communication structure for learning mathematics. School Sci-ence and Mathematics, 84(1), 43–51.
Manning, B. H., (1991). Cognitive self-instruction for classroom processes. Albany, NY: StateUniversity of New York Press.
Manning, B. H., Glasner, S. E., & Smith, E. R. (1996). The self-regulated learning aspect ofmetacognition: A component of gifted education. Roeper Review, 18(3), 217–223.
Nelson, T. O., & Narnes, L. (1996). In J. Metcalfe & A. P. Shimamura (Eds.), Metacognition:Knowing about knowing. Cambridge, MA: MIT Press.
Newman, R. S. (1984a). Children’s achievement and self-regulation evaluations in mathemat-ics: A longitudinal study. Journal of Educational Psychology, 76(5), 857–873.
Newman, R. S. (1984b). Children’s numerical skill and judgments of confidence in estimation.Journal of Experimental Child Psychology, 37(1), 107–123.
Newman, R. S., & Wick, P. L. (1987). Effect of age, skill, and performance feedback onchildren’s judgments of confidence. Journal of Educational Psychology, 79(2), 115–119.
Nisbett, R. E., & Wilson, T. D. (1977). Telling more than we can know: Verbal reports onmental processes. Psychological Review, 84(1), 231–251.
Pajares, F. (1996). Self-efficacy beliefs in academic settings. Review of Educational Research,66(4), 543–578.
Palincsar, A. S., & Brown, A. L. (1984). Reciprocal teaching of comprehension fostering andcomprehension monitoring activities. Cognition and Instruction, 2, 117–175.
Paris, S., Cross, D. R., & Lipson, M. Y. (1984). Informed strategies for learning: A programto improve children’s reading awareness and comprehension. Journal of Educational Psy-chology, 76(6), 1239–1252.
Pereira-Laird, J. A., & Deane, F. P. (1997). Development and validation of a self-report mea-sure of reading strategy use. Reading Psychology: An International Quarterly, 18, 185–235.
Pintrich, P. R., Smith, D. A. F., Garcia, T., & McKeachie, W. J. (1991). A manual for the useof the motivated strategies learning questionnaire (MSLQ). Ann Arbor, MI: Universityof Michigan, National Center for Research to Improve Postsecondary Teaching andLearning.
Pressley, M., & Afflerbach, P. (1995). Verbal protocols of reading: The nature of construc-tively responsive reading. Hillsdale, NJ: Erlbaum.
Pressley, M., & Ghatala, E. S. (1989). Metacognitive benefits of taking a test for children andyoung adolescents. Journal of Experimental Child Psychology, 47, 430–450.
Pressley, M., Levin, J. R., Ghatala, E. S., & Amhad, M. (1987). Test monitoring in younggrade school children. Journal of Experimental Child Psychology, 43(1), 96–111.
Reid, R., & Harris, K. R. (1993). Self-monitoring of attention versus self-monitoring of perfor-
MEASURING CHILDREN’S METACOGNITION 79
mance: Effects of attention and academic performance. Exceptional Children, 60(1), 29–38.
Schmitt, C. (1990). A questionnaire to measure children’s awareness of strategic reading pro-cesses. The Reading Teacher, 43(7), 454–459.
Schraw, G. (1997). The effect of generalized metacognitive knowledge on test performanceand confidence judgments. Journal of Experimental Education, 65(2), 135–146.
Schraw, G., & Nietfeld, J. (1998). A further test of the general monitoring skill hypothesis.Journal of Educational Psychology, 90(2), 236–248.
Schraw, G., & Roedel, T. D. (1994). Test difficulty and judgment bias. Memory & Cognition,22(1), 63–69.
Schwartz, N., Andersen, C., Howard, B. C., Hong, N., & McGee, S. M. (April, 1998). Theinfluence of configurational knowledge on children’s problem-solving performance in ahypermedia environment. Paper presented at the annual meeting of the American Educa-tional Research Association, San Diego, CA.
Swanson, H. L. (1990). Influence of Metacognitive knowledge and aptitude on problem solv-ing. Journal of Educational Psychology, 82(2), 306–314.
Tabachnick, B. G., & Fidell, L. S. (1996). Using multivariate statistics (3rd ed.). New York:HarperCollins College.
Tobias, S., Everson, H., Laitusis, V. (1999). Toward a performance-based measure of meta-cognitive knowledge monitoring: Relationships with self-reports and behavior ratings.Paper presented at the annual meeting of the American Educational Research Association,Montreal, Canada.
Weinstein, C. E., Husman, J., & Dierking, D. R. (2000). Self-regulated interventions with afocus on learning strategies. In M. Boekaerts, P. R. Pintrich, & M. Zeidner (Eds.), Hand-book of self-regulation (pp. 728–744). San Diego, CA: Academic Press.
Weinstein, C. E., Schulte, A., & Palmer, D. (1987). Learning and study strategies inventory.Clearwater, FL: H & H.
Winne, P. H., & Perry, N. E. (2000). Measuring self-regulated learning. In M. Boekaerts, P. R.Pintrich, & M. Zeidner (Eds.), Handbook of self-regulation (pp. 532–564). SanDiego, CA: Academic Press.
Zimmerman, B. J., & Martinez-Pons, M. (1986). Development of a structured interview forassessing student use of self-regulated learning strategies. American Educational Re-search Journal, 23, 614–628.
Zimmerman, B. J., & Martinez-Pons, M. (1988). Construct validation of a strategy model ofself-regulated learning. Journal of Educational Psychology, 80, 284–290.