CAROLINA POPULATION CENTER | CAROLINA SQUARE - SUITE 210 | 123 WEST FRANKLIN STREET | CHAPEL HILL, NC 27516 Add Health Wave V Documentation Measures of Glucose Homeostasis https://doi.org/10.17615/djqy-6508 2020 Report prepared by Eric A. Whitsel Robert Angel Rick O’Hara Lixin Qu Kathryn Carrier Kathleen Mullan Harris Add Health is supported by grant P01-HD31921 from the Eunice Kennedy Shriver National Institute of Child Health and Human Development, with cooperative funding from 23 other federal agencies and foundations.
Transcript
CAROLINA POPULATION CENTER | CAROLINA SQUARE - SUITE 210 | 123 WEST FRANKLIN STREET | CHAPEL HILL, NC 27516
Add Health Wave V Documentation
Measures of Glucose Homeostasis
https://doi.org/10.17615/djqy-6508
2020
Report prepared by
Eric A. Whitsel
Robert Angel
Rick O’Hara
Lixin Qu
Kathryn Carrier
Kathleen Mullan Harris
Add Health is supported by grant P01-HD31921 from the Eunice Kennedy Shriver National Institute of Child Health and Human Development, with cooperative funding from 23 other federal agencies and foundations.
Add Health is a program project directed by Kathleen Mullan Harris and designed by J. Richard Udry, Peter S. Bearman, and Kathleen Mullan Harris at the University of North Carolina at Chapel Hill, and funded by grant P01-HD31921 from the Eunice Kennedy Shriver National Institute of Child Health and Human Development, with cooperative funding from 23 other federal agencies and foundations. Information on how to obtain the Add Health data files is available on the Add Health website (http://www.cpc.unc.edu/addhealth).
2 | P a g e
This document summarizes the rationale, equipment, protocol, assays, internal quality control, data cleaning, external quality control, and procedures for the measurement and classification of glucose homeostasis at the Wave V home exam. Whenever possible, data collection and methods in Wave V mirrored those of Wave IV to ensure comparability of data between waves, although important inter-Wave differences exist and are grey-highlighted herein. This document is one in a set of Wave V user guides. User guides are also available to describe protocols for the following biological measures at Wave V:
Anthropometrics Cardiovascular Measures Medication Use – Home Exam Baroreflex Sensitivity & Hemodynamic Recovery Inflammation and Immune Function Lipids Renal Function
Acknowledgment This research uses data from Add Health, a program project directed by Kathleen Mullan Harris and designed by J. Richard Udry, Peter S. Bearman, and Kathleen Mullan Harris at the University of North Carolina at Chapel Hill, and funded by grant P01-HD31921 from the Eunice Kennedy Shriver National Institute of Child Health and Human Development, with cooperative funding from 23 other federal agencies and foundations. We gratefully acknowledge Carolyn Halpern, Nancy Dole, Joyce Tabor, and Sarah Dean for their dedication to the quality of the Add Health data in this document. Information on how to obtain the Add Health data files is available on the Add Health website (https://addhealth.cpc.unc.edu/).
Citation Citations of this Add Health User Guide should use the following format: Whitsel, EA, Angel R, O’Hara R, Qu L, Carrier K, Harris K. Add Health Wave V Documentation: Measures of Glucose Homeostasis, 2020; Available from: https://doi.org/10.17615/djqy-6508
Add Health is a program project directed by Kathleen Mullan Harris and designed by J. Richard Udry, Peter S. Bearman, and Kathleen Mullan Harris at the University of North Carolina at Chapel Hill, and funded by grant P01-HD31921 from the Eunice Kennedy Shriver National Institute of Child Health and Human Development, with cooperative funding from 23 other federal agencies and foundations. Information on how to obtain the Add Health data files is available on the Add Health website (http://www.cpc.unc.edu/addhealth).
6.1 Fasting Status [H5FASTTM] ........................................................................................................ 17
6.2 Fasted for Eight Hours or More [H5FASTGL] ............................................................................... 17
6.3 Classification of Fasting Glucose [H5CFGLU] ............................................................................... 17
6.4 Classification of Non-Fasting Glucose [H5CNFGLU] .................................................................... 17
6.5 Classification of HbA1c [H5CHBA1C] ........................................................................................... 18
6.6 Anti-diabetic Medication Use [H5C_MED] .................................................................................. 18
6.7 Joint Classification of Diabetes [H5DIABJC] ................................................................................ 19
7. The Glucose Homeostasis Data File (bglua1c5.xpt) .......................................................................... 19
Add Health is a program project directed by Kathleen Mullan Harris and designed by J. Richard Udry, Peter S. Bearman, and Kathleen Mullan Harris at the University of North Carolina at Chapel Hill, and funded by grant P01-HD31921 from the Eunice Kennedy Shriver National Institute of Child Health and Human Development, with cooperative funding from 23 other federal agencies and foundations. Information on how to obtain the Add Health data files is available on the Add Health website (http://www.cpc.unc.edu/addhealth).
7.3. Use .............................................................................................................................................. 20
Add Health is a program project directed by Kathleen Mullan Harris and designed by J. Richard Udry, Peter S. Bearman, and Kathleen Mullan Harris at the University of North Carolina at Chapel Hill, and funded by grant P01-HD31921 from the Eunice Kennedy Shriver National Institute of Child Health and Human Development, with cooperative funding from 23 other federal agencies and foundations. Information on how to obtain the Add Health data files is available on the Add Health website (http://www.cpc.unc.edu/addhealth).
5 | P a g e
1. Introduction
Wave IV measures of glucose homeostasis were based on dried blood spots collected using capillary finger prick.1 In contrast, Wave V measures of glucose homeostasis were based on venous blood collected via phlebotomy. The blood was collected by field examiners (FEs) certified in phlebotomy, chilled at 4°C during the remainder of the home exam, centrifuged immediately afterward, aliquoted into transport tubes, and then sent overnight to a laboratory for assay. Assayed Glucose Concentrations
• Glucose (mg/dl) • Hemoglobin A1c (HbA1c, %)
Moreover, the restricted use Add Health Wave V data include six constructed measures:
• Fasting status (h) • Classification of fasting glucose2 • Classification of non-fasting glucose2 • Classification of HbA1c 2 • Anti-diabetic medication use • Joint classification of glucose, HbA1c, self-reported history of diabetes, and anti-diabetic
medication use 2. General Overview of Data Collection
All Wave V venous blood samples were collected during home exams performed by FEs from two Add Health data collection partners: Examination Management Services, Inc. (2016–2017) and Hooper Holmes, Inc. (2018–2019). All FEs were trained and certified using a custom program specific to the Add Health protocol. FEs used a 7” Samsung Galaxy Tab 4 tablet to record and transmit data. An Add Health data collection application (Open Data Kit or ODK) installed on the tablet guided the FEs through the home exam protocol. In addition, FEs received a series of job aids, both on paper and on the tablet, to serve as quick reference guides when completing the protocol. Each tablet also contained an in-depth Add Health training manual that could be accessed at any time. FEs conducted home exams among previously consented respondents. All FEs were phlebotomy-certified and had at least two years of experience collecting venous blood. Before home exams, FEs were sent a Visit Supply Kit that included a box for shipping blood to the lab and a Blood Collection Kit containing most required materials for the blood collection. FEs supplied additional materials, as needed (see section 3.2). Protocols for blood collection were dictated to FEs by the handheld 7” Samsung tablet used during all home exams. The tablet gave step-by-step directions for the blood collection and required FEs to enter information about the blood draw for each respondent. All respondents had the option to decline part or all the blood draw, although declining did not affect their ability to participate in the rest of the home exam. Overall, 91.8% of the respondents agreed to and completed the blood draw. Of the remainder, 6.5% refused, 1.3% agreed but the blood draw was unsuccessful, and < 1% had
Add Health is a program project directed by Kathleen Mullan Harris and designed by J. Richard Udry, Peter S. Bearman, and Kathleen Mullan Harris at the University of North Carolina at Chapel Hill, and funded by grant P01-HD31921 from the Eunice Kennedy Shriver National Institute of Child Health and Human Development, with cooperative funding from 23 other federal agencies and foundations. Information on how to obtain the Add Health data files is available on the Add Health website (http://www.cpc.unc.edu/addhealth).
6 | P a g e
exams terminated before the blood draw (see the blood draw status variable H5BLOOD in the bdemo5 data set and codebook). Blood collection was the last step in the home exam. Afterwards, all collection tubes were inverted 8-10 times to distribute the blood and contents of the tubes and then chilled at 4⁰ C (on ice or frozen cold packs) for up to two hours. Subsequent processing involved centrifuging specific tubes then aliquoting serum and plasma into color-coded transport tubes pre-labelled with unique barcode identifiers linking the blood to a particular respondent. Then the transport tubes were packaged in a Styrofoam Box with frozen cold packs and shipped overnight via FedEx to the Laboratory for Clinical Biochemistry Research (LCBR) at the University of Vermont. Overnight shipment enabled receipt by LCBR before 10:30 am the next morning. Upon receipt, LCBR documented the arrival of the transport tubes, evaluated their condition, processed them, and either assayed the specimens or aliquoted and archived them in -80°C freezers. 3. Blood Collection
3.1 Rationale Venous blood was collected to provide Add Health with the biological specimens necessary to assay and interpret a pre-specified panel of metabolic, hematologic, inflammatory, immune, and renal biomarkers, including the measures of glucose homeostasis described herein. It also was collected to establish an archive of serum, plasma, whole blood, RNA, and packed cells capable of supporting future assays and ancillary studies. 3.2 Equipment Before exams, FEs were shipped a Visit Supply Kit (Exhibit 1) including (1) a cardboard Shipping Box with an inner Styrofoam Box and two cold packs for shipping collected samples to LCBR, (2) a large Tyvek envelope in which to ship the Shipping Box, and (3) a Blood Collection Kit for collecting blood. The Blood Collection Kit contained: • Biohazard-labelled Ziploc bag • Latex-free gloves • 2”x2” gauze • Latex-free, Band-Aid type adhesive dressings • Latex-free, strap tourniquet • Alcohol prep pads, disposable pipets • Single-use vacutainer (blood collection) tube holder • 21-gauge Eclipse straight needle • 21-gauge butterfly needle • (3) disposable 3 ml graduated transfer pipets • (2) 8.5 ml serum separation transport (SST) vacutainer tubes • (1) 6 ml sodium fluoride/potassium oxalate (NaFl/KOx)-containing vacutainer tube, if needed for
the glucose sub-study (see Section 4.1.2.1) • (1) 3- or 4- ml potassium ethylenediaminetetraacetic acid (EDTA)-containing vacutainer tube
Add Health is a program project directed by Kathleen Mullan Harris and designed by J. Richard Udry, Peter S. Bearman, and Kathleen Mullan Harris at the University of North Carolina at Chapel Hill, and funded by grant P01-HD31921 from the Eunice Kennedy Shriver National Institute of Child Health and Human Development, with cooperative funding from 23 other federal agencies and foundations. Information on how to obtain the Add Health data files is available on the Add Health website (http://www.cpc.unc.edu/addhealth).
7 | P a g e
• (1) 10 ml EDTA-containing vacutainer tube • (1) 10 ml PAXgene vacutainer tube (containing 7.5 ml of preservative) • (4) 10 ml transport tubes with color coded caps • Extra barcode labels
BD Biosciences (San Jose, CA) supplied all the vacutainer and transport tubes. As of February 2018, their 3 ml EDTA vacutainer tube (Cat #367835) was no longer available, so Add Health switched to the 4 ml EDTA vacutainer tube (Cat #367844).
Exhibit 1. Visit Supply and Blood Collection Kits
FEs were responsible for providing ancillary materials for each home exam, including but not limited to a chux-type absorbent under pad, a sharps container, and a cooler with cold packs for keeping samples cold before packaging and shipping them to LCBR. 3.3 General Protocol 3.3.1 Blood Collection The blood draw was performed as the final stage of the home exam following collection of anthropometric, cardiovascular, and medication information. After confirming respondents were comfortable giving blood, respondents were asked to either sit or recline at their discretion. They also were asked if they had problems in the past with blood collection such as fainting, bleeding, or hard-to-find veins. FEs were instructed to ensure the blood collection area was private, uncluttered, and fully prepared before beginning the blood draw. Preparation involved placing the chux pad, organizing the vacutainer tubes/supplies, preparing the cooler to accept the blood samples, and scanning the barcode located on the outside of the Blood Collection Kit. Scanning it automatically captured a unique, eight-digit code, thereby linking the respondent to the transport tubes / labels within it, the corresponding ODK questionnaire data, and ultimately to LCBR results. Following standard phlebotomy protocols, FEs asked respondents to identify an arm for collecting blood, applied the tourniquet to that arm, and identified a vein in the antecubital fossa for venipuncture. If no vein appeared suitable, FEs asked to try the opposite arm. Unless respondents had objections,
Add Health is a program project directed by Kathleen Mullan Harris and designed by J. Richard Udry, Peter S. Bearman, and Kathleen Mullan Harris at the University of North Carolina at Chapel Hill, and funded by grant P01-HD31921 from the Eunice Kennedy Shriver National Institute of Child Health and Human Development, with cooperative funding from 23 other federal agencies and foundations. Information on how to obtain the Add Health data files is available on the Add Health website (http://www.cpc.unc.edu/addhealth).
8 | P a g e
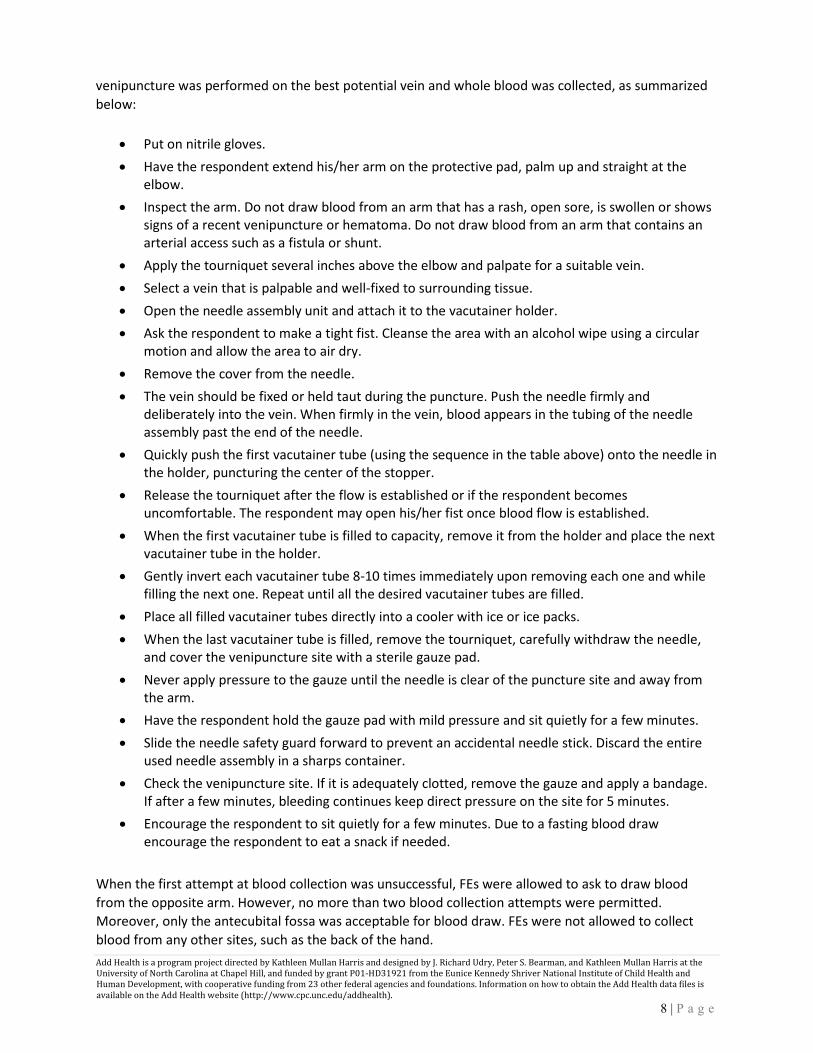
venipuncture was performed on the best potential vein and whole blood was collected, as summarized below:
• Put on nitrile gloves. • Have the respondent extend his/her arm on the protective pad, palm up and straight at the
elbow. • Inspect the arm. Do not draw blood from an arm that has a rash, open sore, is swollen or shows
signs of a recent venipuncture or hematoma. Do not draw blood from an arm that contains an arterial access such as a fistula or shunt.
• Apply the tourniquet several inches above the elbow and palpate for a suitable vein. • Select a vein that is palpable and well-fixed to surrounding tissue. • Open the needle assembly unit and attach it to the vacutainer holder. • Ask the respondent to make a tight fist. Cleanse the area with an alcohol wipe using a circular
motion and allow the area to air dry. • Remove the cover from the needle. • The vein should be fixed or held taut during the puncture. Push the needle firmly and
deliberately into the vein. When firmly in the vein, blood appears in the tubing of the needle assembly past the end of the needle.
• Quickly push the first vacutainer tube (using the sequence in the table above) onto the needle in the holder, puncturing the center of the stopper.
• Release the tourniquet after the flow is established or if the respondent becomes uncomfortable. The respondent may open his/her fist once blood flow is established.
• When the first vacutainer tube is filled to capacity, remove it from the holder and place the next vacutainer tube in the holder.
• Gently invert each vacutainer tube 8-10 times immediately upon removing each one and while filling the next one. Repeat until all the desired vacutainer tubes are filled.
• Place all filled vacutainer tubes directly into a cooler with ice or ice packs. • When the last vacutainer tube is filled, remove the tourniquet, carefully withdraw the needle,
and cover the venipuncture site with a sterile gauze pad. • Never apply pressure to the gauze until the needle is clear of the puncture site and away from
the arm. • Have the respondent hold the gauze pad with mild pressure and sit quietly for a few minutes. • Slide the needle safety guard forward to prevent an accidental needle stick. Discard the entire
used needle assembly in a sharps container. • Check the venipuncture site. If it is adequately clotted, remove the gauze and apply a bandage.
If after a few minutes, bleeding continues keep direct pressure on the site for 5 minutes. • Encourage the respondent to sit quietly for a few minutes. Due to a fasting blood draw
encourage the respondent to eat a snack if needed. When the first attempt at blood collection was unsuccessful, FEs were allowed to ask to draw blood from the opposite arm. However, no more than two blood collection attempts were permitted. Moreover, only the antecubital fossa was acceptable for blood draw. FEs were not allowed to collect blood from any other sites, such as the back of the hand.
Add Health is a program project directed by Kathleen Mullan Harris and designed by J. Richard Udry, Peter S. Bearman, and Kathleen Mullan Harris at the University of North Carolina at Chapel Hill, and funded by grant P01-HD31921 from the Eunice Kennedy Shriver National Institute of Child Health and Human Development, with cooperative funding from 23 other federal agencies and foundations. Information on how to obtain the Add Health data files is available on the Add Health website (http://www.cpc.unc.edu/addhealth).
9 | P a g e
Either 5 or 6 tubes of blood were collected per respondent, depending on eligibility for a separate glucose sub-study (see Section 4.1.2.1). Collection order, tube type, and processing information are listed below (Exhibit 2).
Order Tube Type Centrifuged Resultant
supernatant Resultant
precipitate Use
1 8.5 ml SST Yes Serum Discarded
Assays: glucose, total cholesterol, high- & low-
density lipoprotein-cholesterol, triglycerides, high sensitivity C reactive
protein, creatinine & cystatin C
2 10 ml EDTA Yes Plasma RBC/buffy
coat Archival: for future use
3 3 or 4 ml
EDTA No N/A N/A
Assay: hemoglobin A1c Archival: for future use
4 8.5 ml SST Yes Serum Discarded Archival: for future use
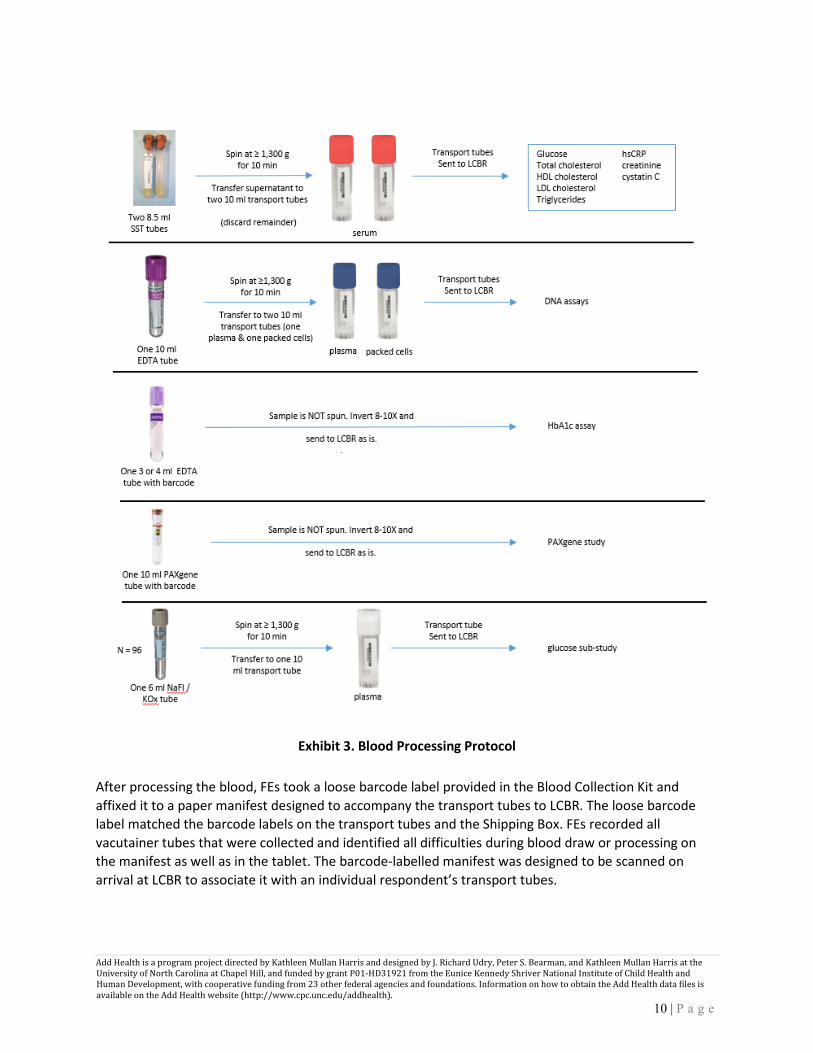
3.3.2 Blood Processing The venous blood draw concluded the home exam. After cleaning up all supplies and equipment, FEs left the exam sites and were allowed a maximum of two hours before processing the blood which was chilled at 4⁰ C (on ice or frozen cold packs) in the interim. All FEs centrifuged specific blood collection tubes, including the 8.5 ml SST, 10 ml EDTA, and when collected, the 6 ml NaFl/KOx vacutainer tubes. The 3-4 ml EDTA vacutainer tube used for the HbA1c assay was not centrifuged. FEs centrifuged tubes for ≥ 10 min at ≥ 1300 g, depending on the capabilities of their centrifuge. After centrifugation, FEs used the graduated transfer pipettes included in the Blood Collection Kit to aliquot serum from the SST and (separately, when collected) plasma from the NaFl/KOx vacutainer tubes into 10 ml, round bottom, skirted transport tubes (BD Biosciences, NJ). FEs aliquoted as much supernatant as possible into the transport tubes but avoided disturbing the precipitate layer. A red cap identified transport tubes containing serum from the SST vacutainer tubes, a blue cap identified transport tubes containing plasma from the 10 ml EDTA vacutainer tube, and a white cap identified the transport tube containing plasma from the Na/Fl/KOx tube. Transport tubes were chilled at 4⁰ C (on ice or frozen cold packs) until packaged for shipment to LCBR. Exhibit 3 demonstrates the complete blood processing protocol.
Add Health is a program project directed by Kathleen Mullan Harris and designed by J. Richard Udry, Peter S. Bearman, and Kathleen Mullan Harris at the University of North Carolina at Chapel Hill, and funded by grant P01-HD31921 from the Eunice Kennedy Shriver National Institute of Child Health and Human Development, with cooperative funding from 23 other federal agencies and foundations. Information on how to obtain the Add Health data files is available on the Add Health website (http://www.cpc.unc.edu/addhealth).
10 | P a g e
Exhibit 3. Blood Processing Protocol After processing the blood, FEs took a loose barcode label provided in the Blood Collection Kit and affixed it to a paper manifest designed to accompany the transport tubes to LCBR. The loose barcode label matched the barcode labels on the transport tubes and the Shipping Box. FEs recorded all vacutainer tubes that were collected and identified all difficulties during blood draw or processing on the manifest as well as in the tablet. The barcode-labelled manifest was designed to be scanned on arrival at LCBR to associate it with an individual respondent’s transport tubes.
Add Health is a program project directed by Kathleen Mullan Harris and designed by J. Richard Udry, Peter S. Bearman, and Kathleen Mullan Harris at the University of North Carolina at Chapel Hill, and funded by grant P01-HD31921 from the Eunice Kennedy Shriver National Institute of Child Health and Human Development, with cooperative funding from 23 other federal agencies and foundations. Information on how to obtain the Add Health data files is available on the Add Health website (http://www.cpc.unc.edu/addhealth).
11 | P a g e
3.3.3 Shipment of Samples Immediately before shipment, FEs removed two cold packs from the freezer, sandwiched the transport tubes between them, enclosed the sandwich within the Styrofoam Box, placed the manifest on top of the Styrofoam Box, sealed the cardboard Shipping Box around it, put the cardboard Shipping Box inside the Tyvek envelope, applied a pre-printed FedEx shipping label to the envelope, carried it to a FedEx office, and handed it to a FedEx representative (in person) for Priority Overnight shipment to LCBR with arrival the following morning. FEs were not permitted to leave shipments at unattended FedEx drop boxes. When overnight shipment was impossible, FEs noted this on the manifest and held unboxed transport tubes in a refrigerator approved for biological specimens or cooler with enough cold packs to keep them chilled at 4⁰ C overnight without risk of freezing (or thawing), as is possible on wet or dry ice. The transport tubes were packaged and shipped the next day using freshly frozen cold packs. 3.3.4 Receipt of Samples at LCBR LCBR technicians specifically trained for Add Health Wave V received and immediately processed samples each morning. They unpacked the shipping boxes one at a time, evaluated the volume and quality of each transport tube, and entered them into a custom-made laboratory information management system (LIMS) program. After re-centrifuging the serum samples for glucose assays at 4° C for 10 min at 30,000 g, the technicians aspirated the supernatant, discarded all remaining precipitate, transferred the aspirate to pre-labelled tubes, and placed them in a biospecimen refrigerator for archival (in 1 ml aliquots at -80° C) or assay (500 ul aliquot). The LCBR technicians entered all aliquot information into the LIMS system. The LCBR technicians also remixed the vacutainer tube used to collect and transport the venous whole blood sample for HbA1c assay, then aspirated and archived a 1 ml aliquot for future use. 350 μl of the remaining sample was then transferred to a pre-labelled tube for a 5-10-minute cold transport via a daily 3:00 pm courier to Pathology and Laboratory Medicine, in the University of Vermont Medical Center (UVMMC) for analysis.
4. Assay and Internal Quality Control
4.1 Glucose [H5GLUCOS] 4.1.1 Rationale Serum glucose was assayed because of its central role in the identification of impaired fasting glucose / pre-diabetes, and diabetes mellitus, two well-known risk factors for cardiovascular disease morbidity and mortality.
Add Health is a program project directed by Kathleen Mullan Harris and designed by J. Richard Udry, Peter S. Bearman, and Kathleen Mullan Harris at the University of North Carolina at Chapel Hill, and funded by grant P01-HD31921 from the Eunice Kennedy Shriver National Institute of Child Health and Human Development, with cooperative funding from 23 other federal agencies and foundations. Information on how to obtain the Add Health data files is available on the Add Health website (http://www.cpc.unc.edu/addhealth).
12 | P a g e
4.1.2 Colorimetric Assay Protocol All glucose assays were run on the same day of sample arrival at LCBR using an Ortho VITROS 5600 Integrated System (Ortho Clinical Diagnostics, Raritan, NJ) and VITROS Chemistry Products GLU slides, i.e. multilayered, analytical elements coated on polyester supports (see Exhibit 4). Serum from venous blood collected using the SST vacutainer tubes was introduced into the VITROS system by placing sample vials holding 500 µl of serum into an automatic sampling tray, after which all processes were automatically performed and results output by the VITROS system. The VITROS system read barcodes on the vials to automatically determine which assays to run. In addition to glucose, other assays were run from the same serum sample, including total cholesterol, high-density lipoprotein cholesterol, triglycerides, and creatinine. Only the glucose assay is described below. Assay protocols for other analytes can be found in other Add Health User Guides.
Exhibit 4. Ortho-Vitros GLU slide Upon introduction of each vial into the analyzer, 10 µl of serum was aspirated, deposited onto a GLU slide for analysis, and evenly distributed by the slide’s spreading layer to the underlying layers. The oxidation of serum glucose was catalyzed by glucose oxidase to form hydrogen peroxide and gluconate. This reaction was followed by an oxidative coupling catalyzed by peroxidase in the presence of dye precursors to produce a dye3. The specific reaction scheme is displayed in Exhibit 5.4
Exhibit 5. Glucose Assay Reaction Scheme
The intensity of the dye was measured and corresponding glucose concentration inferred at room temperature by comparing reflected light output at 540 nm to a standard curve generated using a VITROS Chemistry Products Calibrator Kit (Ortho Clinical Diagnostics, Raritan, NJ).5 The concentrations
Add Health is a program project directed by Kathleen Mullan Harris and designed by J. Richard Udry, Peter S. Bearman, and Kathleen Mullan Harris at the University of North Carolina at Chapel Hill, and funded by grant P01-HD31921 from the Eunice Kennedy Shriver National Institute of Child Health and Human Development, with cooperative funding from 23 other federal agencies and foundations. Information on how to obtain the Add Health data files is available on the Add Health website (http://www.cpc.unc.edu/addhealth).
13 | P a g e
were output to a Sunquest computer system (Sunquest Information Systems, Tucson AZ) that linked the UVMMC data with LCBR’s LIMS system. The VITROS 5600 system’s dynamic reporting range of the glucose assay was 20-625 mg/dl. When concentrations exceeded the upper limit, the VITROS system automatically diluted the samples 1:2 with a VITROS Chemistry Products FS Diluent Pack (Ortho Clinical Diagnostics, Raritan, NJ) until the concentrations were within range. Dilutions and glucose concentrations that accounted for the reflexive dilutions via multiplication by the dilution factor were reported simultaneously. The final glucose concentrations (H5GLUCOS) ranged from 40 to 618 mg/dL. 4.1.2.1 Glucose Sub Study Assay Protocol From a stratified random sample of 102 respondents (see Section 5.2), venous blood also was collected using NaFl/KOx vacutainer tubes (Section 3.2). Although SST vacutainer tubes yield serum and NaFl/KOx vacutainer tubes yield plasma, assay procedures based on blood collected using both types of vacutainer tubes were identical. 4.1.3 Internal Quality Control The Ortho-VITROS system was maintained daily by cleaning machine components, replacing all reagents, and running known quality control samples (Ortho Clinical Diagnostics, Raritan, NJ). Internal quality controls consisted of VITROS Performance Verifier I, which was typically 70-80 mg/dl glucose, and VITROS Performance Verifier II, which was typically 260-300 mg/dl glucose, depending on the specific lot used. Values assigned to the VITROS Chemistry Products Calibrator Kit for glucose are traceable to the Certified NIST (National Institute of Standards and Technology) Reference Material, SRM® (Standard Reference Material) 917. The Ortho-Clinical Diagnostics calibration laboratory uses SRM® 917 to calibrate the CDC Hexokinase method to support glucose concentration assignment for VITROS Calibrator Kit 1. In addition to the daily quality control, LCBR used two pools of samples from twenty normal donors (US Biologicals, Salem, MA) in longitudinal quality control analyses. One pool was an EDTA plasma normal donor pool (Lot #E050115). The other pool was a serum normal donor pool (Lot #S042715). LCBR periodically assayed both pools over the course of Wave V. The plasma and serum glucose concentration mean (coefficient of variation) based on those assays was 98 mg/dl (0.86%) and 116 mg/dl (0.72%), respectively. When glucose concentrations exceeded acceptable parameters, the Ortho-VITROS system was investigated and repaired. 4.2 Hemoglobin A1c (HbA1c) [H5HBA1C] 4.2.1 Rationale HbA1c was assayed in venous whole blood because it is an integrated measure of glucose homeostasis, reflecting average blood glucose over the preceding two to three months. The measure plays a critical
Add Health is a program project directed by Kathleen Mullan Harris and designed by J. Richard Udry, Peter S. Bearman, and Kathleen Mullan Harris at the University of North Carolina at Chapel Hill, and funded by grant P01-HD31921 from the Eunice Kennedy Shriver National Institute of Child Health and Human Development, with cooperative funding from 23 other federal agencies and foundations. Information on how to obtain the Add Health data files is available on the Add Health website (http://www.cpc.unc.edu/addhealth).
14 | P a g e
role in the management of diabetes since it is correlated with micro- and macrovascular complications and is widely used as the standard biomarker for the adequacy of glycemic management.2 4.2.2 Colorimetric Assay Protocol HbA1c assays were run by LCBR twice weekly on Tuesdays and Thursdays. Samples received at LCBR were stored at 4°C in sample refrigerators until assay day, when they were delivered to UVMMC with all other samples for that day. Assays were performed using the VITROS Chemistry Products HbA1c Reagent Kit (Ortho Clinical Diagnostics, Raritan, NJ) in conjunction with the VITROS Chemistry Products Calibrator Kit 31 (Ortho Clinical Diagnostics, Raritan, NJ) on the VITROS 5600 Integrated System. The VITROS Chemistry Products HbA1c Reagents are two dual-chambered packages containing ready-to-use liquid reagents. The concentrations of total hemoglobin (Hb) and HbA1c were measured in hemolyzed samples (see below), controls and calibrators. A new calibrator kit was used each time the reagent lot was changed. 350 µl of whole blood was placed into an automatic sampling tray, automatically aspirated, and hemolyzed in the VITROS 5600 Integrated System. Calibrators, controls and hemolyzed whole blood samples were mixed with Reagent 1 containing an anti-HbA1c antibody to form a soluble antigen-antibody complex. Hemoglobin in the hemolyzed whole blood was converted with Reagent 1 to a hematin derivative that was measured bichromatically at 340 nm and 700 nm. Unbound anti-HbA1c antibody reacted with polyhapten (hexapeptide-glycan, A1c Reagent 2) to form an insoluble antibody-polyhapten immune complex, which was measured turbidimetrically at 340 nm. After a calibration was performed for each reagent lot, the HbA1c and total hemoglobin concentrations in each sample were determined using the stored calibration curves and the measured absorbance obtained in the assay of the hemolyzed sample6. The reaction scheme for this assay is displayed in Exhibit 6.
Exhibit 6. HbA1c Assay Reaction Scheme
Add Health is a program project directed by Kathleen Mullan Harris and designed by J. Richard Udry, Peter S. Bearman, and Kathleen Mullan Harris at the University of North Carolina at Chapel Hill, and funded by grant P01-HD31921 from the Eunice Kennedy Shriver National Institute of Child Health and Human Development, with cooperative funding from 23 other federal agencies and foundations. Information on how to obtain the Add Health data files is available on the Add Health website (http://www.cpc.unc.edu/addhealth).
15 | P a g e
The VITROS 5600 system’s dynamic reporting ranges of the total hemoglobin and HbA1c assays were 6.0-22.0 g/dL and 0.2-2.5 g/dL, respectively. In contrast to the glucose assay, automatic dilution of samples was not available for the HbA1c assay. So, when either the total hemoglobin or HbA1c concentration exceeded its respective upper limit, the original samples were resuspended by gentle inversion, diluted with an equal volume of saline, and re‑analyzed. However, multiplying by the dilution factor was not necessary to estimate the pre-dilution HbA1c (%), because total hemoglobin and HbA1c were both diluted. The assay yielded the quantitative concentrations of HbA1c and total hemoglobin on which HbA1c in Système International7 units (mmol/mol) = 1000 x HbA1c (g/dl) / Hb (g/dl) and in National Glycohemoglobin Standardization Program7 units (%) = HbA1c (mmol/mol) x 0.09148 + 2.152 were computed internally. The latter percentages (H5HBA1C) ranged from 4.1% to 14.0%. 4.2.3 Internal Quality Control The Ortho-VITROS system was maintained daily by cleaning machine components, replacing all reagents, and running known quality controls samples (Ortho Clinical Diagnostics, Raritan, NJ). Internal quality controls consisted of VITROS Chemistry Products %A1c Performance Verifier I, which was typically 40-45 mmol/mol HbA1c, 6.0-6.2% HbA1c, and VITROS %A1c Performance Verifier II, which was typically 85-110 mmol/mol HbA1c, 10-13% HbA1c. The values assigned to the VITROS Chemistry Products Calibrator Kit 31 for HbA1c (%) are traceable to the IFCC (International Federation of Clinical Chemistry and Laboratory Medicine) Reference Method.8 Calibration parameters were automatically assessed by the VITROS 5600 system against a set of quality parameters built into the machine. Failure to meet any of the predefined quality parameters results in a failed calibration. The calibration report was used in conjunction with quality control results to determine the validity of a calibration.
5. External Quality Control 5.1 Reliability Within a race/ethnicity- and sex-stratified random sample of 103 Add Health respondents (81% fasting ≥ 8 hours) among whom venous blood was collected twice, on average 14.3 (95% confidence interval: 13.0–15.5) days apart, typically by the same FE and at approximately the same time of day, the reliability of glucose (mg/dl) and HbA1c (%) was estimated as an intra-class correlation coefficient (ICC, 95% confidence interval) [Exhibit 7]. The estimates suggest that the home exam venous blood collected at Add Health Wave V yields a comparably reliable measure of HbA1c and much more reliable measure of glucose than the dried capillary whole blood spots collected at Wave IV.
Add Health is a program project directed by Kathleen Mullan Harris and designed by J. Richard Udry, Peter S. Bearman, and Kathleen Mullan Harris at the University of North Carolina at Chapel Hill, and funded by grant P01-HD31921 from the Eunice Kennedy Shriver National Institute of Child Health and Human Development, with cooperative funding from 23 other federal agencies and foundations. Information on how to obtain the Add Health data files is available on the Add Health website (http://www.cpc.unc.edu/addhealth).
16 | P a g e
Glucose, NaFl/KOx (mg/dl)
Glu
cose
, SST
(mg/
dl)
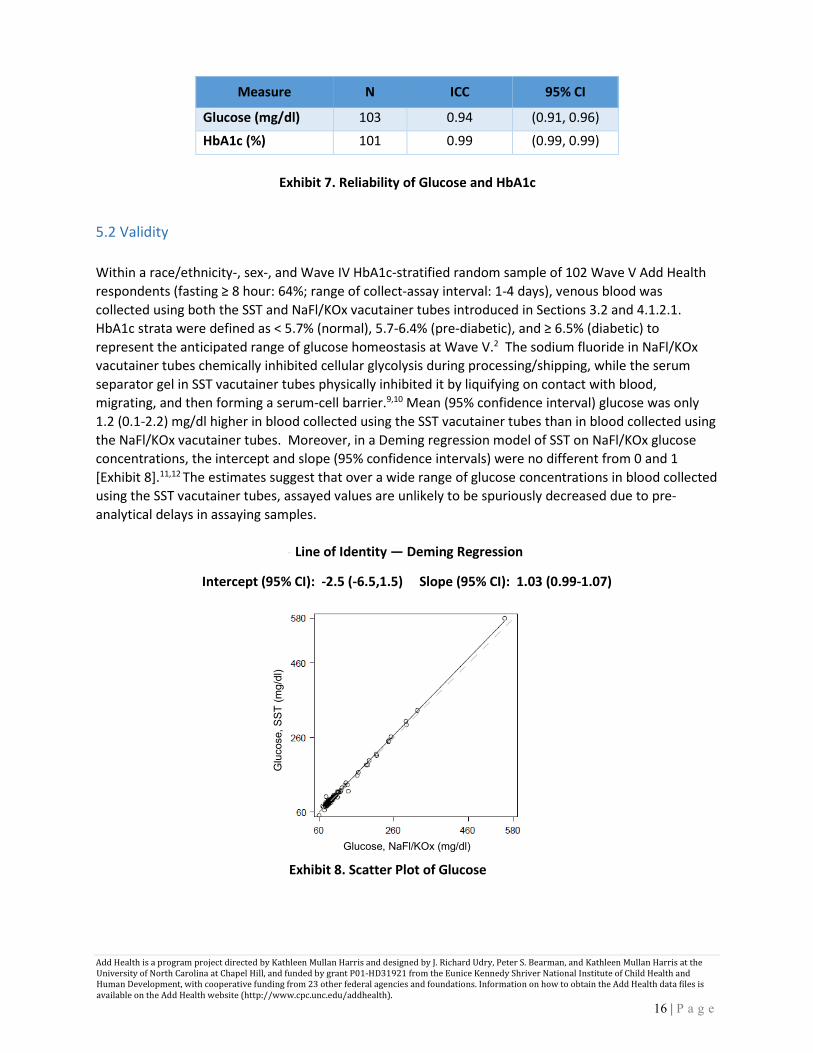
Measure N ICC 95% CI
Glucose (mg/dl) 103 0.94 (0.91, 0.96)
HbA1c (%) 101 0.99 (0.99, 0.99)
Exhibit 7. Reliability of Glucose and HbA1c
5.2 Validity Within a race/ethnicity-, sex-, and Wave IV HbA1c-stratified random sample of 102 Wave V Add Health respondents (fasting ≥ 8 hour: 64%; range of collect-assay interval: 1-4 days), venous blood was collected using both the SST and NaFl/KOx vacutainer tubes introduced in Sections 3.2 and 4.1.2.1. HbA1c strata were defined as < 5.7% (normal), 5.7-6.4% (pre-diabetic), and ≥ 6.5% (diabetic) to represent the anticipated range of glucose homeostasis at Wave V.2 The sodium fluoride in NaFl/KOx vacutainer tubes chemically inhibited cellular glycolysis during processing/shipping, while the serum separator gel in SST vacutainer tubes physically inhibited it by liquifying on contact with blood, migrating, and then forming a serum-cell barrier.9,10 Mean (95% confidence interval) glucose was only 1.2 (0.1-2.2) mg/dl higher in blood collected using the SST vacutainer tubes than in blood collected using the NaFl/KOx vacutainer tubes. Moreover, in a Deming regression model of SST on NaFl/KOx glucose concentrations, the intercept and slope (95% confidence intervals) were no different from 0 and 1 [Exhibit 8].11,12 The estimates suggest that over a wide range of glucose concentrations in blood collected using the SST vacutainer tubes, assayed values are unlikely to be spuriously decreased due to pre-analytical delays in assaying samples.
Add Health is a program project directed by Kathleen Mullan Harris and designed by J. Richard Udry, Peter S. Bearman, and Kathleen Mullan Harris at the University of North Carolina at Chapel Hill, and funded by grant P01-HD31921 from the Eunice Kennedy Shriver National Institute of Child Health and Human Development, with cooperative funding from 23 other federal agencies and foundations. Information on how to obtain the Add Health data files is available on the Add Health website (http://www.cpc.unc.edu/addhealth).
17 | P a g e
6. Constructed Variables 6.1 Fasting Status [H5FASTTM] During the home exam before blood was collected, all respondents were asked the following question: “At what time did you last eat or drink anything other than water, including sugar-containing candy or gum?” Responses to the question were recorded in hours and minutes and designated AM or PM. All respondents were then asked, “Was that today or yesterday?” To calculate fasting times, responses to the above question were subtracted from the tablet start-of-blood collection date/time stamp. Data on fasting times outside the 0-23.9-hour range were recoded to missing among 60 respondents. Values that were deemed implausible (≥ 24 hours) were assigned a code of 999, while negative values that were due to unrealistic computer date/time stamps were assigned a code of -999. 6.2 Fasted for Eight Hours or More [H5FASTGL]
Respondents who were fasting (≥ 8 hours) and non-fasting (< 8 hours) at the time of blood collection were identified (1,0). 6.3 Classification of Fasting Glucose [H5CFGLU] The classification of glucose concentrations among Add Health respondents who were fasting (≥ 8 hours) at the time of blood collection was constructed based on the 2020 American Diabetes Association clinical practice recommendations for the diagnosis and classification of diabetes.2 Three classes of fasting glucose are defined in Exhibit 9:
6.4 Classification of Non-Fasting Glucose [H5CNFGLU] The classification of glucose concentrations among Add Health respondents who were non- fasting (< 8 hours) at the time of blood collection was constructed based on the 2020 American Diabetes Association clinical practice recommendations for the diagnosis and classification of diabetes.2 Two classes of non-fasting glucose are defined in Exhibit 10:
Add Health is a program project directed by Kathleen Mullan Harris and designed by J. Richard Udry, Peter S. Bearman, and Kathleen Mullan Harris at the University of North Carolina at Chapel Hill, and funded by grant P01-HD31921 from the Eunice Kennedy Shriver National Institute of Child Health and Human Development, with cooperative funding from 23 other federal agencies and foundations. Information on how to obtain the Add Health data files is available on the Add Health website (http://www.cpc.unc.edu/addhealth).
18 | P a g e
Classification Non-Fasting
Glucose (mg/dl)
ADA Class
1 < 200 Normal 2 ≥ 200 Diabetes
Exhibit 10. Classification of Non-Fasting Glucose
6.5 Classification of HbA1c [H5CHBA1C] The classification of HbA1c among Add Health respondents was constructed without regard to fasting status at the time of blood collection based on the 2020 American Diabetes Association clinical practice recommendations for the diagnosis and classification of diabetes.2 Three classes of HbA1c are defined in Exhibit 11:
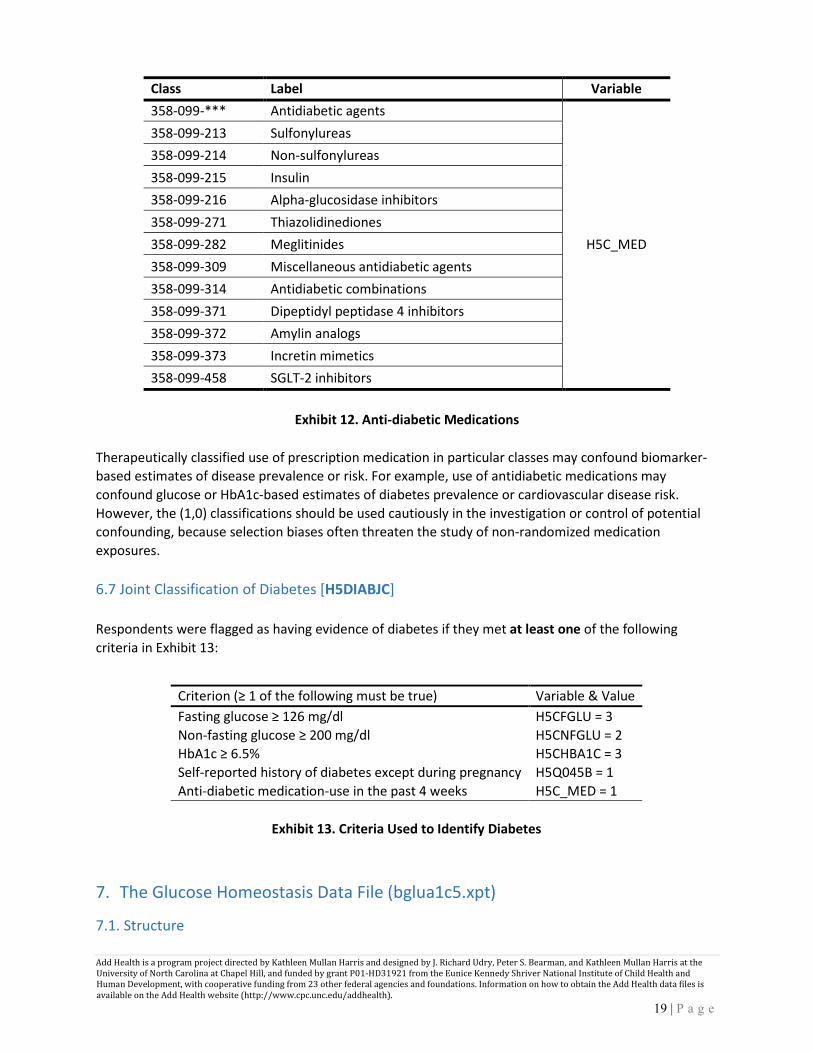
6.6 Anti-diabetic Medication Use [H5C_MED] Use of a prescription medication in the past four weeks in one or more of the therapeutic classes listed in Exhibit 12 was assigned a value of 1. Non-use of a prescription medication in the past four weeks in one of the therapeutic classes listed below was assigned a value of 0.
Add Health is a program project directed by Kathleen Mullan Harris and designed by J. Richard Udry, Peter S. Bearman, and Kathleen Mullan Harris at the University of North Carolina at Chapel Hill, and funded by grant P01-HD31921 from the Eunice Kennedy Shriver National Institute of Child Health and Human Development, with cooperative funding from 23 other federal agencies and foundations. Information on how to obtain the Add Health data files is available on the Add Health website (http://www.cpc.unc.edu/addhealth).
19 | P a g e
Class Label Variable 358-099-*** Antidiabetic agents
Therapeutically classified use of prescription medication in particular classes may confound biomarker-based estimates of disease prevalence or risk. For example, use of antidiabetic medications may confound glucose or HbA1c-based estimates of diabetes prevalence or cardiovascular disease risk. However, the (1,0) classifications should be used cautiously in the investigation or control of potential confounding, because selection biases often threaten the study of non-randomized medication exposures. 6.7 Joint Classification of Diabetes [H5DIABJC] Respondents were flagged as having evidence of diabetes if they met at least one of the following criteria in Exhibit 13: 7. The Glucose Homeostasis Data File (bglua1c5.xpt)
7.1. Structure
Criterion (≥ 1 of the following must be true) Variable & Value Fasting glucose ≥ 126 mg/dl H5CFGLU = 3 Non-fasting glucose ≥ 200 mg/dl H5CNFGLU = 2 HbA1c ≥ 6.5% H5CHBA1C = 3 Self-reported history of diabetes except during pregnancy H5Q045B = 1 Anti-diabetic medication-use in the past 4 weeks H5C_MED = 1
Exhibit 13. Criteria Used to Identify Diabetes
Add Health is a program project directed by Kathleen Mullan Harris and designed by J. Richard Udry, Peter S. Bearman, and Kathleen Mullan Harris at the University of North Carolina at Chapel Hill, and funded by grant P01-HD31921 from the Eunice Kennedy Shriver National Institute of Child Health and Human Development, with cooperative funding from 23 other federal agencies and foundations. Information on how to obtain the Add Health data files is available on the Add Health website (http://www.cpc.unc.edu/addhealth).
20 | P a g e
The structure of the disseminated glucose homeostasis data file is flat. This means that it is a respondent-level data file, where each respondent has one and only one record. The respondent’s identifying number (the AID variable) will appear in the data file only once. 7.2. Contents The glucose homeostasis data file includes the variables below, which are described in the corresponding codebook documentation that also contains frequencies.
7.3. Use Despite attempts to harmonize methods across Waves IV and V, important inter-Wave differences in protocols, biospecimens, assays, and data quality exist, as grey-highlighted here and above. Their existence suggests that the measures of glucose homeostasis described in Sections 1-6 may not be readily comparable from wave to wave. Caution should therefore be exercised when leveraging repeated measures of glucose homeostasis from Wave IV-V, whether they are primary measures or constructed classifications. Indeed, the merit of pre-analytical z-transformation or quantile-based classification of Wave IV-V biomarkers (glucose; HbA1c) and the potential pitfall otherwise associated with equating values in their original units (mg/dl; %) across visits should be carefully considered before using these data.
Variable Name Variable Description AID Respondent Identifier H5GLUCOS Glucose (mg/dl) H5HBA1C Hemoglobin A1c (HbA1c, %) H5FASTTM Hours since last ate H5CFGLU Classification of fasting glucose H5CNFGLU Classification of non-fasting glucose H5CHBA1C Classification of HbA1c H5Q045B Q045b Ever diagnosed with diabetes H5C_MED Flag: Anti-diabetic medication use H5DIABJC Diabetes joint classification
Add Health is a program project directed by Kathleen Mullan Harris and designed by J. Richard Udry, Peter S. Bearman, and Kathleen Mullan Harris at the University of North Carolina at Chapel Hill, and funded by grant P01-HD31921 from the Eunice Kennedy Shriver National Institute of Child Health and Human Development, with cooperative funding from 23 other federal agencies and foundations. Information on how to obtain the Add Health data files is available on the Add Health website (http://www.cpc.unc.edu/addhealth).
Harris MK, Add Health Wave IV Documentation: Measures of Glucose Homeostasis. UNC Chapel Hill: Carolina Population Center, 2012. Available from: https://doi.org/10.17615/C64D4P
2. American Diabetes Association. Classification and Diagnosis of Diabetes: Standards of Medical Care in Diabetes—2020. Diabetes Care 2020;43(S1):S14-S31.
3. Ortho-Clinical Diagnostics, VITROS Chemistry Products GLU slides Instructions for Use, Version 6.0, Pub. No. MP2-8_EN, Rochester, NY, 2015.
4. Curme HG, Columbus RL, Dappen GM, Eder TW, Fellows WD, Figueras J, Glover CP, Goffe CA, Hill DE, Lawton WH, Muka EJ, Pinney JE, Rand RN, Sanford KJ, Wu TW. Multilayer Film Elements for Clinical Analysis. Clin. Chem 1978;24:1335-1342.
5. Trinder P. Determination of Glucose in Blood Using Glucose Oxidase with an Alternative Oxygen Receptor. Ann Clin Biochem 1969;6:24.
7. Hanas R, John G, on behalf of the International HbA1c Consensus Committee. 2010 Consensus Statement on the Worldwide Standardization of the Hemoglobin A1c Measurement Clin Chem 2010;56:1362-1364.
8. Finke A, Kobold U, Hoelzel W, Weykamp C, Miedema K, Jeppsson JO. Approved IFCC Reference Method for the Measurement of HbA1c in Human Blood. Clin Chem Lab Med 2002;40(1):78-89.
9. Fernandez L, Jee P, Klein M, Fischer P, Perkins SL, Brooks SPJ. A comparison of glucose concentration in paired specimens collected in serum separator and fluoride/potassium oxalate blood collection tubes under survey 'field' conditions. Clin Biochem 2013;46(4-5):285-288.
10. Rosa-Fraile M, Sampedro A, Rodriguez-Granger J, Camacho E, Manrique E. Suitability of frozen serum stored in gel separator primary sampling tubes for serological testing. Clin Diagn Lab Immunol 2004;11:219-221.
11. Cornbleet PJ, Gochman N. Incorrect least-squares regression coefficients in method-comparison analysis. Clin Chem 1979;25(3):432-438.
12. Deal AM, Pate VW, El Rouby S. Paper CC-014. A SAS® Macro for Deming regression, 2011. Available at http://analytics.ncsu.edu/sesug/2009/CC014.Deal.pdf.