10.1177/0022427803256229ARTICLEJOURNAL OF RESEARCH IN CRIME AND DELINQUENCYKleck / GUN OWNERSHIP
MEASURES OF GUN OWNERSHIPLEVELS FOR MACRO-LEVEL
CRIME AND VIOLENCE RESEARCH
GARY KLECK
Valid measures of macro-level gun levels are essential to assessing the impact of gunlevels on crime and violence rates, yet almost all prior research on this topic usesproxies that are either invalid or whose validity has been assumed rather than demon-strated. The present study uses city, state, cross-national, and time series data toassess the criterion validity of over two dozen gun indicators. The criterion measuresused are primarily direct survey measures of household gun prevalence. The resultsindicate that (1) most measures used in past research have poor validity, making pastfindings uninterpretable, (2) the best measure for cross-sectional research is the per-centage of suicides committed with guns, and (3) there are no known measures thatare valid indicators of trends in gun levels, making credible longitudinal research onthe subject impossible at present.
Keywords: guns; violence; measurement
Macro-level research on the possible links between guns and violence isessential because there is no other way to estimate the net effects of societalor community gun levels on crime or violence rates. Studies that attempt tolink the gun ownership of individuals to their experiences as victims (e.g.Kellermann et al. 1993) do not effectively determine how an individual’s riskof victimization is affected by gun ownership of other people, especiallythose not living in the gun owner’s own household. Likewise, studies ofcrime incidents (e.g., Kleck and Delone 1993) can address the effects of ac-tual offensive gun use by offenders and defensive gun use by victims on theoutcome of the incident (e.g., injury to the victim), but cannot assess whethergun ownership among potential victims deters criminals from attemptingcrimes in the first place, or whether gun ownership encourages offenders toseek hostile contact with victims in the first place. If gun ownership by pro-spective victims has deterrent or other violence-reducing effects, this effect
A previous version of this article was presented at the annual meetings of the American Soci-ety of Criminology in Atlanta, Georgia, November 7-10, 2001.
cannot be assessed by studying individuals because the effect would not belimited to gun owners, and might not even differ between owners and non-owners (Kleck and Kates 2001:153-54). Thus, the population-wide com-bined impact of both violence-increasing and violence-decreasing effects ofgun ownership can only be assessed using macro-level research.
There are dozens of macro-level studies of the impact of gun ownershiplevels on rates of homicide, other crimes, and suicide rates, using a diversearray of gun measures. Usually the gun measure is used as an independentvariable (predictor) in models of violence rates, while in other studies gunlevels are the dependent variable, and in a few others, a two-way relationshipbetween gun levels and violence rates is assumed. With a few limited excep-tions, the gun measures have not been subjected to any validation. This articleassesses more than two dozen previously used or potential gun measures andreports the results of validity checks. The objective is to determine the bestmacro-level indicators of gun levels.
How consequential can measurement error be with respect to conclusionsabout the effect of gun levels on crime or violence rates? Moody and Marvell(2001) analyzed national time series data using Duggan’s (2001) measure ofgun levels, the rate of subscriptions to Guns & Ammo magazine, and con-cluded that Duggan had overestimated the effect of guns on homicide by afactor of four, while underestimating the effect of homicide on gun levels byan equal amount. As a result, he probably got his conclusions “completelybackwards.” Moody and Marvell (2001) attributed Duggan’s (2001) errone-ously reversed interpretation of his evidence to his failure to recognize theproblems in using imperfect proxies and the fact that the elasticity of theproxy with respect to actual gun levels (roughly analogous to our validitycorrelations) appears to be substantially less than one—they estimate it to beabout .26. In this instance, the use of an imperfect proxy appears to have beendisastrous. A proxy clearly is not sufficiently valid merely because it has anonzero association with the criterion.
METHODS
The most direct feasible measure of gun availability would probably beone based on surveys in which people were directly asked whether they ownguns. Surveys themselves are subject to errors and probably underestimategun ownership, perhaps by 5 percent to 13 percent (Kleck 1997:65-9), butwould still be acceptable ways of measuring cross-area variation in gun lev-els, when and where available, as long as underreporting of gun ownershipwas relatively similar across areas or time periods. Unfortunately, surveysasking gun ownership questions are usually carried out either in a single
4 JOURNAL OF RESEARCH IN CRIME AND DELINQUENCY
limited area, such as one city or state, or are fielded across a nation, but with-out enough sample cases in each state, city, county, or metropolitan area toprovide meaningful estimates for most subnational areas.
Therefore, less direct proxies that use data that are available for large num-bers of units must be used. We can nevertheless use survey measures to per-form validity checks on the indirect indicators, by studying the more limitednumber of areas for which survey data are available. In this study, survey esti-mates of household gun and handgun prevalence are used as the criteria forjudging the validity of the various proxies.
Because survey measures are themselves imperfect, this can weakenindicator-criterion correlations, a problem inevitably afflicting all criteriaused to assess measurement validity. If survey measures were subject only torandom error such as sampling error, the effect would generally be to biasassociations toward zero, but systematic errors, such as patterns of responseerrors or patterned changes in response rates, could bias associations in anydirection. For example, a sharp one-time drop of about seven percentagepoints in household gun prevalence occurred in national surveys withinmonths of the 1994 enactments of the federal Assault Weapons ban and theBrady Act, following decades near-constant gun prevalence in national sur-veys. Given the implausibility of a virtually overnight drop of this magnitudeafter 35 years of stable levels, this “decrease” was very likely artificial—anartifact of increased gun owner unwillingness to report gun ownership to sur-vey interviewers. Because it occurred in the middle of the 1991-2000declines in national violence rates, it contributed to a positive guns-violenceassociation over time that was probably at least partly synthetic.
The validity checks consisted of computing “validity coefficients”(Nunnally 1967:76-9) consisting of Pearson correlation coefficients betweendirect survey measures (the criterion measures) and the various indirect indi-cators of gun levels. The correlations in Tables 1 through 4 are all based ondata weighted by the square root of the population of each place, divided bythe average, within each sample, of the square root of the population (this laststep avoids artificially inflating sample sizes and consequently distorting sig-nificance levels). The rationale for this weighting scheme is simply that itgives greater influence to aggregates representing the experience of largernumbers of individual persons. Variables were expressed in natural logs sothat their distributions were more nearly normal and the effect of exception-ally high observations was reduced. To permit logging all observations,including zeros, .1 was added to each variable before taking its natural log.Results were substantially the same (i.e. the same in sign, the same as towhether statistically significant, and roughly the same in ordering of relativevalidity among indicators) regardless of whether variables were logged.1
Kleck / GUN OWNERSHIP 5
Possible proxies were assessed with respect to their validity in measuringboth cross-sectional and cross-temporal variation in gun levels. The validitychecks were based on (1) a very rich data set pertaining to a limited set of 45large U.S. cities, (2) a more limited data set pertaining to a much larger sam-ple of 1,078 U.S. cities, (3) a state-level data set, (4) a cross-national sampleof 36 nations, and (5) a U.S. national-level annual time series data set cover-ing the period 1972 to 1999.
The following 25 macro-level indicators of gun levels were assessed. Thefirst four listed are direct survey measures used as validity criteria, while therest are indirect measures that either have been used in prior macro-levelresearch or are available for use in future research. The sources noted are gen-erally the ones used for 1980 data, but data for later years are available in laterversions of the same sources.
Measures Used in Table 1
1. Percentage households with gun. The percentage of households interviewedin the General Social Surveys (GSS) that reported a gun in their household. Inthe 45-city data set, this measure, and the others from the GSS, were computedonly for the 45 cities for which one could cumulate at least 30 sample casesacross all 11 of the GSS surveys from 1973 to 1989 (bracketing 1980) thatasked gun ownership questions (Davis and Smith 1994).
2. Percentage households with handgun. The same as the previous measure, butapplying only to handguns.
3. Percentage respondents own gun. The percentage of GSS respondents that re-ported personally owning a gun of their own.
4. Percentage respondents own handgun. The percentage of GSS respondentsthat reported one or more handguns in their household and also reported per-sonally owning a gun of their own.
5. Percentage suicides with guns (PSG). The percentage of suicides committedin 1979 to 1982 with a gun (Inter-University Consortium for Political and So-cial Research 1985).
6. Percentage homicides with guns. The percentage of homicides committed in1979 to 1982 with a gun (Inter-University Consortium for Political and SocialResearch 1985).
7. Percentage robberies with guns. The percentage of robberies committed witha gun, 1979 to 1980 (from unpublished Uniform Crime Reports data for cities)(Inter-University Consortium for Political and Social Research 1983).
8. Percentage aggravated assaults with guns. The percentage of aggravated as-saults committed with a gun, 1979 to 1980 (from unpublished Uniform CrimeReports data for cities) (Inter-University Consortium for Political and SocialResearch 1983).
6 JOURNAL OF RESEARCH IN CRIME AND DELINQUENCY
9. Fatal gun accident rate. Fatal gun accidents per 100,000 resident population,1979 to 1981 (Inter-University Consortium for Political and Social Research1985).
10. Guns share of stolen property. The percentage of the dollar value of all prop-erty stolen that was accounted for by guns, 1979 to 1981 (from unpublishedUniform Crime Reports data on property stolen and recovered) (Inter-University Consortium for Political and Social Research 1984).
11. Gun/outdoor magazine subscriptions factor. A principle components factorscore based on subscriptions to each of the four highest circulation gun orhunting magazines (Guns & Ammo, Field and Stream, Outdoor Life, andSports Afield) in 1979 to 1982, per 100,000 resident population, for the countyin which the city is located (Audit Bureau of Circulations 1979-1982). Threewere added to all factor scores to insure that they were positive and couldtherefore be logged.
12. Guns & Ammo subscriptions rate. Paid subscriptions to Guns & Ammo maga-zine per 100,000 resident population, for the county in which the city is lo-cated (Audit Bureau of Circulations 1979-1982).
13. Five-item gun indicator factor. A five-item principle components factor, basedon indicators 5 through 8, and 10 (Kleck and Patterson 1993).
14. Cook’s (1979) gun density. The two-item gun measure used by Cook (1979),which is basically an average of indicators (5) and (6).
15. National Rifle Association (NRA) membership. NRA members per 100,000resident population, 1980 (NRA 1985).
16. Hunting license rate. Hunting license holders per 100,000 resident popula-tion, 1980, in the state in which the city is located (U.S. Fish and Wildlife Ser-vice 1982).
17. Weapons arrests per 100 sworn officers. Weapons arrests per 100 sworn policeofficers, 1979 to 1981 (from unpublished Uniform Crime Reports arrest datafor cities—U.S. Federal Bureau of Investigation, no date).
18. Weapons arrests per 100,000 population. Weapons arrests per 100,000 resi-dent population, 1979 to 1981 (from unpublished Uniform Crime Reports ar-rest data for cities—U.S. Federal Bureau of Investigation, no date).
Additional Measures Used in Tables 2 through 5 but Not in Table 1
19. Percentage population that hunts. 1991, state, based on survey (U.S. Fish andWildlife Service 1993).
20. Carry permits rate. Permits to carry a concealed firearm per 1,000 population,1999, state (Bird 2000:275).
21. Federal firearms licensees rate. Federal Firearms License holders (gun deal-ers) per 100,000 population, 1999, state (U.S. Bureau of Alcohol, Tobacco andFirearms 2000).
Kleck / GUN OWNERSHIP 7
22. Gun retailers rate. Federal Firearms License holders, dealers and pawnbro-kers only, per 1,000 population, 1999 (U.S. Bureau of Alcohol, Tobacco andFirearms 2000).
23. Cumulated gun stock rate. Cumulated (as of the end of the calendar year) num-ber of guns manufactured in United States, or imported, minus guns exported,per 100,000 population (Kleck [1997:96-7] and sources cited therein).
24. Cumulated handgun stock rate. Same as previous indicator, pertaining tohandguns only.
25. Weapons arrests as percentage of total arrests. (From unpublished UniformCrime Reports arrest data for cities—U.S. Federal Bureau of Investigation, nodate).
Indicators 7, 8, and 10 were based on data from the Uniform CrimeReports Return A data set. Close examination of these data indicate both agreat deal of missing data and many clearly implausible values, so theyshould be regarded with considerable skepticism.
RESULTS
Indicators of Cross-Sectional Variation in Gun Levels
CROSS-CITY CORRELATIONS—45 LARGE U.S. CITIES, 1980
The richest data set of potential gun level indicators pertains to a sample of45 large U.S. cities where there were enough GSS cases to estimate house-hold gun prevalence. Table 1 displays the correlations among 18 differentpotential indicators of gun ownership levels, based on all 45 cities for whichat least 30 respondents were interviewed in the 11 General Social Surveysthat were fielded with gun ownership questions from 1973 to 1989. Thesesurveys have a response rate of 77 percent (Davis and Smith 1994). Thereader should note that indicator 13 overlaps with indicators 5 through 8 and10, while indicator 14 is composed of the average of indicators 5 and 6, socorrelations involving these variables are partly artifactual, due to commoncomponents.
Leaving aside these artifact-biased correlations and those among the sur-vey criterion measures themselves, the indicators with the highest correla-tions with the survey criterion measures are indicators 5, 14, and 13: the per-centage of suicides committed with guns (PSG), Cook’s (1991) 2-itemmeasure, and Kleck and Patterson’s (1993) 5-item factor. The latter twoproxies both contain PSG as a component, so all of the top three indicatorswere variants of PSG.
8 JOURNAL OF RESEARCH IN CRIME AND DELINQUENCY
TAB
LE
1:
Val
idit
y o
f G
un
Ind
icat
ors
acr
oss
45
Lar
ge
Cit
ies
wit
h S
urv
ey M
easu
res,
1980
(al
l var
iab
les
are
log
ged
)
Pea
rson
Cor
rela
tions
/One
-Tai
led
Sig
nific
ance
(2)
(3)
(4)
(5)
(6)
(7)
(8)
(9)
(10)
(11)
(12)
(13)
(14)
(15)
(16)
(17)
(18)
(1)
% H
ouse
hold
s w
ith g
un (
GS
S)
.91
.85
.85
.87
.35
.43
.37
.38
.66
.63
.70
.74
.82
.40
.37
.60
.13
.00
.00
.00
.00
.00
.00
.01
.03
.02
.00
.00
.00
.00
.00
.01
.00
.20
(2)
% H
ouse
hold
s w
ith h
andg
un (
GS
S)
.82
.89
.78
.40
.47
.38
.36
.53
.40
.55
.71
.77
.18
.17
.60
.19
.00
.00
.00
.00
.00
.00
.01
.00
.00
.00
.00
.00
.11
.13
.00
.10
(3)
% R
espo
nden
ts o
wn
gun
(GS
S)
.92
.64
.20
.26
.25
.33
.56
.54
.53
.52
.57
.35
.20
.38
–.09
.00
.00
.07
.04
.05
.02
.00
.00
.00
.00
.00
.01
.10
.00
.28
(4)
% R
espo
nden
ts o
wn
hand
gun
(GS
S)
.71
.33
.35
.32
.36
.54
.49
.55
.61
.67
.29
.13
.39
–.02
.00
.00
.01
.02
.01
.00
.00
.00
.00
.00
.03
.21
.00
.46
(5)
% S
uici
des
with
gun
s.4
3.5
3.5
0.3
8.6
5.6
3.7
2.8
4.9
2.3
6.2
4.5
9.2
4.0
0.0
0.0
0.0
0.0
0.0
0.0
0.0
0.0
0.0
1.0
6.0
0.0
5(6
) %
Hom
icid
es w
ith g
uns
.62
.67
.44
.08
-.10
.08
.73
.68
-.27
.09
.30
.27
.00
.00
.00
.29
.25
.29
.00
.00
.04
.28
.02
.04
(7)
% R
obbe
ries
with
gun
s.7
9.4
0.2
6.2
2.3
6.8
0.6
3.0
5.0
3.5
3.4
3.0
0.0
0.0
4.0
7.0
1.0
0.0
0.3
6.4
2.0
0.0
0(8
) %
Agg
rava
ted
assa
ults
with
gun
s.3
7.1
8.2
0.2
0.8
0.6
0–.
01.1
4.3
8.3
7.0
1.1
1.0
9.0
9.0
0.0
0.4
8.1
8.0
1.0
1(9
) Fa
tal g
un a
ccid
ents
/100
k po
pula
tion
.24
.04
.22
.48
.48
.17
.07
.50
.38
.06
.41
.07
.00
.00
.13
.32
.00
.00
(10)
% $
val
ue s
tole
n pr
oper
ty d
ue to
gun
s.4
9.4
9.5
8.5
7.5
2.2
8.3
6–.
08.0
0.0
0.0
0.0
0.0
0.0
3.0
1.3
1(1
1) F
acto
r sc
ore
for
4 gu
n/ou
tdoo
r m
agaz
ine
subs
crip
tion
rate
s.7
0.4
0.4
3.7
2.2
6.3
4.0
8.0
0.0
0.0
0.0
0.0
4.0
1.3
0
9
(con
tinue
d)
(12)
Gun
s &
Am
mo
subs
crip
tions
per
100
,000
popu
latio
n.5
0.5
6.5
7.1
2.4
0.1
5.0
0.0
0.0
0.2
1.0
0.1
6(1
3) 5
-item
gun
indi
cato
r fa
ctor
.92
.16
.21
.60
.34
.00
.14
.09
.00
.01
(14)
Coo
k’s
gun
dens
ity.1
7.2
7.5
9.2
6.1
3.0
3.0
0.0
4(1
5) N
RA
mem
bers
per
100
pop
ulat
ion
.22
.16
–.01
.07
.15
.48
(16)
Hun
ting
licen
se h
olde
rs p
er 1
00,0
00 p
opul
atio
n.2
3–.
01.0
7.4
6(1
7) W
eapo
ns a
rres
ts p
er 1
00 s
wor
n of
ficer
s.7
5.0
0(1
8) W
eapo
ns a
rres
ts p
er 1
00,0
00 p
opul
atio
n
TAB
LE
1:(
con
tinu
ed)
Pea
rson
Cor
rela
tions
/One
-Tai
led
Sig
nific
ance
(2)
(3)
(4)
(5)
(6)
(7)
(8)
(9)
(10)
(11)
(12)
(13)
(14)
(15)
(16)
(17)
(18)
10
It is not unreasonable to suppose that multiple-indicator indexes would bepreferable to single-indicator measures. For example, Cook (1991:43)appealed to “measurement theory” to justify his use of the percentage ofhomicides with guns, in addition to PSG, to measure gun availability. Heargued that combining both measures would make for a “more reliable indi-cator.” In fact, the additional indicators included in Cook’s two-item measure(indicator 14) and in the five-item gun factor used by Kleck and Patterson(1993) (indicator 13), do not add anything to the validity of the measure oversimply using PSG (indicator 5). For example, while PSG alone showed a cor-relation of .87 with survey-measured household gun prevalence, Cook’s(1991) addition of the percentage of homicides committed with guns actuallydegrades the measure’s validity slightly, reducing the validity correlationdown to .82. Adding the homicide percentage-gun measure (and similar rob-bery and assault measures) is especially problematic because it may, as dis-cussed later, reflect the violence proneness of the population, which wouldinfluence violence rates independently of gun levels. Thus, adding such com-ponents to a gun index would create a positive association with violence ratesthat was due to effects of the population’s violence proneness rather than gunlevels.
Because it is more strongly correlated with the criterion measures, and onthe grounds of simplicity and ease of data gathering, the single-item measure,PSG, is preferable to the multiple indicator measures. PSG therefore is thebest indicator to use in research across cities among those evaluated here.
Indicators were generally less strongly correlated with the survey measureof respondents’ personal gun ownership than with the survey measure ofhousehold gun ownership, perhaps because the additional question needed todetermine whether the respondent personally owns guns provides an addi-tional opportunity for response error. Correlations involving survey mea-sures of handgun ownership were likewise weaker than those involving sur-vey measures of gun ownership in general. Again, the reason might be theadditional opportunity for response error provided by the question establish-ing whether any of the household’s guns were handguns.
Some of the less successful indicators may be useful measures of someconcept, but not of gun levels. The weapons arrest rate measures (indicators17 and 18) are probably more appropriately treated as measures of policeeffort to enforce gun laws (and other weapons laws) than of gun ownershiplevels. Likewise, the gun magazine subscription rates and hunting rate mea-sure (indicators 11, 12, and 16) may serve better as indicators of interest inhunting and other gun-related outdoor recreation (as in Kleck and Patterson1993), or as indicators of a firearms-related “sporting culture” (Bordua andLizotte 1979), than of gun levels per se.
Kleck / GUN OWNERSHIP 11
Note that the Guns & Ammo measure (indicator 12), recently used byDuggan (2001), is distinctly inferior to PSG as an indicator of cross-sectionalvariation in gun levels. While Duggan mentioned PSG (p. 1092), he never-theless used the inferior Guns & Ammo measure, even though PSG can becomputed for each year for counties and states, the units of analysis used byDuggan. He went to considerable lengths to persuade readers that his novelmeasure was adequate, yet never compared its validity with PSG. Instead, hecompared his proxy only with even more inferior measures such the fatal gunaccident rate or NRA membership (pp. 1089-1094). This illustrates theimportance of comparing validity levels among the better alternative mea-sures available, rather than simply using whatever proxy has a significantassociation with criterion measures.
PSG can be obtained for the United States as a whole, all Census regions,all states, all counties, and large cities (population 100,000 or larger), usingthe individual death certificate data in the Mortality Detail File computertapes distributed by the National Center for Health Statistics (e.g., Inter-university Consortium for Political and Social Research [ICPSR] 1985).
“Part III” versions of these tapes, unlike the public use versions, permitidentification of the county of death even for the smallest counties (U.S.National Center for Health Statistics 2001). It is even available for at least 36nations. Thus the measure is very flexible and widely usable. It is also espe-cially attractive because mortality data are themselves measured so accu-rately, and because it is easy for medical examiners to distinguish gun sui-cides from other suicides (Kleck 1988). The measure cannot be used whereone is interested in the impact of gun levels on suicide rates, because of acommon component problem—the number of gun suicides would be a com-ponent in the numerator of both PSG and the suicide rate.
PSG is impossible to compute for units with zero suicides, and unstablefor those with just a few. The smaller the unit of analysis, the fewer suicidesthere will be for the average unit, making it necessary to cumulate multipleyears of data for smaller-population counties or cities. Even cumulating mul-tiple years, however, might not be adequate for the very smallest counties,which might have no more than one or two suicides even over a decade. Con-sequently, use of this indicator may have to be confined to places with mini-mally large populations (e.g., 25,000 or larger). But this is a modest limita-tion given that cities of this size accounted for 72 percent of the violent crimein the United States in 2000 (U.S. Federal Bureau of Investigation 2001:195).
CROSS-CITY CORRELATIONS—1,077 U.S. CITIES, 1990
As a check on the results from the limited set of large cities, especiallythose pertaining to the validity of measures based on magazine subscription
12 JOURNAL OF RESEARCH IN CRIME AND DELINQUENCY
rates, and to see if some results can be generalized to smaller cities and a morerecent time period, correlations were computing using 1990 data pertainingto all U.S. cities with a population of 25,000 or larger for which there werealso Uniform Crime Reports crime data. In this data set, GSS survey mea-sures are not available, due to insufficient sample cases. Based on the resultsof the previous analysis, PSG is treated as a criterion measure for the sake ofassessing the rest of the potential proxies. Because it is itself an imperfect,though very strong, measure of gun levels, its correlations with other indica-tors may be weaker than would be correlations between these indicators anddirect survey measures.
Table 2 displays the correlations of gun magazine subscription measuresand the hunting rate with PSG. The results are disappointing, with correla-tions that are not very strong, ranging from .34 to .49. This indicates thatmagazine subscription measures and hunting rates cannot be interpreted asvalid measures of gun levels. In particular, Duggan’s (2001) Guns & Ammomeasure is not supported as a valid proxy for gun levels at the city level,because it has only a .48 correlation with PSG, implying that most of the vari-ation in the Guns & Ammo rate is independent of variation in the criterion.Correlations within this data set were probably weakened somewhat becausePSG pertained to cities while the rest of the variables, due to limits on dataavailability, pertained to counties or states.
CROSS-STATE CORRELATIONS—50 STATES AND D.C., 1999
Table 3 displays correlations between the survey measures of householdgun prevalence and various potential gun level indicators, using state data for1999. Two survey measures are available as criteria at the state level. GSSsurvey data were used as a criterion measure, using combined samples of sixsurveys, 1990 to 1998 by states, but were available for only 21 larger statesand were based on samples not designed to be representative of state popula-tions (Smith and Martos 1999:16-17). Alternatively, surveys conducted bythe Centers for Disease Control and Prevention in 1991 to 1995, which diduse samples representative of state populations, were available for 23 states(Powell et al. 1998:970). Most of these state-level proxies were used in thelarge city analysis, but a few new ones were used that were available only forstates. State NRA membership was computed as the sum of the paid circula-tion of magazines received by NRA members (American Rifleman, Ameri-can Hunter, and American Guardian). Nearly all members get one and onlyone magazine, and subscriptions are almost entirely confined to NRA mem-bers (Audit Bureau of Circulations 2000).
For state-level analyses, the best measure once again appears to be PSG,which correlates .92 with the GSS survey measure and .93 with the Center for
Kleck / GUN OWNERSHIP 13
Disease Control survey measure. The results confirm that Cook’s (1991) gundensity measure, which incorporates the percentage of homicides with gunsas well as PSG, does not improve on PSG alone; indeed, it substantiallydegrades the measure’s correlation with the criterion measures (from .92 to.77, using the GSS criterion). The state-level measures newly introduced inTable 3 show weaker correlations with the criterion measures. Survey mea-sures of the prevalence of hunting (indicator 10), the NRA membership rate(11), the rate of people licensed to carry concealed firearms (12), the rate offederal firearms licensees (13), and the rate of gun retailers (14) all evincepoorer validity than PSG. In particular, the concealed carry permit measureused by Stolzenberg and D’Alessio (2000:1469) has mediocre correlationswith the survey measures of gun prevalence (r = .52 and r = .36) and so shouldbe regarded as an inadequate measure of gun levels or of “legal gun availabil-ity,” as Stolzenberg and D’Alessio interpreted it.
CROSS-NATIONAL CORRELATIONS—36 NATIONS, C. 1990
International data based on a direct survey measure of gun ownership areavailable for a small sample of nations. Telephone surveys connected withthe International Crime Surveys (ICS) were conducted in 1989 and 1992 in17 countries, including the United States, asking about gun ownership andmany crime-related topics (Killias 1993). Data on suicides that distinguish
14 JOURNAL OF RESEARCH IN CRIME AND DELINQUENCY
TABLE 2: Validity of Gun Indicators Across 1,078 Cities 25,000+ Population, 1990 (unit towhich data pertain is indicated in parentheses)
Pearson Correlationsa
(2) (3) (4) (5) (6) (7)
(1) % Suicides committed with guns,1987 to 1993 (city) .36 .48 .44 .35 .34 .49
(2) % Population that hunts, 1991 (state)b .05 .67 .68 .67 .54(3) Guns & Ammo subscriptions per 100,000
population (county) .42 .38 .34 .56(4) Field and Stream subscriptions per 100,000
population (county) .97 .92 .91(5) Outdoor Life subscriptions per 100,000 population
(county) .92 .87(6) Sports Afield subscriptions per 100,000 population
(county) .84(7) Gun magazine factor (the 4 magazines above)
(county)
a. One-tailed significance was below .01 for all correlations, which were all based on1,068 to 1,078 cases. Data pertain to 1990 unless otherwise noted.b. Taken from the 1991 National Survey of Fishing, Hunting, and Wildlife-AssociatedRecreation.
15
TAB
LE
3:
Val
idit
y o
f G
un
Ind
icat
ors
Acr
oss
Sta
tes
(in
clu
din
g D
.C.)
,c.1
999
Pea
rson
Cor
rela
tions
/Num
ber
of S
tate
s/O
ne-T
aile
d S
igni
fican
ce
(2)
(3)
(4)
(5)
(6)
(7)
(8)
(9)
(10)
(11)
(12)
(13)
(14)
(1)
% H
ouse
hold
s w
ith g
un, 1
990
to 1
998
(GS
S)
.96
.92
.33
.68
.76
.65
.85
.77
.62
.51
.52
.78
.84
1331
2931
3131
3129
3131
2931
31.0
0.0
0.0
4.0
0.0
0.0
0.0
0.0
0.0
0.0
0.0
0.0
0.0
0(2
) %
Hou
seho
lds
with
gun
, 199
1-19
95 (
CD
C)
.93
.62
.47
.65
.61
.90
.86
.82
.73
.36
.85
.86
2322
2323
2323
2223
2322
2323
.00
.00
.01
.00
.01
.00
.00
.00
.00
.05
.00
.00
(3)
% S
uici
des
with
gun
s, 1
995-
1998
.28
.58
.64
.67
.68
.91
.69
.49
.55
.59
.67
4851
5151
5148
5151
4751
51.0
3.0
0.0
0.0
0.0
0.0
0.0
0.0
0.0
0.0
0.0
0(4
) %
Mur
ders
, man
slau
ghte
rs w
ith g
uns,
199
9.5
7.4
3.2
2–.
10.5
5–.
02–.
23.2
1–.
16–.
1348
4848
4848
4848
4448
48.0
0.0
0.0
7.2
5.0
0.4
3.0
6.0
8.1
4.1
8(5
) %
Rob
berie
s w
ith g
uns,
199
9.6
8.5
2.0
8.6
5.2
7.0
4.1
8.0
5.1
151
5148
5151
5147
5151
.00
.00
.14
.00
.34
.08
.21
.36
.22
(6)
% A
ggra
vate
d as
saul
ts w
ith g
uns,
199
9.5
0.3
3.6
7.4
2.1
5.1
8.1
9.2
651
5148
5151
4751
51.0
0.0
1.0
0.0
0.1
4.1
1.1
0.0
3(7
) Fa
tal g
un a
ccid
ents
/100
k po
pula
tion,
199
5 to
199
8.3
8.6
9.4
5.2
0.2
0.3
6.4
151
4851
5147
5151
.00
.00
.00
.08
.08
.00
.00
(8)
Gun
s &
Am
mo
subs
crip
tions
per
100
,000
pop
ulat
ion
.50
.77
.86
.45
.88
.90
4851
5147
5151
.00
.00
.00
.00
.00
.00
(con
tinue
d)
(9)
Coo
k’s
gun
dens
ity, 1
995-
1998
.54
.26
.57
.41
.48
4848
4448
48.0
0.0
4.0
0.0
0.0
0(1
0) %
Per
sons
16+
who
hun
t, 19
96.7
1.2
2.7
8.8
551
4751
51.0
0.0
7.0
0.0
0(1
1) N
RA
mem
bers
per
1,0
00 p
opul
atio
n, 2
000
.36
.85
.84
4751
51.0
1.0
0.0
0(1
2) C
arry
per
mits
per
1,0
00 p
opul
atio
n, 1
999
.35
.38
4747
.01
.00
(13)
Fed
eral
fire
arm
s de
aler
lice
nsee
s pe
r 10
0,00
0 po
pula
tion,
199
7.9
8 51 .00
(14)
Gun
ret
aile
rs p
er 1
,000
pop
ulat
ion,
200
0
TAB
LE
3 (
con
tinu
ed)
Pea
rson
Cor
rela
tions
/Num
ber
of S
tate
s/O
ne-T
aile
d S
igni
fican
ce
(2)
(3)
(4)
(5)
(6)
(7)
(8)
(9)
(10)
(11)
(12)
(13)
(14)
16
those committed with guns from other suicides are available for 36 nations(Krug, Powell, and Dahlberg 1998), permitting computation of PSG forthese countries.
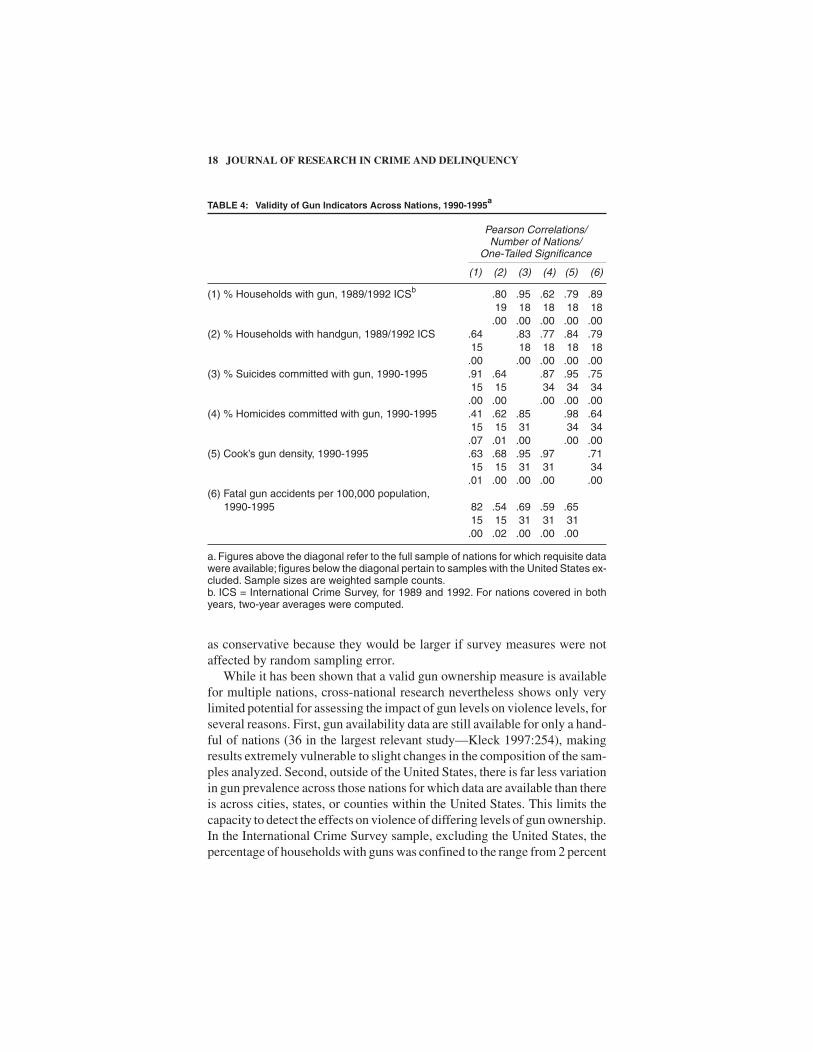
Table 4 displays the results of validity checks using cross-national data.Examining the figures in the upper diagonal, PSG has a virtually perfectassociation with the survey gun ownership measure (r = .95) and a fairly highcorrelation with the survey handgun measure (r = .83) (confirming Killias1993). Thus, once again, PSG appears to be the best indicator of gun levels,though its validity as a measure of handgun levels is weaker. The percentageof homicides committed with guns, on the other hand, is more weakly associ-ated with the total gun and handgun prevalence survey measures. Using theCook (1991) measure once again degrades validity compared to using PSGalone (r = .79 vs. r = .95). The fatal gun accident rate is strongly related to thecriterion measures, though it is inferior to PSG. This measure might thereforebe used in cross-national research on suicide rates, where PSG could not beused.
Previous cross-national research indicates gun-violence associations arehighly sensitive to whether the United States is included (Kleck 1997:254).Because some analyses are likely to be done without the United States forcomparative purposes, the correlations were computed for a sample exclud-ing the United States and are shown in the part of Table 4 below the diagonal.As expected, the correlations are highly sensitive to whether the UnitedStates is included, and generally get weaker without the United States. Fur-thermore, the apparent validity of percentage of homicides with guns and theCook’s measure decreases to a pronounced degree. PSG, however, remainsstrongly correlated (r = .91) with the criteria.
Therefore PSG is the best measure to use in cross-national research. Indeed,with a .95 correlation with the criterion, it would be hard to improve on PSGas a measure of household gun prevalence. Because this measure is availablefor a larger number of nations (36 at present, and probably more in future)than the ICS measures, and is, unlike the survey data, likely to be consistentlyavailable for multiple years in future, it is a more flexible and widely usablemeasure than the survey-measured percentage of households with guns.
Where comparable associations were measured in city, state, and nationaldata sets, the correlations were generally larger in the state and national data.This reflects the usual tendency of associations to be higher among largeraggregates but is also likely to be at least partly due to the fact that the samplesused to estimate national household gun ownership rates numbered at least inthe hundreds (Krug et al. 1998), while the samples used to estimate the largecity gun levels could include as few as 30 respondents, and state sampleswere often not much bigger. All of the validity correlations reported here, butespecially the city-level correlations in Table 1, should probably be regarded
Kleck / GUN OWNERSHIP 17
as conservative because they would be larger if survey measures were notaffected by random sampling error.
While it has been shown that a valid gun ownership measure is availablefor multiple nations, cross-national research nevertheless shows only verylimited potential for assessing the impact of gun levels on violence levels, forseveral reasons. First, gun availability data are still available for only a hand-ful of nations (36 in the largest relevant study—Kleck 1997:254), makingresults extremely vulnerable to slight changes in the composition of the sam-ples analyzed. Second, outside of the United States, there is far less variationin gun prevalence across those nations for which data are available than thereis across cities, states, or counties within the United States. This limits thecapacity to detect the effects on violence of differing levels of gun ownership.In the International Crime Survey sample, excluding the United States, thepercentage of households with guns was confined to the range from 2 percent
18 JOURNAL OF RESEARCH IN CRIME AND DELINQUENCY
TABLE 4: Validity of Gun Indicators Across Nations, 1990-1995a
a. Figures above the diagonal refer to the full sample of nations for which requisite datawere available; figures below the diagonal pertain to samples with the United States ex-cluded. Sample sizes are weighted sample counts.b. ICS = International Crime Survey, for 1989 and 1992. For nations covered in bothyears, two-year averages were computed.
to 32 percent (Killias 1993), while in the United States, the figure rangesfrom as low as 1 percent or 2 percent in urban areas in the northeast (Kleckand Patterson 1993) to as high as 80 percent or more in rural areas of the westor south. For example, 1990s GSS data indicated that only 15.5 percent ofhouseholds in New Jersey reported a gun (Smith and Martos 1999), while a1990 survey of Montana adults found that 78 percent of the households pos-sessed at least one gun (Floyd and Wilson 1990).
Validity of Indicators of Trends in Gun Levels
Some analysts have performed tests of gun indicators’ cross-sectionalvalidity, and simply assumed that they must also be valid as indicators ofchanges in gun levels over time. For example, Miller, Azrael, and Hemenway(2001: 478) used a multiple time series design to estimate the effect of gunlevels on the incidence of fatal gun accidents, but their test of the validity oftheir gun proxy, Cook’s (1991) measure, was based entirely on correlationswith survey measures across states and regions. Unfortunately, none of theproxies that are valid indicators of cross-sectional variation in gun levels,including PSG, are valid indicators of cross-temporal variation.
Table 5 displays correlations among gun indicators using national-levelannual data for the period 1972 through 1999. Variables were expressed asthe percentage change from the previous year. The criterion measures wereonce again direct survey measures of household gun prevalence. To have sur-vey measures for every year, results of all known national surveys were used,and averaged where multiple surveys were available for a given year (Kleck1997:98-99; Lexis-Nexis 1999). Gun prevalence for 1979, the only yearwithout national survey data on gun ownership, was estimated as the averageof the 1978 and 1980 figures. A wide array of indicators were tested, rangingfrom measures reflecting the cumulated size of the national private gun stock(indicators 3 and 4, used in Kleck 1979, 1984) to measures based on the shareof violent acts involving guns (indicators 5 to 8), NRA membership (figuresderived from wire service reports of NRA membership claims—Lexis-Nexis1999), indicators of hunting, the rate of gun dealers (Federal FirearmsLicense holders per 100,000 population—U.S. Bureau of Alcohol, Tobaccoand Firearms 2000), and measures of law enforcement activity aimed at vio-lations of weapons laws (indicators 13-16).
Detailed discussion of most of these potential proxies is unnecessarybecause the data indicate that none of them show evidence of validity as mea-sures of trends in gun levels. Focusing on the top row of numbers, in columns3 to 16, the correlations are all weak and often negative. None of the mea-sures, including the gun stock measures (indicators 3 and 4) used by Kleck
Kleck / GUN OWNERSHIP 19
20
TAB
LE
5:
Val
idit
yo
fGu
nIn
dic
ato
rsO
verT
ime—
An
nual
Ob
serv
atio
ns,
Un
ited
Sta
tes,
1972
to19
99(a
llva
riab
les
wer
eex
pre
ssed
asp
erce
nta
ge
chan
ge
fro
mp
revi
ou
s ye
ar)
Pea
rson
Cor
rela
tions
/One
-Tai
led
Sig
nific
ance
(2)
(3)
(4)
(5)
(6)
(7)
(8)
(9)
(10)
(11)
(12)
(13)
(14)
(15)
(16)
(1)
% H
ouse
hold
s w
ith g
un (
GS
S)
.65
.10
–.02
–.34
–.02
–.17
.06
–.04
.00
.14
–.18
–.00
–.19
–.15
–.03
.00
.32
.46
.04
.45
.20
.39
.42
.50
.23
.19
.49
.18
.24
.44
(2)
% H
ouse
hold
s w
ith h
andg
un (
GS
S)
.29
.23
.00
.23
.04
.25
.13
–.17
.34
.18
.22
–.04
.02
.07
.09
.16
.50
.15
.44
.14
.28
.25
.05
.21
.21
.44
.47
.38
(3)
Cum
ulat
ed g
un s
tock
per
100
,000
pop
ulat
ion
.93
.39
–.02
–.14
–.03
.03
.28
.52
.16
.66
.31
.10
.22
.00
.02
.46
.26
.45
.44
.10
.00
.21
.00
.06
.32
.14
(4)
Cum
ulat
ed h
and-
gun
stoc
k pe
r 10
0,00
0 po
pula
tion
.47
.01
–.00
.06
.12
.27
.47
.23
.69
.34
.19
.34
.01
.48
.50
.38
.27
.11
.01
.13
.00
.05
.18
.04
(5)
% S
uici
des
with
gun
s.2
9.1
6.3
3.2
6–.
17.4
9.6
8.4
6.5
7.4
4.4
3.0
7.2
3.0
4.1
0.2
1.0
0.0
0.0
2.0
0.0
1.0
1(6
) %
Hom
icid
es w
ith g
uns
.52
.61
.36
–.07
.27
.90
–.12
.09
.70
.61
.00
.00
.03
.37
.08
.00
.32
.33
.00
.00
(7)
% R
obbe
ries
with
gun
s.5
5.2
7.0
3–.
02.4
9–.
15.1
0.3
7.2
8.0
0.0
9.4
5.4
6.0
1.2
6.3
2.0
4.0
9(8
) %
Agg
rava
ted
assa
ults
with
gun
s.5
1.0
0.0
4.6
2.1
0.3
6.5
2.4
2.0
0.5
0.4
3.0
0.3
4.0
4.0
0.0
1(9
) Fa
tal g
un a
ccid
ents
per
100
,000
pop
ulat
ion
–.34
.06
.40
.09
.26
.62
.57
.05
.38
.02
.36
.10
.00
.00
(10)
% $
val
ue s
tole
n pr
oper
ty d
ue to
gun
s–.
10–.
13.2
5.3
1–.
29–.
29.3
3.2
7.1
5.0
7.0
8.0
8(1
1)G
uns
& A
mm
osu
bscr
iptio
ns p
er 1
00,0
00 p
opul
atio
n.4
2–.
06.1
7.1
8.2
3.0
1.4
0.2
0.1
9.1
3(1
2) C
ook’
s gu
n de
nsity
.10
.33
.75
.67
.34
.05
.00
.00
21
(13)
NR
A m
embe
rs p
er 1
00 p
opul
atio
n.3
2.1
8.3
1.1
0.2
3.1
0(1
4) H
untin
g lic
ense
hol
ders
per
100
,000
pop
ulat
ion
.13
.13
.26
.26
(15)
Wea
pons
arr
ests
/tota
l arr
ests
.87
.00
(16)
Wea
pons
arr
ests
per
100
,000
pop
ulat
ion
(1979, 1984), is significantly and positively correlated with either gun orhandgun prevalence among U.S. households, as measured by surveys.
Two measures merit special attention because they have been used inrecent research. First, despite its excellence as an indicator of cross-sectionalvariation in gun levels, PSG is not positively and significantly correlated witheither of the survey criterion measures. Indeed, changes in PSG are actuallynegatively correlated with changes in household gun prevalence. Change inPSG is significantly correlated with change in many of the other potentialmeasures of gun levels (measures 3, 4, 8, and 11-16), but even these correla-tions are far too weak—most under .50, the largest .57 (excluding theartifactual association with Cook’s [1991] measure) to inspire confidence inPSG as an adequate proxy for trends in gun levels. PSG was used in recentmultiple time series studies by Cook and Ludwig (2002) and Miller et al.(2002).
Second, change in the rate of subscriptions to Guns & Ammo, used byDuggan (2001), is likewise not positively and significantly correlated overtime with change in household gun or handgun prevalence, and is even lessstrongly correlated with the other potential proxies than PSG was (noneexceeded .52).
Unfortunately, there are at present no known proxies that can be shown tosuccessfully track trends in gun prevalence. Yet analysts have neverthelessclaimed certain proxies are valid, so it is worth examining how they justifythese claims. Cook and Ludwig (2002) used PSG in their multiple time seriesstudy of gun levels and claimed that PSG is significantly associated over timewith the GSS measure of the percentage of households reporting guns, mea-sured for selected years over 1973 to 1998, for each of the nine Censusregions. They tested the validity of PSG using a multiple time series design,estimating a fixed effect model with the GSS survey measure of householdgun prevalence as the dependent variable, and PSG as an independent vari-able, controlling for dummy variables representing each Census region,thereby controlling for cross-region differences in gun levels.
Cook and Ludwig (2002) concluded that the PSG measure was a validindicator of trends in gun levels merely because the regression coefficient forPSG was large relative to its standard error and thus statistically significant.The size of a regression coefficient, however, cannot tell the analyst whetherthe proposed proxy is a good one. Because there is no upper limit to the sizeof a multiple regression coefficient (or the ratio of the coefficient over itsstandard error), there is no way to meaningfully judge how large or close to aperfect correlation the association is. And of course even very weak associa-tions can be statistically significant. Instead of establishing a strong associa-tion between their indicator and the criterion, all Cook and Ludwig demon-strated was that the association was not likely to be zero.
22 JOURNAL OF RESEARCH IN CRIME AND DELINQUENCY
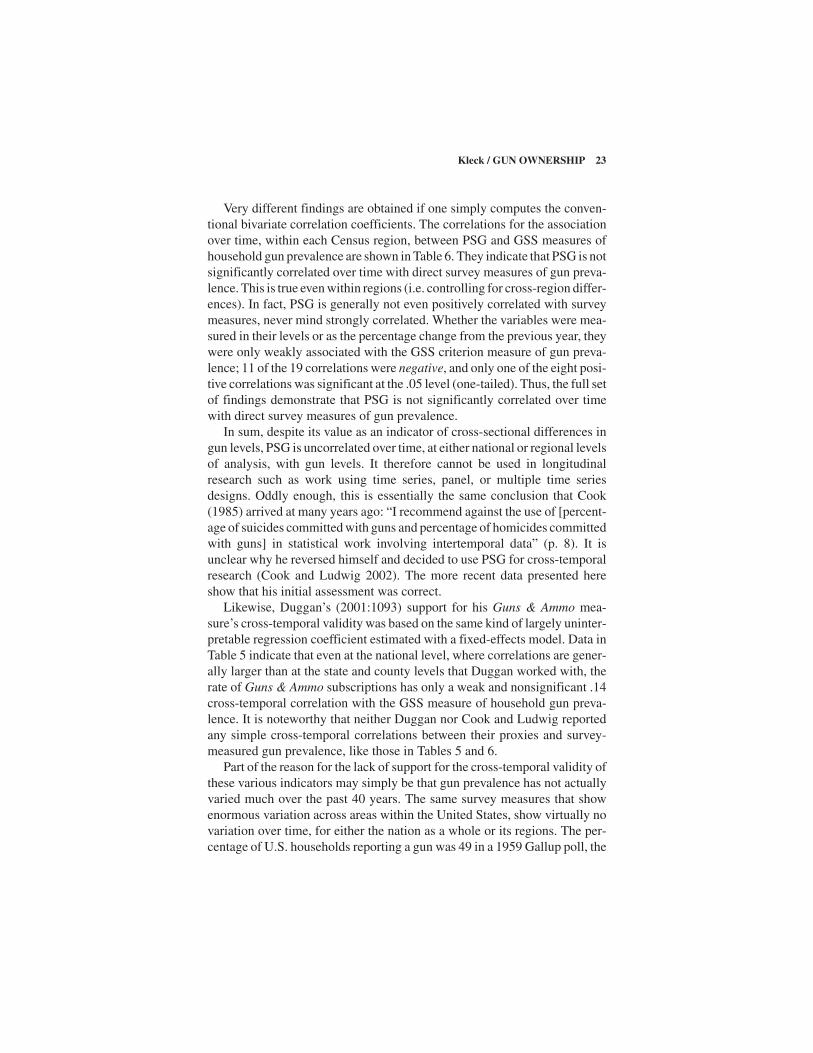
Very different findings are obtained if one simply computes the conven-tional bivariate correlation coefficients. The correlations for the associationover time, within each Census region, between PSG and GSS measures ofhousehold gun prevalence are shown in Table 6. They indicate that PSG is notsignificantly correlated over time with direct survey measures of gun preva-lence. This is true even within regions (i.e. controlling for cross-region differ-ences). In fact, PSG is generally not even positively correlated with surveymeasures, never mind strongly correlated. Whether the variables were mea-sured in their levels or as the percentage change from the previous year, theywere only weakly associated with the GSS criterion measure of gun preva-lence; 11 of the 19 correlations were negative, and only one of the eight posi-tive correlations was significant at the .05 level (one-tailed). Thus, the full setof findings demonstrate that PSG is not significantly correlated over timewith direct survey measures of gun prevalence.
In sum, despite its value as an indicator of cross-sectional differences ingun levels, PSG is uncorrelated over time, at either national or regional levelsof analysis, with gun levels. It therefore cannot be used in longitudinalresearch such as work using time series, panel, or multiple time seriesdesigns. Oddly enough, this is essentially the same conclusion that Cook(1985) arrived at many years ago: “I recommend against the use of [percent-age of suicides committed with guns and percentage of homicides committedwith guns] in statistical work involving intertemporal data” (p. 8). It isunclear why he reversed himself and decided to use PSG for cross-temporalresearch (Cook and Ludwig 2002). The more recent data presented hereshow that his initial assessment was correct.
Likewise, Duggan’s (2001:1093) support for his Guns & Ammo mea-sure’s cross-temporal validity was based on the same kind of largely uninter-pretable regression coefficient estimated with a fixed-effects model. Data inTable 5 indicate that even at the national level, where correlations are gener-ally larger than at the state and county levels that Duggan worked with, therate of Guns & Ammo subscriptions has only a weak and nonsignificant .14cross-temporal correlation with the GSS measure of household gun preva-lence. It is noteworthy that neither Duggan nor Cook and Ludwig reportedany simple cross-temporal correlations between their proxies and survey-measured gun prevalence, like those in Tables 5 and 6.
Part of the reason for the lack of support for the cross-temporal validity ofthese various indicators may simply be that gun prevalence has not actuallyvaried much over the past 40 years. The same survey measures that showenormous variation across areas within the United States, show virtually novariation over time, for either the nation as a whole or its regions. The per-centage of U.S. households reporting a gun was 49 in a 1959 Gallup poll, the
Kleck / GUN OWNERSHIP 23
24
TAB
LE
6:
Th
eV
alid
ity
oft
he
Per
cen
tag
eo
fSu
icid
esC
om
mit
ted
wit
hG
un
sas
anIn
dic
ato
ro
fTre
nd
sin
Gu
nL
evel
s—C
orr
elat
ion
sw
ith
Su
rvey
Gu
nP
reva
-le
nce
Ove
r T
ime
wit
hin
Eac
h R
egio
na
Pea
rson
Cor
rela
tion
Coe
ffici
ents
(on
e-ta
iled
sign
ifica
nce
leve
l)
Eas
tW
est
Eas
tW
est
New
Mid
dle
Nor
thN
orth
Sou
thS
outh
Sou
thR
ocky
Cen
sus
Reg
ion
Eng
land
Atla
ntic
Cen
tral
Cen
tral
Atla
ntic
Cen
tral
Cen
tral
Mou
ntai
nP
acifi
c
Var
iabl
es in
leve
ls.3
5–.
06–.
14–.
14–.
23–.
42.3
8–.
44–.
30(.
09)
(.41
)(.
30)
(.30
)(.
19)
(.05
)(.
07)
(.04
)(.
12)
Diff
eren
ces
–.01
.26
.05
.44
.12
.11
–.37
–.12
–.04
(.49
)(.
16)
(.43
)(.
04)
(.32
)(.
34)
(.08
)(.
34)
(.44
)
a.T
hecr
iterio
nm
easu
rew
asth
epe
rcen
tage
ofho
useh
olds
repo
rtin
ga
gun
inth
eG
ener
alS
ocia
lSur
veys
,for
ally
ears
inw
hich
the
gun
ques
tions
wer
e as
ked:
1973
, 197
4, 1
976,
198
0, 1
982,
198
4, 1
985,
198
7, 1
988,
198
9, 1
990,
199
1, 1
993,
199
4, 1
996,
and
199
8.
first national survey to ask a gun ownership question. In 1993 it was an identi-cal 49 percent in a Gallup poll, and a near-identical 48 percent in a CBS Newspoll fielded in August of 1999. Household prevalence of handguns, though itmay have increased around 1972 to 1982, has also been roughly constant (25percent ± 3 percent) since 1982 (Kleck 1997:98-100; Lexis-Nexis 1999).
Likewise, within regions, gun prevalence was virtually constant over the1973 to 2000 period for which GSS data are available. This alone may be rea-son enough to question the utility of longitudinal designs for assessing theeffects of gun prevalence—if it does not vary over time, there is no opportu-nity to estimate its effects. Figure 1 visually illustrates the minimal variationin survey-measured gun prevalence and the erratic relationship that twoprominent indicators have with this variation in national data.
The apparent near-total lack of variation in gun prevalence means that cor-relations with all other variables are likely to be highly unstable and probablynot very meaningful. Indeed, the observed correlations may primarily reflectcorrelated errors in measuring the variables, rather than true associationsbetween gun levels and the proxies because known sources of measurementerror could easily account for most of the observed variation in measured gunprevalence. Of course, another implication of near-constant gun prevalenceafter 1973 is that neither upward nor downward shifts in crime and violencerates in this period can be plausibly attributed to (nonexistent) changes in gunprevalence. Thus, Blumstein’s (1995) claims that supposed “gun diffusion”among minority youth contributed to homicide increases around 1986 to1991, and Lott’s (2000:41-42, 113-14) contrary claim that supposedincreases in gun ownership (based on noncomparable voter exit polls) sup-pressed crime rates between 1988 and 1996, are both implausible becausethey attributed crime changes to changes in gun levels that apparently did notoccur. (Contrary to Blumstein [1995], survey data for the period between themid-1980s and the early 1990s provide no more indication of an increase ingun availability among young urban Black males than for increases withinthe population as a whole—Kleck 1997:72-74, 103).
It is possible that multiple-indicator measures may track gun trends moresuccessfully that single indicators, but analysis of the national annual timeseries data used in Table 5 provides no support for this hope. The best mea-sure combining items listed in that table was a factor score created from thetotal gun stock, handgun stock, Guns & Ammo, and NRA membership indi-cators (numbers 3, 4, 11, and 13 in Table 5). Annual percentage changes inthis factor correlated only .04 with annual percentage changes in the house-hold gun rate and .20 for the handgun rate.
Kleck / GUN OWNERSHIP 25
DISCUSSION AND IMPLICATIONS FOR PAST RESEARCH
The best currently available indicator to use in cross-sectional guns-violence research is the percentage of suicides committed with guns, whichhas a correlation with the GSS survey measure of household gun prevalenceof .87 across large cities, .92 across states, and .95 across nations (Tables 1, 3,and 4). None of the currently available indicators, including PSG, appears tobe valid for use in longitudinal research. Therefore, credible longitudinalresearch on the impact of gun levels on crime and violence rates is not cur-rently feasible, and the results of such research conducted in the past are notcredible.
With these findings in mind, we can now reassess prior research on theimpact of gun levels on crime rates. Table 7 summarizes this research. Thefirst thing that is apparent is that there has been an enormous variety of waysof measuring aggregate gun levels. With few exceptions (e.g., Cook 1979;Kleck and Patterson 1993), researchers using these measures failed to vali-date them using any criterion, such as establishing that they correlate wellwith more direct survey measures. The present validity check results indicatethat validity was inadequate for nearly all of the measures used in past cross-sectional research and was poor for all those used in research with longitudi-nal designs.
Beyond poor associations with validity criteria, these measures also haveother serious flaws. The measures of the percentage of various crimes com-mitted with guns are vulnerable to the possibility of artifactual associationswith crime rates. For example, the number of gun homicides is a componentin the numerators of both the percentage of homicides committed with guns
26 JOURNAL OF RESEARCH IN CRIME AND DELINQUENCY
Figure 1: U.S. Gun Indicator Trends, 1972-2000
27
TAB
LE
7:
Gu
n L
evel
Mea
sure
s U
sed
in M
acro
-Lev
el S
tud
ies
of
the
Imp
act
of
Gu
n L
evel
s o
n C
rim
e R
ates
a
Mea
sure
Stu
dy, Y
ear
Sam
ple
of G
un L
evel
bC
rime
Rat
esc
Res
ults
d
Bre
arle
y (1
932)
42 s
tate
sP
GH
TH
RYe
sK
rug
(196
7)50
sta
tes
HLR
ICR
No
New
ton
and
Zim
ring
(196
9)4
year
s, D
etro
itN
PP
TH
R, T
RR
, AA
R, G
HR
Yes
Sei
tz (
1972
)50
sta
tes
GH
R, F
GA
, AA
RT
HR
Yes
Mur
ray
(197
5)50
sta
tes
SG
R,S
HR
GH
R, A
AR
, TR
RN
oF
ishe
r (1
976)
9 ye
ars,
Det
roit
NP
P, G
RR
, PG
HT
HR
Yes
Phi
llips
, Vot
ey, a
nd H
owel
l (19
76)
18 y
ears
, U.S
.P
RO
DT
HR
Yes
Bril
l (19
77)
11 c
ities
PG
CIC
R, T
HR
, TR
RN
o, Y
es, N
oK
leck
(19
79)
27 y
ears
, U.S
.P
RO
DT
HR
Yes
Coo
k (1
979)
50 c
ities
PG
H, P
SG
TR
R, R
MR
No,
Yes
Kle
ck (
1984
)32
yea
rs, U
.S.
PR
OD
TH
R, T
RR
No,
Yes
Mag
gadi
no a
nd M
edof
f (19
84)
31 y
ears
, U.S
.P
RO
DT
HR
No
Lest
er (
1985
)37
citi
esP
CS
VC
RN
oB
ordu
a (1
986)
102
coun
ties,
9 r
egio
nsG
LR,S
IRH
AR
, TH
R, G
HR
No
McD
owal
l (19
86)
48 c
ities
, 2 y
ears
eP
GH
, PS
GT
RR
No
Lest
er (
1988
)9
regi
ons
SG
RT
HR
Yes
McD
owal
l (19
91)
36 y
ears
, Det
roit
PS
G, P
GR
TH
RYe
sK
illia
s (1
993)
16 n
atio
nsS
GR
TH
R, G
HR
Yes
Kle
ck a
nd P
atte
rson
(19
93)
170
citie
sf
TH
R, G
HR
, TR
R, G
RR
, AA
R, G
AR
No
Lest
er (
1996
)12
nat
ions
PG
H, P
SG
TH
R, G
HR
Yes
Sou
thw
icke
(19
97)
48 y
ears
, U.S
.P
RO
DT
HR
, TP
R, T
RR
, AA
RN
oS
tolz
enbe
rg a
nd D
’Ale
ssio
(20
00)
4 ye
ars,
46
coun
ties
CC
W, G
UN
STO
LV
CR
Yes
Hem
enw
ay a
nd M
iller
(20
00)
26 c
ount
ries
PG
H, P
SG
TH
RN
oLo
tt (2
000)
15 s
tate
s, 2
yea
rsS
GR
TH
R, T
PR
, TR
R, A
AR
, 3 o
ther
sN
oD
ugga
n (2
001)
19 y
ears
, 50
stat
esG
MR
TH
R, T
PR
, TR
R, A
AR
Yes (c
ontin
ued)
Hos
kin
(200
1)36
nat
ions
PS
GT
HR
Yes
Kill
ias,
van
Kes
eter
en, a
nd21
nat
ions
SG
RT
HR
, TR
R, T
AR
, GH
R, G
RR
, GA
RN
oR
indl
isba
cher
(20
01)
Sor
enso
n an
d B
erk
(200
1)22
yea
rsH
GS
TH
RYe
sC
ook
and
Ludw
ig (
2002
)22
yea
rs, 5
0 st
ates
PS
GB
UR
Yes
Mill
er, A
zrae
l, an
d H
emen
way
(20
02)
10 y
ears
, 50
stat
esP
SG
, PH
G, S
GR
TH
RYe
s
a.Ta
ble
cove
rson
lyst
udie
san
dfin
ding
sw
here
the
depe
nden
tvar
iabl
ew
asa
crim
era
te,a
sop
pose
dto
the
frac
tion
ofcr
imes
com
mitt
edw
ithgu
ns,
and
whe
re g
un o
wne
rshi
p le
vels
wer
e ac
tual
ly m
easu
red,
rat
her
than
ass
umed
.b.
Mea
sure
sof
Gun
Leve
l:C
CW
=co
ncea
led
carr
ype
rmits
rate
;FG
A=
Fata
lgun
acci
dent
rate
;GLR
=G
unow
ners
licen
sera
te;G
MR
=G
unm
aga-
zine
subs
crip
tion
rate
s;G
RR
=G
unre
gist
ratio
nsra
te;G
UN
STO
L=
%of
$va
lue
ofst
olen
prop
erty
due
togu
ns;H
GS
=ha
ndgu
nsa
les;
HLR
=H
untin
glic
ense
rate
;NP
P=
Num
bero
fhan
dgun
purc
hase
perm
its;P
GA
=%
aggr
avat
edas
saul
tsco
mm
itted
with
guns
;PG
C=
%ho
mic
ides
,agg
ra-
vate
das
saul
tsan
dro
bber
ies
(com
bine
dto
geth
er)c
omm
itted
with
guns
;PC
S=
sam
eas
PG
C,b
utw
ithsu
icid
eslu
mpe
din
asw
ell;
PG
H=
%ho
mi-
cide
sco
mm
itted
with
guns
;PG
R=
%ro
bber
ies
com
mitt
edw
ithgu
ns;P
SG
=%
suic
ides
com
mitt
edw
ithgu
ns;P
RO
D=
Gun
spr
oduc
edm
inus
ex-
port
spl
usim
port
s,U
.S.;
SG
R=
Sur
vey
mea
sure
,%ho
useh
olds
with
gun(
s);S
HR
=S
urve
ym
easu
re,%
hous
ehol
dsw
ithha
ndgu
n(s)
;SIR
=S
urve
ym
easu
re, %
indi
vidu
als
with
gun
(s)
c.C
rime
rate
s:A
AR
=A
ggra
vate
das
saul
trat
e;B
UR
=bu
rgla
ryra
te;G
AR
=G
unag
grav
ated
assa
ultr
ate;
GH
R=
Gun
hom
icid
era
te;H
AR
=H
omi-
cide
,ass
ault
and
robb
ery
inde
x(f
acto
rsco
re);
ICR
=In
dex
crim
era
te;R
MR
=R
obbe
rym
urde
rrat
e;T
HR
=To
talh
omic
ide
rate
;TP
R=
Tota
lrap
era
te;
TR
R =
Tot
al r
obbe
ry r
ate;
VC
R =
Vio
lent
cri
me
rate
d.Ye
s =
Stu
dy fo
und
sign
ifica
nt p
ositi
ve a
ssoc
iatio
n be
twee
n gu
n le
vels
and
vio
lenc
e;N
o =
Stu
dy d
id n
ot fi
nd s
uch
a lin
k.e.
Pan
el d
esig
n, tw
o w
aves
.f.
5-ite
m fa
ctor
com
pose
d of
PS
G, P
GH
, PG
R, P
GA
, and
the
perc
enta
ge o
f dol
lar
valu
e of
sto
len
prop
erty
due
to s
tole
n gu
ns.
TAB
LE
7:(
con
tinu
ed)
Mea
sure
Stu
dy, Y
ear
Sam
ple
of G
un L
evel
bC
rime
Rat
esc
Res
ults
d
28
(the gun levels measure, usually used as an independent variable) and eitherthe gun homicide rate or the total (gun plus nongun) homicide rate (used as adependent variable). This could create a positive association between the gunownership measure and the crime rate, even if there were no causal relation-ship, especially given that gun homicides make up a majority of total homi-cides. Whereas Cook (1979) and Kleck and Patterson (1993) took steps toavoid this problem, other researchers did not (Brearly 1932; Brill 1977;Fisher 1976; Seitz 1972). For example, Hemenway and Miller (2000) usedCook’s (1991) measure in a way that Cook was wise enough to avoid: as apredictor of homicide rates. While the authors found no significant associa-tion between PSG (a valid gun measure without artifactual association prob-lems) and homicide rates across 26 nations, they found significant associa-tions twice as large when using the Cook measure, and based theirconclusions on the latter findings. As we have seen, the Cook measure’shomicide component adds nothing to its validity as a gun proxy. The likelyreason for the far larger correlations obtained when the Cook measure wasused is that both national homicide rates ([gun homicides + nongun homi-cides]/population) and the percentage of homicides committed with guns([gun homicides/total homicides] × 100 percent) contain a common compo-nent in their numerators: the number of gun homicides, which artificiallyinflates the association.
The “percent gun” measures also reflect not only the availability of gunsbut also the preference of the criminal population for using guns in crimesand thus their willingness to inflict fatal injury (Brill 1977:19-20). Whileavailability certainly affects how often criminals use guns in crimes, the“lethality” of offenders (i.e. their willingness to inflict potentially lethalinjury on others) affects this choice as well (Cook 1982). Consequently, the“percent gun” indicators confound gun availability with the average lethalityor violence proneness of the criminal population, and can thereby producegun/violence associations that are virtual tautologies.
In similar fashion, if PSG is used as a predictor of suicide rates (as wasdone in Miller et al. 2002), it not only will have the common componentsproblem but will also reflect the average level of suicidal intent in the popula-tion, assuming that suicidal intent (the intention to actually kill one’s selfrather than merely make a suicidal gesture as a “cry for help”) is on averagehigher among people who kill themselves with guns than those who, perhapsaccidentally, kill themselves with usually nonlethal methods such as swal-lowing a few prescription pills (for evidence supporting this assumption seeKleck 1997:272).
Furthermore, PSG could vary due to shifts in prospective suicides’prefer-ences for suicide methods that might be substituted for shooting, rather thanbecause of variations in gun availability.
Kleck / GUN OWNERSHIP 29
The problems that can arise with use of percentage-gun measures can beseen with a time series study of the impact of gun levels on homicide rates inDetroit. McDowall (1991) used a two-item index of gun availability com-posed of (1) the percentage of robberies committed with guns, and (2) PSG.
Neither measure is valid as an indicator of variation in gun levels overtime. The data in Table 5 showed that the correlation over time between thepercentage of households reporting gun ownership and either of these mea-sures is actually negative (see column 7 of the first row). Although McDowallcited Cook (1979) for validation of his gun measures, Cook himself hadexplicitly rejected the use of PSG as an indicator of cross-temporal variationin gun availability (Cook 1985). Instead of measuring trends in gun availabil-ity, the robbery measure in McDowall’s (1991) index more likely reflectedchanges in the average “lethality,” or willingness to inflict potentially lethalviolence, among Detroit robbers. This would independently influence trendsin lethal violence, as well as being correlated with the share of robbers whocarry guns.
The percentage of stolen property due to stolen guns (indicator 10 in Table1) is likewise a measure of multiple concepts. Stolzenberg and D’Alessio(2000) interpreted this measure as only a reflection of “illegal gun availabil-ity,” (p. 1468) (i.e. gun possession among criminals), but it necessarily mustalso reflect gun availability among the largely noncriminal population fromwhom the guns were stolen.
The most extreme examples of poor measurement in research on guns andviolence are found in studies that conclude or hint that there is a causal linkbetween the two, but without measuring gun levels at all. Instead, trends ingun levels are simply indirectly inferred from the relative size of changes ingun violence (e.g., homicides committed with guns) and changes in nongunviolence (e.g., homicides committed without guns).
Since national homicide data first became available in 1933, there havebeen two periods of significant increases in national homicide rates, one in1963 to 1974, when the rate jumped from 4.7 homicides per 100,000 popula-tion to 9.9, and a more limited one in 1987 to 1991, when the rate increasedfrom 8.6 to 10.4 (Kleck 1997:262-63). In both periods, almost all of theincrease occurred among gun homicides, leading some observers to infer thatthe increases were caused by increases in gun levels (Blumstein 1995; Farley1980).
For example, Blumstein (1995) noted that homicide increases amongyoung Blacks in the 1985 to 1991 period occurred almost entirely in the gunhomicide category, and speculated that violence among drug sellers hadmotivated others, including those not involved in drug selling, to acquireguns, leading to increased minority youth homicide. Blumstein’s reasoningwas fallacious because there is no necessary logical relationship between
30 JOURNAL OF RESEARCH IN CRIME AND DELINQUENCY
trends in gun availability and the relative sizes of shifts in gun homicide andnongun homicide, or changes in the share of homicides committed with guns(Kleck 1997:256-58).
Indeed, there is no cross-temporal correlation at all between gun availabil-ity and the share of homicides committed with guns (see Table 5, column 6,first row). Furthermore, gun homicide rates in the United States are more vol-atile than nongun homicide rates, and both increases and decreases in homi-cide are proportionally larger among gun homicides than among nongunhomicides, even during periods when changes in gun availability or gun con-trol strictness could not have been responsible (Britt et al. 1996; Kleck et al.1993).
There is no direct empirical indication, apart from gun violence increasesthemselves, that gun availability (including gun carrying) increased during1985 to 1991 either in the general population or in high-violence subsets ofthe population, and thus no support for the Blumstein (1995) speculationabout “gun diffusion” among urban minorities. Surveys indicate no trend, orperhaps a slight decline, in gun prevalence among high-violence subsets ofthe population during this period (Kleck 1997:103, 257).
A simpler and more plausible explanation than Blumstein’s (1995) of thegun/nongun homicide trends would follow naturally from his observationthat homicide increases were largely confined to killings linked to illicit drugtransactions or street gangs. Because 90 percent of all murders of drug deal-ers and gang members were committed with guns (U.S. Federal Bureau ofInvestigation, 1995:20), increases in drug- and gang-related homicideswould occur almost entirely in the gun homicide category even in the com-plete absence of any increases in gun availability (including gun carrying inpublic places), either in the general population as a whole or among high-riskpersons. In sum, there is no substitute for actually measuring gun levelsbecause one cannot infer differences in gun levels, across areas or over time,from the fact that violence differed or changed more in the gun category thanin the nongun category.
CONCLUSIONS
Many scholars have claimed to have found a significant positive effect ofgun ownership on crime or violence rates (see Table 7), but all of these studiesshare at least one of two critical problems: (1) use of an invalid measure ofgun levels, and (2) a failure to convincingly resolve causal order issues in therelationship between gun levels and crime/violence rates.
Table 7 (see note b) shows that past macro-level guns-violence studieshave used a large and diverse set of proxies for gun levels, all of which are
Kleck / GUN OWNERSHIP 31
variants of the measures assessed here. The present results indicate thatalmost all of the measures used in cross-sectional research, and all of thoseused in longitudinal studies, are apparently invalid measures of gun levels.Thus, with the exception of the few studies that used PSG (or indexes includ-ing PSG) or direct survey measures in cross-sectional research (e.g., Cook1979; Killias et al. 2001; Kleck and Kovandzic 2001; Kleck and Patterson1993), the supposed gun-crime associations estimated in nearly all pastresearch must be regarded as uninterpretable on the simple grounds that gunlevels were not adequately measured and many of the proxies used were mea-suring some violence-related concept other than gun levels. Even ignoringsevere problems in identification and model specification, most pastresearch, and all longitudinal research, has generated meaningless findingson gun effects because the proxies used cannot be legitimately interpreted asmeasures of gun availability.
Discounting this voluminous body of uninterpretable work, the best avail-able research indicates that there is no net effect of general (criminal and non-criminal combined) gun ownership on violence rates (Kleck 1997:248-51;Kleck and Kovandzic 2002; Kleck and Patterson 1993:274). This null associ-ation, however, may mask two causal effects of gun ownership on violencerates of opposite sign. Gun ownership among criminals may increase crimewhile guns among noncriminals may decrease it. Measures of gun ownershipthat do not distinguish gun ownership in the two populations may miss thesediffering effects.
On the other hand, there is no empirical evidence that the two are inde-pendent. Given that most criminals acquire guns as a result of transfers fromnoncriminals, it is likely that the same places that have high noncriminal gunownership also have high gun levels among criminals. If so, proxies for non-criminal gun levels might serve as satisfactory proxies for criminal gun lev-els. It would not, however, be possible to separate the effects of criminal andnoncriminal gun possession. This issue needs to be explored, and devisingmethods for distinguishing levels of gun ownership among criminals fromlevels among noncriminals therefore should be a high priority in futureresearch.
There are no obvious existing proxies that clearly measure gun availabil-ity among criminals. This does not, however, mean that such measures areunattainable. For example, if police executives were genuinely serious abouttracking gun availability among the criminals in their jurisdictions, it wouldbe an easy matter to revise arrest report forms to include check-off boxesindicating whether the arrestee possessed a weapon at the time of arrest, andwhat type of weapon it was. If significant numbers of agencies adopted thissimple and inexpensive practice, variations in gun levels among criminals,across areas and over time, could be directly measured.
32 JOURNAL OF RESEARCH IN CRIME AND DELINQUENCY
NOTE
1. It was never necessary to add .1 to values to permit logging in the time series analysis, and itwas necessary for just one (percent gun, homicides) of the measures in the cross-national analy-sis, and two (fatal gun accidents, carry permits) of the 14 indicators in the state analysis. It wasnecessary for 5 of the 18 indicators in the 45-city analysis. In this analysis, the gun theft measurewas 0 for 8 cities, 4 other variables were scored 0 for just 1 or 2 cities, and the remaining 13 mea-sures did not have any zeroes.
REFERENCES
Audit Bureau of Circulations. 1979-1982, 1990, 2000. Supplemental Data Report: [magazinename]—Paid Circulation. Analysis by Counties. Schaumburg, IL: Audit Bureau ofCirculations.
Bird, Chris. 2000. The Concealed Handgun Manual, 2d. ed. San Antonio, TX: PrivateerPublications.
Blumstein, Alfred. 1995. “Youth Violence, Guns, and the Illicit-Drug Industry.” Journal of Crim-inal Law and Criminology 86:10-36.
Bordua, David J. 1986. “Firearms Ownership and Violent Crime: A Comparison of IllinoisCounties.” Pp. 156-88 in The Social Ecology of Crime, edited by James M. Byrne and RobertJ. Sampson. New York: Springer-Verlag.
Bordua, David J. and Alan J. Lizotte. 1979. “Patterns of Legal Firearms Ownership: A Culturaland Situational Analysis of Illinois Counties.” Law and Policy Quarterly 1:147-75.
Brearley, H. C. 1932. Homicide in the United States. Chapel Hill: University of North CarolinaPress.
Brill, Steven. 1977. Firearm Abuse: A Research and Policy Report. Washington, DC: PoliceFoundation.
Britt, Chester, III, Gary Kleck, and David J. Bordua. 1996. “A Reassessment of the D.C. GunLaw: Some Cautionary Notes on the Use of Interrupted Time Series Designs for PolicyImpact Assessment.” Law & Society Review 30:361-80.
Cook, Philip J. 1979. “The Effect of Gun Availability on Robbery and Robbery Murder.” Pp. 743-81 in Policy Studies Review Annual, edited by Robert Haveman and B. Bruce Zellner.Beverly Hills, CA: Sage.
———. 1982. “The Role of Firearms in Violent Crime.” Pp.236-91 in Criminal Violence, editedby Marvin E. Wolfgang and Neil Alan Weiner. Beverly Hills, CA: Sage.
———. 1985. “Report on a City-Specific Gun Prevalence Index.” Unpublished paper. DukeUniversity, Durham, NC.
———. 1991. “The Technology of Personal Violence.” Pp. 1-71 in Crime and Justice, vol. 14,edited by Michael Tonry. Chicago: University of Chicago Press.
Cook, Philip J. and Jens Ludwig. 2002. “The Effects of Gun Prevalence on Burglary: Deterrencevs. Inducement.” Unpublished paper. Duke University, Sanford Institute for Policy Studies.
Davis, James A. and Tom W. Smith. 1994. General Social Surveys, 1972-1994 [machine-readable data file], NORC ed. Chicago: National Opinion Research Center, producer, 1994;Storrs, Ct: The Roper Center for Public Opinion Research, University of Connecticut, dis-tributor. 1 data file (32,380 logical records) and 1 codebook (73 pp.).
Duggan, Mark. 2001. “More Guns, More Crime.” Journal of Political Economy 109:1086-1114.Farley, Reynolds. 1980. “Homicide Trends in the United States.” Demography 17:177-88.Fisher, Joseph C. 1976. “Homicide in Detroit: The Role of Firearms.” Criminology 14:387-400.
Kleck / GUN OWNERSHIP 33
Floyd, Joe and Craig Wilson. 1990. “The Eastern Montana College Poll of National, State, andLocal Issues, February, 1990.” Billings, MT: Eastern Montana College.
Hemenway, David and Matthew Miller. 2000. “Firearm Availability and Homicide Rates Across26 High-Income Countries.” Journal of Trauma 49:985-88.
Hoskin, Anthony W. 2001. “Armed Americans.” Justice Quarterly 18:569-92.Inter-University Consortium for Political and Social Research. 1983. Uniform Crime Reports:
National Time Series Community-Level Database, 1967-1980. ICPSR Study 8214 [Machinereadable data set]. Ann Arbor, MI: Author.
———. 1984. Uniform Crime Reporting Program Data. ICPSR Study 9028, Parts 2, 6, 14. Prop-erty Stolen and Recovered, 1979-1981. Federal Bureau of Investigation. Ann Arbor, MI:Author.
———. 1985. U.S. Dept. of Health and Human Services, National Center for Health Statistics.MORTALITY DETAIL FILES, 1968-1991 [PARTS 17-19: 1979-1981 DATA] [Computerfile], ICPSR ed. Ann Arbor, MI: Author, producer and distributor.
Kellermann, Arthur L., Frederick P. Rivara, Norman B. Rushforth, Joyce G. Banton, Donald T.Reay, Jerry T. Francisco, Ana B. Locci, Janice Prodzinski, Bela B. Hackman, and GrantSomes. 1993. “Gun Ownership as a Risk Factor for Homicide in the Home.” New EnglandJournal of Medicine 329:1084-91.
Killias, Martin. 1993. “Gun Ownership, Suicide, and Homicide: An International Perspective.”Pp. 289-303 in Understanding Crime: Experiences of Crime and Crime Control, edited byAnna del Frate, Uglijesa Zvekic, and Jan J. M. van Dijk. Rome: UNICRI.
Killias, Martin, John van Keseteren, and Martin Rindlisbacher. 2001. “Guns, Violent Crime, andSuicide in 21 Countries.” Canadian Journal of Criminology 43:429-48.
Kleck, Gary. 1979. “Capital Punishment, Gun Ownership, and Homicide.” American Journal ofSociology 84:882-910.
———. 1984. “The Relationship Between Gun Ownership Levels and Rates of Violence in theUnited States.” Pp. 99-135 in Firearms and Violence: Issues of Public Policy, edited by DonB. Kates, Jr. Cambridge, MA: Ballinger.
———. 1988. “Miscounting Suicides.” Suicide and Life-Threatening Behavior 18(3):219-36.———. 1997. Targeting Guns: Firearms and Their Control. New York: Aldine.Kleck, Gary, Chester L. Britt, and David J. Bordua. 1993, October 30. “The Emperor Has No
Clothes: Using Interrupted Time Series Designs to Evaluate Social Policy Impact.” Paperpresented at the annual meetings of the American Society of Criminology.
Kleck, Gary and Miriam DeLone. 1993. “Victim Resistance and Offender Weapon Effects inRobbery.” Journal of Quantitative Criminology 9:55-82.
Kleck, Gary and Don B. Kates. 2001. Armed: New Perspectives on Gun Control. Buffalo, NY:Prometheus.
Kleck, Gary and Tomislav Kovandzic. 2002. “The Effects of Gun Ownership Levels and GunControl Laws and Gun Levels on Urban Crime Rates.” Paper presented at the annual meet-ings of the American Society of Criminology, Chicago, IL.
Kleck, Gary and E. Britt Patterson. 1993. “The Impact of Gun Control and Gun OwnershipLevels on Violence Rates.” Journal of Quantitative Criminology 9:249-88.
Krug, Alan S. 1967. “A Statistical Study of the Relationship Between Firearms Licensing Lawsand Crime Rates.” Congressional Record, 7-25-67, pp. H9366-H9370.
Krug, E. G., K. E. Powell, and L. L. Dahlberg. 1998. “Firearm-Related Deaths in the UnitedStates and 35 Other High- and Upper-Middle-Income Countries.” International Journal ofEpidemiology 27:214-21.
Lester, David. 1985. “The Use of Firearms in Violent Crime.” Crime & Justice 8:115-20.———. 1988. “Firearm Availability and the Incidence of Suicide and Homicide.” Acta
Psychiatrica Belgium 88:387-93.
34 JOURNAL OF RESEARCH IN CRIME AND DELINQUENCY
———. 1996. “Gun Ownership and Rates of Homicide and Suicide.” European Journal of Psy-chiatry 10:83-5.
Lexis-Nexis. 1999. Wire service reports on the Lexis-Nexis online database service. RetrievedOctober 22, 1999, from http://www.lexis-nexis.com/.
Lott, John. 2000. More Guns, Less Crime, 2d ed. Chicago: University of Chicago Press.Magaddino, Joseph P. and Marshall H. Medoff. 1984. “An empirical analysis of federal and state
firearm control laws.” Pp. 225-58 in Firearms and Violence: Issues of Public Policy, edited byDon B. Kates, Jr. Cambridge, MA: Ballinger.
McDowall, David. 1986. “Gun Availability and Robbery Rates: A Panel Study of Large U.S.Cities, 1974-1978.” Law & Policy 8:135-48.
———. 1991. “Firearm Availability and Homicide Rates in Detroit, 1951-1986.” Social Forces69:1085-99.
Miller, Matthew, Deborah Azrael, and David Hemenway. 2000. “Firearm Availability and Unin-tentional Firearm Deaths.” Accident Analysis & Prevention 33:477-84.
———. 2002. “Firearm Availability and Unintentional Firearm Deaths, Suicide, and HomicideAmong 5-14 Year Olds.” Journal of Trauma 52:267-75.
Moody, Carlisle E., and Thomas B. Marvell. 2001. “Pitfalls of Proxy Variables.” Unpublishedpaper. College of William and Mary, Williamsburg, VA.
Murray, Douglas R. 1975. “Handguns, Gun Control Laws and Firearm Violence.” Social Prob-lems 23:81-92.
National Rifle Association. 1985. Unpublished membership tabulations by city. Washington,DC: Author.
Newton, George D. and Franklin Zimring. 1969. Firearms and Violence in American Life. AStaff Report to the National Commission on the Causes and Prevention of Violence. Wash-ington, DC: Government Printing Office.
Nunnally, Jum. 1967. Psychometric Theory. New York: McGraw-Hill.Phillips, Llad, Harold L. Votey, and John Howell. 1976. “Handguns and Homicide.” Journal of
Legal Studies 5:463-78.Powell, Kenneth E., Beth C. Jacklin, David E. Nelson, and Shayne Bland. 1998. “State Estimates
of Household Exposure to Firearms, Loaded Firearms, and Handguns, 1991-1995.” Ameri-can Journal of Public Health 88:969-72.
Seitz, Stephen T. 1972. “Firearms, Homicides, and Gun Control Effectiveness.” Law and SocietyReview 6:595-614.
Smith, Tom W. and Luis Martos. 1999. “Attitudes Towards and Experiences with Guns: A State-Level Perspective.” Chicago: National Opinion Research Center. Retrieved October 4, 2001,from http://www.norc.uchicago.edu/online/gunv.pdf.
Sorenson, Susan B. and Richard A. Berk. 2001. “Handgun Sales, Beer Sales, and Youth Homi-cide, California, 1972-1993.” Journal of Public Health Policy 22:182-97.
Southwick, Lawrence, Jr. 1997. “Do Guns Cause Crime? Does Crime Cause Guns?: A GrangerTest.” Atlantic Economic Journal 25:256-73.
Stolzenberg, Lisa and Stewart J. D’Alessio. 2000. “Gun Availability and Violent Crime.” SocialForces 78:1461-82.
U.S. Bureau of Alcohol, Tobacco and Firearms. 2000. Commerce in Firearms in the UnitedStates. Washington, DC: Government Printing Office.
U.S. Federal Bureau of Investigation. 1995/2001. Crime in the United States 1994 (2000)—Uni-form Crime Reports. Washington, DC: Government Printing Office.
———. No date. Unpublished printouts generated at author’s request, detailing agency-levelarrest counts for each year, 1979-1981.
U.S. Fish and Wildlife Service. 1982. 1980 National Survey of Fishing, Hunting and Wildlife-Associated Recreation. Washington, DC: Government Printing Office.
Kleck / GUN OWNERSHIP 35
———. 1993. 1991 National Survey of Fishing, Hunting, and Wildlife-Associated Recreation.Washington, DC: Government Printing Office.
———. 1997. 1996 National Survey of Fishing, Hunting, and Wildlife-Associated Recreation.Washington, DC: Government Printing Office.
U.S. National Center for Health Statistics. 2001. Part III versions of Mortality Detail UnderlyingCause files. Hyattsville, MD: National Center for Health Statistics.
Gary Kleck is a professor of criminology and criminal justice at Florida State University.His research focuses on the links between guns and violence and the deterrent effects ofpunishment. His has published articles in the American Sociological Review, AmericanJournal of Sociology, Social Forces, Social Problems, Criminology, Journal of CriminalLaw and Criminology, Law & Society Review, and other journals, and is the author offour books, including Point Blank, which won the 1993 Michael Hindelang Award for themost outstanding contribution to criminology, and, most recently, Armed (Prometheus,2001).