46
Chapter 4 Measures of Variability PowerPoint Lecture Slides Essentials of Statistics for the Behavioral Sciences Eighth Edition by Frederick J Gravetter and Larry B. Wallnau
| Date post: | 18-Jul-2015 |
| Category: |
Education |
| Upload: | jasondroesch |
| View: | 226 times |
| Download: | 3 times |

Chapter 4Measures of Variability
PowerPoint Lecture Slides
Essentials of Statistics for the
Behavioral SciencesEighth Edition
by Frederick J Gravetter and Larry B. Wallnau

Learning Outcomes
• Understand purpose of measuring variability1
• Define range2
• Compute range3
• Understand variance and standard deviation4
• Calculate SS, variance, standard deviation of population5
• Calculate SS, variance, standard deviation of sample6

Tools You Will Need
• Summation notation (Chapter 1)
• Central tendency (Chapter 3)
– Mean
– Median

4.1 Overview
• Variability can be defined several ways
– A quantitative distance measure based on the differences between scores
– Describes distance of the spread of scores or distance of a score from the mean
• Purposes of Measure of Variability
– Describe the distribution
– Measure how well an individual score represents the distribution
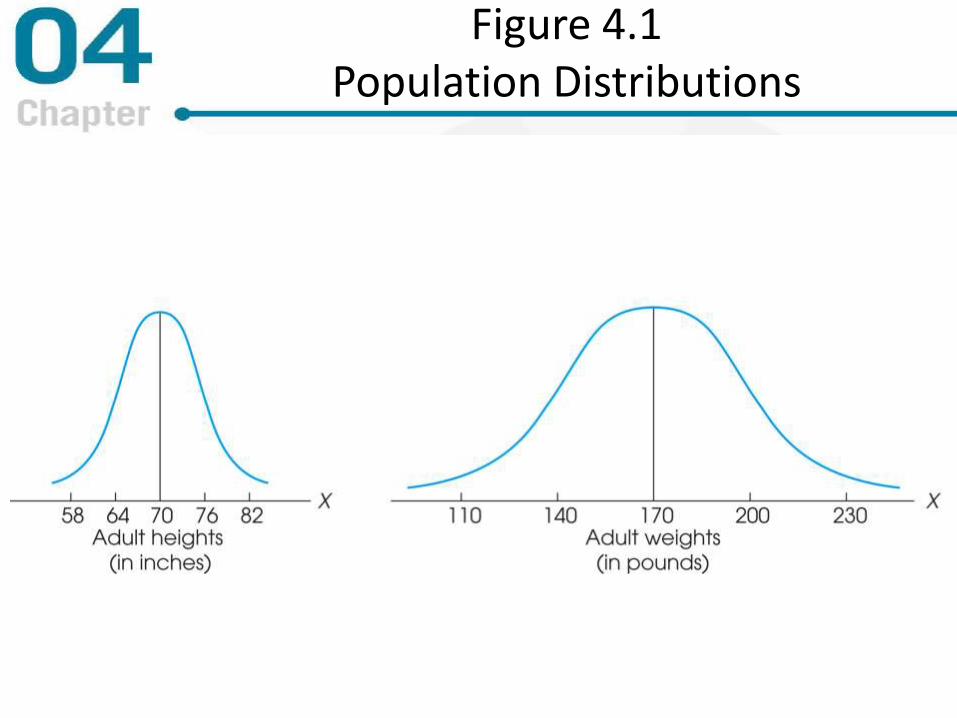
Figure 4.1 Population Distributions

Three Measures of Variability
• The Range
• The Variance
• The Standard Deviation

• The distance covered by the scores in a distribution
– From smallest value to highest value
• For continuous data, real limits are used
• Based on two scores, not all the data
– An imprecise, unreliable measure of variability
range = URL for Xmax — LRL for Xmin
4.2 The Range

4.3 Standard Deviation and Variance for a Population
• Most common and most important measureof variability is the standard deviation
– A measure of the standard, or average, distance from the mean
– Describes whether the scores are clustered closely around the mean or are widely scattered
• Calculation differs for population and samples
• Variance is a necessary companion concept to standard deviation but not the same concept

Defining the Standard Deviation
• Step One: Determine the Deviation
• Deviation is distance from the mean
• Step Two: Find a “sum of deviations” to use as a basis of finding an “average deviation”
– Two problems
• Deviations sum to 0 (because M is balance point)
• If sum always 0, “Mean Deviation” will always be 0.
– Need a new strategy!
Deviation score = X — μ
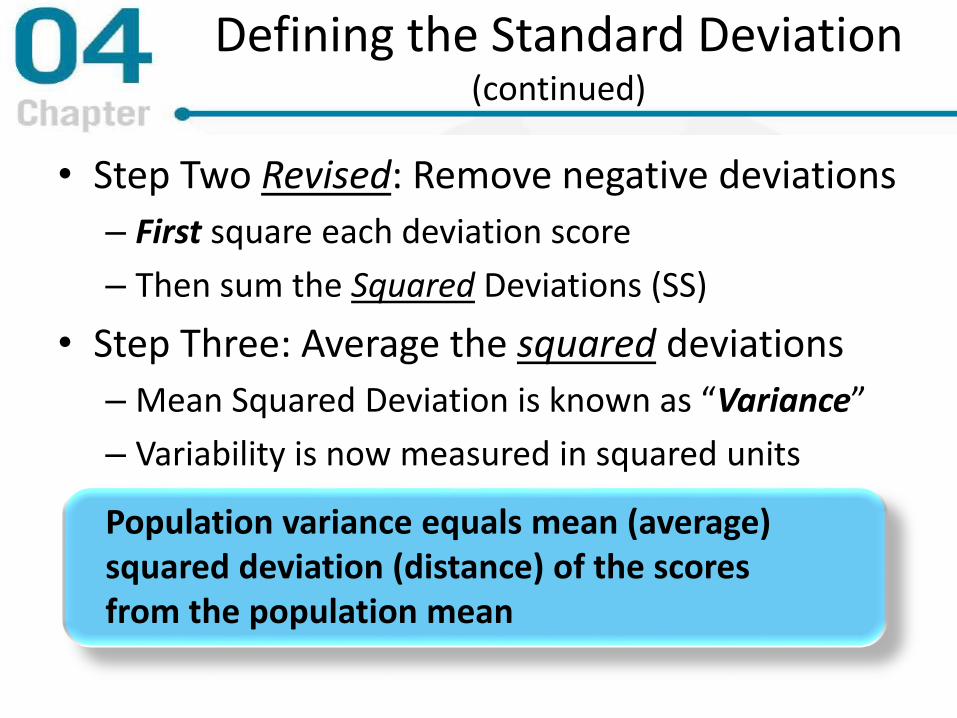
Defining the Standard Deviation(continued)
• Step Two Revised: Remove negative deviations
– First square each deviation score
– Then sum the Squared Deviations (SS)
• Step Three: Average the squared deviations
– Mean Squared Deviation is known as “Variance”
– Variability is now measured in squared units
Population variance equals mean (average) squared deviation (distance) of the scores from the population mean
Defining the Standard Deviation(continued)
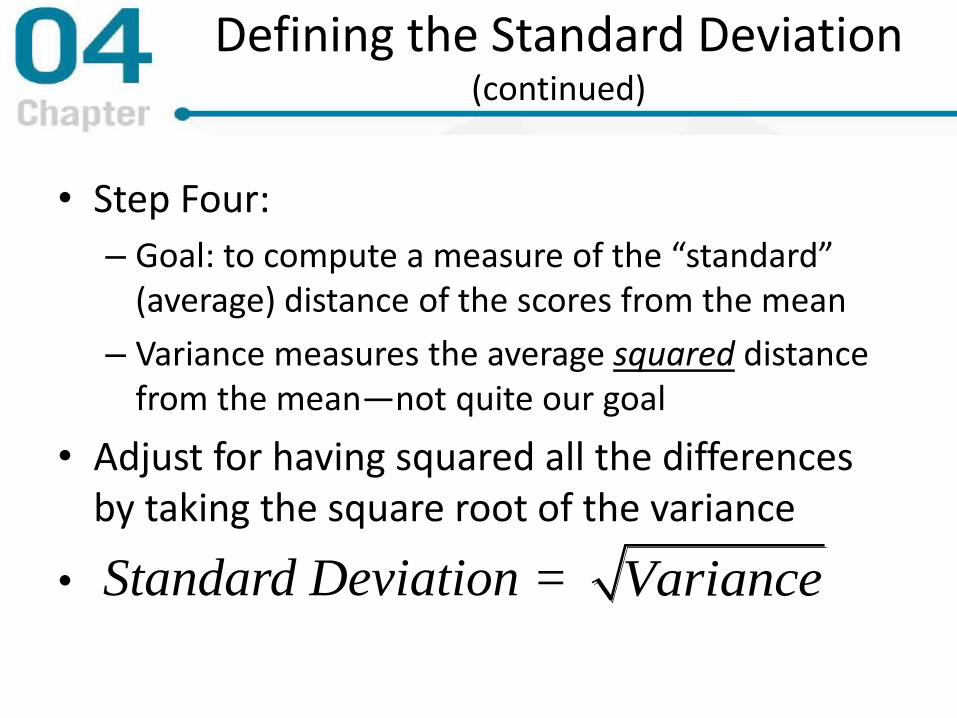
• Step Four:
– Goal: to compute a measure of the “standard” (average) distance of the scores from the mean
– Variance measures the average squared distance from the mean—not quite our goal
• Adjust for having squared all the differences by taking the square root of the variance
• Standard Deviation = Variance

Figure 4.2
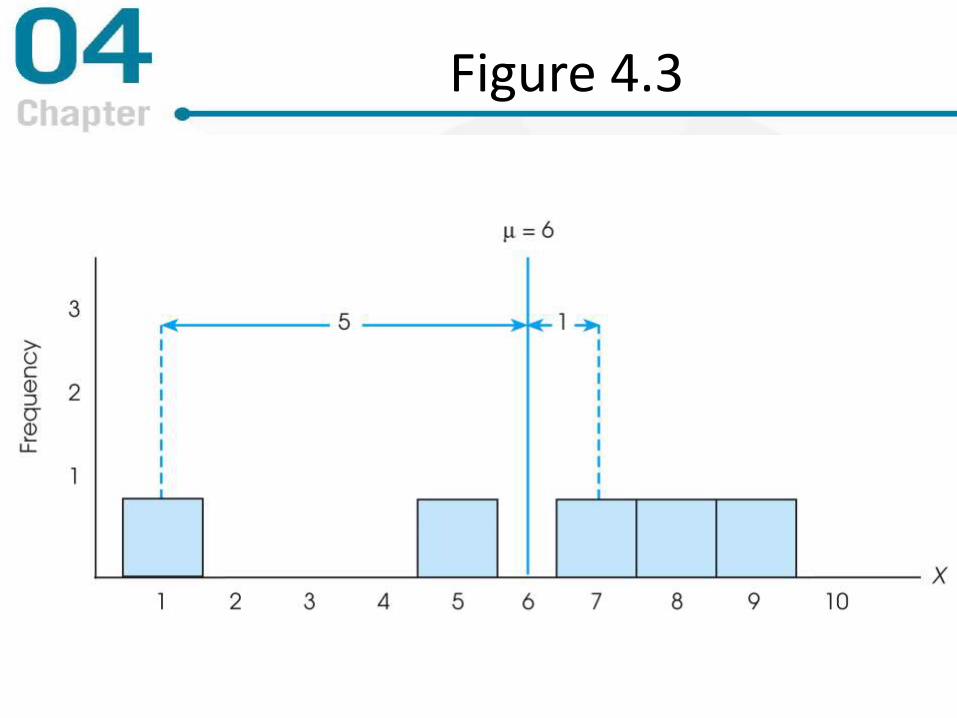
Figure 4.3
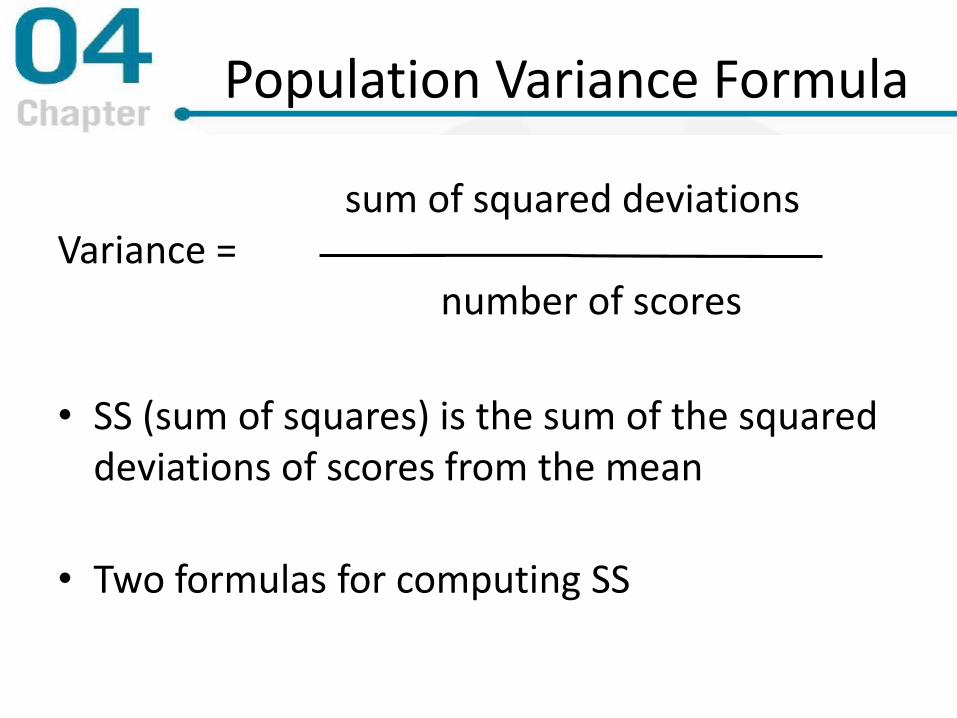
Population Variance Formula
sum of squared deviationsVariance =
number of scores
• SS (sum of squares) is the sum of the squared deviations of scores from the mean
• Two formulas for computing SS

Two formulas for SS
Definitional Formula
• Find each deviation score (X–μ)
• Square each deviation score, (X–μ)2
• Sum up the squared deviations
Computational Formula
2
XSS
N
XXSS
2
2
• Square each score and sum the squared scores
• Find the sum of scores, square it, divide by N
• Subtract the second part from the first

Caution Required!
When using the computational formula, remember…
22 )( XX
2XSS
2)( XSS

Population Variance:Formula and Notation
Formula
N
SS
N
SS
deviation standard
variance
Notation
• Variance is the average of squared deviations, so we identify population variance with a lowercase Greek letter sigma squared: σ2
• Standard deviation is the square root of the variance, so we identify it with a lowercase Greek letter sigma: σ

Learning Check
• Decide if each of the following statements is True or False.
• The computational & definitional formulas for SS sometimes give different results
T/F
• If all the scores in a data set are the same, the Standard Deviation is equal to 1.00
T/F
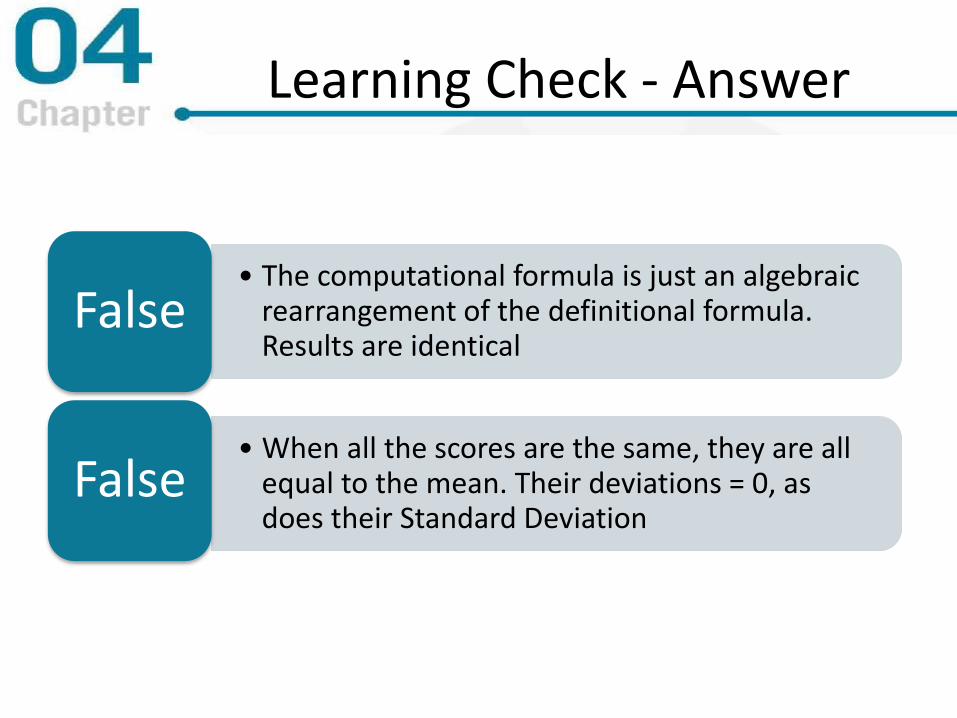
Learning Check - Answer
• The computational formula is just an algebraic rearrangement of the definitional formula. Results are identical
False
• When all the scores are the same, they are all equal to the mean. Their deviations = 0, as does their Standard Deviation
False
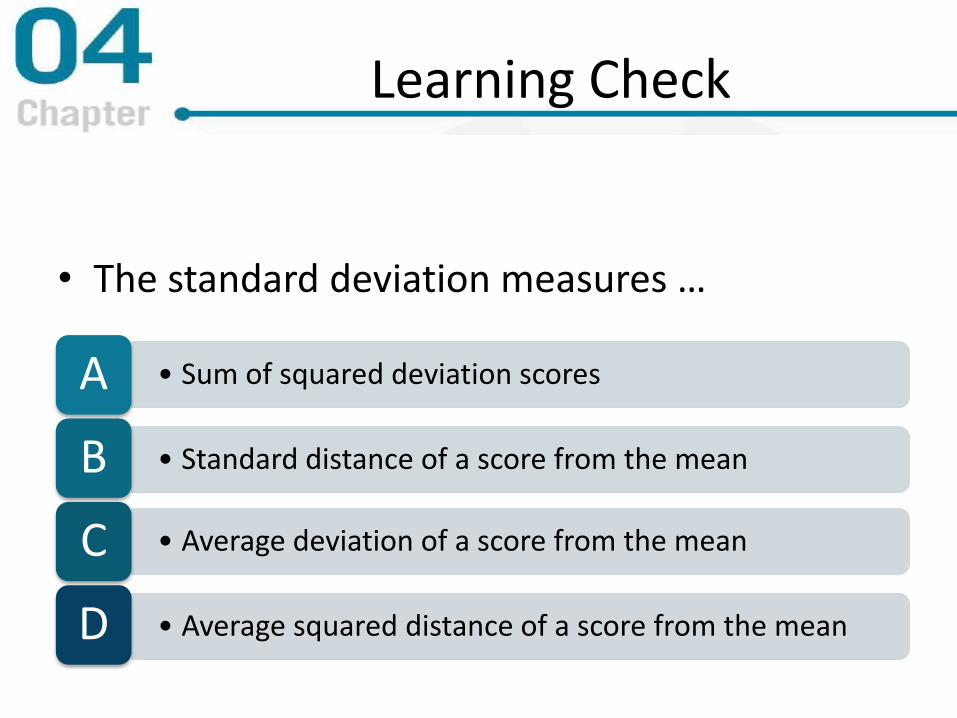
Learning Check
• The standard deviation measures …
• Sum of squared deviation scoresA
• Standard distance of a score from the meanB
• Average deviation of a score from the meanC
• Average squared distance of a score from the meanD

Learning Check - Answer
• The standard deviation measures …
• Sum of squared deviation scoresA
• Standard distance of a score from the meanB
• Average deviation of a score from the meanC
• Average squared distance of a score from the meanD

4.4 Standard Deviation and Variance for a Sample
• Goal of inferential statistics:
– Draw general conclusions about population
– Based on limited information from a sample
• Samples differ from the population
– Samples have less variability
– Computing the Variance and Standard Deviation in the same way as for a population would give a biased estimate of the population values

Figure 4.4 Population of Adult Heights

Sample Variance and
Standard Deviation
• Sum of Squares (SS) is computed as before
• Formula for Variance has n-1 rather than N in the denominator
• Notation uses s instead of σ
1
1
2
n
SS
n
SS
s sample of deviation standard
s sample of variance

Figure 4.5 Histogram for Sample of n = 8
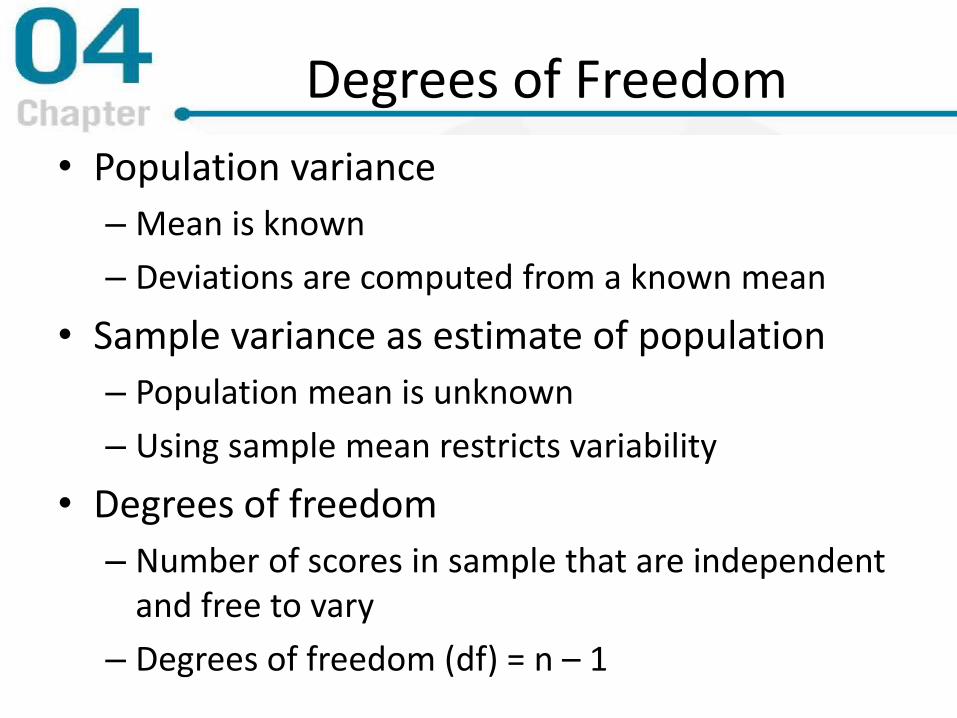
Degrees of Freedom
• Population variance
– Mean is known
– Deviations are computed from a known mean
• Sample variance as estimate of population
– Population mean is unknown
– Using sample mean restricts variability
• Degrees of freedom
– Number of scores in sample that are independent and free to vary
– Degrees of freedom (df) = n – 1
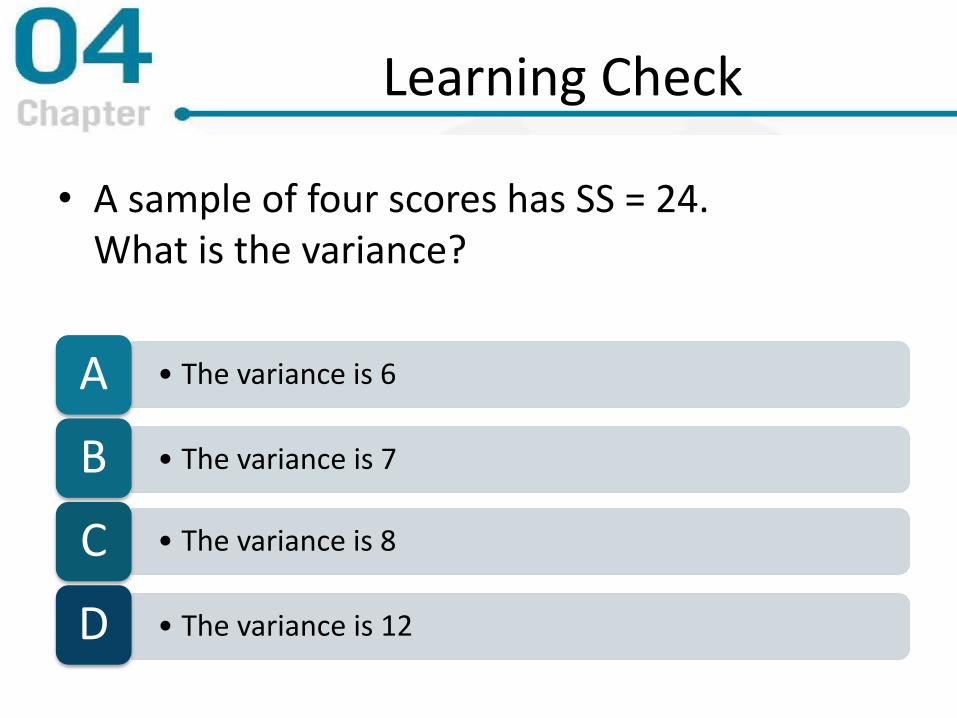
Learning Check
• A sample of four scores has SS = 24.What is the variance?
• The variance is 6A
• The variance is 7B
• The variance is 8C
• The variance is 12D
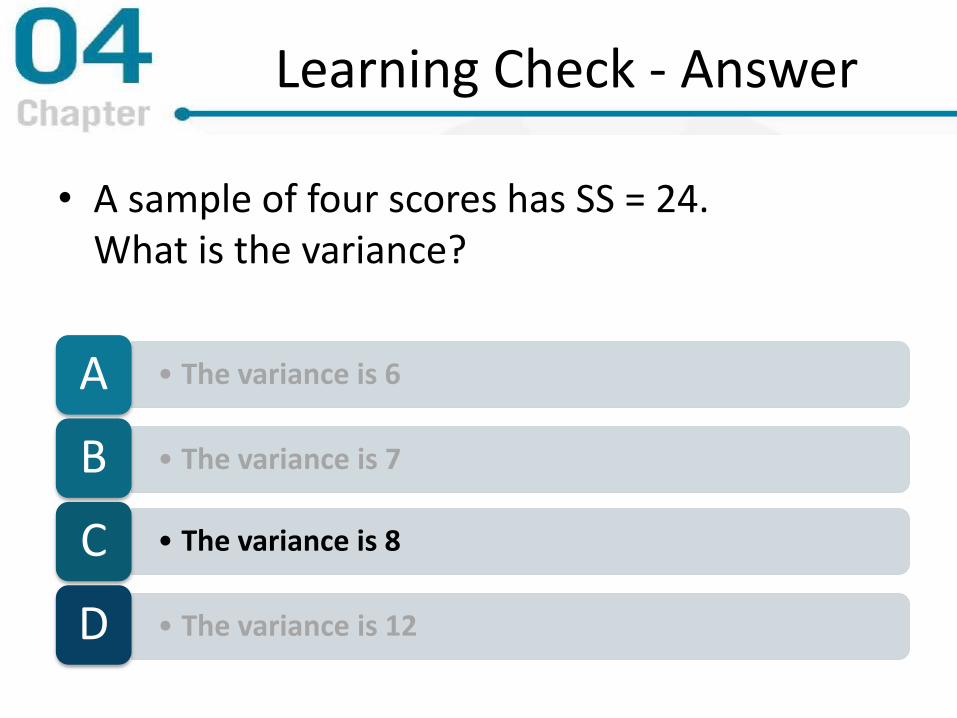
Learning Check - Answer
• A sample of four scores has SS = 24.What is the variance?
• The variance is 6A
• The variance is 7B
• The variance is 8C
• The variance is 12D

Learning Check
• Decide if each of the following statements is True or False.
• A sample systematically has less variability than a populationT/F
• The standard deviation is the distance from the Mean to the farthest point on the distribution curve
T/F

Learning Check - Answer
• Extreme scores affect variability, but are less likely to be included in a sample
True
• The standard deviation extends from the mean approximately halfway to the most extreme score
False

4.5 More About Variance and Standard Deviation
• Mean and standard deviation are particularly useful in clarifying graphs of distributions
• Biased and unbiased statistics
• Means and standard deviations together provide extremely useful descriptive statistics for characterizing distributions

Showing Mean andStandard Deviation in a Graph
• For both populations and samples it is easy to represent mean and standard deviation
– Vertical line in the “center” denotes location of mean
– Horizontal line to right, left (or both) denotes the distance of one standard deviation

Figure 4.6 Showing Means and Standard Deviations in Graphs

Sample Variance as anUnbiased Statistic
• Unbiased estimate of a population parameter
– Average value of statistic is equal to parameter
– Average value uses all possible samples of a particular size n
– Corrected standard deviation formula (dividing by n-1) produces an unbiased estimate of the population variance
• Biased estimate of a population parameter
– Systematically overestimates or underestimates the population parameter
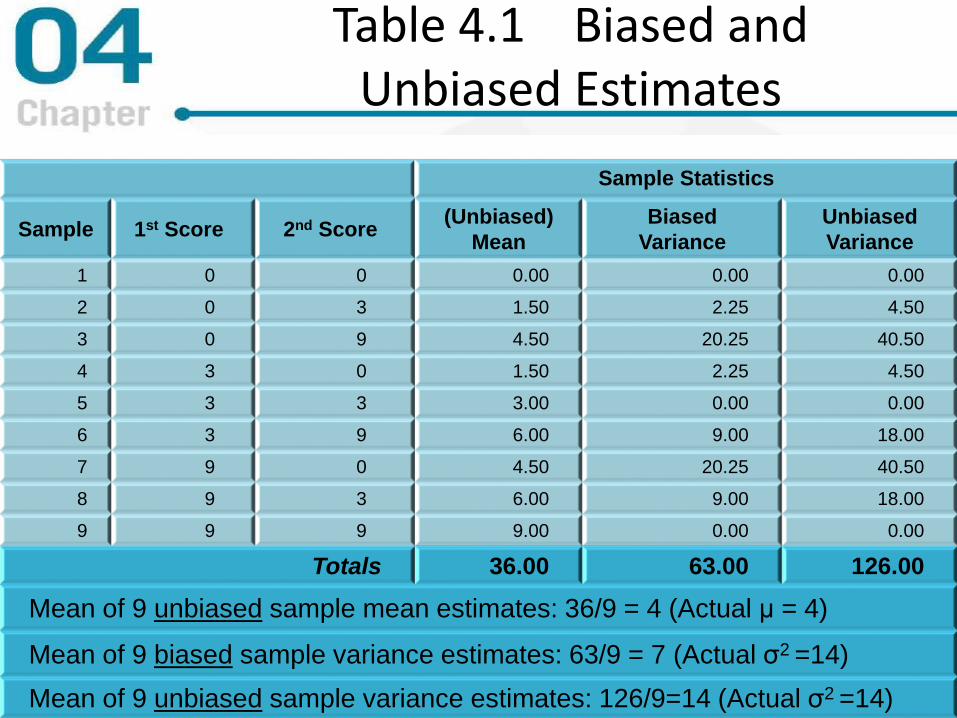
Table 4.1 Biased andUnbiased Estimates
Sample Statistics
Sample 1st Score 2nd Score(Unbiased)
Mean
Biased
Variance
Unbiased
Variance
1 0 0 0.00 0.00 0.00
2 0 3 1.50 2.25 4.50
3 0 9 4.50 20.25 40.50
4 3 0 1.50 2.25 4.50
5 3 3 3.00 0.00 0.00
6 3 9 6.00 9.00 18.00
7 9 0 4.50 20.25 40.50
8 9 3 6.00 9.00 18.00
9 9 9 9.00 0.00 0.00
Totals 36.00 63.00 126.00
Mean of 9 unbiased sample mean estimates: 36/9 = 4 (Actual μ = 4)
Mean of 9 biased sample variance estimates: 63/9 = 7 (Actual σ2 =14)
Mean of 9 unbiased sample variance estimates: 126/9=14 (Actual σ2 =14)

Standard Deviation and Descriptive Statistics
• A standard deviation describes scores in terms of distance from the mean
• Describe an entire distribution with just two numbers (M and s)
• Reference to both allows reconstruction of the measurement scale from just these two numbers (Figure 4.7)

Figure 4.7 (Sample) n = 20, M = 36, and s = 4

Transformations of Scale
• Adding a constant to each score
– The Mean is changed
– The standard deviation is unchanged
• Multiplying each score by a constant
– The Mean is changed
– Standard Deviation is also changed
– The Standard Deviation is multiplied by that constant

Variance and Inferential Statistics
• Goal of inferential statistics is to detect meaningful and significant patterns in research results
• Variability in the data influences how easy it is to see patterns
– High variability obscures patterns that would be visible in low variability samples
– Variability is sometimes called error variance

Figure 4.8 Experiments withhigh and low variability
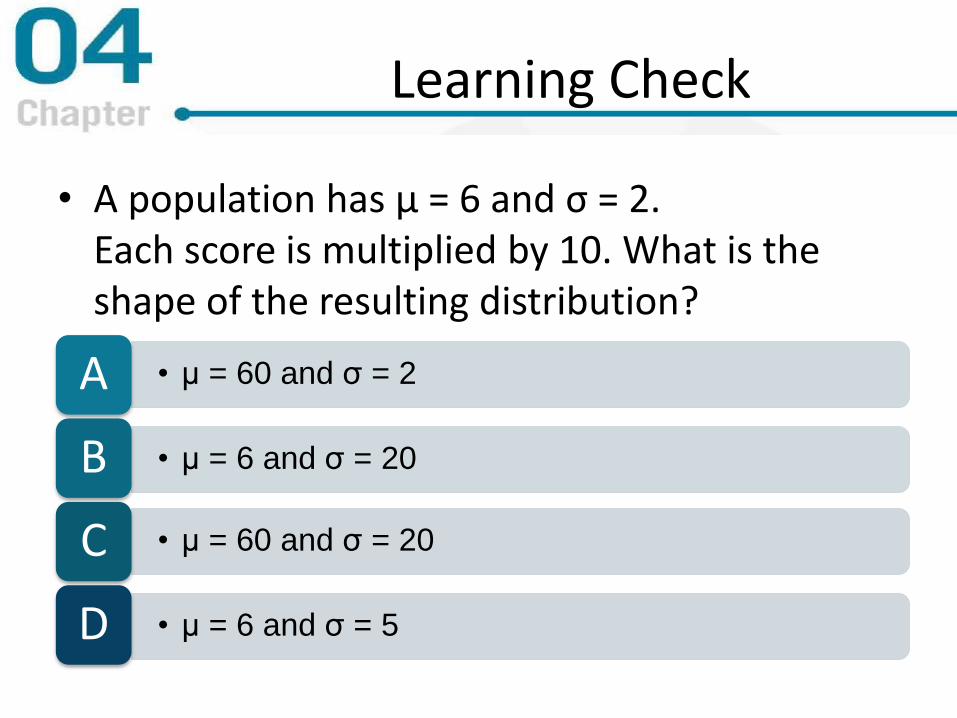
Learning Check
• A population has μ = 6 and σ = 2. Each score is multiplied by 10. What is the shape of the resulting distribution?
• μ = 60 and σ = 2A
• μ = 6 and σ = 20B
• μ = 60 and σ = 20C
• μ = 6 and σ = 5D

Learning Check - Answer
• A population has μ = 6 and σ = 2. Each score is multiplied by 10. What is the shape of the resulting distribution?
• μ = 60 and σ = 2A
• μ = 6 and σ = 20B
• μ = 60 and σ = 20C
• μ = 6 and σ = 5D

Learning Check TF
• Decide if each of the following statements is True or False.
• A biased statistic has been influenced by researcher errorT/F
• On average, an unbiased sample statistic has the same value as the population parameter
T/F

Learning Check - Answer
• Bias refers to the systematic effect of using sample data to estimate a population parameter
False
• Each sample’s statistic differs from the population parameter, but the average of all samples will equal the parameter
True

Figure 4.9 SPSS Summary Table (n = 8 ) from Example 4.5

AnyQuestions
?
Concepts?
Equations


![Measures of Variability for Graphical Models · Measures of Structure Variability Measures of Structure Variability All of these measures can be rescaled to vary in the [0;1] interval](https://static.documents.pub/doc/80x56/5fca5b8d790dd006415e4823/measures-of-variability-for-graphical-models-measures-of-structure-variability-measures.jpg)


