12
Measuring a (MapReduce) Data Center Srikanth Kandula Sudipta Sengupta Albert Greenberg Parveen Patel Ronnie Chaiken
| Date post: | 21-Dec-2015 |
| Category: |
Documents |
| View: | 213 times |
| Download: | 0 times |
Measuring a (MapReduce) Data Center
Srikanth Kandula Sudipta Sengupta Albert GreenbergParveen Patel Ronnie Chaiken
… … …… ……
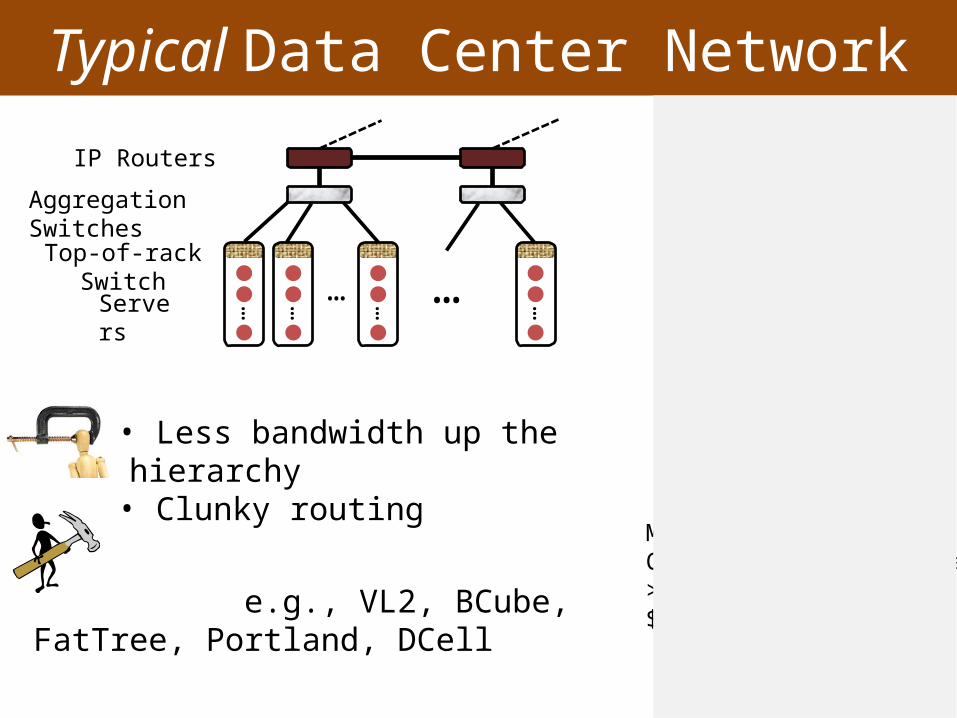
Aggregation Switches
Top-of-rack Switch
Servers
24-, 48- port1G to server, 10Gbps up~ $7K
Modular switchChassis + up to 10 blades>140 10G ports$150K-$200K
ToR
Agg
Typical Data Center Network
IP Routers
• Less bandwidth up the hierarchy• Clunky routing
e.g., VL2, BCube, FatTree, Portland, DCell
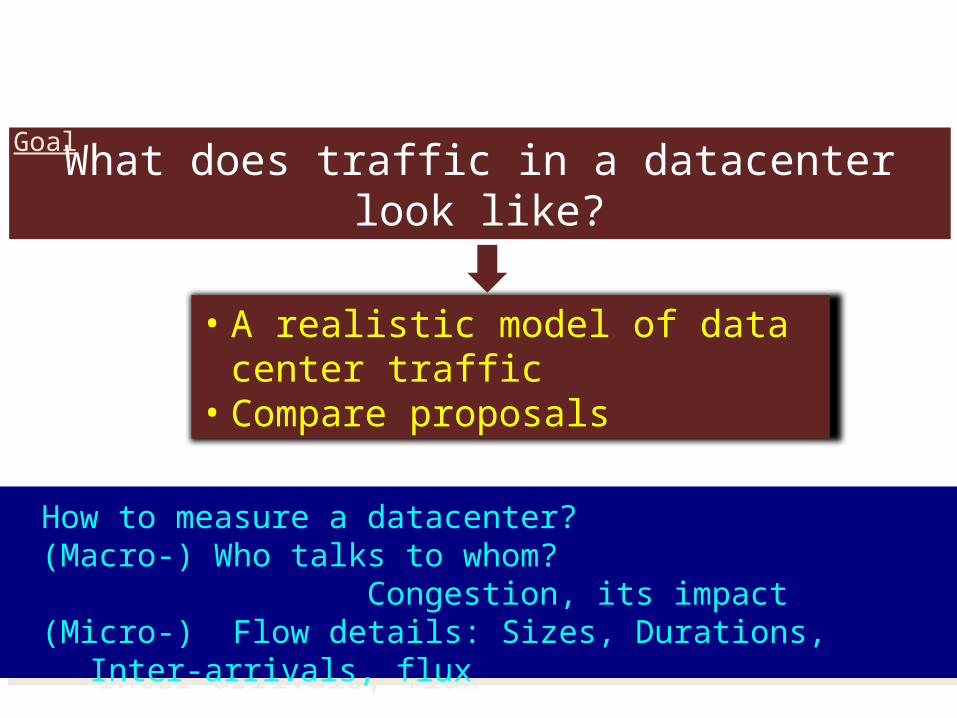
What does traffic in a datacenter look like?
• A realistic model of data center traffic• Compare proposals
How to measure a datacenter?(Macro-) Who talks to whom? Congestion, its impact(Micro-) Flow details: Sizes, Durations, Inter-arrivals, flux
How to measure a datacenter?(Macro-) Who talks to whom? Congestion, its impact(Micro-) Flow details: Sizes, Durations, Inter-arrivals, flux
Goal
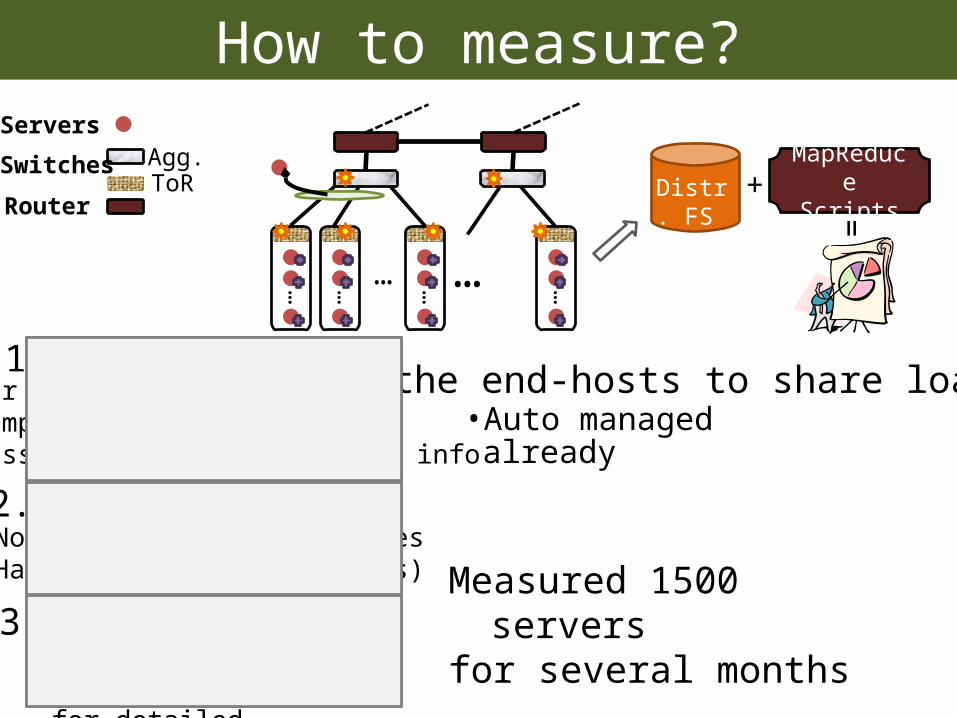
How to measure?
… … …… ……
1. SNMP reports• per port: in/out octets• sample every few minutes• miss server- or flow- level info
2. Packet Traces• Not native on most switches• Hard to set up (port-spans)
3. Sampled NetFlow
Use the end-hosts to share load
Tradeoff: CPU overhead on switch for detailed traces
• Auto managed already
ToRAgg.Switches
Servers
Router
MapReduce ScriptsDistr. FS +
=
Measured 1500 servers for several months
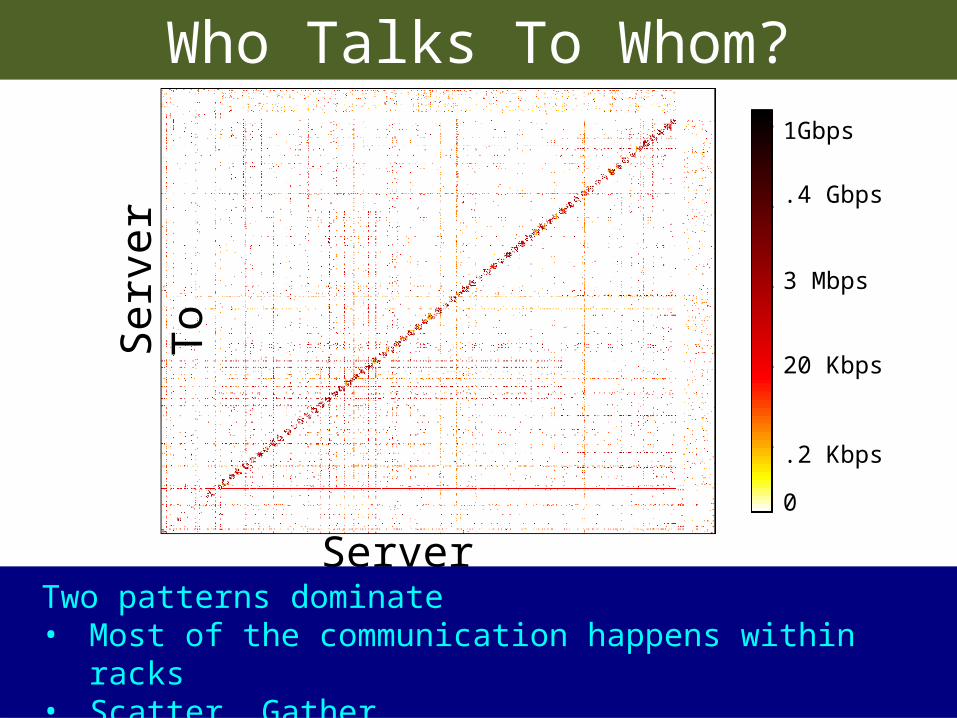
Server From
Serv
er T
o1Gbps
.4 Gbps
3 Mbps
20 Kbps
.2 Kbps
0
Who Talks To Whom?
Two patterns dominate• Most of the communication happens within racks• Scatter, Gather
Two patterns dominate• Most of the communication happens within racks• Scatter, Gather
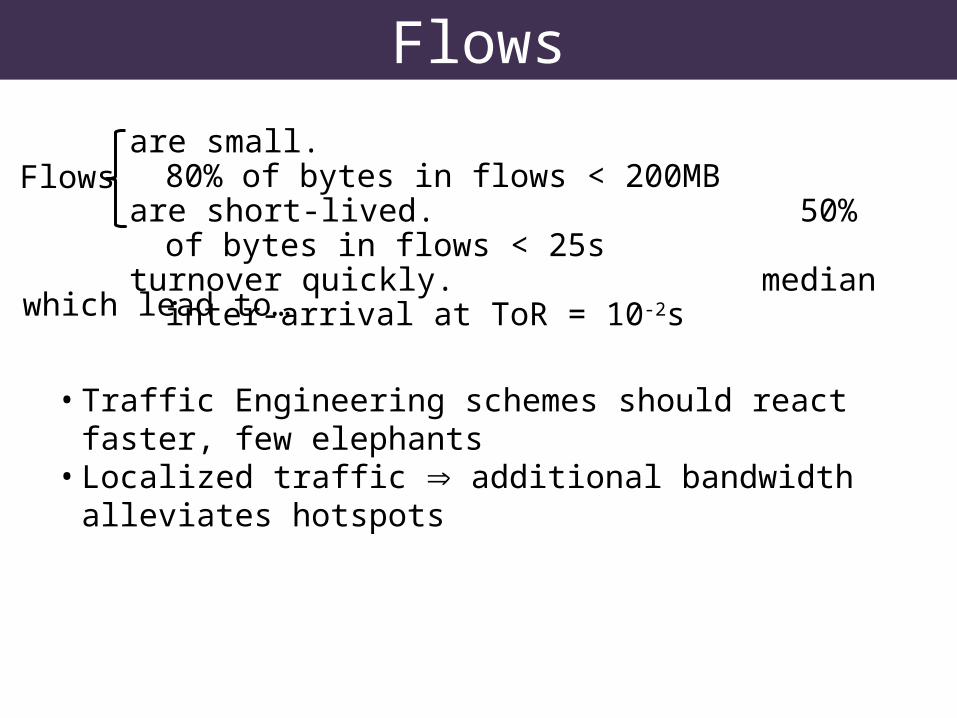
Flows
are small. 80% of bytes in flows < 200MBare short-lived. 50% of bytes in flows < 25sturnover quickly. median inter-arrival at ToR = 10-2s
Flows
which lead to…
• Traffic Engineering schemes should react faster, few elephants• Localized traffic additional bandwidth alleviates hotspots
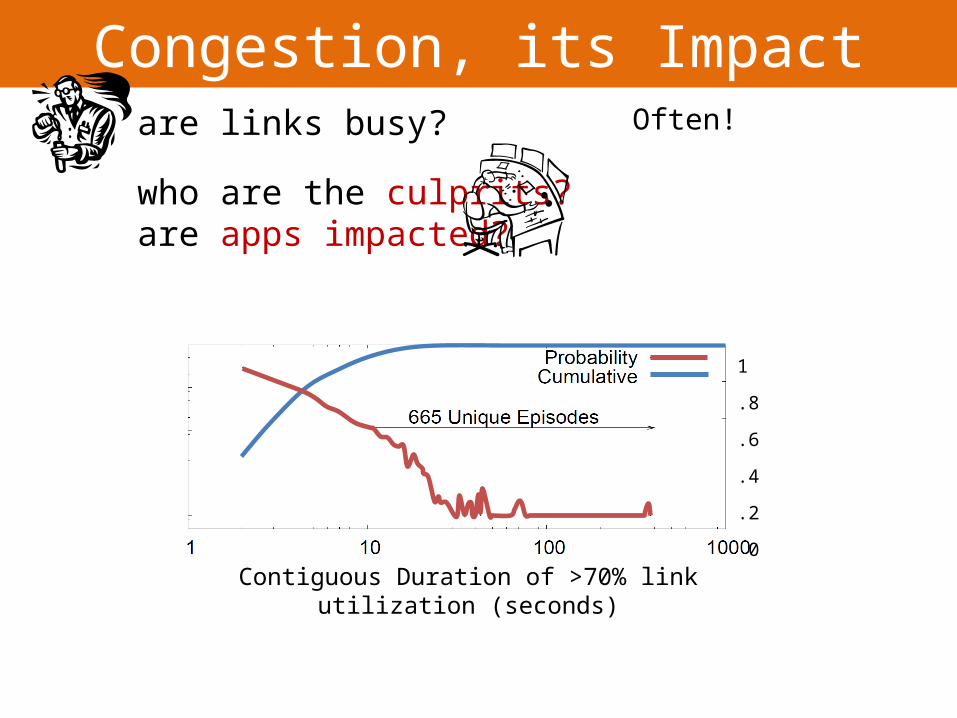
Congestion, its Impactare links busy?
who are the culprits? are apps impacted?
Contiguous Duration of >70% link utilization (seconds)
1
.8
.6
.4
.2
0
Often!
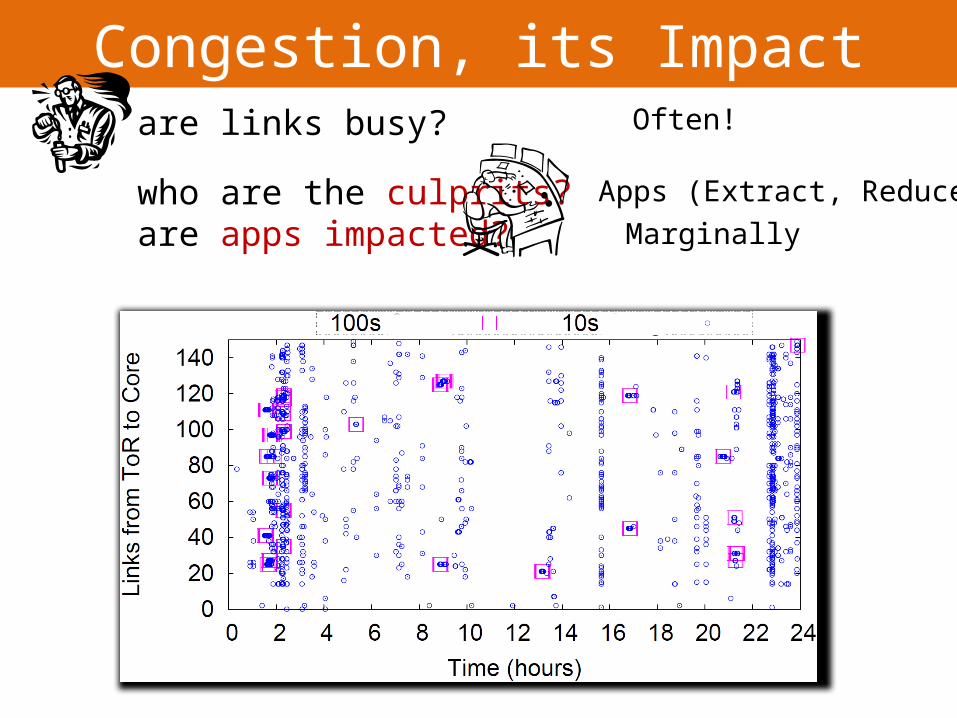
Congestion, its Impactare links busy?
who are the culprits? are apps impacted?
Apps (Extract, Reduce)
Marginally
Often!
Measurement Alternatives
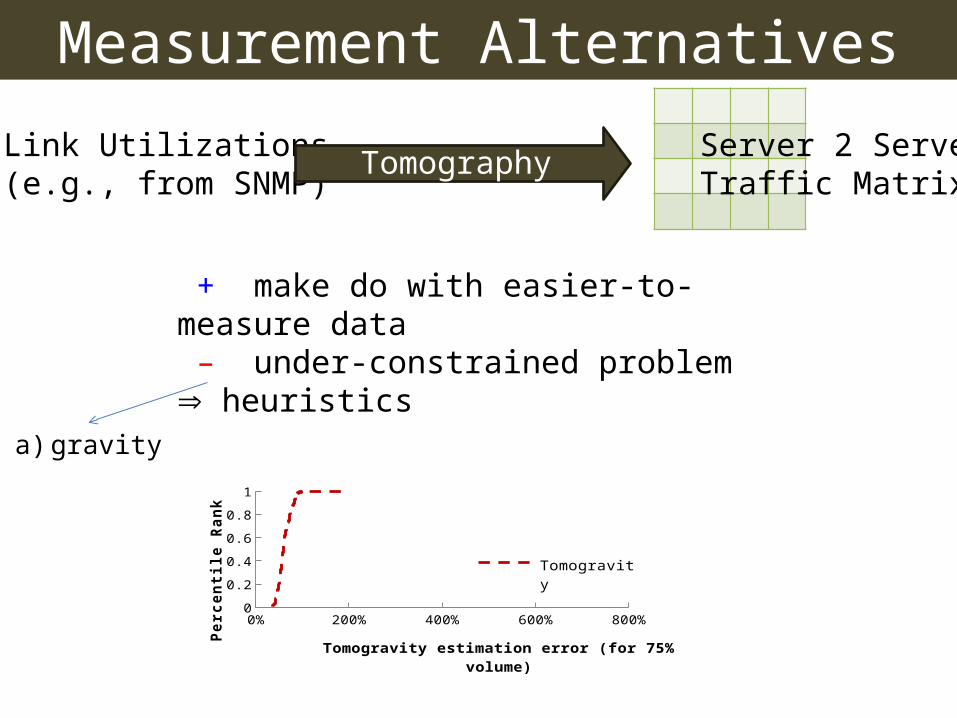
Link Utilizations(e.g., from SNMP)
Tomography Server 2 ServerTraffic Matrix
+ make do with easier-to-measure data – under-constrained problem heuristics
a) gravity
0% 200% 400% 600% 800%0
0.2
0.4
0.6
0.8
1
Tomogravity
Tomogravity estimation error (for 75% volume)
Perc
entil
e Ra
nk
Measurement Alternatives
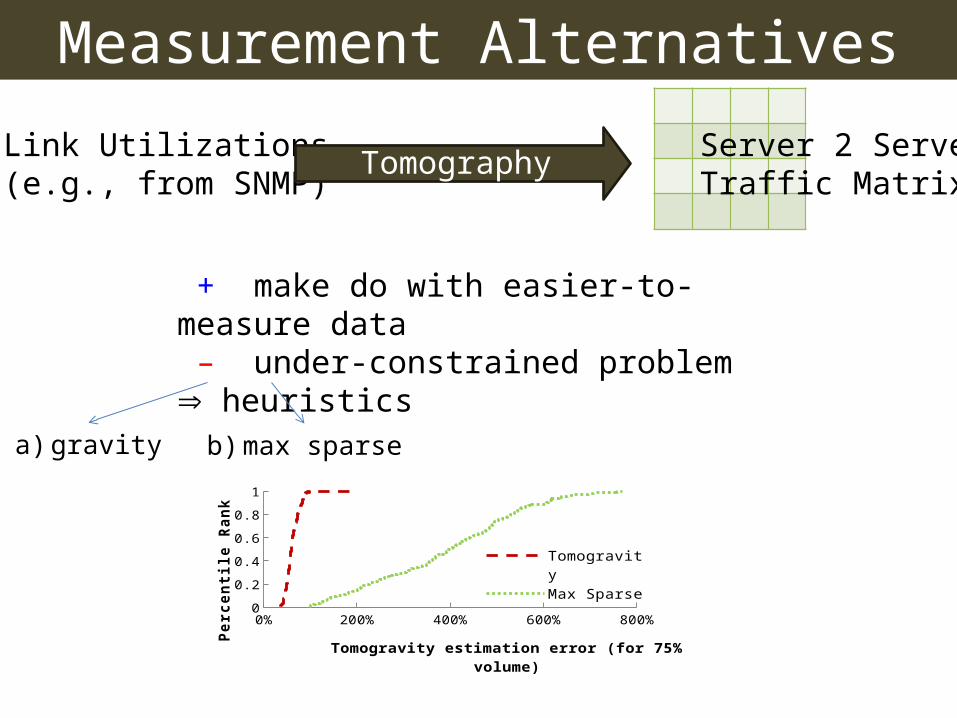
Link Utilizations(e.g., from SNMP)
Tomography Server 2 ServerTraffic Matrix
+ make do with easier-to-measure data – under-constrained problem heuristics
a) gravity b) max sparse
0% 200% 400% 600% 800%0
0.2
0.4
0.6
0.8
1
Tomogravity
Max Sparse
Tomogravity estimation error (for 75% volume)
Perc
entil
e Ra
nk
Measurement Alternatives
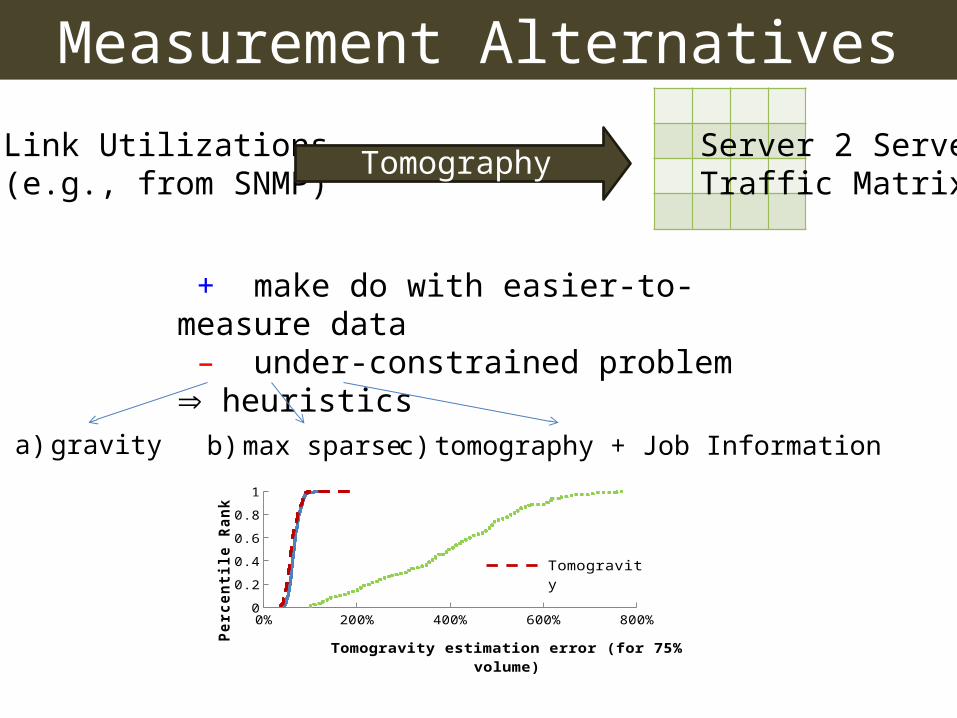
Link Utilizations(e.g., from SNMP)
Tomography Server 2 ServerTraffic Matrix
+ make do with easier-to-measure data – under-constrained problem heuristics
a) gravity b) max sparse c) tomography + Job Information
0% 200% 400% 600% 800%0
0.2
0.4
0.6
0.8
1
TomogravityTomog+job infoMax SparseTomogravity
Tomogravity estimation error (for 75% volume)
Perc
entil
e Ra
nk
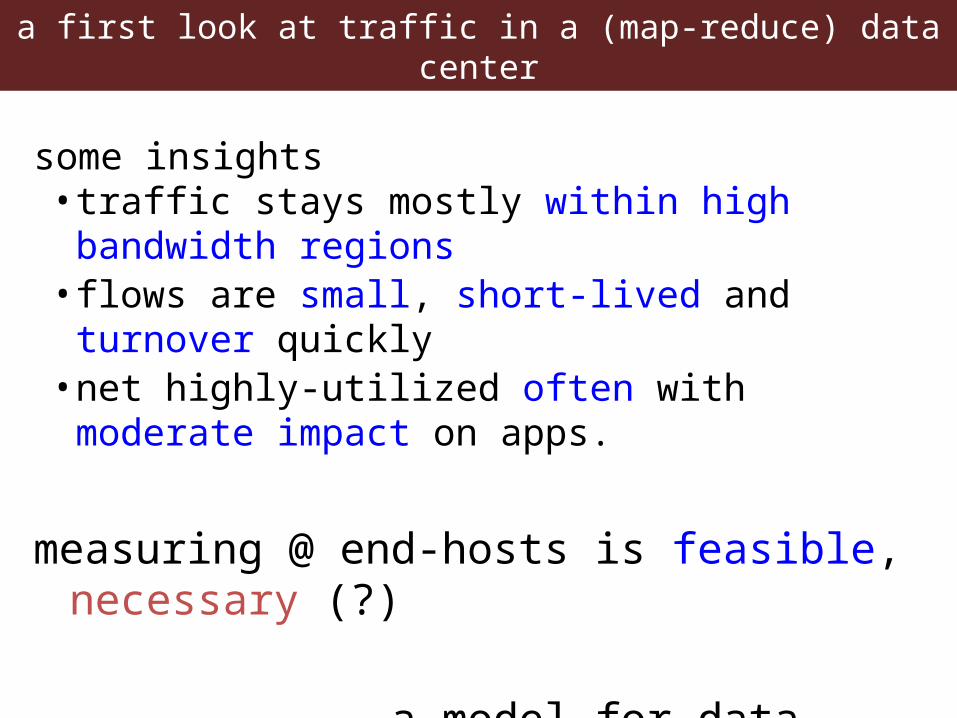
a first look at traffic in a (map-reduce) data center
some insights• traffic stays mostly within high bandwidth regions• flows are small, short-lived and turnover quickly• net highly-utilized often with moderate impact on apps.
measuring @ end-hosts is feasible, necessary (?)
→ a model for data center traffic


