Page 1
Measuring (and Managing) the Costs of
Student AttritionNate Johnson
Postsecondary Analytics423 East Virginia StreetTallahassee, Florida 32301
State Policy Workshop: State Higher Education
Executive Officers
Chicago, August 8, 2012www.postsecondaryanalytics.com @NateJohnsonFL
Page 2
About the Cost of Attrition Project
• Initiative of the Delta Project on Postsecondary Education Costs, Productivity, & Accountability
• Work undertaken by Jane Wellman, Donna Desrochers, Colleen Lenihan, Patricia Steele, Nate Johnson
• Funded through a grant from the Bill & Melinda Gates Foundation
• Research and consultations took place 2010-2011
• Delta Project now housed at the American Institutes for Research
Page 3
Questions We Sought to Answer
• What is attrition?
• How should it be defined for public policy?
• How should we talk about it?
• How much does higher education spend on students who do not finish?
• What are the most helpful ways to disaggregate attrition costs?
• How can better understanding of attrition and costs improve policy and practice?
Page 4
Defining Attrition
• Alternative focus to graduation, but not mirror image
• Intentionally conservative definition of “attrition”
Page 5
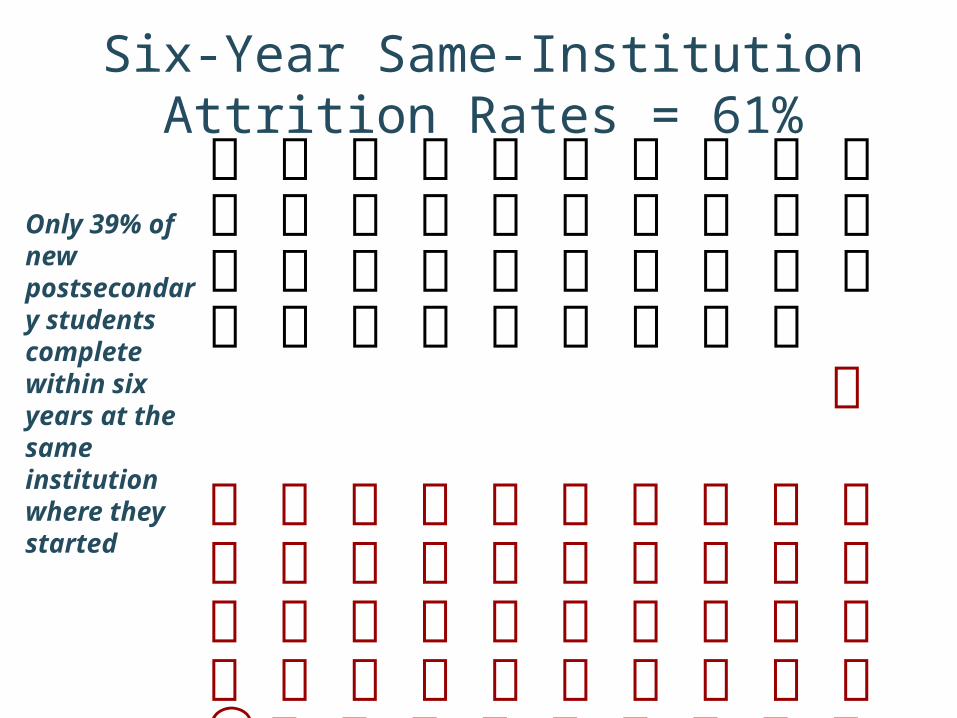
Six-Year Same-Institution Attrition Rates = 61%
Only 39% of new postsecondary students complete within six years at the same institution where they started
Page 6
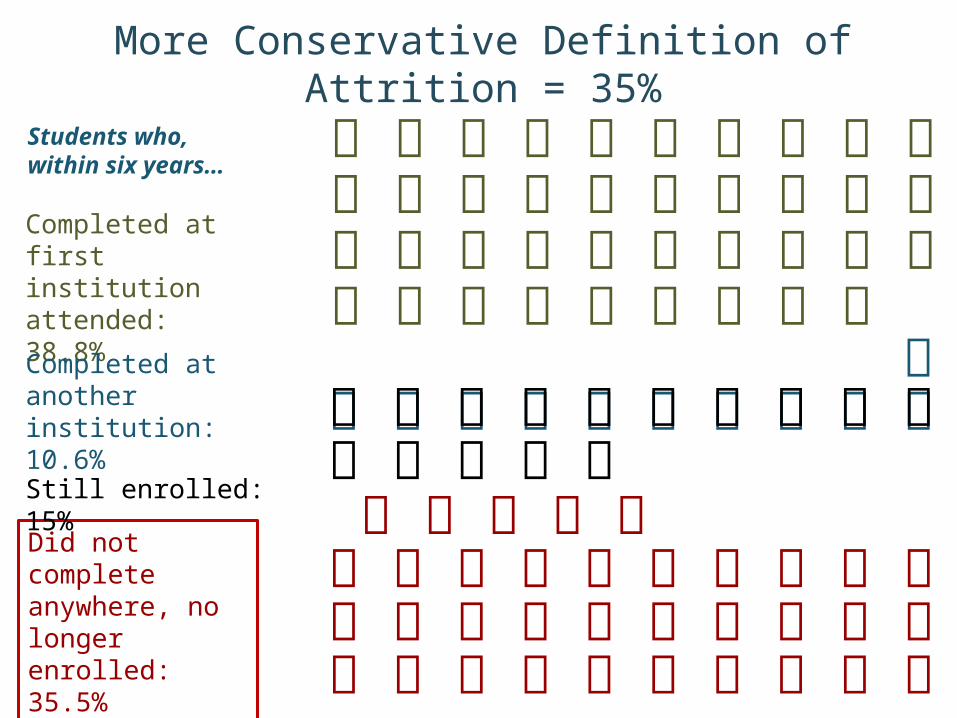
More Conservative Definition of Attrition = 35%
Completed at first institution attended: 38.8%
Did not complete anywhere, no longer enrolled: 35.5%
Completed at another institution: 10.6%
Still enrolled: 15%
Students who, within six years…
Page 7
Defining Costs
• Beginning Postsecondary Students 2004/09 restricted use data
• Linked each student to institution-level IPEDS data
• Calculated expenditures per FT student (Delta Project “Education and Related Expenditures”)
• Calculated cumulative cost for each student
Page 8
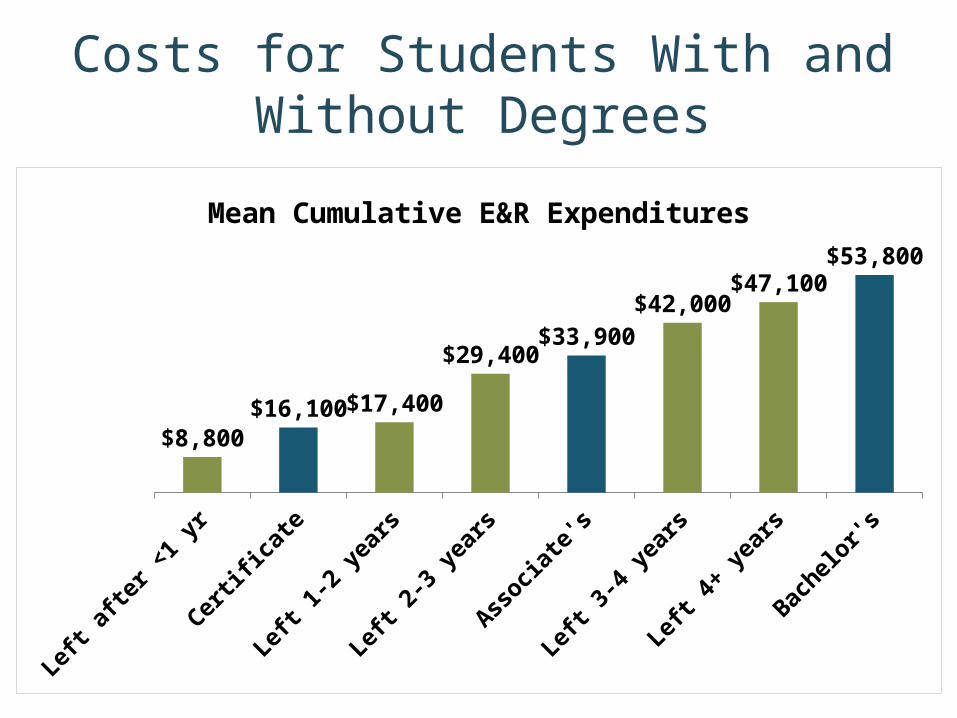
Costs for Students With and Without Degrees
Left a
fter
<1
yr
Certifi
cate
Left 1
-2 y
ears
Left 2
-3 y
ears
Assoc
iate
's
Left 3
-4 y
ears
Left 4
+ y
ears
Bache
lor's
$8,800 $16,100 $17,400
$29,400 $33,900
$42,000 $47,100
$53,800
Mean Cumulative E&R Expenditures
Page 9
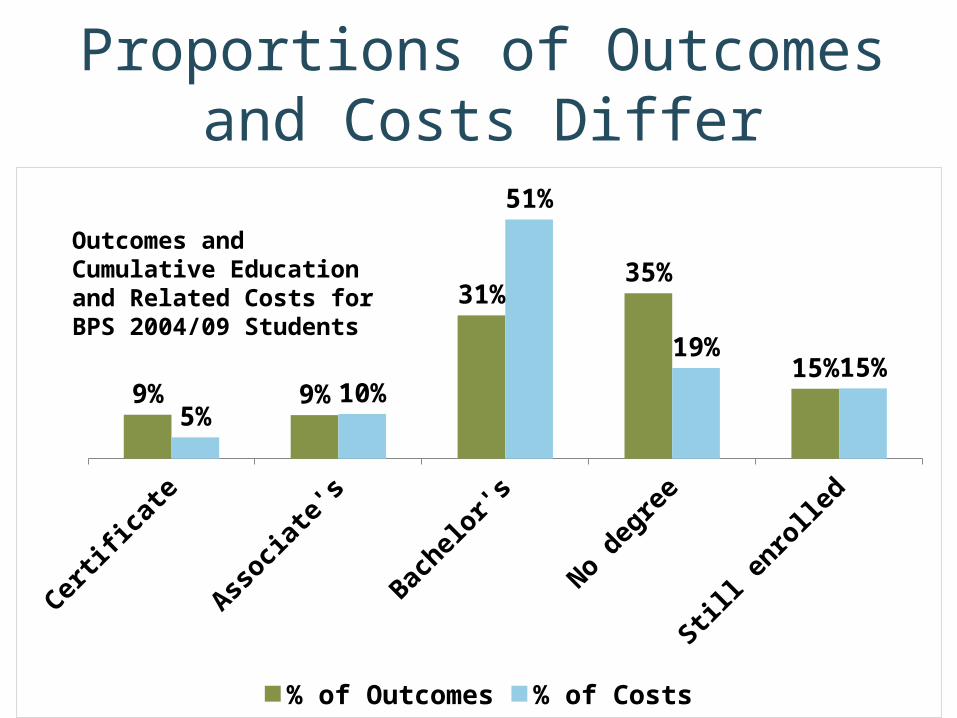
Proportions of Outcomes and Costs Differ
Certifica
te
Assoc
iate
's
Bache
lor's
No
degr
ee
Still
enr
olle
d
9% 9%
31%35%
15%
5%10%
51%
19%15%
% of Outcomes % of Costs
Outcomes and Cumulative Education and Related Costs for BPS 2004/09 Students
Page 10
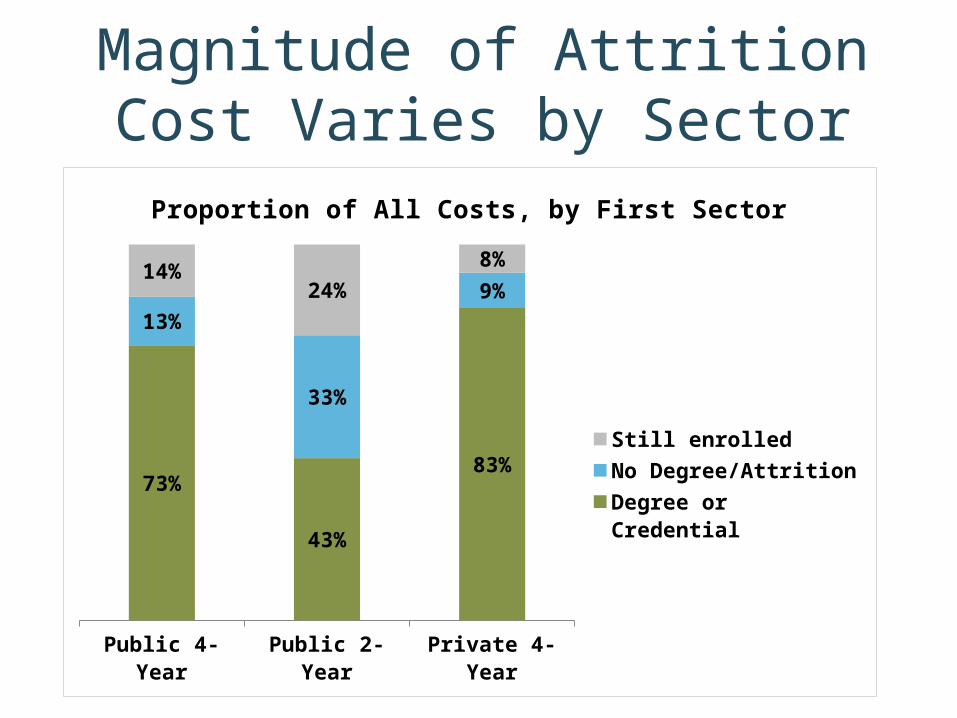
Magnitude of Attrition Cost Varies by Sector
Public 4-Year Public 2-Year Private 4-Year
73%
43%
83%
13%
33%
9%14%
24%
8%
Proportion of All Costs, by First Sector
Still enrolled
No Degree/Attrition
Degree or Credential
Page 11
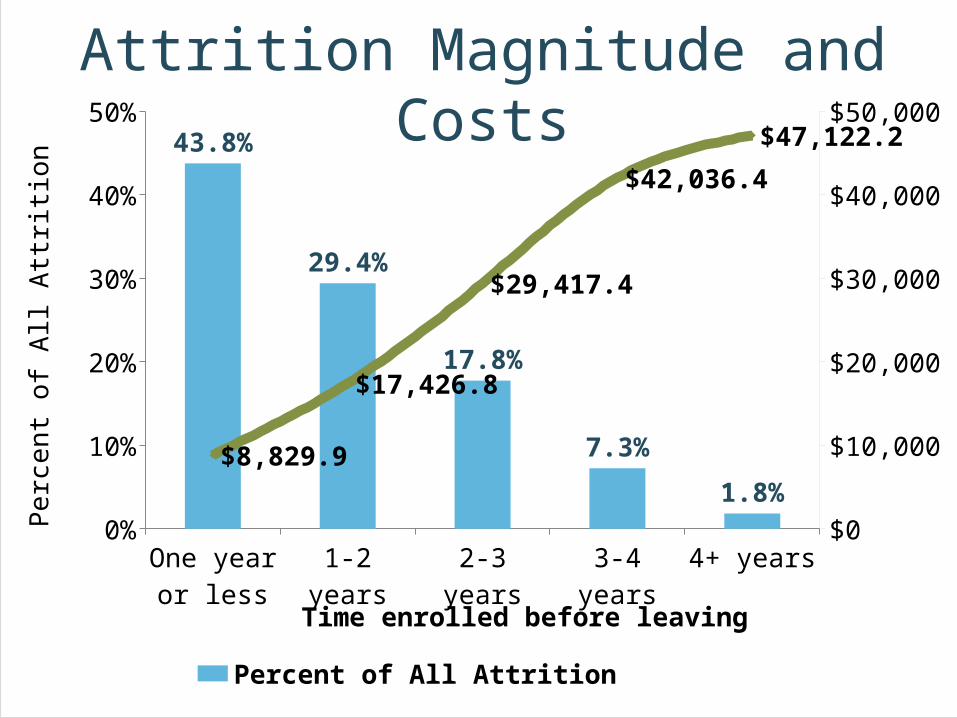
One year or less
1-2 years 2-3 years 3-4 years 4+ years$0
$10,000
$20,000
$30,000
$40,000
$50,000
0%
10%
20%
30%
40%
50%43.8%
29.4%
17.8%
7.3%
1.8%
$8,829.9
$17,426.8
$29,417.4
$42,036.4
$47,122.2
Percent of All Attrition
Time enrolled before leaving
Pe
rce
nt
of
All A
ttri
tio
n
Attrition Magnitude and Costs
Page 12
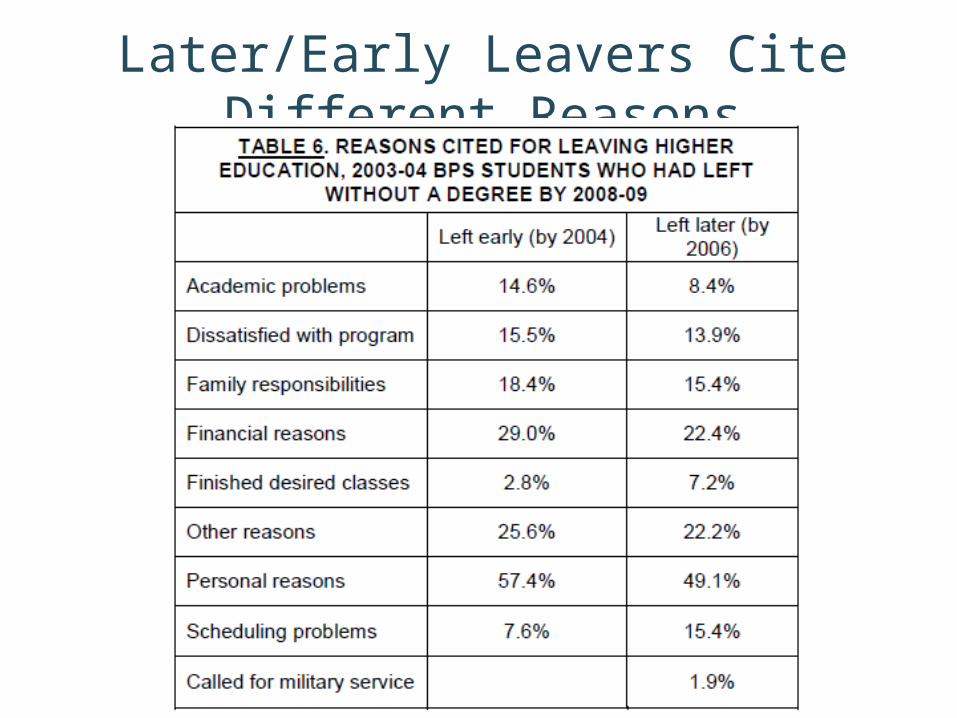
Later/Early Leavers Cite Different Reasons
Page 13
Policy and Practice Implications for States
• More reason to prioritize “near-completers”
• Suggests different types of interventions and investments:
– Broad-based efforts for early intervention, where volume is so high
– More focused efforts on later-stage at-risk students, where cost per student is high
• Potential to further disaggregate costs and causes, model different types of high- and low-cost strategies to reduce attrition
• Other ideas? How could this type of analysis help?
Page 14
Financial Aid Investments and Attrition
• Positive but small returns to aid investments
• Where is biggest potential impact on completion rates?
• Middle terms/years focus?
• Risk profiles more accurate: ability to predict diagnose and intervene
• Potentially greater ROI
• More analysis & experimentation needed
Page 15
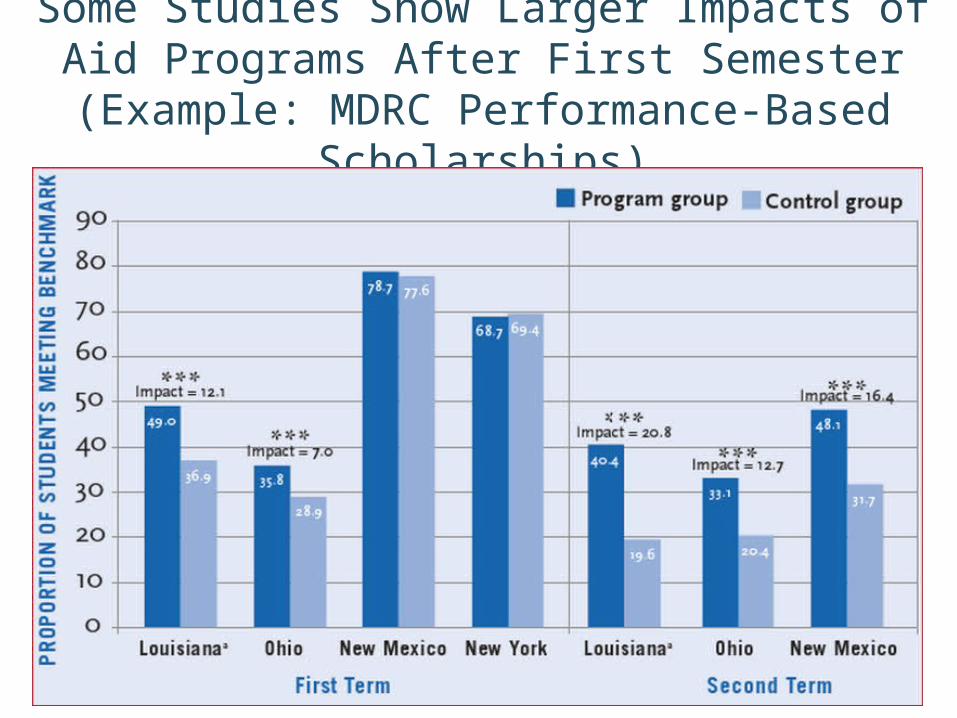
Some Studies Show Larger Impacts of Aid Programs After First Semester (Example: MDRC Performance-Based Scholarships)
Page 16
Key Recommendation: Look at Current Attrition
• Do not wait six years to calculate a graduation rate
• Look every year at year-to-year attrition and retention patterns
• Who is dropping out between first- and second-year?
• Second and third? Third and fourth?
• What do you know about these students?
• Academic status, loan burden, institutions, regional employment trends, UI records…
Page 17
Projecting Attrition (and Retention and Graduation)
• Cohort studies not always practical or useful
• Length of time needed poses problems
– Data availability & quality
– Measuring phenomena long ago
• Alternative: estimate attrition using enrollment projection tools
• Markov chain method uses most recent year-to-year retention/dropout rates
• Only two-three years of student data needed
Page 18
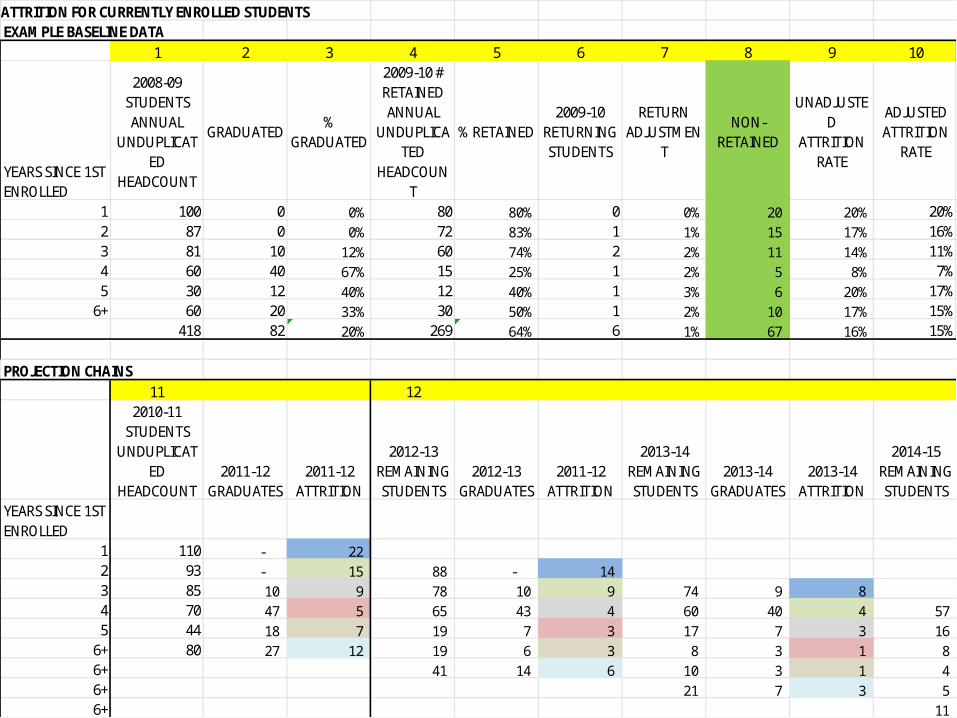
STEPS TO PROJECT LONG-TERM ATTRITION FOR CURRENTLY ENROLLED STUDENTSEXAMPLE BASELINE DATA
1 2 3 4 5 6 7 8 9 10
YEARS SINCE 1ST ENROLLED
2008-09 STUDENTS ANNUAL
UNDUPLICATED
HEADCOUNT
GRADUATED%
GRADUATED
2009-10 # RETAINED ANNUAL
UNDUPLICATED
HEADCOUNT
% RETAINED2009-10
RETURNING STUDENTS
RETURN ADJUSTMEN
T
NON-RETAINED
UNADJUSTED
ATTRITION RATE
ADJUSTED ATTRITION
RATE
1 100 0 0% 80 80% 0 0% 20 20% 20%2 87 0 0% 72 83% 1 1% 15 17% 16%3 81 10 12% 60 74% 2 2% 11 14% 11%4 60 40 67% 15 25% 1 2% 5 8% 7%5 30 12 40% 12 40% 1 3% 6 20% 17%
6+ 60 20 33% 30 50% 1 2% 10 17% 15%418 82 20% 269 64% 6 1% 67 16% 15%
PROJECTION CHAINS11 12
2010-11 STUDENTS
UNDUPLICATED
HEADCOUNT2011-12
GRADUATES2011-12
ATTRITION
2012-13 REMAINING STUDENTS
2012-13 GRADUATES
2011-12 ATTRITION
2013-14 REMAINING STUDENTS
2013-14 GRADUATES
2013-14 ATTRITION
2014-15 REMAINING STUDENTS
YEARS SINCE 1ST ENROLLED
1 110 - 22 2 93 - 15 88 - 14 3 85 10 9 78 10 9 74 9 8 4 70 47 5 65 43 4 60 40 4 57 5 44 18 7 19 7 3 17 7 3 16
6+ 80 27 12 19 6 3 8 3 1 8 6+ 41 14 6 10 3 1 4 6+ 21 7 3 5 6+ 11
Page 19
Questions or comments?
• Materials will be released soon on the Delta Project website:
www.deltacostproject.org
• Feedback and questions welcome:[email protected]