Measuring and Mitigating Web Performance Bottlenecks in Broadband Access Networks Srikanth Sundaresan Georgia Tech [email protected]Nick Feamster Georgia Tech [email protected]Renata Teixeira CNRS & UPMC [email protected]Nazanin Magharei Cisco Systems [email protected]ABSTRACT We measure Web performance bottlenecks in home broadband ac- cess networks and evaluate ways to mitigate these bottlenecks with caching within home networks. We first measure Web performance bottlenecks to nine popular Web sites from more than 5,000 broad- band access networks and demonstrate that when the downstream throughput of the access link exceeds about 16 Mbits/s, latency is the main bottleneck for Web page load time. Next, we use a router- based Web measurement tool, Mirage, to deconstruct Web page load time into its constituent components (DNS lookup, TCP con- nection setup, object download) and show that simple latency opti- mizations can yield significant improvements in overall page load times. We then present a case for placing a cache in the home net- work and deploy three common optimizations: DNS caching, TCP connection caching, and content caching. We show that caching only DNS and TCP connections yields significant improvements in page load time, even when the user’s browser is already performing similar independent optimizations. Finally, we use traces from real homes to demonstrate how prefetching DNS and TCP connections for popular sites in a home-router cache can achieve faster page load times. Categories and Subject Descriptors C.2.3 [Computer-Communication Networks]: Network Opera- tions—Network Management; C.2.3 [Computer-Communication Networks]: Network Operations—Network Monitoring Keywords Broadband Networks; Web performance; Bottlenecks; Popularity- based prefetching; Connection caching; DNS prefetching 1. INTRODUCTION Home broadband Internet access is getting faster: the OECD re- ports that broadband speeds are increasing by about 15–20% ev- ery year. Average advertised broadband speeds are now about 16 Mbits/s in the U.S. and 37.5 Mbits/s across OECD areas [43]. Permission to make digital or hard copies of all or part of this work for personal or classroom use is granted without fee provided that copies are not made or distributed for profit or commercial advantage and that copies bear this notice and the full cita- tion on the first page. Copyrights for components of this work owned by others than ACM must be honored. Abstracting with credit is permitted. To copy otherwise, or re- publish, to post on servers or to redistribute to lists, requires prior specific permission and/or a fee. Request permissions from [email protected]. IMC’13, October 23–25, 2013, Barcelona, Spain. Copyright 2013 ACM 978-1-4503-1953-9/13/10 ...$15.00. http://dx.doi.org/10.1145/2504730.2504741 . As downstream throughput continues to increase, one might expect the Web to get faster at home, as well. Meanwhile, Internet ser- vice providers and application providers are increasingly cognizant of the importance of reducing Web page load times; even seem- ingly small differences in latency can introduce significant effects on usability (and revenue). The Bing search engine experiences re- duced revenue of 1.2% with just a 500-millisecond delay [53], and a 400-millisecond delay resulted in a 0.74% decrease in searches on the Google search engine [14]. Forrester research found that most users expected online shopping sites to load in two seconds or fewer [40]. Content providers struggle to mitigate any network performance bottleneck that can slow down Web page loads in ac- cess networks by even tens of milliseconds. Thus, it is crucial to understand both how network properties of access networks such as latency can introduce bottlenecks in Web page load times and the extent to which various optimizations can help further mitigate these bottlenecks. Towards this goal, in this paper, we use measurements from a router-based Web performance measurement tool, Mirage, to an- alyze Web page load times to nine popular Web sites. This tool has been deployed in over 5,000 home networks as part of the FCC/SamKnows deployment in the US. We also deploy the tool in our own smaller deployment, BISmark. We examine how ac- cess network latency and throughput can introduce performance bottlenecks and evaluate how to mitigate these bottlenecks by de- ploying various caching optimizations on the router in the home network. Next, we demonstrate that caching on a home router can improve page load time, even if the router does not cache any con- tent (i.e., even if it only caches DNS records and TCP connections), and even if the end host or Web browser is already independently performing similar optimizations. Finally, we show how prefetch- ing DNS records and TCP connections from the home router can improve cache hit rates; we use a trace-based emulation to show that prefetching can help achieve these performance improvements in real home networks. We now describe each of these contribu- tions in more detail. First, we measure Web performance from 5,556 broadband ac- cess networks to nine popular Web sites and identify bottlenecks that contribute to Web page load time in these networks (Section 5). Our results suggest that latency is the main bottleneck for Web page load times for access links whose downstream throughput exceeds about 16 Mbits/s. Last-mile latency is an important contributor to the end-to-end latency, and an increase in last-mile latency of just 10 milliseconds can sometimes induce delays of hundreds of milliseconds for page load times of popular sites. In the case of small objects, we find that TCP latency overhead exceeds the actual download time of the object. Our results corroborate and quantify
Transcript
Measuring and Mitigating Web Performance Bottlenecks inBroadband Access Networks
We measure Web performance bottlenecks in home broadband ac-cess networks and evaluate ways to mitigate these bottlenecks withcaching within home networks. We first measure Web performancebottlenecks to nine popular Web sites from more than 5,000 broad-band access networks and demonstrate that when the downstreamthroughput of the access link exceeds about 16 Mbits/s, latency isthe main bottleneck for Web page load time. Next, we use a router-based Web measurement tool, Mirage, to deconstruct Web pageload time into its constituent components (DNS lookup, TCP con-nection setup, object download) and show that simple latency opti-mizations can yield significant improvements in overall page loadtimes. We then present a case for placing a cache in the home net-work and deploy three common optimizations: DNS caching, TCPconnection caching, and content caching. We show that cachingonly DNS and TCP connections yields significant improvements inpage load time, even when the user’s browser is already performingsimilar independent optimizations. Finally, we use traces from realhomes to demonstrate how prefetching DNS and TCP connectionsfor popular sites in a home-router cache can achieve faster pageload times.
Broadband Networks; Web performance; Bottlenecks; Popularity-based prefetching; Connection caching; DNS prefetching
1. INTRODUCTIONHome broadband Internet access is getting faster: the OECD re-
ports that broadband speeds are increasing by about 15–20% ev-ery year. Average advertised broadband speeds are now about16 Mbits/s in the U.S. and 37.5 Mbits/s across OECD areas [43].
Permission to make digital or hard copies of all or part of this work for personal or
classroom use is granted without fee provided that copies are not made or distributed
for profit or commercial advantage and that copies bear this notice and the full cita-
tion on the first page. Copyrights for components of this work owned by others than
ACM must be honored. Abstracting with credit is permitted. To copy otherwise, or re-
publish, to post on servers or to redistribute to lists, requires prior specific permission
As downstream throughput continues to increase, one might expectthe Web to get faster at home, as well. Meanwhile, Internet ser-vice providers and application providers are increasingly cognizantof the importance of reducing Web page load times; even seem-ingly small differences in latency can introduce significant effectson usability (and revenue). The Bing search engine experiences re-duced revenue of 1.2% with just a 500-millisecond delay [53], anda 400-millisecond delay resulted in a 0.74% decrease in searcheson the Google search engine [14]. Forrester research found thatmost users expected online shopping sites to load in two secondsor fewer [40]. Content providers struggle to mitigate any networkperformance bottleneck that can slow down Web page loads in ac-cess networks by even tens of milliseconds. Thus, it is crucial tounderstand both how network properties of access networks suchas latency can introduce bottlenecks in Web page load times andthe extent to which various optimizations can help further mitigatethese bottlenecks.
Towards this goal, in this paper, we use measurements from arouter-based Web performance measurement tool, Mirage, to an-alyze Web page load times to nine popular Web sites. This toolhas been deployed in over 5,000 home networks as part of theFCC/SamKnows deployment in the US. We also deploy the toolin our own smaller deployment, BISmark. We examine how ac-cess network latency and throughput can introduce performancebottlenecks and evaluate how to mitigate these bottlenecks by de-ploying various caching optimizations on the router in the homenetwork. Next, we demonstrate that caching on a home router canimprove page load time, even if the router does not cache any con-tent (i.e., even if it only caches DNS records and TCP connections),and even if the end host or Web browser is already independentlyperforming similar optimizations. Finally, we show how prefetch-ing DNS records and TCP connections from the home router canimprove cache hit rates; we use a trace-based emulation to showthat prefetching can help achieve these performance improvementsin real home networks. We now describe each of these contribu-tions in more detail.
First, we measure Web performance from 5,556 broadband ac-cess networks to nine popular Web sites and identify bottlenecksthat contribute to Web page load time in these networks (Section 5).Our results suggest that latency is the main bottleneck for Web pageload times for access links whose downstream throughput exceedsabout 16 Mbits/s. Last-mile latency is an important contributorto the end-to-end latency, and an increase in last-mile latency ofjust 10 milliseconds can sometimes induce delays of hundreds ofmilliseconds for page load times of popular sites. In the case ofsmall objects, we find that TCP latency overhead exceeds the actualdownload time of the object. Our results corroborate and quantify
anecdotal evidence from users, Internet service providers, and con-tent providers who are increasingly finding that latency is becominga critical performance bottleneck [28, 40].
Second, we use Mirage to deconstruct page load time into itsconstituent components (i.e., DNS lookup, TCP connection setup,content download) and show that even small improvements in la-tency can yield significant improvements in overall page load times(Section 6). To our knowledge, this paper presents the first studyto compare the relative benefits of content caching, DNS caching,and TCP connection caching from within home networks. As partof this analysis, we explore how the page load time that Miragemeasures relates to Web page load time measured by other tools(e.g., Phantomjs, Web browsers). We find that latency is a signif-icant contributor to all factors that affect page load time. Theseresults—in conjunction with previous studies that have observedthat characteristics of the access network can introduce signifi-cant latency [55]—present the case for home caching, the processof caching DNS lookups, TCP connections, and content from thehome router.
Third, we deploy an OpenWrt module that performs variouscaching optimizations in home routers on the BISmark testbed andshow that such a cache can yield improvements in page load time,even if it does not cache content, and even if the browser is already
performing similar optimizations (Section 7). As expected, contentcaching offers the most significant reductions in page load time andcan reduce page load times by up to 53% in some cases. Yet, simplycaching TCP connections and DNS records at the home router canreduce mean page load times by 20% and 7%, respectively, even ifthe ISP and browser are also independently performing their owncaching optimizations.
Finally, to improve cache hit rates in real home networks, weintroduce popularity-based prefetching, which prefetches DNSrecords and TCP connections for Web sites that are commonly ac-cessed from a home network. Using Web traces from twelve homenetworks, we find that prefetching DNS records and TCP connec-tions for only the twenty most popular sites significantly increasesDNS and connection cache hit rates and therefore could offer sig-nificant improvements in page load times.
The Web performance measurements from the SamKnows de-ployment are available on the FCC Web site [52]. We have pub-lished both the Web performance measurements from the BIS-mark experiments [13] and the OpenWrt module that performspopularity-based prefetching [48].
2. BACKGROUND
Factors that affect page load time. Web downloads begin bydownloading the home page of the requested Web page. The homepage object typically contains references to other objects that thebrowser must subsequently retrieve. Each of these objects is ref-erenced with another URL, which the browser retrieves with addi-tional HTTP requests. These objects are either static, in which casethe URL is in the home page itself; or dynamic, in which case theURL is determined by running active scripts (e.g., Javascript) thatdetermine which objects to download. Modern Web sites typicallycontain a mix of static and dynamic objects. Browsers minimizethe download time of the individual objects using many optimiza-tions such as parallel fetches, DNS caching, TCP connection reuse,and optimizations for processing scripts and rendering. Differentbrowsers implement different sets of optimizations.
Because the time for the browser to render a page depends onthe choice of browser and machine configuration, we instead de-fine page load time as the time from the initial request to the time
when all objects for the page have been retrieved. The retrievaltime for each object has the following components: (1) the DNS
lookup time for the domain referenced in the object URL; (2) theTCP connection time, which is the time to complete the TCP three-way handshake to the server; (3) the server response time, whichis the time it takes for the server to start sending the object once ithas been requested; and (4) the object download time, which is thetime to download the object itself over TCP. Some of these factors,such as the DNS lookup and TCP connection times, are bound bylatency; others, such as the object download time, are bound byboth latency and throughput.
Optimizations to improve page load time. A number of optimiza-tions have been proposed and implemented in the quest to minimizepage load time. Server-side optimizations include HTTP replace-ments [50, 54] and TCP modifications [11, 12, 19, 20, 26]. Recentproposals suggest using a larger initial congestion window sizes onservers for TCP connection, so that small objects can be transferredwith significantly fewer round trips [26]. Al-Fares et al. studied theeffects of server-side optimizations, such as increasing TCP’s ini-tial congestion window (ICW) and enabling HTTP pipelining onWeb page load times [7]. They found that increasing the ICW canreduce page load times by several hundred milliseconds in manycases. Although these server-side optimizations can improve pageload times, they do not reduce certain components that contributeto page load time, including DNS lookup and the TCP connectionsetup time.
Many client-side optimizations from the browser have alsobeen developed. HTTP/1.1 introduced persistent connections andpipelining. Persistent connections allow the client to retrieve multi-ple objects over the same TCP connection (thereby amortizing thethree-way handshake and TCP congestion window ramp up costover multiple objects). Pipelining allows the client to initiate arequest for the next object as soon as it sees a reference to thatobject in another object (rather than waiting for the object down-load to complete). Nielsen et al. showed the superior performanceof HTTP/1.1 over HTTP/1.0 [42]. However, most browsers donot enable pipelining by default, and some servers do not enablepersistent connections. Zhou et al. propose a new protocol thatminimizes connection time by having DNS resolvers set up TCPconnection on the client’s behalf [61]. Browsers also downloadmultiple objects in parallel and have highly optimized engines forparsing and rendering objects.
Content caching is also a common optimization. Content Distri-bution Networks (CDNs) are large distributed caches that are typi-cally deployed at the edge of ISPs to reduce the latency between theend-host and the content. Ihm et al. characterized five years of Webtraffic traces from a globally distributed proxy service; they observethat Web caches typically have a 15–25% hit rate, and these ratescould almost double if caches operated on 128-byte blocks [31].Previous studies have reported object cache hit rates in the rangeof 35–50%, although these cache hit rates have continued to dropover time [2, 16, 30, 41, 60]. Some browsers also support contentprefetching [39]; Padmanabhan et al. proposed predictive contentprefetching using server hints [45].
To improve cache hit ratios, Web browsers prefetch DNS recordsanticipating client requests; the browser parses certain downloadedpages (e.g., a search result page) for domains and resolves thembefore the user clicks on them [24]. To reduce the time associatedwith DNS lookups, browsers and intermediate DNS servers employcaching and prefetching [21, 22]. Jung et al. studied DNS perfor-mance and the effectiveness of DNS caching [34], and saw thatDNS cache hit rates can be as high as 80%, even with only a few
clients [33]. Feldmann et al. observed in Web traces from AT&Thome users that 47% of objects retrieved incur more than half ofthe total download time from TCP connection setup [29]. Based onthis observation, the study proposes a connection cache in the ISPnetwork to reduce connection setup time, which reduces downloadtimes by up to 40%.
3. RELATED WORKThere is much previous work on measuring and modeling Web
performance, ranging from protocol modeling to empirical anal-ysis to designing techniques to improve performance. Many ofthese previous studies were performed before the growth of broad-band access networks, content distribution networks, and modernbrowsers. This evolution suggests that it is time for a reappraisalof some past studies in the context of broadband access networks,although it is important to put our study in the context of previouswork. Below, we compare past work in measuring and modelingWeb performance to the study in this paper. This study is a morecomplete version of our own previously published work, whichexplored the contribution of latency to Web page load time [57]and the positive performance benefits of proactive caching andprefetching [56].
Measuring Web performance. Barford et al. analyzed the contri-bution of server, client, and network delays to HTTP 1.0 transac-tion times [10]; the authors used virtual clients on several campusnetworks to request files from a virtual Web server. They foundthat for small files, server load is the dominant factor for perfor-mance, while for large files, the network properties dominate. Kr-ishnamurthy and Wills analyzed the impact of variants of TCP (i.e.,Tahoe, Reno) and HTTP (i.e., persistent, parallel, or pipelined) onWeb performance; they also studied the effects of network latencyand server load on observed performance [36]. These studies wereperformed more than ten years ago. During this time period, theWeb has changed dramatically, in terms of the type of content isserved, how content is hosted, and how browsers operate. Addi-tionally, broadband Internet access has proliferated since the late1990s. It is also much faster than it was when these original studieswere conducted and is now a predominant mode of Internet access.To our knowledge, this study is the first to explore Web page loadtimes from broadband access links, and the first to quantify theextent to which latency becomes a bottleneck on high-throughputaccess links.
More recent work has studied the performance of CDNs [32] andcaching [27]. Akella et al. [3–6] studied the effects of the perfor-mance of 68 CDN sites across 17 cities, focusing on how servermultihoming can improve CDN performance for clients. “Why-High?” identifies cases where a certain set of clients experiencehigher Web page load times [37]. Butkiewicz et al. recently studiedhow the complexity of modern Web sites may contribute to slowerpage load times and found that more than 60% of the Web sitesthey profiled retrieve content from five non-origin sources that con-tribute to more than 35% of the bytes downloaded [15]. Our workcomplements existing literature by exposing how access networksintroduce bottlenecks and assessing how well existing Web perfor-mance optimizations work when they are deployed in homes.
The online service webpagetest.org [59] analyzes the con-tribution of different network components to overall page load timevia a “waterfall”; the analysis is similar to the decomposition thatwe perform in this paper, although the software we develop can rundirectly on home routers, unlike webpagetest.org, which runsfrom data centers. Keynote [35] and Compuware [23] perform end-to-end Web performance measurements from a variety of vantage
Metric Type Description
Page load time Total The time to look up DNS, set up TCPconnections and retrieve all objects.
DNS lookup time Per Domain The DNS lookout time for the maindomain of the site.
Time to first byte Per Object The time from the initiation of theTCP connection to the arrival of thefirst byte of the requested object (in-cluding server processing time).
Object download time Per Object The time to download an object, ex-cluding the DNS lookup time andtime to first byte.
Table 1: Performance metrics. For each per-object metric, Mirage
measures the maximum, minimum, and average times for each ob-
ject in the transaction.
points, but they do not study how individual network factors suchas latency, loss, or throughput ultimately contribute to page loadtime.
Modeling Web performance. Previous work developed modelsfor TCP and HTTP performance based on various network proper-ties such as latency and packet loss [8, 9, 17, 18, 44]. We presentan empirical study of Web performance from thousands of accessnetworks. This empirical approach provides new insights into howaccess network characteristics affect each component of page loadtime. WebProphet [38] and WProf [58] analyze dependencies be-tween Web page objects to predict browser-level response time andstudy bottlenecks in the critical path of page load times. These toolsare valuable in the quest to improve page load times by exposinginefficiencies in Web site design, but they are difficult to deploy atscale.
4. MEASURING PAGE LOAD TIMEThe notion of page load time depends on many factors, including
the underlying network, the design of the Web site, and the endhost,including the browser. Every browser downloads pages using dif-ferent methods (and different optimizations), and the pages them-selves may be optimized for different browsers and devices. In thispaper, we explore how the characteristics of broadband networksaffect Web page load times. Page load time will necessarily varydepending on the above characteristics. Thus, to conduct controlledexperiments of the effects of network characteristics on page loadtime, we use a single tool on a common platform to measure pageload times as various network conditions change. We now explainthe design of the active measurement tool that we use, and how thenumbers it yields compares to that of a browser.
4.1 Mirage: Home Router-Based Web TestingWe use measurements from the FCC/SamKnows deployment of
routers across the US [55]. The deployment uses a custom tool,which we call Mirage, to measure page load time. Mirage is aheadless Web client designed by SamKnows for deployment onhome router devices; the initial deployment of Mirage was spon-sored by the Federal Communications Commission (FCC) on morethan 5,000 homes across the US. We also use it in the BISmarkdeployment.
4.1.1 How Mirage Works
Mirage downloads the home page of a Web site and parses it todetermine the static objects that are needed to render the page. Itthen performs all the DNS lookups at once before downloading therest of the objects. The tool is based on libcurl, which can de-
0 1000 2000 3000 4000 5000Duration (ms)
1
2
3
4.
.
18
19
20
21
22.
.
60
61
62.
.
81
82
83
Obje
ct
DNS
TCP Connect
TTFB
Download Time
(a) Real Browser
0 1000 2000 3000 4000 5000Duration (ms)
1
2
3
4.
.
18
19
20
21
22.
.
60
61
62.
.
81
82
83
Obje
ct
DNS
TCP Connect
TTFB
Download Time
(b) Mirage
Figure 1: Comparison of a real browser (from
webpagetest.org) with Mirage for www.ebay.com;
some objects are omitted. The browser optimizes object retrieval
differently, and also retrieves more objects. Still, the performance
bottlenecks are similar for both.
compose the overall page load time into the download times for in-dividual objects. Mirage separates the page load time into the timeto perform DNS lookups, the time to first byte (which combinesthe TCP connection time and the server processing time), and theactual load time for each object. It uses persistent TCP connectionsif the server supports them and up to eight parallel TCP connec-tions to download objects. Because Mirage uses many of the basicnetwork optimizations that a browser uses including persistent TCPconnections and parallel TCP connections, it approximates the thata real browser might see, even though it does not emulate any par-ticular browser. Table 1 shows the performance metrics for eachdownload and how the performance measurements from Miragecompare to those from webpagetest.org.
Mirage is ideal for our goal of studying the effect of the charac-teristics of broadband access networks on Web performance for anumber of reasons. First, because Mirage can be deployed directlyon home routers, it provides measurements from a single platformthat is directly connected to the access link, thereby normalizingsome of the effects that might otherwise affect page load times(e.g., the use of different browsers, home network effects). Second,Mirage is already in use in the large FCC/SamKnows deployment,which provides longitudinal measurements of the same set of di-verse access links. Because Mirage breaks down each object intoits constituent parts, it exposes important performance bottlenecksin access networks. Finally, Mirage is freely available and portable;we have used Mirage in our own BISmark deployment.
4.1.2 Validation
Comparing Mirage to real browser behavior. Mirage’s behav-ior differs from a browser in several ways. We explain these dif-ferences using the example download in Figure 1. This figureshows the partial breakdown of the page load time for Ebay bothusing a real browser through webpagetest.org and Mirage.First, Mirage waits to download the home page before processingit and downloading subsequent objects; in contrast, many modernbrowsers start downloading objects as they process the home page.This difference is visible in objects 2–4 in Figure 1, where the real
CNN
Wikipedia
Facebook
Yahoo
Google
Amazo
nEbay
MSN
Youtube
0
500
1000
1500
2000
2500
3000
3500
4000
Page load t
ime (
ms)
Mirage
Phantomjs
Figure 2: Comparison of Mirage to Phantomjs. We see that Mirage
underestimates the page load times: real load times are higher than
what we measure.
browser initiates the download before object 1 is complete. Miragealso performs DNS queries for all the unique domains after parsingthe home page before downloading any of the remaining objects;it adds the maximum DNS time to the total time to download theobjects. Although Mirage performs the DNS queries before down-loading any objects, the effect on total page load time is not signifi-cant. The time to retrieve each individual object and the time spenton each component of the object retrieval is nearly identical for thecase of the real browser and Mirage.
Mirage also downloads a slightly different, smaller set of objectsthan a real browser. Modern Web sites, especially content-heavyones, employ active scripts. These scripts result in additional pro-cessing latency and also frequently result in the browser download-ing more objects. Mirage only processes static objects, so it down-loads a subset of the objects that are downloaded by a real browser,usually resulting in a smaller page load time than a normal browserwould see. For example, in Figure 1, the browser downloads 83objects, while Mirage downloads 62 objects.
Validation with Phantomjs. To understand how the differencesbetween Mirage and a real browser affect overall page load time,we compare Mirage’s measurements to those of a real browser en-vironment. For this comparison, we use Phantomjs [46], a head-less client that implements the Webkit browser engine and has aJavaScript API. Phantomjs is used extensively for Web benchmark-ing and testing [47].
Figure 2 shows the median page load time of Mirage and Phan-tomjs for an emulated 10 Mbits/s access link with a last-mile la-tency of 40 ms; the results also hold for lower latency (10 ms) links.Mirage always underestimates the actual page load time because itdownloads fewer objects than a real browser would. Depending onthe amount of dynamic content on the site, the difference may vary:in some cases, Mirage underestimates load times by up to 50%; inothers, its measured page load time is close to the load time thatPhantomjs sees.
The implementation differences between Mirage and realbrowsers imply that the page load times that Mirage sees may notreflect the times that any real browser would see. Yet, page loadtimes will always differ across different browsers, and we do notaim to estimate page load time from any particular browser. Ourgoal is to illustrate how components of network latency (e.g., DNSlookup time, TCP connect time) contribute to Web page load times.Mirage decomposes Web page load time into these components,which will be the same regardless of browser or any optimizationsthat a browser might perform. Mirage also allows us to evaluatehow optimizations that a browser might perform can mitigate vari-
TargetObjects Lookups Connections Size (KB)
Sam- BISmark Sam- BISmark Sam- BISmark Sam- BISmarkKnows US non-US Knows US non-US Knows US non-US Knows US non-US
Table 2: Properties of the Web sites in our data set. The values represent the average of the parameters over all transactions. Objectsdenotes the number of objects that must be downloaded; lookups are the number of DNS lookups required; and connections are the number
of unique TCP connections the client set up to download all objects in the page. The number of connections depends on whether the server
supports persistent connections, whether the objects are located on one or more domains, and the order in which objects are retrieved. Sizedenotes the number of bytes for all of the objects for a site.
US 43 12 24.2Europe 3 24 8.3N. Amer. (non-U.S.) 3 15 5.5E. Asia/Australia 4 3 46.5Southeast Asia 8 12 5.7
Table 4: The BISmark deployment across the world.
ous network bottlenecks under different network conditions. Whenwe evaluate the effects of different optimizations in Section 7, weagain “close the loop” by showing that the benefits as predicted byMirage are realized, even from a browser that is already performingits own optimizations.
4.2 DeploymentWe use data from the FCC/SamKnows deployment, spanning
5,556 homes in the US; and the BISmark deployment, spanning 61homes across the world. For both deployments, we use Mirage tocharacterize nine sites as chosen by SamKnows/FCC. Because it isdifficult to measure a large number of Web sites from home routersand constrained access links, we focus on nine of the most popularsites around the world. Table 2 shows the sites that we measure andtheir properties. All of the measurements from both deploymentsare public. In some cases, the properties of the sites are differ-ent across deployments. Because both deployments use the sametool, these differences may result from either the vantage point orthe time that the measurements were conducted. Because we do
Page load times for users outside the US are significantlyhigher for many sites; these higher times result mostlybecause of higher latencies to these sites.
§5.1, Fig. 3
Page load times stop improving beyond a downstreamthroughput of about 16 Mbits/s. For higher throughputs,latency is the performance bottleneck.
§5.2, Fig. 5a
The time to first byte can exceed the object load time inthe cases of many small objects and for some pages canbe as much as 21% of the page load time. The last-milelatency can be up to 23% of the time to first byte.
§5.3, Fig. 6b
Table 5: Highlights of Section 5 results.
not compare measurements across the two deployments, however,these differences are not consequential.
• We analyze measurements from 5,556 participants in theFCC/SamKnows study across 11 ISPs in the US from October2011, April 2012, and September 2012. We include only userswho have reported more than 100 measurements during the du-ration of the study from ISPs with more than 100 users. Table 3summarizes the deployment; our previous study describes it inmore detail [55]. We report on results from September 2012; theresults that we present are consistent with measurements fromOctober 2011 and April 2012.
• We also analyze measurements from the BISmark deploy-ment [49]. Table 4 characterizes the homes in the BISmark de-ployment by region. BISmark-US collects measurements from44 routers across the US, and BISmark-nonUS collects mea-surements from 18 routers in other parts of the world, in-cluding Europe, North America (excluding the US), and Asia.The BISmark-US data is from May 17–June 7, 2012, and theBISmark-nonUS data is from May 24–June 7, 2012. The URLsare the same for both datasets, and we rely on DNS to locate thelocal version of a site, if one exists.
5. CHARACTERIZING BOTTLENECKSWe study page load times for popular sites and evaluate how
downstream throughput and latency of an access link affects thesetimes. Table 5 summarizes our results.
We find that latency is a performance bottleneck for Web page
load time in access networks whose downstream throughput ex-
CNN
Amazo
nEbay
Facebook
GoogleMSN
Wikipedia
Yahoo
Youtube
0
1000
2000
3000
4000
5000
6000
Page f
etc
h t
ime (
ms)
(a) SamKnows
CNN
Amazo
nEbay
Facebook
GoogleMSN
Wikipedia
Yahoo
Youtube
0
1000
2000
3000
4000
5000
6000
Page load t
ime (
ms)
(b) BISmark-US
CNN
Amazo
nEbay
Facebook
GoogleMSN
Wikipedia
Yahoo
Youtube
0
1000
2000
3000
4000
5000
6000
Page load t
ime (
ms)
(c) BISmark-nonUS
Figure 3: Page load times for popular sites. The lower edge of each box indicates the 25th percentile of the distribution of page load times
for each site, the upper edge is the 75th percentile, the middle line is the median, the cross represents the average, and the dots the 10th and
90th percentile page load times.
ceeds about 16 Mbits/s. Last-mile latency (i.e., the latency betweenthe home network and the first hop in the access ISP) is a significantoverall contributor to both DNS lookup times and the time to firstbyte. Therefore, even when Web caches are deployed at the edge
of access ISPs, optimizations in the home network that reduce the
effects of last-mile latency can still offer significant performance
improvements in page load time.
5.1 Page Load Times of Popular Web SitesWe study the page load times to nine popular Web sites. Fig-
ure 3a shows the load times for access links in the SamKnows de-ployment while Figure 3b shows load times for links in the BIS-mark deployment (both in the US). Figure 3c shows page loadtimes for links in the BISmark deployment outside of the US. Asexpected, page load time varies both by site and the location of theaccess network. Some variability results from differences in pagesize and design (see Table 2); the largest four sites (CNN, Yahoo,Amazon, and Ebay) also have the largest load times (e.g., the me-dian for CNN in the US is more than one second).
Figure 3c shows that access links outside of the US typically ex-perience higher page load times for a given site than links in theUS. The median and variance is higher for all sites we measurefrom outside the US, as well. A few sites have different sizes de-pending on the from which the page is requested, but most perfor-mance differences result from the fact that content is farther awayfrom clients that are outside of the US. Figure 4 illustrates this phe-nomenon; the figure shows that the average time to first byte isin general higher in most regions outside the US. Our measure-ments also indicate that the global deployment of content distri-bution networks is somewhat spotty for certain sites. Sites withmore expansive CDNs (e.g., Google, YouTube) have low medianand maximum page load times, whereas other sites have more vari-able performance, both in the US and abroad. Even Google hasrelatively poor performance from Southeast Asia; we discussed thisphenomenon with network operators at Google, who confirmed thatGoogle’s CDN deployment is not extensive in that region.
5.2 Effects of Downstream ThroughputWe study how page load time and its components vary with
downstream throughput using measurements from the SamKnowsdeployment. We use the 95th percentile of the distribution of down-stream throughput over the duration of the measurements for agiven user to capture the capacity of each access link. We groupaccess links according to downstream throughput into seven binsthat reflect common ranges of Internet access plans in the dataset:
0–1 Mbits/s, 1–2 Mbits/s, 2–4 Mbits/s, 4–8 Mbits/s, 8–16 Mbits/s,16–32 Mbits/s, and 32–64 Mbits/s. Figure 5a shows the medianpage load time for each category for five representative sites.
Median page load time decreases as downstream throughput in-
creases, up to about 16 Mbits/s. As downstream throughput in-
creases further, page load times decrease only modestly. For exam-ple, the median time for CNN is 8.4 seconds for links with through-put 0–1 Mbits/s and 1.3 seconds when throughput is 8–16 Mbits/s.Yet, when downstream throughput exceeds 32 Mbits/s, the pageload time is 790 ms, only slightly better than for links with 8–16 Mbits/s.
We study how each component of page load time varies with ac-cess link throughput. Page load time is heavily influenced by themaximum DNS lookup time and the maximum time to download asingle object (regardless of any caching, parallel lookups, or otheroptimizations), so we can interpret the maximum times for thesevalues as a lower bound on page load time. Large objects also havea correspondingly lower TCP overhead. Figure 5b shows how thesevalues decrease as throughput increases; each point shows the me-dian value for the group of hosts with the corresponding range ofdownstream throughput. As downstream throughput increases to32–64 Mbits/sec, object load time decreases from 3.2 seconds to530 ms. In contrast, the time to first byte decreases as the through-put of the link increases from 0–1 to 1–2 Mbits/s, but does notimprove further for higher values of throughput. DNS lookup timedecreases from about 50 ms to about 15 ms. In summary, as down-stream throughput increases beyond 8–16 Mbits/sec, time to firstbyte and DNS times become a larger component of page load timeand depend more on latency than on throughput—even for largeobjects.
Page load times for clients outside of the US illustrate the effectof latency on page load time. For example, the average page loadtime for Facebook is 1.7 seconds in southeast Asia, 990 ms in eastAsia and Australia, and 924 ms in Europe. Table 4 shows thatclients in east Asia have higher average throughput than Europe,but do not necessarily see a corresponding improvement in pageload times because latency bottlenecks negate the effects of higherthroughput.
5.3 Effects of Last-Mile LatencyOur previous study of access links in the US observed that last-
mile latency contributes significantly to end-to-end latencies [55].To study the effect of last-mile latency on page load times, wegroup access links into 10 ms bins, according to the 10th percentilelast-mile latency. Figure 6a shows the median page load time for
0 1 2 4 8 16 32
Throughput bins (Mbits/s)
102
103
104
Page f
etc
h t
ime (
ms)
CNN
Ebay
Facebook
Google
Yahoo
(a) Page load times
0 1 2 4 8 16 32
Throughput bins (Mbits/s)
101
102
103
104
Late
ncy (
ms)
Max object download time
Max time to first byte
Max lookup time
(b) Components of page load time
Figure 5: Page load times decrease with downstream throughput, but only up to 8–16 Mbits/s. X-axis labels denote the start of each
throughput bin (e.g., “0” is the set of users with downstream throughput up to 1 Mbits/s.) (SamKnows)
0 10 20 30 40 50
Last mile latency bins (ms)
103
104
Page load t
ime (
ms)
CNN
Ebay
Facebook
Google
Yahoo
(a) Page load times
0 10 20 30 40 50
Latency bins (ms)
101
102
103
Late
ncy (
ms)
Min object download time
Min time to first byte
Min lookup time
(b) Components of page load time
Figure 6: Page load times increase with last-mile latency. X-axis labels denote the start of each latency bin. (SamKnows)
Wikipedia
Google
Youtube
MSNYahoo
Facebook
0
200
400
600
800
1000
Tim
e t
o f
irst
byte
(m
s)
US
Europe
NA (exc. US)
E Asia/AU
SE Asia
Figure 4: Average time to first byte to six representative sites from
BISmark clients broken down by location.
each group for five representative sites. In general last-mile latencyhas a multiplicative effect on page load time, which is intuitive be-cause it affects all packets in the transaction. The increase we see isnot monotonic because other factors such as downstream through-put also affect page load time and some groups have more linksthan others: 75% of links have less than 10 ms last-mile latency.Even accounting for differences in throughput, an increase in last-mile latency of only 10 ms can result in a few hundred millisecondsincrease in page load time. Increasing downstream throughput be-
yond 16 Mbits/s yields only marginal improvements, but decreas-ing last-mile latency can have a larger impact on page load time.
To understand the overhead of TCP on small objects, we lookat the minimum object download time and compare it to the min-imum time to first byte and DNS lookup time. Figure 6b showsthe median of each of these values for each group of links. Forsmaller objects, the time to establish the TCP connection to theserver is often greater than the time to actually transfer the object.Although the effect is magnified in smaller objects, we saw that itexists across all objects; in fact, we found that the average time tofirst byte ranges from 6.1% (for Yahoo) to 23% (for Wikipedia) ofthe total page load time. We also observed that last-mile latencycan be as much as 23% of the time to first byte.
5.4 Conclusion: Optimize LatencyThe results in this section suggest that for the increasing number
of homes that have downstream throughput above 16 Mbits/s, themost effective way to reduce Web page load time is to focus onreducing latency as much as possible.
Improving Object Fetch Time. Because most pages have manyobjects, the time to download all of them can dominate other fac-tors when downstream throughput is small. Links with less than16 Mbits/s will thus benefit the most from content caching. Forlinks with higher downstream throughput, however, reducing ob-ject download time is less important than reducing latency. Thus,intuition suggests that faster access links can realize significant im-provements in Web page load time simply by caching DNS records
and TCP connections, without even having to cache any content.Our evaluation in Section 6 confirms this intuition.
Improving DNS Lookup Time. Figure 6b shows that minimumlookup time increases as last-mile latency increases. Minimumlookup times are about 15 ms, and they increase as the last-milelatency increases. The only approach to eliminate the last-mile la-tency is to cache DNS records inside the home itself. Even whenthe resolver is well-placed in the access ISP network, DNS lookuplatencies are bound by last-mile latency (previous work confirmsthis observation [1]).
Improving Time to First Byte. Optimizations in the home net-work cannot improve server processing time, but they can improveTCP connection setup time. The connection setup time dependson the round-trip latency to the server. Web service providers usecontent distribution networks to place servers as close to users aspossible. Figure 4 shows that servers are in general closer to homesin the US, but even users in the US can experience slowdowns inTCP connection setup time due to the last-mile latency. Client-side optimizations such as connection caching [29] can reduce thislatency by maintaining TCP connections to popular sites, therebyreducing overhead for new connections.
6. THE CASE FOR HOME CACHINGWe use Mirage to evaluate the benefits of DNS caching, TCP
connection caching, and content caching in a home network. Al-though the optimizations that we evaluate are well known, theplacement of these optimizations in the home router is new. Ouranalysis in this section offers two important contributions: (1) Itis the first study to quantify the benefits of deploying them in thehome network, where many users now access Web content; (2) Toour knowledge, it is also the first study to quantify both the rela-tive benefits to DNS caching, TCP connection caching, and con-tent caching across a large number of popular sites and the holisticbenefits of performing all three optimizations together.
Table 6 summarizes the main results in this section. Perhapsthe most important takeaway from this section is that optimiza-
tions that reduce latency can significantly reduce page load time,
even if content caching is not used. This result offers good news,since so much Web page content is dynamic, and since cachinga large amount of content on end-hosts or inside home networksmay prove infeasible. This finding also emphasizes the importanceof placing optimizations inside the home network, since even thelast-mile access link can introduce additional latency on the orderof tens of milliseconds [55]. Similar optimizations already existin the browser; we explain how a home cache provides additionalbenefits beyond browser-based optimizations in Section 7.
6.1 Experiment SetupWe develop a controlled experiment to investigate how de-
ploying three different caching optimizations in the home—DNScaching, TCP connection caching, and content caching—contributeto reducing page load time. We use the BISmark deployment de-scribed in Section 4 for our measurements. Mirage runs on the BIS-mark router; it uses a locally running DNS resolver and an HTTPproxy. dnsmasq is a lightweight caching DNS resolver [25]that caches up to 150 domains and honors the TTL values of thelookups. To evaluate TCP connection and content caching, we usepolipo, a HTTP proxy that splits the TCP connection by open-ing a connection to the requested domain on behalf of the clientand communicates with the client over a separate connection and
Performing DNS caching inside the home can improvemaximum lookup times by about 15–50 milliseconds, com-pared to simply relying on the ISP’s DNS resolver.
§6.2, Fig. 7
Connection caching reduces median page load time by100–750 milliseconds depending on the Web site.
§6.2, Fig. 8
Placing a content proxy inside the home versus in a nearbynetwork improves median page load times between 150 and600 milliseconds, depending on the site.
§6.3, Fig. 10
Applying all three optimizations together can reduce Webpage load times by up to 60% at the router.
§6.4, Fig. 11
Table 6: Highlights of Section 6 results.
Measurement Proxy Location DNS Conn. Content
Baseline Measurements
No Proxy, ISP DNS —Cold Home Proxy — •
ISP Proxy Network • • •
Optimizations
Home DNS Home •
Home Conn. Caching Home • •
Home Proxy Home • • •
Table 7: The measurements we perform to evaluate the benefits of
DNS, connection, and content caching in the home.
reuses TCP connections where possible. We run polipo with a4 MByte cache in RAM.
Measuring Baseline Performance. Table 7 illustrates how wemeasure baseline performance and compare it with performancefor each optimization. To measure the three baseline performancemeasurements, the client first performs the following three sets ofrequests:
1. ISP DNS Cache (“No Proxy, ISP DNS”). The client clearsthe local DNS cache and fetches the page directly from theserver. This measures the baseline performance of fetchingthe Web page. The DNS lookups required for this measure-ment may reflect caching in the ISP’s DNS resolver.
2. Empty Caching Proxy in the Home (“Cold Home
Proxy”). The client fetches the same page by direct-ing the request through a fresh polipo instance runningin the router. Because polipo’s cache is empty at thispoint, this measurement reflects the performance of a “cold”proxy. This step takes advantage of any DNS caching thatdnsmasq performs in the previous step.
3. Shared ISP Caching Proxy (“ISP Proxy”). We cannot con-trol a Web cache in a real ISP’s network, so we approximatethe behavior of an ISP cache by deploying a caching proxy inour university network. To measure the benefits of perform-ing DNS, connection, and content caching at a shared proxy(the most common setup for content caches), the client firstfetches the page through a polipo proxy running on a uni-versity server to warm the cache. It then immediately repeatsthe step. We perform the measurements from eleven BIS-mark routers that are less than 35 ms away from the proxy,so that it emulates nearby ISP caches.
Quantifying the Benefits of Caching in Home Networks. Af-ter collecting the baseline measurements, the client then performs
three additional requests to measure the relative benefit of perform-ing different optimizations in the home.
4. Home DNS caching only (“Home DNS”). The clientfetches the same page directly from the servers. Thismeasures the benefits of DNS caching in the home (sincednsmasq caches the DNS responses from earlier measure-ments).
5. Home proxy with DNS caching, persistent connections,
and content caching (“Home Proxy”) The client fetchesthe page through the local polipo again; this measurementtakes advantage of DNS, content and connection caching,since the proxy would have cached any cacheable objects andreused TCP connections where possible from the requests inthe “Cold Home Proxy” experiment.
6. Home proxy with DNS caching and persistent connec-
tions only (“Home Connection Caching”) The client clearsthe polipo cache on the home router — this gets rid of thecontent in the cache, but keeps the TCP connections from the
previous step alive. It then fetches the page through the proxyagain. All content is retrieved again from the origin service,but the TCP connections from the previous step are reused.
These experiments allow us to isolate the effects of (1) the rela-tive benefits of performing DNS, connection, and content cachinginside the home network and (2) placing a cache inside the homeversus elsewhere (e.g., in the ISP).
6.2 Effects of Home Caching on Latency
Benefits of DNS caching in the home vs. in the ISP. To quantifythe benefits of DNS caching in the home, we compare the max-imum lookup time for the Home DNS Cache and No Proxy, ISP
DNS cases. Figure 7 shows the CDF of the improvement in themaximum lookup time for the page load. In the median case, DNScaching in the home reduces the maximum lookup time by 15–50 ms, depending on the site. Certain clients outside the US can re-duce their lookup time by several hundred milliseconds for certainsites like Ebay and CNN by caching DNS responses in the home.For a small fraction of cases, DNS caching in the home actuallyslightly impairs performance; in these cases, the detriment in smalland may result from changes in network conditions between exper-iments (this effect occurs for some of our TCP connection cachingand content caching experiments, too).
Benefits of TCP connection caching in the home. Figure 8 showsthe additional improvement in page load time due to connectioncaching by measuring the difference between the load times forthe Home Connection Caching and the Home DNS Cache mea-surements. The median improvement varies from 100–750 ms de-pending on the site. Ebay and Yahoo experience the most improve-ment in load times because both sites require many objects frommany domains to render; connection caching can significantly re-duce TCP overhead in such cases.
6.3 Effects of Home Caching on Throughput
Benefits of content caching vs. connection caching. Figure 9shows the improvement in page load time due to content cachingover connection caching. We compute the improvement by sub-tracting the page load time for the Home Proxy experiment fromthat for the Home Connection Caching experiment. Caching con-tent inside the home can decrease median page load times in the USby 75–400 ms over connection caching, depending on the site. Ob-viously, sites with more cacheable content will benefit more. Our
−100 −50 0 50 100 150 200 250 300
Difference in maximum lookup time (ms)
0.0
0.2
0.4
0.6
0.8
1.0
CD
F
CNN
Amazon
Ebay
Facebook
Google
MSN
Wikipedia
Yahoo
Youtube
Figure 7: Caching DNS in the home can reduce the maximum DNS
lookup time by 15–50 ms. (Home DNS Measurement vs. No Proxy,ISP DNS Measurement)
0 500 1000 1500 2000
Difference in page load time (ms)
0.0
0.2
0.4
0.6
0.8
1.0
CD
F
CNN
Amazon
Ebay
Facebook
Google
MSN
Wikipedia
Yahoo
Youtube
Figure 8: Connection caching in the home can reduce median page
load times by 100–750 ms.(Home Connection Proxy vs. HomeDNS Measurements)
analysis shows that this benefit is even more significant for clientsoutside the US; at least 20% of clients experienced an improvementof 500 ms or more for all sites.
Benefits of content caching in the home vs. in the ISP. We com-pare the Web page load time when using a remote HTTP proxy(the ISP Proxy measurement from Table 7) versus using a localHTTP proxy running on the router (the Home Proxy measurement).Figure 10 shows that a proxy in the home can offer a median im-provement in page load time of 150–600 ms, depending on the site.Yahoo and CNN experience the most benefits, likely because thesepages are larger and have many objects (Table 2). A cache in theupstream ISP is still constrained by the access link’s throughput andlast-mile latency, while a local cache is not. For some sites, the re-mote proxy performs better than the home proxy about 20% of thetime, perhaps because of varying access link characteristics acrosstests (due to cross traffic) or because the proxy is in a universitynetwork that potentially has better connectivity to these sites.
6.4 Putting It TogetherWe now quantify the collective benefit from performing all three
optimizations. We use Mirage’s No Proxy, ISP DNS measurement
0 200 400 600 800 1000
Difference in page load time (ms)
0.0
0.2
0.4
0.6
0.8
1.0
CD
FCNN
Amazon
Ebay
Facebook
Google
MSN
Wikipedia
Yahoo
Youtube
Figure 9: Content caching reduces the median page load time by
75–400 ms over connection caching alone. For sites with more
cacheable content, the benefit is greater (Home Proxy vs. HomeConnection Caching Measurements)
−500 0 500 1000 1500 2000
Difference in page load time (ms)
0.0
0.2
0.4
0.6
0.8
1.0
CD
F
CNN
Amazon
Ebay
Facebook
Google
MSN
Wikipedia
Yahoo
Youtube
Figure 10: Running a proxy in the home improves median page
load times by 150–600 ms versus running a proxy in the ISP. (HomeProxy vs. ISP Proxy Measurement)
as the baseline. We compute the relative improvement as (b−v)/b,where b is the baseline load time and v is the optimized load time.
Figure 11a shows the relative improvement of each optimizationrelative to the baseline of performing no optimizations in BISmark-US. Applying all three optimizations improves page load time by asmuch as 60%. Even without content caching, connection caching
can yield up to a 35% improvement in load time, and DNS caching
alone can improve page load time by as much as 10%. Figure 11bshows the relative improvement for clients outside the US. The im-provement is slightly less than for the users within the US becausethe absolute page load times for users outside the US are alreadyhigher (Figure 3). The variance is also higher because of the widerange of operating conditions outside the US (Table 4 and Figure 4).The improvements we measure represent the best-case scenario be-cause the quick succession of Web page retrievals will always in-duce a cache hit at the router. In the next section, we explore howto design a cache in the home that achieves high cache hit rates inpractice.
CNN
Amazo
nEbay
Facebook
GoogleMSN
Wikipedia
Yahoo
Youtube
0.0
0.2
0.4
0.6
0.8
1.0
Rela
tive im
pro
vem
ent
Home DNS Cache
Home Conn. Caching
Home Proxy
(a) BISmark-US
CNN
Amazo
nEbay
Facebook
GoogleMSN
Wikipedia
Yahoo
Youtube
0.0
0.2
0.4
0.6
0.8
1.0
Rela
tive im
pro
vem
ent
Home DNS Cache
Home Conn. Caching
Home Proxy
(b) BISmark-nonUS
Figure 11: Average relative improvement in page load times for
various optimizations, as observed from the router. Error bars
denote standard deviation.
7. HOME CACHING IN PRACTICEThe previous section demonstrated how home caching can im-
prove page load times in the best-case scenario, but the resultsmeasured the benefits in isolation from other optimizations (e.g.,browser caching) and also assumed that these cache hits could berealized in practice. Thus, our experiments from Section 6 raisetwo questions:
1. How can users inside a home network practically realize
cache hits on a home cache? Prefetching DNS queries andmaintaining open TCP connections to all sites visited by auser is not practical. To intelligently determine which DNSrecords and TCP connections to cache, we implemented alightweight router-based popularity-based prefetching sys-tem that prefetches and caches DNS records and maintainsactive TCP connections to popular domains to help im-prove cache hit rates. We analyzed cache hit ratios resultingfrom this system with a trace-driven simulation using passivetraces collected from twelve homes. (Section 7.1)
2. Are the performance benefits that home caching offers signif-
icant, in light of the fact that browsers already perform some
amount of caching and prefetching? To answer this question,we retrieve Web pages from a laptop in a home network us-ing Phantomjs under a variety of emulated access link char-acteristics with various caching optimizations enabled on thehome router. (Section 7.2)
Our results indicate that popularity-based prefetching can comple-ment existing browser optimizations.
7.1 Popularity-based PrefetchingWe design, implement, and evaluate a popularity-based caching
and prefetching systemthat prefetches DNS records and keeps TCPconnections to Web servers active based on the sites that users inthe household visit most frequently. We develop a proof-of-conceptOpenWrt module, which is publicly available [48]. The systemconsists of (dnsmasq) and (polipo), instrumented to track pop-ular DNS lookups and HTTP domains respectively. The systemtracks popularity and refreshes DNS lookups and maintains an ac-tive TCP connection to popular domains by using a simple cachingmechanism. The system aims to maximize the hit rate of the DNSand TCP connection caches. The two parameters that affect the hitrate are (1) the number of domains to be tracked: the system ac-tively prefetches DNS records and maintains active connections tothese domains; the system maintains the two lists separately; and(2) timeout thresholds: the system tracks the time since a lookupor a TCP connection was requested to a domain and removes thedomain from the popular list if this time exceeds a threshold. Thesystem does not prefetch content but exploits any content cachingthat polipo performs by default.
Does popularity-based prefetching improve Web page load
times in homes? To analyze whether popularity-based prefetch-ing can improve performance, we perform a trace-based simulationusing real browsing activity in home networks, with optimizationsenabled and disabled. We capture Web browsing activity of usersfrom routers deployed in twelve homes in the US for the periodOctober 15–31, 2012 to evaluate the potential improvements fromproactive DNS and connection caching in home networks. We cap-ture DNS and HTTP traffic. We record the timestamp, hashed do-main, and TTL of all resolved DNS responses. Each HTTP flowevent has a timestamp of all connections, hashes of their corre-sponding IP addresses, flow duration, and TCP connection time.To preserve user privacy, we do not capture packet payloads, so wedo not evaluate cache hit ratios for content.
Using these traces, we run a trace-driven simulation that main-tains the DNS cache using the timestamp, hashed domain, and TTLof resolved DNS responses from the trace. When prefetching adomain, the simulation delays each incoming DNS response by arandom interval between 50 and 200 ms; the TTL value is set ac-cording to the value in the trace. Requests for domains waitingfor a DNS response are considered cache misses. To characterizethe benefit of TCP connection caching, the simulation maintainsthe TCP connection cache based on the timestamp, five-tuple flowidentifier, and duration of both the entire TCP connection and itsconnection establishment of all port 80 requests from the passivetraces. For each new request, the simulation compares it with theentries in the connection cache. In the event of a cache miss, orwhen a connection to an IP address is in use by another request, weestablish a new connection with the flow and TCP connection es-tablishment durations that correspond to the TCP connection in thetrace. Upon a cache hit, the simulation denotes the cache entry tobe in use for the duration of TCP connection minus the connectionestablishment time to that IP.
Baseline DNS cache hit rates without popularity-based prefetch-ing vary from 11–50%, depending on the home; the baseline cachehit ratio for TCP connection ranges from 1–8% across homes. Set-ting a cache size of 20 and a timeout threshold of 120 seconds forboth DNS and connection prefetching causes DNS hit ratios im-prove to 19–93%, representing at least a 40% improvement overthe baseline in every home. Connection cache hit ratios increaseto 6–21% across homes. These results show that popularity-based
CNN
Amazo
nEbay
Facebook
MSN
Wikipedia
Yahoo
Youtube
0.0
0.2
0.4
0.6
0.8
1.0
Rela
tive im
pro
vem
ent
Home DNS Cache
Home Conn. caching
Home Proxy
Figure 12: Average relative improvement in page load times for
various optimizations, as observed from the browser. Error bars
denote standard deviation.
prefetching for only a few sites and with a short timeout can signif-icantly improve performance.
7.2 Benefits of Home Caching from BrowsersWe evaluate the benefit of home caching as seen from a browser
by analyzing the improvement in page load times from Phantomjswith various caching optimizations enabled. We measure page loadtimes from a Web browser using Phantomjs running on a Linux lap-top that is connected through a wired link to a Netgear home router;the router shapes the uplink to represent different home networkthroughputs and latencies. We use two settings for the downstreamthroughput of the access link (10 Mbits/s and 20 Mbits/s) and threesettings for the latency of the access link (0 ms, 20 ms, and 40 ms).We download each of the sites 25 times for each setting. Theseparameters approximate common access-link throughputs and last-mile latencies. The router also runs popularity-based prefetching,discussed in Section 7.1.
Home caching complements browser optimizations. Figure 12shows the relative improvement in Web page load times as a resultof deploying various caching optimizations from a home router,as observed from the laptop running Phantomjs. Because we hadproblems with Phantomjs using polipo for Google, we omit re-sults for it. DNS caching improves page load times by as muchas 7%; connection and DNS caching improve load times by about20%; all three optimizations together reduce load times by as muchas 60%, depending on the site. The benefits as measured usingPhantomjs are lower, but they are comparable to what we observeat the router in Figure 11. Although the improvements in page loadtime that a browser realizes obviously depends on many factors,our results demonstrate that home caching complements existing
optimizations that browsers already perform.To further illustrate these benefits, we show the page load time
for Ebay, for a single experiment. Figure 13 shows how DNS andTCP connection caching improves per-object downloads. It showsthe time to download the first ten objects of the site using Phan-tomjs. We measure the total time for the first ten objects. Theleft plot shows the baseline case without optimization, and the sec-ond plot shows the benefits that the browser observes when thehome router performs DNS and connection caching. We observean 6.4% reduction in page load time for the home page alone whenthe home router performs both DNS and TCP caching. The im-provements are relatively more significant for smaller objects. Thenumbers next to the objects show the percentage improvement inthe baseline. All objects show some improvement; objects that arecacheable see more improvement.
0 500 1000Base Fetch time(ms)
10
9
8
7
6
5
4
3
2
1
Obje
ct
0 500 1000Fetch time with DNS and TCP caching (ms)
6.4
52.4
47.7
88.1
84.2
42.1
30.0
86.2
82.0
78.2
Figure 13: The time to load the first ten objects for Ebay using
Phantomjs. We plot the total download time for the first ten objects.
The first plot shows the breakdown for the base case; the second
when there is DNS and TCP connection caching. The numbers in
the second plot denote the percentage improvement over the base
case.
8. CONCLUSIONWe presented the first large-scale study of Web performance bot-
tlenecks in broadband access networks. We first characterize per-formance to nine popular Web sites from 5,556 access networksusing Mirage, a router-based Web measurement tool, and identifyfactors that create Web performance bottlenecks. Regardless of theoptimizations that clients, servers, and browsers may perform, theaccess link is a fundamental limit to the efficacy of optimizations.As throughput increases, latency becomes more important, to theextent that even having caches on the edge of ISPs could prove tobe insufficient. We show that Web page load times stop improvingas throughput rates increase beyond 16 Mbits/s. We also show thatlast-mile latency contributes to the time required for performingDNS lookups, completing TCP connection setup, and download-ing Web objects and can be up to 23% of the time to first byte.
Moreover, we evaluate techniques to mitigate latency bottle-necks by implementing home caching, which performs DNS andTCP connection caching and prefetching inside the home network.We demonstrate that home caching can improve Web performance,even if the ISP and browser are already independently performingsimilar optimizations. TCP connection caching alone can improveWeb page load times by up to 20%, depending on the site. Per-forming all three optimizations together from the home router canreduce page load times by up to 53%.
Although the optimizations we describe can be implementedanywhere in the home network, we believe that the home routeris a reasonable location for caching and prefetching DNS recordsand TCP connections. In addition to further reducing page loadtimes, even in the presence of similar optimizations that browsersalready implement, it is worth noting that there are many Web-based applications that do not run from a standard browser. Anydevice in the home network that retrieves Web content can benefit
from home caching. Indeed, as Singhal and Paoli state, “apps—notjust browsers—should get faster too” [51]. Our publicly availableOpenWrt module for popularity-based prefetching may serve as yetanother important component for reducing page load times in homenetworks.
Acknowledgments
This research was funded in part by NSF award CNS-1059350, aGoogle Focused Research Award, and the European Community’sSeventh Framework Programme (FP7/2007-2013) no. 258378 (FI-GARO). We would like to thank the Federal CommunicationsCommission and SamKnows for access to the data. We would alsolike to acknowledge BISmark volunteers worldwide for supportingthe platform.
REFERENCES[1] B. Ager, W. Mühlbauer, G. Smaragdakis, and S. Uhlig. Comparing
dns resolvers in the wild. In Proceedings of the 10th annual
conference on Internet measurement, IMC ’10, pages 15–21, NewYork, NY, USA, 2010. ACM.
[2] B. Ager, F. Schneider, J. Kim, and A. Feldmann. Revisitingcacheability in times of user generated content. In INFOCOM IEEE
Conference on Computer Communications Workshops, 2010, pages1–6. IEEE, 2010.
[3] A. Akella, B. Maggs, S. Seshan, and A. Shaikh. On the performancebenefits of multihoming route control. IEEE/ACM Transactions onNetworking, 16(1), Feb. 2008.
[4] A. Akella, B. Maggs, S. Seshan, A. Shaikh, and R. Sitaraman. Ameasurement-based analysis of multihoming. In Proc. ACM
SIGCOMM, Karlsruhe, Germany, Aug. 2003.
[5] A. Akella, J. Pang, B. Maggs, S. Seshan, and A. Shaikh. Acomparison of overlay routing and multihoming route control. InProc. ACM SIGCOMM, Portland, OR, Aug. 2004.
[6] A. Akella, S. Seshan, and A. Shaikh. Multihoming performancebenefits: An experimental evaluation of practical enterprisestrategies. In Proc. USENIX Annual Technical Conference, Boston,MA, June 2004.
[7] M. Al-Fares, K. Elmeleegy, B. Reed, and I. Gashinsky. Overclockingthe Yahoo! CDN for faster Web page loads. In Proceedings of
Internet Measurement Conference, 2011.
[8] E. Altman, K. Avrachenkov, and C. Barakat. A stochastic model oftcp/ip with stationary random losses. In ACM SIGCOMM, 2000.
[9] M. Arlitt, B. Krishnamurthy, and J. Mogul. Predicting Short-transferLatency from TCP arcana: a Trace-based Validation. In Proc. ACM
SIGCOMM Internet Measurement Conference, New Orleans, LA,Oct. 2005.
[10] P. Barford and M. Crovella. Critical path analysis of tcp transactions.In IEEE/ACM Transactions on Networking, 2000.
[11] M. Belshe. A Client-Side Argument for Changing TCP Slow Start.http://goo.gl/UDKXz.
[12] M. Belshe. More Bandwidth Doesn’t Matter (much).http://goo.gl/OIv47.
[13] BISmark Web Performance data.http://data.gtnoise.net/bismark/imc2013/
webperf/bismark_webperf_data.tgz.
[14] J. Brutlag. Speed matters for Google Web search.http://services.google.com/fh/files/blogs/
google_delayexp.pdf, June 2009.
[15] M. Butkiewicz, H. Madhyastha, and V. Sekar. Understanding websitecomplexity: Measurements, metrics, and implications. In Proc.Internet Measurement Conference, Berlin, Germany, Nov. 2010.
[16] R. Caceres, F. Douglis, A. Feldmann, G. Glass, and M. Rabinovich.Web proxy caching: The devil is in the details. June 1998.
[17] J. Cao, W. S. Cleveland, Y. Gao, K. Jeffay, F. D. Smith, andM. Weigle. Stochastic models for generating synthetic http sourcetraffic. In IN PROCEEDINGS OF IEEE INFOCOM, 2004.
[18] N. Cardwell, S. Savage, and T. Anderson. Modeling tcp latency. InProc. IEEE INFOCOM, Tel-Aviv, Israel, Mar. 2000.
[19] Y. Cheng and Others. TCP Fast Open. IETF, Sept. 2011.http://www.ietf.org/id/
draft-cheng-tcpm-fastopen-00.txt.
[20] J. Chu and Others. Increasing TCP’s Initial Window. IETF, Oct.2011. http://tools.ietf.org/html/draft-ietf-tcpm-initcwnd-01.
[21] E. Cohen and H. Kaplan. Prefetching the means for documenttransfer: A new approach for reducing Web latency. In Proc. IEEEINFOCOM, volume 2, pages 854–863, Tel-Aviv, Israel, Mar. 2000.
[22] E. Cohen and H. Kaplan. Proactive caching of DNS records:Addressing a performance bottleneck. In Symposium on Applications
[26] N. Dukkipati, T. Refice, Y. Cheng, J. Chu, T. Herbert, A. Agarwal,A. Jain, and N. Sutin. An argument for increasing tcp’s initialcongestion window. SIGCOMM Comput. Commun. Rev., 40:26–33,June 2010.
[27] J. Erman, A. Gerber, M. Hajiaghayi, D. Pei, and O. Spatscheck.Network-aware forward caching. In Proceedings of the 18th
international conference on World wide web, 2009.
[28] FCC Measuring Broadband America Report. http://www.fcc.gov/measuring-broadband-america/2012/july, July2012.
[29] A. Feldmann, R. Caceres, F. Douglis, G. Glass, and M. Rabinovich.Performance of web proxy caching in heterogeneous bandwidthenvironments. In Proc. IEEE INFOCOM, New York, NY, Mar. 1999.
[30] S. Gribble and E. Brewer. System Design Issues for InternetMiddleware Services: Deductions from a Large Client Trace. InProc. 1st USENIX Symposium on Internet Technologies and Systems
(USITS), Monterey, CA, Dec. 1997.
[31] S. Ihm and V. Pai. Towards understanding modern web traffic. InProc. Internet Measurement Conference, Berlin, Germany, Nov.2010.
[32] A. jan Su, D. R. Choffnes, A. Kuzmanovic, and F. E. Bustamante.Drafting behind akamai (travelocity-based detouring. In Proc. ACM
SIGCOMM, Pisa, Italy, Aug. 2006.
[33] J. Jung, A. W. Berger, and H. Balakrishnan. Modeling TTL-basedInternet Caches. In IEEE Infocom 2003, San Francisco, CA, April2003.
[34] J. Jung, E. Sit, H. Balakrishnan, and R. Morris. DNS Performanceand the Effectiveness of Caching. In Proc. ACM SIGCOMM Internet
Measurement Workshop, San Fransisco, CA, Nov. 2001.
[36] B. Krishnamurthy and C. Wills. Analyzing factors that influenceend-to-end Web performance. In Proc. Twelfth International World
Wide Web Conference, Amsterdam, The Netherlands, May 2000.
[37] R. Krishnan, H. V. Madhyastha, S. Jain, S. Srinivasan,A. Krishnamurthy, T. Anderson, and J. Gao. Moving beyondend-to-end path information to optimize CDN performance. In Proc.Internet Measurement Conference, 2009.
[38] Z. Li, M. Zhang, Z. Zhu, Y. Chen, A. Greenberg, and Y.-M. Wang.Webprophet: Automating performance prediction for web services.In Proc. 7th USENIX NSDI, San Jose, CA, Apr. 2010.
[39] Link Prefetching FAQ. https://developer.mozilla.org/En/Link_prefetching_FAQ.
[40] S. Lohr. For Impatient Web Users, an Eye Blink Is Just Too Long toWait.http://www.nytimes.com/2012/03/01/technology/
impatient-web-users-flee-slow-loading-sites.
html, Mar. 2012.[41] J. C. Mogul, Y. M. Chan, and T. Kelly. Design, implementation, and
evaluation of duplicate transfer detection in HTTP. In Proc. First
Symposium on Networked Systems Design and Implementation
(NSDI), San Francisco, CA, Mar. 2004.
[42] H. Nielsen, J. Gettys, A. Baird-Smith, E. Prud’hommeaux, H. W.Lie, and C. Lilley. Network performance effects of http/1.1, css1, andpng. In Proc. ACM SIGCOMM, Cannes, France, Sept. 1997.
[44] J. Padhye, V. Firoiu, D. Towsley, and J. Kurose. Modeling TCPThroughput: A Simple Model and its Empirical Validation. In Proc.ACM SIGCOMM, pages 303–323, Vancouver, British Columbia,Canada, Sept. 1998.
[45] V. Padmanabhan and J. Mogul. Using predictive prefetching toimprove world wide web latency. ACM SIGCOMM Computer
[48] OpenWRT Module for Popularity-based Prefetching.http://data.gtnoise.net/bismark/imc2013/
webperf/popularity_prefetch.tgz.
[49] Project bismark. http://projectbismark.net.
[50] QUIC: Quick udp internet connections.http://goo.gl/O2r6rM.
[51] S. Singhal and J. Paoli. Speed and Mobility: An Approach for HTTP2.0 to Make Mobile Apps and the Web Faster, Mar. 2012.http://goo.gl/1uWCl.
[52] April 2012 FCC/SamKnows data. http://www.fcc.gov/measuring-broadband-america/
2012/validated-data-april-2012.
[53] S. Souders. Velocity and the bottom line.http://radar.oreilly.com/2009/07/
velocity-making-your-site-fast.html, July 2009.
[54] SPDY: An experimental protocol for a faster web.http://www.chromium.org/spdy/spdy-whitepaper.
[55] S. Sundaresan, W. de Donato, N. Feamster, R. Teixeira, S. Crawford,and A. Pescapè. Broadband internet performance: A view from thegateway. In Proc. ACM SIGCOMM, Toronto, Ontario, Aug. 2011.
[56] S. Sundaresan, N. Magharei, N. Feamster, and R. Teixeira.Accelerating last-mile web performance with popularity-basedprefetching. In Proceedings of ACM SIGCOMM 2012 (Poster),SIGCOMM ’12. ACM, 2012.
[57] S. Sundaresan, N. Magharei, N. Feamster, R. Teixeira, andS. Crawford. Web performance bottlenecks in broadband accessnetworks. In Proceedings of ACM SIGMETRICS 2013 (Poster
Paper), SIGMETRICS ’13. ACM, 2013.
[58] X. S. Wang, A. Balasubramanian, A. Krishnamurthy, andD. Wetherall. Demystifying page load performance with wprof. Apr.2013.
[59] Web page test. http://webpagetest.org/.
[60] A. Wolman, G. M. Voelker, N. Sharma, N. Cardwell, A. Karlin, andH. M. Levy. On the scale and performance of cooperative web proxycaching. In Proc. 17th ACM Symposium on Operating SystemsPrinciples (SOSP), Kiawah Island, SC, Dec. 1999.
[61] W. Zhou, Q. Li, M. Caesar, and P. Godfrey. Asap: A low-latencytransport layer. In Proceedings of the Seventh COnference on
emerging Networking EXperiments and Technologies, page 20.ACM, 2011.
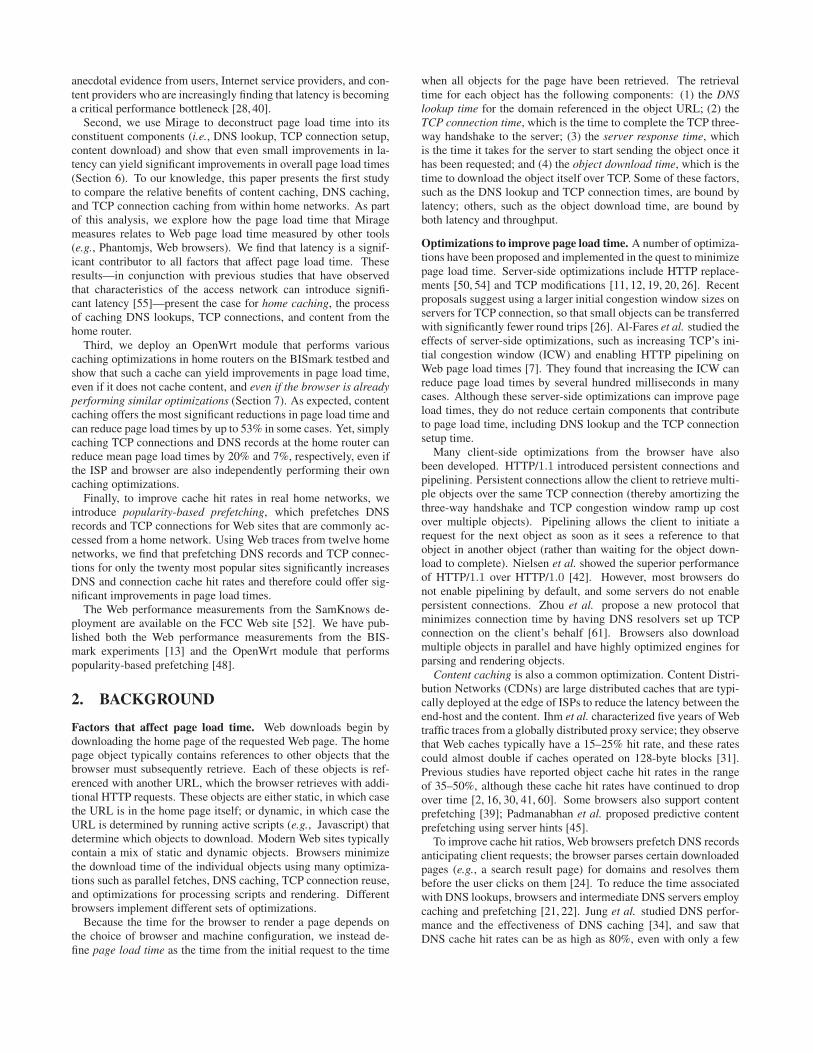


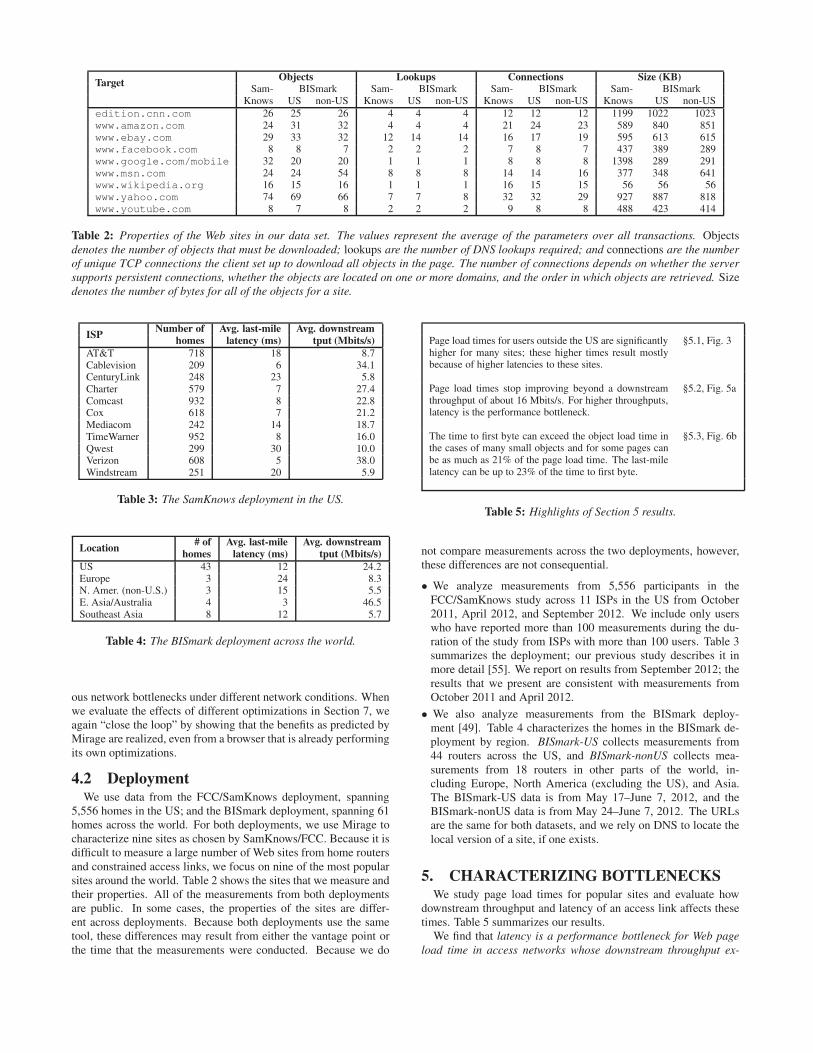
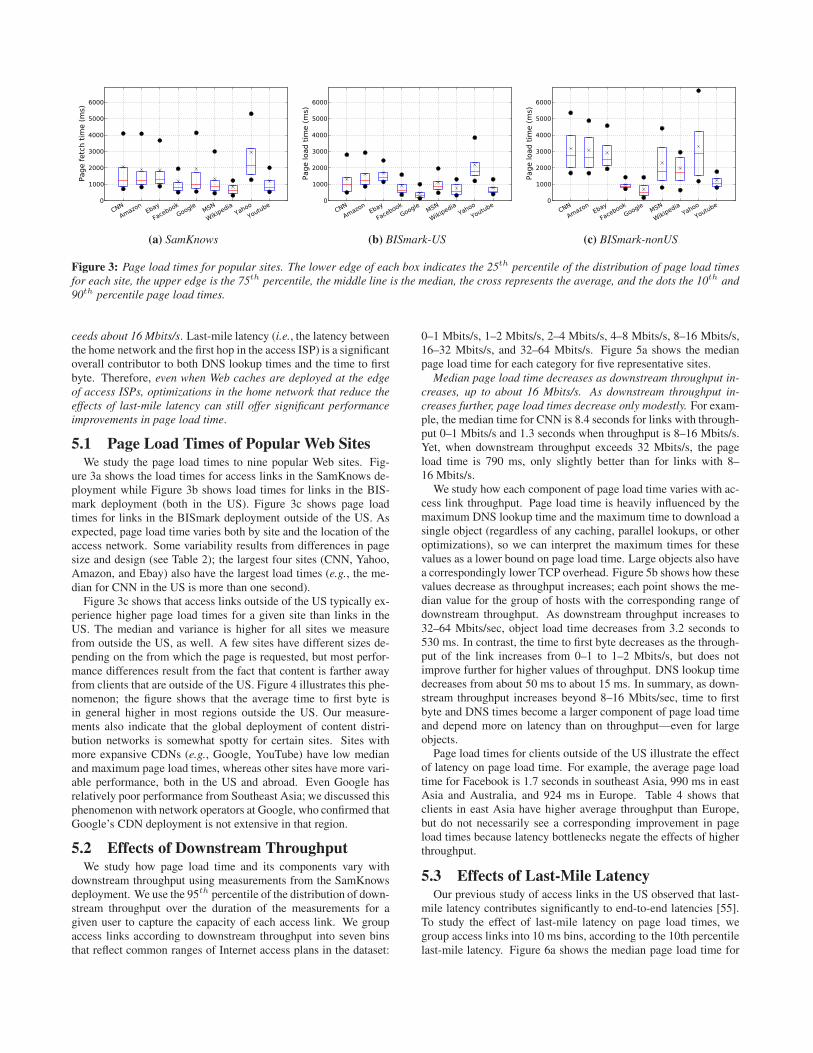
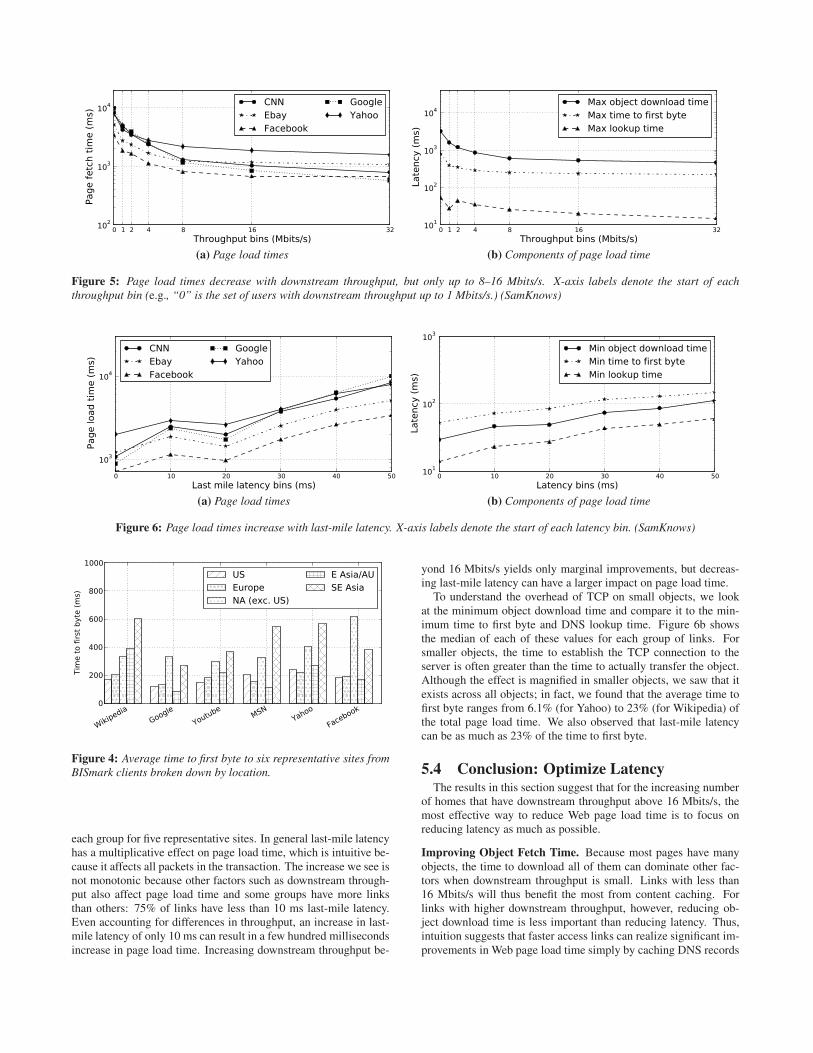
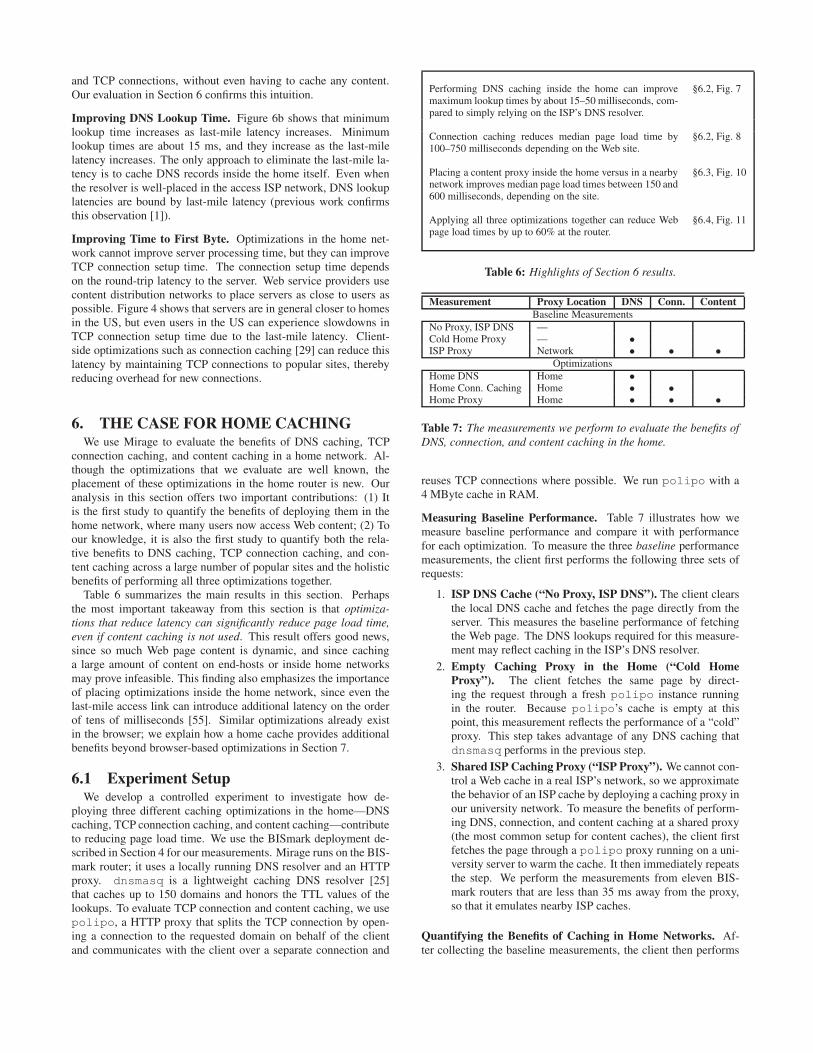
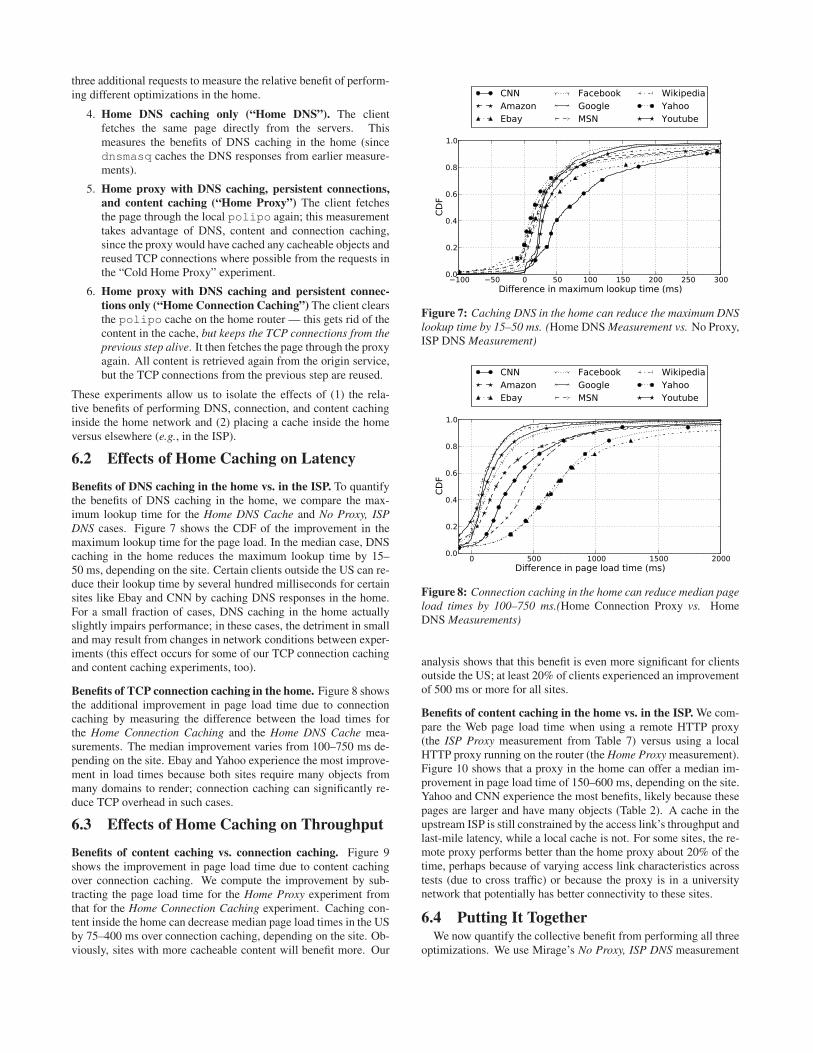
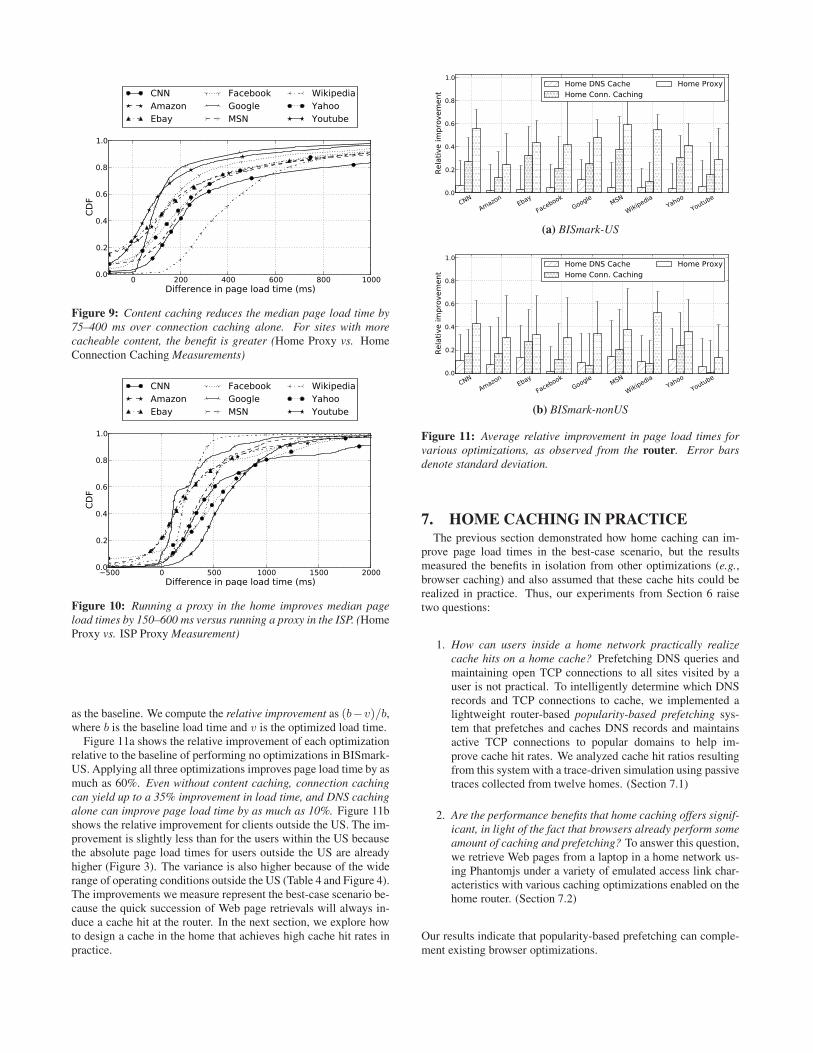
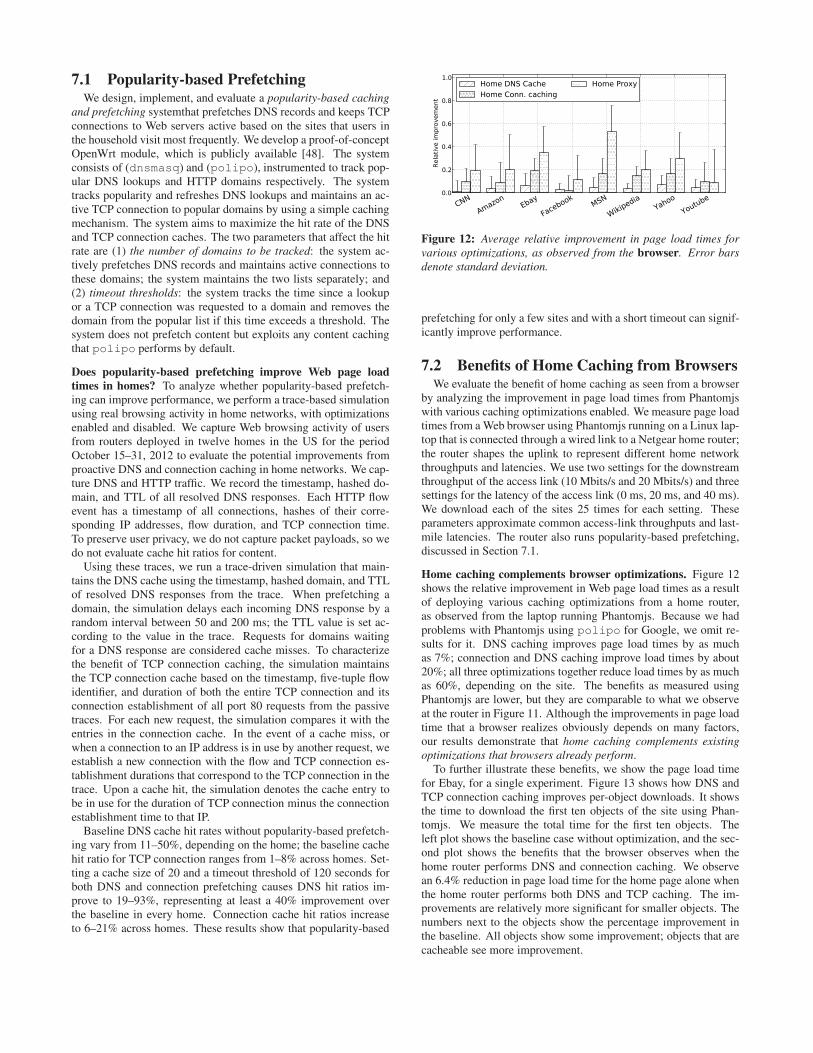
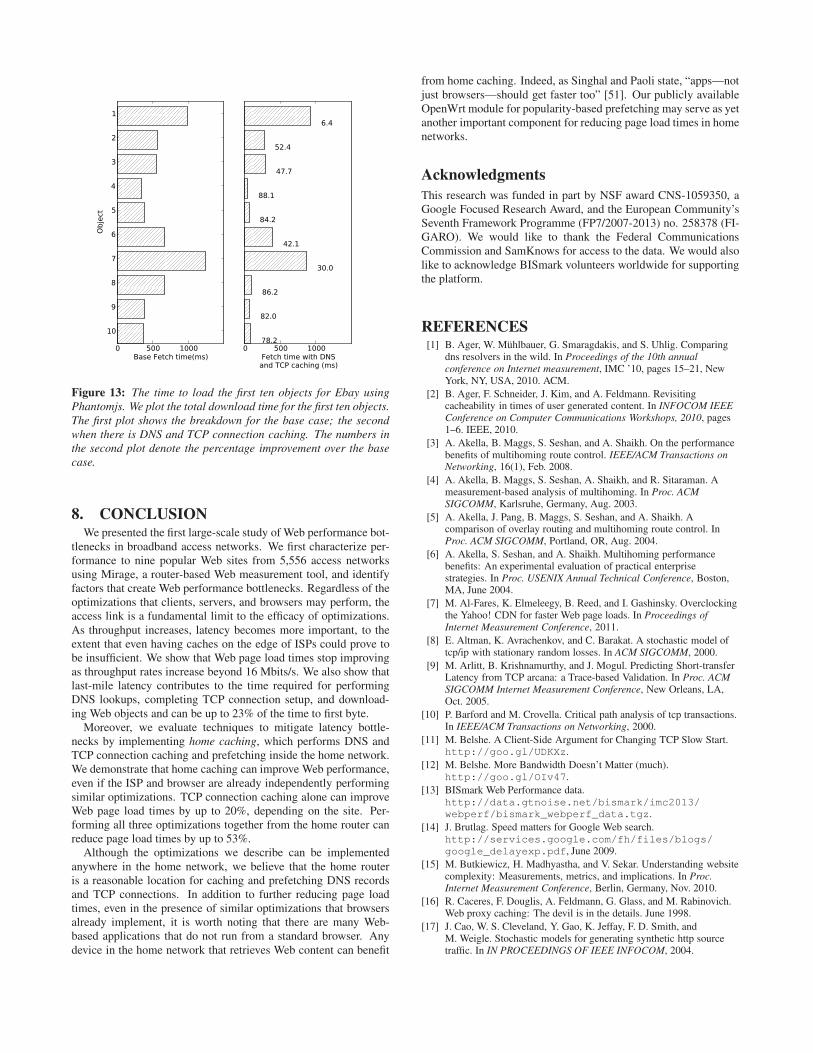
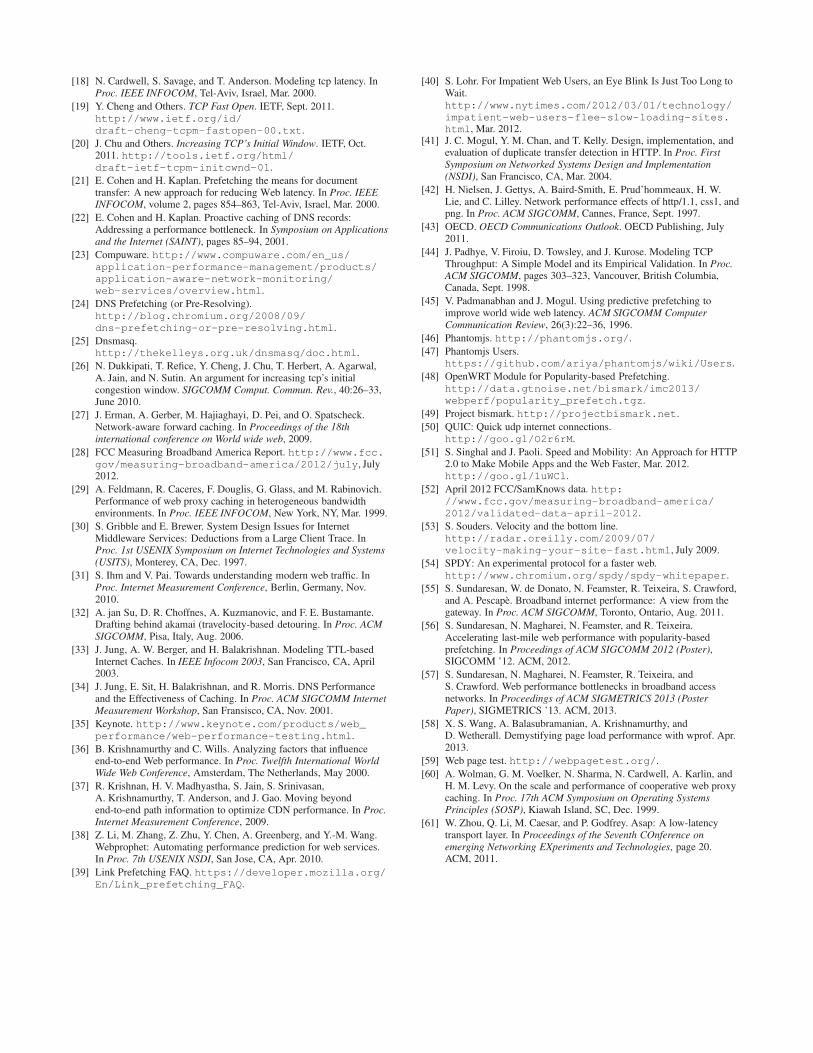


![EstimatingandSamplingGraphswith ...conferences.sigcomm.org/imc/2010/papers/p390.pdfworks like Facebook [15], MySpace [30], and Twitter or a P2P network like Bittorrent). •Random](https://static.documents.pub/doc/80x56/609de60ae48b6e097249bc96/estimatingandsamplinggraphswith-works-like-facebook-15-myspace-30-and.jpg)


