Section I: Fracture Risk Assessment Measuring Apparent Trabecular Structure With pQCT: A Comparison With HR-pQCT Deena Lala, 1,2 Angela M. Cheung, 3,4 Cheryl L. Lynch, 1,2 Dean Inglis, 5 Chris Gordon, 6 George Tomlinson, 3,4,7 and Lora Giangregorio * ,1,2 1 Department of Kinesiology, University of Waterloo, Waterloo, ON, Canada; 2 Toronto Rehabilitation InstituteeUniversity Health Network, Lyndhurst Centre, Toronto, ON, Canada; 3 Department of Medicine and Medical Imaging, University of Toronto, Toronto, ON, Canada; 4 University Health Network, Toronto, ON, Canada; 5 Department of Civil Engineering, McMaster University, Hamilton, ON, Canada; 6 Department of Radiology, McMaster University, Hamilton, ON, Canada; and 7 Dalla Lana School of Public Health, University of Toronto, Toronto, ON, Canada Abstract We evaluated how comparable peripheral quantitative computed tomography (pQCT) measurements of cortical thickness, density, and apparent trabecular structure at the ultradistal tibia were with those measured with high- resolution pQCT (HR-pQCT). We also examined whether the accuracy of the pQCT-based trabecular and cortical measurements improved with reductions in slice thickness from the standard 2.2 mm to 1.1 and 0.6 mm. We im- mersed 15 dry tibia specimens in saline in a sealed cylinder and scanned 22.5 mm from the distal tibia plateau using pQCT and HR-pQCT. pQCT underestimated cortical thickness by Stratec (CTh Stratec ) and trabecular spacing (Tb.Sp) by 21.4% and 72.9%, whereas bone volume to total volume (BV/TV) and cortical density (CDen) were overesti- mated by 265.8% and 13.1%, respectively. Measurements of trabecular volumetric bone mineral density, trabecular area, total area, cortical thickness by custom software were comparable, but for CTh Stratec , Tb.Sp, BV/TV, and CDen, the differences between imaging devices varied with magnitude of the estimate. We recommend that researchers or clinicians interested in using pQCT to measure apparent trabecular structure or cortical thickness at the epiphyses, or in comparing findings from different devices, be aware of the differences between HR-pQCT and pQCT. Key Words: Accuracy; bone density; bone geometry; bone structure; peripheral quantitative computed tomography. Introduction Osteoporosis is characterized by a reduction in bone mass and deterioration in bone microarchitecture, resulting in an increased fracture risk (1). In Canada, the annual costs of treating osteoporosis and associated fractures are approx $1.9 billion. Optimizing strategies to improve the identifica- tion of individuals at increased risk of fractures would enable targeted osteoporosis management and potentially reduce costs associated with osteoporotic fractures. The diagnosis of osteoporosis includes an assessment of areal bone mineral density (aBMD) by dual-energy X-ray ab- sorptiometry (2). However, there are limitations to using aBMD to predict fracture risk. For example, a large propor- tion of fractures occur in women who would not be consid- ered to have osteoporosis according to aBMD (3,4). Bone quality is often used to describe the diverse factors influenc- ing fracture risk that may not be detected by aBMD such as architecture, turnover rate, geometry, and mineralization (5). High-resolution peripheral quantitative computed tomogra- phy (HR-pQCT) and peripheral quantitative computed to- mography (pQCT) allow noninvasive in vivo assessment of bone geometry and microarchitecture (6,7). HR-pQCT yields a 3-dimensional (3D) image to assess trabecular volumetric bone mineral density (TbvBMD) and uses sufficiently high Received 01/30/13; Revised 03/01/13; Accepted 03/01/13. *Address correspondence to: Lora Giangregorio, PhD, Department of Kinesiology, University of Waterloo, 200 University Ave W., Waterloo, ON N2L 3G1, Canada. E-mail: lora.giangregorio@ uwaterloo.ca 47 Journal of Clinical Densitometry: Assessment & Management of Musculoskeletal Health, vol. 17, no. 1, 47e53, 2014 Ó Copyright 2014 by The International Society for Clinical Densitometry 1094-6950/17:47e53/$36.00 http://dx.doi.org/10.1016/j.jocd.2013.03.002
Transcript
Journal of Clinical Densitometry: Assessment & Management of Musculoskeletal Health, vol. 17, no. 1, 47e53, 2014� Copyright 2014 by The International Society for Clinical Densitometry1094-6950/17:47e53/$36.00
http://dx.doi.org/10.1016/j.jocd.2013.03.002
Section I: Fracture Risk Assessment
Measuring Apparent Trabecular Structure With pQCT:A Comparison With HR-pQCT
Deena Lala,1,2 Angela M. Cheung,3,4 Cheryl L. Lynch,1,2 Dean Inglis,5 Chris Gordon,6
George Tomlinson,3,4,7 and Lora Giangregorio*,1,2
1Department of Kinesiology, University of Waterloo, Waterloo, ON, Canada; 2Toronto Rehabilitation InstituteeUniversityHealth Network, Lyndhurst Centre, Toronto, ON, Canada; 3Department of Medicine and Medical Imaging, University ofToronto, Toronto, ON, Canada; 4University Health Network, Toronto, ON, Canada; 5Department of Civil Engineering,McMaster University, Hamilton, ON, Canada; 6Department of Radiology, McMaster University, Hamilton, ON, Canada;
and 7Dalla Lana School of Public Health, University of Toronto, Toronto, ON, Canada
Abstract
Re*A
of KiWateruwate
We evaluated how comparable peripheral quantitative computed tomography (pQCT) measurements of corticalthickness, density, and apparent trabecular structure at the ultradistal tibia were with those measured with high-resolution pQCT (HR-pQCT). We also examined whether the accuracy of the pQCT-based trabecular and corticalmeasurements improved with reductions in slice thickness from the standard 2.2 mm to 1.1 and 0.6 mm. We im-mersed 15 dry tibia specimens in saline in a sealed cylinder and scanned 22.5 mm from the distal tibia plateau usingpQCT and HR-pQCT. pQCT underestimated cortical thickness by Stratec (CThStratec) and trabecular spacing (Tb.Sp)by 21.4% and 72.9%, whereas bone volume to total volume (BV/TV) and cortical density (CDen) were overesti-mated by 265.8% and 13.1%, respectively. Measurements of trabecular volumetric bone mineral density, trabeculararea, total area, cortical thickness by custom software were comparable, but for CThStratec, Tb.Sp, BV/TV, and CDen,the differences between imaging devices varied with magnitude of the estimate. We recommend that researchers orclinicians interested in using pQCT to measure apparent trabecular structure or cortical thickness at the epiphyses, orin comparing findings from different devices, be aware of the differences between HR-pQCT and pQCT.
Key Words: Accuracy; bone density; bone geometry; bone structure; peripheral quantitative computedtomography.
Introduction
Osteoporosis is characterized by a reduction in bone massand deterioration in bone microarchitecture, resulting in anincreased fracture risk (1). In Canada, the annual costs oftreating osteoporosis and associated fractures are approx$1.9 billion. Optimizing strategies to improve the identifica-tion of individuals at increased risk of fractures would enabletargeted osteoporosis management and potentially reducecosts associated with osteoporotic fractures.
ceived 01/30/13; Revised 03/01/13; Accepted 03/01/13.ddress correspondence to: Lora Giangregorio, PhD, Departmentnesiology, University of Waterloo, 200 University Ave W.,loo, ON N2L 3G1, Canada. E-mail: [email protected]
47
The diagnosis of osteoporosis includes an assessment ofareal bone mineral density (aBMD) by dual-energy X-ray ab-sorptiometry (2). However, there are limitations to usingaBMD to predict fracture risk. For example, a large propor-tion of fractures occur in women who would not be consid-ered to have osteoporosis according to aBMD (3,4). Bonequality is often used to describe the diverse factors influenc-ing fracture risk that may not be detected by aBMD such asarchitecture, turnover rate, geometry, and mineralization (5).High-resolution peripheral quantitative computed tomogra-phy (HR-pQCT) and peripheral quantitative computed to-mography (pQCT) allow noninvasive in vivo assessment ofbone geometry and microarchitecture (6,7). HR-pQCT yieldsa 3-dimensional (3D) image to assess trabecular volumetricbone mineral density (TbvBMD) and uses sufficiently high
resolution (82 mmm) to obtain information regarding trabecu-lar number (Tb.N), trabecular bone volume fraction (BV/TV),trabecular thickness (Tb.Th), trabecular spacing (Tb.Sp), aswell as cortical structure (6,8).
The Stratec pQCT scanner (Stratec Mezintechnik, Pforz-heim, Germany) can also differentiate between cortical andapparent trabecular bone and assess bone geometry (7,9),but the resolution (0.2e0.5 mm) may not be sufficient to ac-curately quantify apparent trabecular structure. However,a method for quantifying apparent trabecular bone structureat the radius using the Stratec pQCT scanner has previouslybeen studied (10,11). MacIntyre et al demonstrated age-dependent increases in average and maximum hole size andage-dependent decreases in trabecular connectivity in healthyadults (12). Furthermore, pQCT-based trabecular structurevariables were correlated with bone strength in vitro (13).Women with a history of forearm fractures had significantlydifferent trabecular bone structure than those with similaraBMD but with no history of fracture, indicating thatstructure-based measurements may be useful for identifyingthose at higher risk for fractures (10). However, no studieshave compared apparent trabecular structure measurementsobtained using pQCT with HR-pQCT to see whether the out-comes are similar. Understanding the comparability betweentechniques will facilitate comparison between studies thathave used pQCT and HR-pQCT. Furthermore, the tibia is of-ten measured using pQCT despite the lack of data on the abil-ity of pQCT to assess apparent trabecular structure at this site.Thus, our objective for this study was to examine the agree-ment between HR-pQCT and pQCT measurements of corticalthickness, density, and apparent trabecular structure at the ul-tradistal tibia site. In addition, we examined whether the ac-curacy of bone outcomes measured with the Stratec pQCTscanner improves with reductions in slice thickness fromthe standard 2.2 mm to 1.1 mm and then 0.6 mm.
Methods and Materials
Specimens
We obtained 15 dry human tibia specimens (Osta Interna-tional, White Rock, BC, Canada). All the specimens werecleaned and chemically treated with bleach. We measured
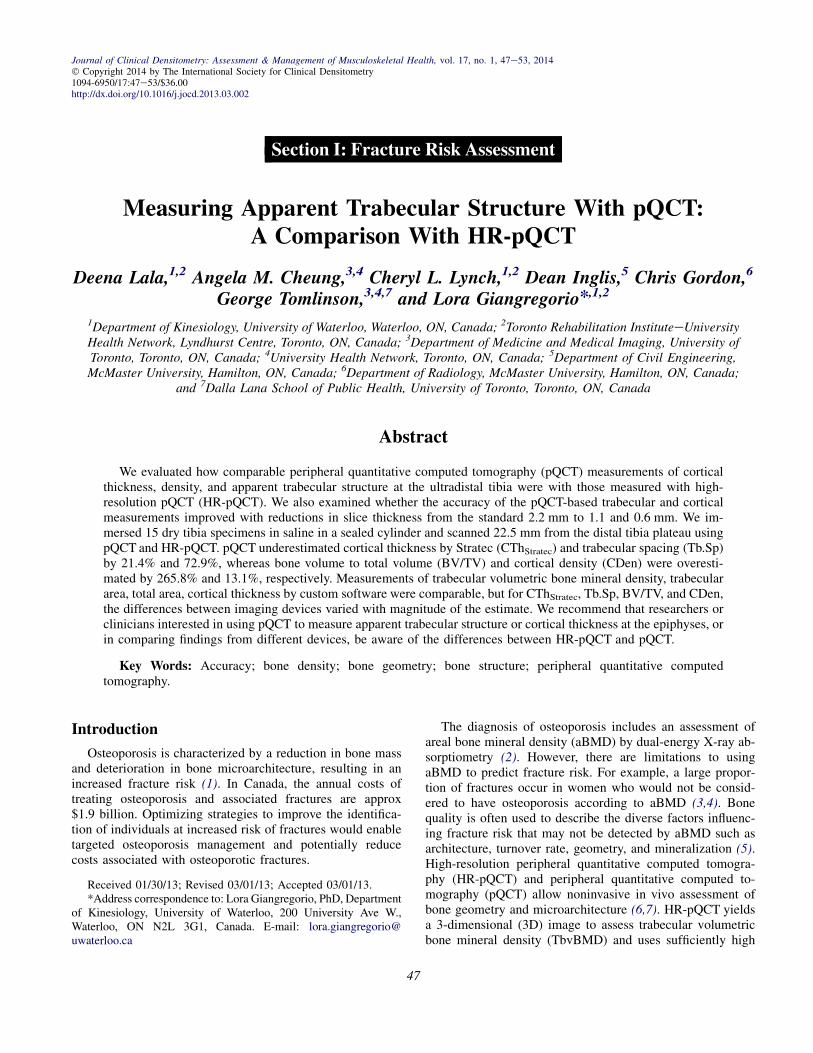
Fig. 1. Representative images of the tibia using (A) pQCT (2.2olution pQCT; pQCT, peripheral quantitative computed tomogra
Journal of Clinical Densitometry: Assessment & Management of Muscu
the length of each tibia using a plastic tape measure, withthe length defined as the distance from the most proximal por-tion of the articular surface of the medial malleolus to the in-tercondylar eminence. The 80% site of the tibia lengthmeasuring from distal to proximal was marked with a pencil.The proximal end of each tibia was cut off using a hacksaw atthe 80% site to ensure that the tibia specimens fit into a grad-uated cylinder. We securely attached each specimen to a plas-tic platform with plastic ties and then placed the specimenand plastic platform structure in a polymethylpentene-graduated cylinder. We added saline (sodium chloride 0.9%)to the cylinder until it reached approx 5.0 cm below the topof the cylinder. We sealed the cylinder using a rubber stopperwith a small tube embedded in it. We applied a vacuum to thesmall tube for 60e90 min to remove air bubbles from withinthe tibia specimens, with intermittent shaking of the tube toassist the dislodging of air bubbles. We then removed the rub-ber stopper with the small tube embedded, added additionalsaline to approx 1.5 cm from the top of the cylinder, andtightly sealed the cylinder with another rubber stopper.
Acquisition of Scans Using pQCT
We performed pQCT measurements with the Stratec XCT-2000 scanner (Stratec Mezintechnik, Pforzheim, Germany).We placed the cylinder that housed the specimen in a horizon-tal position and secured the cylinder into the pQCT gantry.For each specimen, we performed an initial scout scan atthe ultradistal tibia and then manually placed a referenceline at the intercondylar eminence on each scout scan. We ap-plied a distance rule for each tibia so that each scan began22.5 mm proximal to the intercondylar eminence, in accor-dance with the standard protocol for measuring the ultradistaltibia with HR-pQCT. We obtained a single 2.2-mm slice witha voxel size of 0.2 mm and a computed tomography (CT)speed of 10 mm/s, as shown in Fig. 1A. The voxel size andCT speed were chosen to optimize resolution. The StratecpQCT can be purchased with a variable collimator, which en-ables the operator to choose between 4 potential slice thick-nesses. We repeated the scan procedure twice to obtain 2additional slices of thickness 1.1 mm and 0.6 mm at thesame location. We reduced the CT speeds to 5 mm/s for slicethicknesses 1.1 mm and 0.6 mm to optimize image quality. To
-mm slice thickness) and (B) HR-pQCT. HR-pQCT, high-res-phy.
loskeletal Health Volume 17, 2014
Measuring Apparent Trabecular Structure With pQCT 49
ensure consistency, 1 individual performed and analyzed allscans. In addition, a phantom was scanned daily to ensurequality control.
Analysis of pQCT Scans
We used the manufacturer’s software (Stratec XCT-2000,version 6.00) to analyze the scans. We used CALCBDmode with contour mode 3 and peel mode 2 with an outerthreshold of 130 mg/mm3 and an inner threshold of 400 mg/mm3 to separate the bone from soft tissue and to separatethe cortical and subcortical and trabecular bone in the image,respectively. We assessed TbvBMD (mg/cm3), trabecular area(TbA, mm2), and total area (TotA, mm2) using CALCBDmode. We used contour mode 1 and a threshold of 710 mg/cm3 in CORTBD mode to determine cortical thickness(CThStratec, mm) and cortical density (CDen, mg/cm3). We de-termined the values of the following variables using customdeveloped software, as described previously (13): Tb.Sp(mm), BV/TV, and cortical thickness (CThCustom, mm). Thecustom software segments the image into bone, non-bone(marrow), and background pixels (external to the outer corti-cal perimeter). Estimates of Tb.Sp are evaluated by EuclideanDistance Transform (EDT) and subsequent maximal spherefitting within the marrow spaces of the segmented trabecularbone image. BV/TV is calculated by dividing the total num-ber of trabecular pixels by the total number of pixels withinthe inner cortical perimeter. We also used the custom softwareto determine CThCustom, which was calculated from a maskcomposed of the periosteal perimeter pixels over an EDT ofthe entire region external to the inner cortical perimeter.
Acquisition of Scans Using HR-pQCT Scans
We individually imaged the tibia specimens using an HR-pQCT system (XtremeCT; Scanco Medical AG, Bassersdorf,Switzerland) and its standard in vivo protocol. HR-pQCT usesa 2-dimensional (2D) detector array and a 0.08-mm point-focus X-ray tube. We performed the scans using a sourcepotential of 60 kVp, an X-ray tube current of 900 mA, andan integration time of 100 ms. We determined the region ofinterest using a scout scan by manually placing a referenceline at the endplate of the tibia. The first slice was 22.5 mmproximal to that reference line. A stack of 110 CT sliceswas obtained at the tibia (distal to proximal) with an isotopicvoxel size of 82 mm, which produced a 9.02-mm axial scandistance. A 3D image was reconstructed from the 2D slices,as shown in Fig. 1B.
Analysis of HR-pQCT Scans
The standard evaluation methods used to analyze the HR-pQCT data have been previously described and validated(8,14,15) and are briefly summarized here. The entire volumeof interest is automatically separated into cortical and trabec-ular regions using a threshold-based algorithm. The distinc-tion between cortical and trabecular bone is determined bysetting the threshold to one-third of the cortical bone density.Extraction of the mineralized phase uses a Laplace-Hammingfilter followed by global thresholding (15). Mean CTh is
Journal of Clinical Densitometry: Assessment & Management of Muscu
defined as the mean cortical area divided by the periosteal pe-rimeter (16). The average bone density within the trabecularvolume of interest determines TbvBMD. BV/TV is derivedfrom the trabecular density, assuming that density of the fullymineralized bone is 1.2 g hydroxyapatite per cm3 (BV/TV5(100� TbvBMD)/1200 mg HA per cm3). A thickness-independent algorithm is used to determine trabecular micro-structure. Tb.Sp is derived from BV/TV and Tb.N such thatTb.Sp5 (1� BV/TV)/Tb.N (13).
Statistical Analysis
We calculated means and standard deviations (SDs) foreach index for HR-pQCT and for each slice thickness forpQCT. We used Bland-Altman plots and limits of agree-ment to compare pQCT-based and HR-pQCTebased mea-surements of cortical thickness (CThStratec, CThCustom),density (CDen, TbvBMD), and apparent trabecular struc-ture indices (Tb.Sp, BV/TV, TbA, and TotA) and calculatedintraclass correlation coefficients as an overall measure ofagreement between the imaging techniques. We also com-puted Pearson correlation coefficients between pQCT andHR-pQCT for each of the measures and at each slice thick-ness (2.2, 1.1, and 0.6 mm). We interpreted r values as fol-lows: very weak, �0.29; weak, 0.30e0.49; moderate,0.50e0.69; strong, 0.70e0.89; and very strong, �0.90(17). The criterion for statistical significance was set at al-pha 5 0.05. Statistical analyses including Pearson correla-tion and Bland-Altman plots were carried out in SAS/STATsoftware, v9.1 (Cary, NC).
Results
Table 1 summarizes the mean values and SD for all apparenttrabecular structure and cortical bone outcomes. The length ofthe tibia specimens ranged between 33.0 and 38.5 cm. Bland-Altman plots were only performed to examine the agreementbetween HR-pQCT and pQCT with slice thickness 2.2 mm,as this is the standard slice thickness for pQCT (Table 2).
Using data from slice thickness of 2.2 mm, pQCT underes-timated CThStratec by 0.27 mm, which represents 21.4% of themean CTh measured by HR-pQCT. Fig. 2A demonstrates thatthe differences between HR-pQCT and pQCT varied with themagnitude of the measure such that as the mean value of CThincreased, the difference between the imaging devices de-creased. Measurements of Tb.Sp obtained by pQCT wereunderestimated by an average of 0.33 mm, corresponding to72.9% of the mean Tb.Sp measured by HR-pQCT. A rela-tively linear relationship was seen in the Bland-Altman graph;the difference between Tb.Sp values measured by pQCT andthose measured by HR-pQCT increased as the mean Tb.Sp in-creased (Fig. 2B).
pQCT overestimated values of BV/TV by 0.42 and CDenby 110.9 mg/cm3. This represents 265.8% and 13.1% of themean BV/TVand CDen measured by HR-pQCT, respectively.Difference between imaging devices increased as mean BV/TV increased (Fig. 2C). No variation with magnitude was vis-ible for CDen (figure not shown).
loskeletal Health Volume 17, 2014
Table 1Mean � SD of Trabecular and Cortical-Based Measurements Assessed by HR-pQCT and pQCT
Abbr: BV/TV, bone volume to total volume; CDen, cortical density; CThCustom, cortical thickness by custom software; CThStratec, corticalthickness by Stratec; HR-pQCT, high-resolution peripheral quantitative computed tomography; pQCT, peripheral quantitative computed to-mography; SD, standard deviation; TbA, trabecular area; Tb.Sp, trabecular spacing; TbvBMD, trabecular volumetric bone mineral density;TotA, total area.
50 Lala et al.
Bone variables of TbvBMD, TbA, TotA, CThCustom werein agreement between imaging devices as per Bland-Altmanplots. pQCT overestimated these bone parameters by an aver-age of 32.1 mg/cm3, 21.4 mm2, 177.0 mm2, and 0.06 mm, re-spectively, corresponding to 17.2%, 3.0%, 20.6%, and 4.8%of the mean equivalent HR-pQCT values. No systematicbias was evident for these bone outcome measures. pQCTslightly underestimates CThCustom for larger CTh values andoverestimates for smaller values (Fig. 2D).
A significant bias was found when comparing the agree-ment between pQCT slice thickness 2.2 mm and HR-pQCTto the agreement between pQCT slice thicknesses 1.1 mm( p ! 0.001) or 0.6 mm ( p ! 0.005) and HR-pQCT. Therewas no significant difference in agreement when comparingslice thicknesses for CThCustom (slice thickness 1.1 mm,p 5 0.55; and 0.6 mm, p 5 0.64).
A significant correlation was found between HR-pQCTand pQCT for BV/TV, TbvBMD, TbA, CThCustom, CThStratec,
Abbr: BV/TV, bone volume to total volume; CDen, cortical density;thickness by Stratec; HR-pQCT, high-resolution peripheral quantitativemography; TbA, trabecular area; Tb.Sp, trabecular spacing; TbvBMD, t
Journal of Clinical Densitometry: Assessment & Management of Muscu
CDen, and TotA (r 5 0.78e0.99, p ! 0.01; Table 3). Therewas no statistically significant correlation between HR-pQCTand pQCT for Tb.Sp (r 5 0.33, p 5 0.22).
Discussion
The present study suggests that some (TbvBMD, TbA,TotA, CThCustom), but not all, pQCT parameters are compara-ble with those derived with HR-pQCT. CThStratec and Tb.Spwere underestimated by 21.4% and 72.9%, whereas BV/TVand CDen were overestimated by 265.8% and 13.1%, respec-tively. Measurements of TbvBMD, TbA, TotA, CThCustomwere reasonably comparable between imaging devices. Fur-thermore, for CThStratec, Tb.Sp, BV/TV, and CDen, the differ-ences between imaging devices varied with the magnitude ofthe estimate.
pQCT and HR-pQCT provide a way to noninvasively as-sess bone density and structure ex vivo and in vivo. However,
2d pQCT With Slice Thickness 2.2 mm
an pQCT)
95% Confidence interval
Lower Upper
0.16 0.50�0.49 �0.35
�88.0 23.70.05 0.48
�0.30 0.18�153.2 �68.7�200.3 157.5�249.1 �104.9
CThCustom, cortical thickness by custom software; CThStratec, corticalcomputed tomography; pQCT, peripheral quantitative computed to-rabecular volumetric bone mineral density; TotA, total area.
loskeletal Health Volume 17, 2014
Fig. 2. Bland-Altman plots of assessing level of agreement between pQCT with slice thickness 2.2 mm and HR-pQCT: (A)CThStratec (mm), (B) Tb.Sp (mm), (C) BV/TV, and (D) CThCustom (mm). BV/TV, bone volume to total volume; CThCustom, cor-tical thickness by custom software; CThStratec, cortical thickness by Stratec; HR-pQCT, high-resolution peripheral quantitativecomputed tomography; pQCT, peripheral quantitative computed tomography; Tb.Sp, trabecular spacing.
Measuring Apparent Trabecular Structure With pQCT 51
they differ in their methods of scan acquisition; HR-pQCT ac-quires 2D images and reconstructs them into a 3D image us-ing isotropic voxels of 82 mm and reconstructs a 9.02-mmsegment of bone, whereas pQCT acquires a slice thicknesswith 2.2 mm and voxel size 0.2 mm. Even with the differencein resolution between the imaging devices, we found thatTbvBMD, TbA, and TotA exhibited high correlations andthe least amount of disagreement between the pQCT andequivalent HR-pQCT values and showed no clear systematicbias. It is not surprising that TbvBMD obtained by pQCT atthe ultradistal tibia is well correlated with that measured byHR-pQCT as pQCT has been previously shown to accuratelyassesses TbvBMD compared with ash weight (18). On theother hand, the lower resolution of pQCT did limit our abilityto achieve accurate measures of apparent trabecular structure.The average width of trabeculae is smaller than the voxel sizeused for pQCT, which explains the poor correlation and verylarge disagreement between HR-pQCT and pQCT measure-ments of Tb.Sp. The disagreement increased as the meanvalue for Tb.Sp became very small or very large. We tried
Journal of Clinical Densitometry: Assessment & Management of Muscu
voxel sizes that are smaller than the voxel size used in stan-dard acquisition protocols to maximize our ability to obtainaccurate estimates of apparent trabecular structure, as in-creasing pQCT voxel size results in ‘‘blurring’’ or poorimage quality (7). Undoubtedly, the difference in acquisitionmethods affected the data obtained by the 2 imaging tech-niques, resulting in the differences seen in the between-device comparison. Although the resolution is poorer withpQCT, we can still measure TbvBMD, TbA, TotA, andCThCustom relatively well with minimal bias.
Several variables were overestimated or underestimated,and in some cases, the agreement between pQCT and HR-pQCT varied with the magnitude of the estimate. pQCToverestimated BV/TV compared with HR-pQCT, and the over-estimation increased relatively linearly with increasing meanvalues of BV/TV. CDen was overestimated by 13.1%, but itdid not vary with the magnitude of the estimate. These resultsare consistent with our previous study, which demonstratedsimilar overestimations of CDen by pQCT by 14% in the tibialshaft (19). The different methods of calibration for each
loskeletal Health Volume 17, 2014
Table 3Correlations (r) Between Trabecular and Cortical-Based
Measurements Obtained by HR-pQCT and pQCT
Bone parameter
pQCT (mm)
2.2 1.1 0.6
pQCT vs HR-pQCT: Tb.Sp (mm) 0.33 0.12 �0.02pQCT vs HR-pQCT: BV/TV 0.93 0.92 0.93pQCT vs HR-pQCT: TbvBMD (mg/cm3) 0.78 0.72 0.67pQCT vs HR-pQCT: CThStratec (mm) 0.99 0.99 0.99pQCT vs HR-pQCT: CThCustom (mm) 0.91 0.91 0.97pQCT vs HR-pQCT: CDen (mg/cm3) 0.95 0.96 0.97pQCT vs HR-pQCT: TbA (mm2) 0.85 0.85 0.86pQCT vs HR-pQCT: TotA (mm2) 0.97 0.97 0.98
Note: For correlations 0.67e0.78, p ! 0.01; for correlations0.85e0.98, p ! 0.0001.
Abbr: BV/TV, bone volume to total volume; CDen, cortical den-sity; CThCustom, cortical thickness by custom software; CThStratec,cortical thickness by Stratec; HR-pQCT, high-resolution peripheralquantitative computed tomography; pQCT, peripheral quantitativecomputed tomography; TbA, trabecular area; Tb.Sp, trabecular spac-ing; TbvBMD, trabecular volumetric bone mineral density; TotA, to-tal area.
52 Lala et al.
imaging device may partially explain the variation in CDen;Stratec pQCT assigns a density of 0 mg HA/cm3 for fat and60 mg HA/cm3 for water-like tissues such as muscle. Incontrast, HR-pQCT assigns a density of 0 mg HA/cm3 forsoft tissues. Based on our findings,measurements ofBV/TVob-tained with pQCTare not comparable with HR-pQCT becauseit varies with magnitude, but CDen measured with pQCT iscomparable with that measured with HR-pQCTwith the under-standing that there are absolute differences between the imag-ing devices.
The level of agreement between pQCT and HR-pQCTvalues of cortical thickness was dependent on whether corti-cal thickness was analyzed using the manufacturer’s softwareor our custom software. CThStratec was overestimated, and thedifference between devices decreased as cortical thickness in-creased. However, CThCustom was minimally underestimatedcompared with HR-pQCT and did not vary with the magni-tude of cortical thickness. This phenomenon may be attrib-uted to the method by which each program calculatescortical thickness. CThCustom is calculated using EDT; a dis-tance map of the entire region external to the inner corticalperimeter and extending to the edges of the image is calcu-lated by EDT. Distance values are taken from this map atpixel locations along the outer cortical perimeter to calculatethe minimum, maximum, mean, and SD of cortical thicknessvalues. CThStratec assumes a circular ring model, in which theshape of the tibia is circular, and calculates the average differ-ence between the outer and inner radii. Our previous work re-vealed that when pQCT images of the tibia shaft wereanalyzed with the manufacturer’s analysis, cortical thicknesswas overestimated compared with HR-pQCT, and the
Journal of Clinical Densitometry: Assessment & Management of Muscu
overestimation increased as the mean cortical thickness valueincreased (19). Therefore, the combined results of the presentstudy and our previous work suggest that the Stratec pQCTunderestimates cortical thickness at very small values andoverestimates it at very large values compared with HR-pQCT.
We acknowledge that our study has some limitations.First, our study was performed using ex vivo tibia specimensrather than in vivo. With the use of ex vivo bone specimens,the effect of motion artifacts is minimized. However, it hasbeen documented that morphological errors due to motionartifacts is relatively low at 4.5% (20). In addition, weused normal saline as a substitute for soft tissue. Marrowcomposition is complex compared with that of saline andhas been shown to affect the precision and accuracy ofbone measurements (21). It is also important to indicatethat the comparability between pQCT- and HR-pQCTebased measurements of cortical thickness, density, and ap-parent trabecular structure may be affected by the presenceof soft-tissue components, including tendons, ligaments,subcutaneous fat, and muscle, if these scans were performedin vivo (22). Our study represents the comparability of theseimaging methods in the absence of ‘‘human subject’’ sourcesof error, for example, movement, and differences in posi-tioning of bone or soft tissue. Therefore, future studiesshould confirm whether the comparability is similar whenassessed in vivo.
Second, pQCT-based estimates of cortical thickness, den-sity, and apparent trabecular structure were obtained froma single slice, which may not be an appropriate representationof bone architecture. Our study was designed to comparestandard acquisition protocols for pQCT and HR-pQCT. How-ever, it may be that some of the variability between devicesmay be attributable to variations in slice thickness; we com-pared an axial scan distance of 9.02 mm measured withHR-pQCT with a 1 axial slice of 2.2, 1.1, and 0.6 mm thick-ness measured with pQCT. A more appropriate standard forcomparison would have been histomorphometry or mCT;however, HR-pQCT has been shown to be strongly correlatedto mCT (15).
In conclusion, this study provides new insights about thecapabilities of pQCT. Despite our observation that almostall trabecular and cortical bone density and geometry mea-sures obtained using pQCT and HR-pQCT were highly corre-lated, several variables were over- or underestimated withpQCT. In the case of CThStratec, TbSp, BV/TV, and CDen,the difference between devices varied with the magnitude ofthe estimate. Our findings have important implications forfuture work that may compare outcomes from pQCT andHR-pQCT devices or make conclusions about the accuracyof cortical thickness, density, and apparent trabecular mea-sures derived with pQCT.
Acknowledgments
This work was supported by the Ontario NeurotraumaFoundation (grant #2009-SCI-MA-684).
loskeletal Health Volume 17, 2014
Measuring Apparent Trabecular Structure With pQCT 53
References
1. Peck WA, Burckhardt P, Christiansen C, et al. 1993 Consensusdevelopment conference: diagnosis, prophylaxis, and treatmentof osteoporosis. Am J Med 94:646e650.
2. Assessment of fracture risk and its application to screening forpostmenopausal osteoporosis. Geneva, Switzerland: WorldHealth Organization.
3. Siris ES, Miller PD, Barrett-Connor E, et al. 2001 Identificationand fracture outcomes of undiagnosed low bone mineral densityin postmenopausal women. JAMA 286:2815e2822.
4. Schuit SCE, Van der Klift M, Weel A, et al. 2004 Fracture inci-dence and association with bone mineral density in elderly menand women: the Rotterdam Study. Bone 34:195e202.
5. NIH Consensus Development Panel on Osteoporosis Prevention,Diagnosis, Therapy. 2001 Osteoporosis prevention, diagnosis,and therapy. JAMA 285:785e795.
6. Boutroy S, Bouxsein ML, Munoz F, Delmas PD. 2005 In vivoassessment of trabecular bone microarchitecture by high-resolution peripheral quantitative computed tomography. J ClinEndocrinol Metab 90:6508e6515.
7. Ashe MC, Khan KM, Kontulainen SA, et al. 2006 Accuracy ofpQCT for evaluating the aged human radius: an ashing, histo-morphometry and failure load investigation. Osteoporos Int 17:1241e1251.
8. Laib A, R€uegsegger P. 1999 Calibration of trabecular bone struc-ture measurements of in vivo three-dimensional peripheralquantitative computed tomography with 28-mm-resolution mi-crocomputed tomography. Bone 24:35e39.
9. Burrows M, Liu D, McKay H. 2010 High-resolution peripheralQCT imaging of bone micro-structure in adolescents. Osteo-poros Int 21:515e520.
10. MacIntyre NJ, Adachi JD, Webber CE. 2003 In vivo measure-ment of apparent trabecular bone structure of the radius inwomen with low bone density discriminates patients with recentwrist fracture from those without fracture. J Clin Densitom 6:35e43.
11. MacIntyre NJ, Adachi JD, Webber CE. 2000 In vivo detection ofstructural differences between dominant and nondominant radii
Journal of Clinical Densitometry: Assessment & Management of Muscu
using peripheral quantitative computed tomography. J Clin Den-sitom 2:413e422.
12. MacIntyre NJ, Adachi JD, Webber CE. 1999 Gender differencesin normal age-dependent patterns of radial bone structure anddensity: a cross-sectional study using peripheral quantitativecomputed tomography. J Clin Densitom 2:163e173.
13. Gordon CL, Webber CE, Adachi JD, Christoforou N. 1996In vivo assessment of trabecular bone structure at the distal ra-dius from high-resolution computed tomography images. PhysMed Biol 41:495.
14. Laib A, H€auselmann HJ, R€uegsegger P, et al. 1998 In vivo highresolution 3D-QCT of the human forearm. Technol Health Care6:329.
15. MacNeil JA, Boyd SK. 2007 Accuracy of high-resolution pe-ripheral quantitative computed tomography for measurementof bone quality. Med Eng Phys 29:1096e1105.
16. Kazakia GJ, Hyun B, Burghardt AJ, et al. 2008 In vivo determi-nation of bone structure in postmenopausal women: a compari-son of HR-pQCT and high-field MR imaging. J Bone Miner Res23:463e474.
17. Crewson P. 2006 Applied statistics handbook. Leesburg, VA:AcaStat Software. Available at www.acastat.com. Accessed Feb-ruary 10, 2012.
18. Veitch SW, Findlay SC, Ingle BM, et al. 2004 Accuracy and pre-cision of peripheral quantitative computed tomography measure-ments at the tibial metaphysis. J Clin Densitom 7:209e217.
19. Lala D, Cheung AM, Gordon C, Giangregorio L. 2012 Compar-ison of cortical bone measurements between pQCT and HR-pQCT. J Clin Densitom 15:275e281.
20. MacNeil JA, Boyd SK. 2008 Improved reproducibility of high-resolution peripheral quantitative computed tomography formeasurement of bone quality. Med Eng Phys 30:792e799.
21. Mazess RB. 1983 Errors in measuring trabecular bone by com-puted tomography due to marrow and bone composition. CalcifTissue Int 35:148e152.
22. Siev€anen H, Koskue V, Rauhio A, et al. 1998 Peripheral quanti-tative computed tomography in human long bones: evaluation ofin vitro and in vivo precision. J Bone Miner Res 13:871e882.