Measuring audit quality in an era of change An empirical investigation of UK audit market stakeholders in 2002 and 2005 Angus Duff University of the West of Scotland, Ayr, UK Abstract Purpose – The purpose of this paper is to consider changing perceptions of audit quality in the UK during a period of significant environmental change. The views of three audit stakeholder groups of auditors (n ¼ 109 and 183), auditees (n ¼ 75 and 121), and investors (n ¼ 74 and 111) are considered. Design/methodology/approach – The paper uses survey data collected in February 2005, comparing results to a dataset gathered in February 2002, coincident with the Enron/Andersen debacle. Three issues are addressed. First, the construct validity of scale scores is assessed. Second, the measurement equivalence between the three groups is considered. Third, an assessment of group differences and differences attributable to time of administration is undertaken. Findings – Results identify that audit quality is defined by four higher-order factors labeled competence, independence, relationship, and service qualities. Confirmatory factor analyses indicated measurement equivalence across groups drawn from the three samples and two time periods. Contrary to expectations, mean scores on the “technical” audit factors (competence, relationship, and independence) fell from 2002 to 2005. However, as expected, no change in service qualities mean scores was identified across the period. Originality/value – The paper assesses stakeholder attitudes at a time when the UK audit environment has undergone significant change between the 2002 and 2005 administrations of the instrument. Keywords Auditing, Quality, Stakeholder analysis, United Kingdom Paper type Research paper Introduction Audit markets have undergone significant change in the twenty-first century. Thesudden collapse of Enron in the USA in 2001, followed by a number of other high-profile US companies reporting financial difficulties, led to a global crisis of confidence in the corporate governance and auditing of publicly-quoted companies. Regulators were swift to respond with the Sarbanes-Oxley Act (2002), imposing new requirements on directors and audit committees that effectively ended the self-regulation of the auditing profession in the USA. Within the UK, various investigations (CGAA, 2003; DTI, 2003; Higgs, 2003; House of Commons Treasury Committee, 2002) led to the establishment of the Audit Inspection Unit (AIU): a new monitoring unit to inspect listed and public interest audits, under the auspices of a new Public Oversight Boar (POB), along with various other improvements to enhance auditor independence. Further enhancements to the UK audit environment have included a greater role for the standard-setting Auditing Practices Board (APB) as The current issue and full text archive of this journal is available at www.emeraldinsight.com/0268-6902.htm MAJ 24,5 400 Received 7 August 2008 Revised 29 January 2009 Accepted 9 February 2009 Managerial Auditing Journal Vol. 24 No. 5, 2009 pp. 400-422 q Emerald Group Publishing Limited 0268-6902 DOI 10.1108/02686900910956784
Transcript
Measuring audit qualityin an era of change
An empirical investigation of UK audit marketstakeholders in 2002 and 2005
Angus DuffUniversity of the West of Scotland, Ayr, UK
Abstract
Purpose – The purpose of this paper is to consider changing perceptions of audit quality in theUK during a period of significant environmental change. The views of three audit stakeholder groupsof auditors (n ¼ 109 and 183), auditees (n ¼ 75 and 121), and investors (n ¼ 74 and 111) areconsidered.
Design/methodology/approach – The paper uses survey data collected in February 2005,comparing results to a dataset gathered in February 2002, coincident with the Enron/Andersendebacle. Three issues are addressed. First, the construct validity of scale scores is assessed. Second, themeasurement equivalence between the three groups is considered. Third, an assessment of groupdifferences and differences attributable to time of administration is undertaken.
Findings – Results identify that audit quality is defined by four higher-order factors labeledcompetence, independence, relationship, and service qualities. Confirmatory factor analyses indicatedmeasurement equivalence across groups drawn from the three samples and two time periods. Contraryto expectations, mean scores on the “technical” audit factors (competence, relationship, andindependence) fell from 2002 to 2005. However, as expected, no change in service qualities mean scoreswas identified across the period.
Originality/value – The paper assesses stakeholder attitudes at a time when the UK auditenvironment has undergone significant change between the 2002 and 2005 administrations of theinstrument.
Keywords Auditing, Quality, Stakeholder analysis, United Kingdom
Paper type Research paper
IntroductionAudit markets have undergone significant change in the twenty-first century.Thesudden collapse of Enron in the USA in 2001, followed by a number of otherhigh-profile US companies reporting financial difficulties, led to a global crisis ofconfidence in the corporate governance and auditing of publicly-quoted companies.Regulators were swift to respond with the Sarbanes-Oxley Act (2002), imposing newrequirements on directors and audit committees that effectively ended theself-regulation of the auditing profession in the USA. Within the UK, variousinvestigations (CGAA, 2003; DTI, 2003; Higgs, 2003; House of Commons TreasuryCommittee, 2002) led to the establishment of the Audit Inspection Unit (AIU): a newmonitoring unit to inspect listed and public interest audits, under the auspices of a newPublic Oversight Boar (POB), along with various other improvements to enhanceauditor independence. Further enhancements to the UK audit environment haveincluded a greater role for the standard-setting Auditing Practices Board (APB) as
The current issue and full text archive of this journal is available at
www.emeraldinsight.com/0268-6902.htm
MAJ24,5
400
Received 7 August 2008Revised 29 January 2009Accepted 9 February 2009
independent of the profession, with responsibility for ethical as well as technicalstandards, and an enhanced corporate governance regime with developmentsaffecting the role and activities of audit committees (Financial Reporting Council(FRC, 2003).
Prior to the Enron failure, UK audit markets were characterized by significantcompetition and slow growth over the past two decades. This created downwardpressure on audit fees: a situation that has persisted into the twenty-first century(Fisher, 2005). At the same time, the audit profession has been affected by theglobalization of business, commercialization of practice and stakeholder dissatisfactionwith the level of audit quality. These issues are focusing auditors’ minds on improvingthe quality of service they offer to their clients, while maintaining the technicaleffectiveness of the audit. Despite a widespread recognition within the audit industryof the need to maintain effective relationships with clients, whilst recognizing who the“real” customer is (i.e. the stakeholder) (Elliott, 1995), relatively little academic researchconsiders the relationship between service quality and technical issues. For thepurposes of this paper, service quality can be thought of as a sustainable means ofproviding clients (and stakeholders) with what they want or need, better, and moreeffectively (Berry et al., 1989; Lewis, 1993). Technical qualities represent traditionalviews of audit quality, centering on perceptions of auditor competence and the degreeof independence they enjoy from the client (DeAngelo, 1981). A premise of this paper isthat service quality and technical quality are both necessary components of auditquality, if audit firms are to generate sufficient fee income to attract and retainhigh-caliber staff, and maintain the quality of audit work.
Audit quality does not have a consistent definition and operationalization acrossstudies. It has troubled theorists for many years (Herrbach, 2001). Audit qualityis particularly problematic intrinsically, and for external users (Carcello et al., 1992),as its characteristics are often unobservable (Moizer, 1997). Identifying and calibratingcomponents of audit quality have been seen as a fruitful avenue for research(Warming-Rasmussen and Jensen, 1998). In an attempt to address this limitation,Duff (2004) recently developed AUDITQUAL as a multidimensional inventoryassessing distinct components of audit quality, drawn from the extant audit qualityliterature.
Specifically, the paper has three aims. First, to extend the work of Duff (2004) byfurther examining the construct validity of AUDITQUAL scores. This is achieved bytesting two hypothesized models, the two higher-order factors of Duff (2004), and analternative with four higher-order factors. Second, to extend the analysis undertaken inDuff (2004) to assess the degree of measurement equivalence of AUDITQUAL acrossthree groups of the three stakeholder groups. Third, to test hypothesized differences inAUDITQUAL scores with respect to group and time. The responses of auditors,auditees, and investors in 2005 are compared to the 2002 dataset of Duff (2004) toestablish whether the perceptions of audit quality held by key participants in the auditmarket have changed from 2002 to 2005. As Francis (2004, p. 365) contends:“perceptions are very important with respect to auditor credibility, particularly sinceaudit quality is difficult to observe directly”. Watkins et al. (2004) identify audit qualityis subject to a range of definitions, and most reflect some degree of market perceptions.Prior to Duff (2004) only limited empirical study of issues related to audit quality in theUK occurred, with existing empirical studies relating to the USA (Behn et al., 1997;
Measuring auditquality in an era
of change
401
Carcello et al., 1992) and Denmark (Warming-Rasmussen and Jensen, 1998). Given thedifferent environments (especially regulatory) that exist across countries, it isimportant to conduct audit quality studies in different countries, and performcross-country insights to gain new insights (Wallace, 1987). Furthermore, the auditenvironment has undergone significant change between 2002 and 2005, both in termsof regulation, and regulatory constraints imposed on auditors’ supply of non-auditservices to audit clients.
The results of the present study find that audit quality is best described by afour-factor model encompassing technical audit qualities relating to the perceivedcompetence, independence and relationship the auditor has with the auditee, and thoseservice qualities relating to the audit engagement itself. The four-factor model wasequivalent across administrations in 2002 and 2005, and between the three groups ofauditors, auditees, and investors. However, an unexpected finding was that scores ontechnical qualities fell from 2002 to 2005 across the three groups, while service qualityratings rose from 2002 to 2005.
The remainder of this paper is structured as follows. The second section describesthe context of the research and develops hypotheses. This section provides thetheoretical framework for the investigation, that form the basis of the content of theAUDITQUAL research instrument, along with a discussion of the changes that haveoccurred within the UK audit market since 2002. Sampling and data collectionprocedures are described in third section. The results and discussion are presented infourth section. The final section of the paper summarizes and concludes.
Background and development of hypothesesAudit quality issues and the AUDITQUAL modelDeAngelo (1981, p. 186) defines audit quality as “the market-based joint probabilitythat a given auditor will both (a) discover a breach in the client’s accounting system,and (b) report the breach”. That is, audit quality reflects the market’s perception of theauditor’s competence and their independence.
Prior research has examined the perceptions of audit quality in Denmark(Warming-Rasmussen and Jensen, 1998), the UK (Beattie and Fearnley, 1995; Moizer,1998), and the USA (Behn et al., 1997; Carcello et al., 1992; Mock and Samet, 1982;Schroeder et al., 1986; Sutton, 1993; Sutton and Lampe, 1990). This literature typicallyidentifies attributes that are perceived by financial statement preparers, auditors, andusers that are related to audit quality. However, although these authors have createdconstructs that may have elements in common, they have been used with littlereference to one another. Duff (2004) extends the extant research considering auditquality by examining hypothesized dimensions of audit quality based on priorliterature. The Duff (2004) investigation is novel in its development of a measurementinstrument to capture audit quality: AUDITQUAL. Specifically, Duff (2004) defines theaudit quality macro-construct, de-composed into its micro-attributes, operationalizedinto scale items, and tested empirically using responses from 109 audit engagementpartners (AEPs), 75 chief financial officers (CFOs), and 74 fund managers, proxying forinvestors.
Table I summarizes those empirical studies that examine attributes of auditquality – see Duff (2004) for a comprehensive review of the literature in this area. Fromthis review, it is apparent the concept of audit quality is not exactly clear in terms of its
MAJ24,5
402
Au
thor
sM
eth
odR
esu
lts
Moc
kan
dS
amet
(198
2)S
urv
eyof
aud
itor
sin
US
Ato
dev
elop
32-i
tem
qu
esti
onn
aire
toev
alu
ate
aud
itq
ual
ity
Iden
tifi
edfi
ve
aud
itq
ual
ity
dim
ensi
ons:
pla
nn
ing
,ad
min
istr
atio
n,
pro
ced
ure
s,ev
alu
atio
nan
dco
nd
uct
Sch
roed
eret
al.
(198
6)S
urv
eyof
aud
itco
mm
itte
ech
airs
and
aud
itor
sin
the
US
Ato
det
erm
ine
effe
ctof
15fa
ctor
son
aud
itq
ual
ity
Au
dit
team
fact
ors
mor
eim
por
tan
tth
anau
dit
firm
fact
ors
Su
tton
and
Lam
pe
(199
0)G
rou
pex
erci
sew
ith
pra
ctic
ing
aud
itor
sin
the
US
Ato
dev
elop
anau
dit
qu
alit
yev
alu
atio
nm
odel
Mod
elu
sed
19at
trib
ute
sth
atw
ere
clas
sifi
edin
toth
ree
cate
gor
ies:
pla
nn
ing
,fi
eld
wor
kan
dad
min
istr
atio
nC
arce
lloet
al.
(199
2)S
urv
eyof
fin
anci
alst
atem
ent
pre
par
ers,
aud
itor
san
du
sers
inth
eU
SA
tore
du
ce41
aud
itq
ual
ity
item
sfr
omli
tera
ture
to12
aud
itq
ual
ity
fact
ors
Mos
tim
por
tan
tfa
ctor
sid
enti
fied
wer
e:ex
per
ien
cew
ith
the
clie
nt,
ind
ust
ryex
per
tise
,res
pon
siv
enes
sto
clie
nt
nee
ds,
and
adh
eren
ceto
gen
eral
stan
dar
ds
ofg
ener
ally
acce
pte
dau
dit
ing
stan
dar
ds
Su
tton
(199
3)N
omin
alg
rou
pte
chn
iqu
eon
exp
erie
nce
dau
dit
ors
tod
evel
opan
dv
alid
ate
ase
tof
aud
itq
ual
ity
fact
ors
and
mea
sure
s
Iden
tifi
ed19
qu
alit
yfa
ctor
sth
atco
uld
be
cate
gor
ized
into
thre
eg
rou
ps:
pla
nn
ing
,fi
eld
wor
kan
dad
min
istr
atio
nB
eatt
iean
dF
earn
ley
(199
5)S
urv
eyof
CF
Os
of21
0li
sted
UK
com
pan
ies
toid
enti
fyth
eim
por
tan
ceof
29d
esir
able
aud
itor
char
acte
rist
ics
Iden
tifi
edfi
ve
key
char
acte
rist
ics
focu
sin
gon
the
imp
orta
nce
ofth
eA
EP
’ste
chn
ical
skil
lsan
dp
eop
lesk
ills
Beh
net
al.
(199
7)S
urv
eyof
con
trol
lers
inth
eU
SA
toev
alu
ate
exis
tin
gau
dit
oru
sin
g12
-ite
mq
ues
tion
nai
red
eriv
edfr
omC
arce
lloetal.’
s(1
992)
wor
kto
iden
tify
det
erm
inan
tsof
aud
itcl
ien
tsa
tisf
acti
on
Res
pon
siv
enes
sto
clie
nt
nee
ds,
exec
uti
ve
inv
olv
emen
t,ef
fect
ive
and
ong
oin
gin
tera
ctio
nw
ith
aud
itco
mm
itte
e,co
nd
uct
offi
eld
wor
k,
ind
ust
ryex
per
tise
,an
dp
rior
exp
erie
nce
ofcl
ien
tal
lp
osit
ivel
yas
soci
ated
wit
hcl
ien
tsa
tisf
acti
onM
oize
r(1
998)
Su
rvey
sof
com
pan
yd
irec
tors
in19
87an
d19
96of
the
then
big
eig
ht
and
big
six
acco
un
tin
gfi
rms.
Mu
ltiv
aria
tere
gre
ssio
nan
aly
sis
wit
hco
mp
osit
em
easu
reof
aud
itp
erfo
rman
ceu
sed
asd
epen
den
tv
aria
ble
,11
ind
epen
den
tv
aria
ble
s
Bot
h19
87an
d19
96sa
mp
les
“wel
lsa
tisfi
edw
ith
the
qu
alit
yof
serv
ice
pro
vid
edb
ym
ain
aud
itfi
rm”.
Old
erfi
nan
cial
dir
ecto
rsm
ore
sati
sfied
wit
hth
eir
aud
itfi
rmth
anth
eir
you
ng
erco
llea
gu
es
War
min
g-R
asm
uss
enan
dJe
nse
n(1
998)
Su
rvey
ofsh
areh
old
ers,
fin
anci
aljo
urn
alis
ts,
aud
itor
san
dm
anag
ing
dir
ecto
rsp
erce
pti
ons
ofau
dit
qu
alit
y
Ex
tern
alu
sers
ten
dto
per
ceiv
eau
dit
qu
alit
yat
trib
ute
sas
attr
ibu
tes
that
insp
ire
con
fid
ence
inth
eau
dit
or;
six
mai
nq
ual
ity
dim
ensi
ons
iden
tifi
ed(m
oral
and
eth
ical
asp
ects
);fo
ur
gro
up
sra
teq
ual
ity
dim
ensi
ons
dif
fere
ntl
y
Source:
Du
ff(2
004)
Table I.Results of behavioral
audit quality research
Measuring auditquality in an era
of change
403
definitions, scope and operationalization, complicating interpretations, and the abilityto replicate findings.
An important conclusion from the studies identified in Table I is that definitions ofaudit quality usually go beyond the DeAngelo (1981) definition of competence andindependence, to include aspects of service quality. The development of AUDITQUALextends prior research by explicit reference to the burgeoning service quality literature.The most widely known and discussed scale for measuring service quality is thefive-dimension SERVQUAL inventory (Parasuraman et al., 1988, 1991) that has beenwidely applied in a range of service settings. Specifically, service quality reflects thedifference that exists between customer expectations and perceptions of actualperformance (Zeithaml et al., 1990).
Duff’s (2004) audit quality model, AUDITQUAL, consists of nine factors labeledreputation, capability, assurance[1], independence, expertise, experience, responsiveness,empathy, and non-audit services. The model represents a synthesis of the audit qualityliterature, summarized in Table I, and the extant service quality literature.
Specifically, AUDITQUAL categorizes audit quality into two elements: technicalqualities and service qualities. Technical qualities relate to the two factors identifiedin DeAngelo’s (1981) definition of audit quality, i.e. competence and objectivity.As competence and objectivity are not easy to observe a number of dimensions relatingto these issues are developed. These are reputation of the firm, capability of the AEPand audit team, experience of the AEP/audit team, expertise, independence, and abilityof the firm to provide non-audit services. Service qualities adopt qualities relating tothe five dimensions of the commonly applied SERVQUAL approach. Similar to theapproach used by other researchers these dimensions are assessed by reference tofactors relating to the audit firm, the engagement partner, and the audit team. The ninedimensions of audit quality tapped by AUDITQUAL, along with definitions andsample scale items are presented in Table II.
For the purposes of this paper, a competing model is tested. This consists of fourhigher-order factors labeled competence, independence, relationship, and servicequalities. Specifically, the competing model delineates the original technical qualitiesfactor using the DeAngelo (1981) definition of competence and independence, andidentifies those components that relate to the technical relationship the AEP and theaudit team has with the auditee (Beattie and Fearnley, 1995; Behn et al., 1997; Carcelloet al., 1992). Competence consists of the dimensions of reputation, capability, andassurance that relate to perceptions of the auditor to detect errors. Independence isconceptualized as a uni-dimensional factor. The third factor is labeled relationship, andconsists of two dimensions: expertise and experience. The conceptual frameworksurrounding the AUDITQUAL model sees these dimensions as technical qualities.
The fourth factor includes the three dimensions of empathy, responsiveness, andnon-audit services. These were included within the services qualities higher-orderfactor of the original AUDITQUAL model. Consequently, factor IV retains the labelservice qualities. The revised four-factor model represents a refinement on the originaltwo-factor model based on technical and service quality, with explicit recognition beinggiven for independence and the often-unobserved nature of the relationship.Conceptually each of the nine dimensions and four factors are distinct. However,this is not to suggest the four factors are orthogonal, i.e. uncorrelated. A review of theliterature identifies some ambiguities, with issues of independence, competence, and
MAJ24,5
404
the relationship audit stakeholders have often combined. To assess whether theAUDITQUAL constructs are empirically distinct, a uni-dimensional, one-factor modelis tested for comparison purposes. The hypothesis presented below considers therelative fit of the three hypothesized models:
H1. The data fit to the revised four-factor model is superior to both the originaltwo-factor model of Duff (2004) and a one-factor model.
Following the psychometric examination of AUDITQUAL undertaken in H1, it isnecessary to evaluate the appropriateness of AUDITQUAL across stakeholder groups(i.e. cross-stakeholder invariance). In a recent review of the literature consideringmeasurement invariance in organizational research, Vandenberg and Lance (2000, p. 6)identify: “violation of measurement equivalence assumptions are as threatening tosubstantive interpretations as is an inability to demonstrate reliability and validity”.Therefore, a lack of equivalence between samples indicates the measure does notfunction in a similar way across the samples, and substantive comparison of thesamples is severely lacking (Horn and McArdle, 1992). As a specific aim of this paper isto consider the comparability of the three stakeholders groups’ views on audit quality,an application of measurement equivalence (invariance) is essential. Consequently,the following hypotheses are tested:
H2a. AUDITQUAL scores are invariant between the three groups in 2002.
Dimension Definition Item
Reputation The standing the auditor enjoys in themarket as a reputational intermediary
“The audit firm operates to the higheststandards of integrity”
Capability The ability of the auditor to conduct thework
“The engagement partner has highethical standards”
Assurance Those processes the auditor has in placeto assure a high quality audit
“The engagement partner arrangesregular meetings with the client’s keystaff to identify issues of concern”
Independence The objectivity and willingness of theauditor to report any breach in theclient’s accounting system
“The audit fee paid by the client does notrepresent more than 10% of the totalaudit fees controlled by the AEP”
Expertise Possession of relevant specialistknowledge by the auditor
“The audit firm undertakes research intothe client’s industry”
Experience The experience the auditor has with theauditee
“The engagement partner has beenperforming the audit for the past threeyears”
Empathy The degree of understanding the auditorhas with the challenges the auditee faces
“The engagement partner is pro-activeand contributory (e.g. suggests potentialacquisition targets)”
Responsiveness The ability of the auditor to tailor theirservice to auditee needs
“The audit firm is willing to be flexiblewhen scheduling the timing of auditvisits”
Non-auditservices
The ability of the auditor to be able tooffer other accounting-related services
“The audit firm is able to supplyadditional tax services”
Source: Duff (2004, p. 78)
Table II.Examples of items used
in AUDITQUAL
Measuring auditquality in an era
of change
405
H2b. AUDITQUAL scores are invariant between the three groups in 2005.
H2c. AUDITQUAL scores are invariant between the 2002 and 2005 samples.
Having assessed cross-stakeholder invariance and measurement equivalence acrosstime, an examination of potential differences across groups with respect to actualscores on the dimensions (as opposed to latent factors) is possible.
Changes to UK audit market between 2002 and 2005The Enron bankruptcy in November 2001 was swiftly followed by the demise of itsprincipal auditor Andersen. These events, in combination with other well-publicizedcorporate accounting scandals in the USA provided evidence of the failure of theregulatory framework for financial reporting in the USA, and created concerns aboutauditor independence. Some commentators were of the view that commercialization ofaccounting services were at the root of the problem (Pierce, 2007). Others focused onthe problems created by a profession that had changed from a skeptical gatekeeperconcerned with reducing agency conflicts to that of optimistic informationprofessional, skilled in assisting corporate management to investors (Coffee, 2006).
The widespread reporting and global concern about these events stimulateddemand for a review of the UK regulatory framework for financial reporting, with theCGAA (2003) established by the Government in 2002. Auditor independence was a keyissue for the CGAA’s review. The majority of the CGAA’s recommendations toimprove independence in fact and appearance were accepted, with the AIU establishedto monitor the quality of the auditing function within economically significant entities.The AIU operates under the auspices of the new POB for accountancy[2], within anintegrated independent regulator: the FRC. AIU’s inspection visits to audit firmscommenced in 2004/2005, focusing of the big four firms and the audits of larger listedcompanies. In 2005/2006 coverage extended to audits of firms outside the FinancialTimes and London Stock Exchange (FTSE) 350, and in 2006/2007 a number of smalleraudit firms have been subject to scrutiny, completing implementation for CGAA’spost-Enron review of the regulation of the accountancy profession. The AIU’s2007/2008 work-plan includes unquoted companies, and not-for-profit organizationssuch as charities and building societies. The monitoring approach incorporates “wideranging reviews of firm-wide procedures, including an assessment of how culturewithin firms impacts on audit quality” (FRC, 2007).
The main standard setting body for auditing, the APB, was established within theFRC structure. The APB is independent of the profession and was made responsible forethical as well as practice standards. APB issued its first ethical guidelines inDecember 2004. Other recent changes to the UK audit environment include theEuropean 8th Directive on Statutory Audit introduced by the European Parliament in2006 to strengthen the regulation of audit within member states (FRC, 2006).
However, recent research suggests the impact of the AIU’s work within theinvestment community is limited. Percy (2007) reports interviews undertaken with60 investors and 40 analysts identify that only 20 percent of investment analysts hadheard of the AIU, with 85 percent admitting to knowing “little” or “nothing” about theregulation of auditors in the UK.
Developments have also occurred in the broader system of corporate governancerelevant to auditing. The Smith Guidelines on the role and activities of audit
MAJ24,5
406
committees were published in 2003 to clarify the role and responsibilities of auditcommittees and to develop the existing combined code guidance (FRC, 2003), makingspecific recommendations regarding the composition and role of audit committees.
In the light of the Andersen collapse, attention has focused on the consequences ofthe high market concentration enjoyed by the big four, as the consequences of therebeing just three major auditors. In a report for the Department of Trade and Industryand FRC, Oxera (2006) conclude that for FTSE 350 companies, there is evidence ofrestricted choice and higher prices, coupled with significant entry barriers for mid-tierfirms. Oxera (2006, p. i) suggest “the loss of another big four firm (four-to-three) wouldexacerbate problems around auditor choice, requiring regulators to make exceptions toauditor independence rules”.
At the same time, changes have occurred in the market place for accountingservices, with nine of the ten largest firms in the UK having converted to an LLPstructure or operating as a limited company, compared to just five firms in 2003(Fisher, 2004, 2005). Income from statutory fee income has continued to be stagnant inthe twenty-first century (Fisher, 2005). At the same time, the ratio of non-audit incometo audit services income earned by big four firms from FTSE 100[3] clients has fallendramatically from 3:1 in 2002 to 1.3:1 in 2004 (Fisher, 2004). This downturn innon-audit fee income reflects a decision by most firms to sell off their consultancyarms, and an awareness among audit clients that paying for non-audit services maysignal a reduction in auditor independence (Fisher, 2004)[4]: a view opposed by the bigfour (Nixon, 2004), and by economic audit theory (Arrunada, 1999). Empirical researchis more mixed in its assessment of non-audit services (Beattie and Fearnley, 2004;Frankel et al., 2002; Francis, 2004; Reynolds et al., 2004).
To summarize, the audit market in the period 2002-2005 has seen significantchange. The increased public oversight, interest in audit quality, and the reduction ofpromotion of non-audit services to audit clients suggests that audit stakeholderswill rate those technical qualities (i.e. competence, independence, and relationship)higher in 2005 than 2002. Based on the above discussion, the following hypothesis isstated:
H3a. Mean scores on technical qualities will increase for the three stakeholdergroups over the period from 2002 to 2005.
As a result of recent regulatory efforts, issues of service quality have been confined toprofessional journals rather than the subject of academic or regulatory-sponsoredresearch, perhaps reflecting fears that auditors may place commercial interest beforeprofessional integrity (Boyd, 2004; Pierce, 2007). To summarize, given the relativeattention to issues relating to technical audit quality features, stakeholders areexpected to rate service qualities lower in 2005 than 2002.
However, to compensate for the loss of consulting services, firms have developednew “service lines” such as risk advisory work, private equity work, and corporatefinance (Fisher, 2005). Furthermore, an analysis of the big four’s annual reviews in theperiod 2003-2005 identifies firms continue to promote the concept of “client service”as central to the provision of audit and related services (Duff, 2008). Therefore, servicequality issues seem to have endured as “core values” of auditors as professional servicefirms (Hanney, 2006). The following hypothesis is stated:
H3b. Mean scores on service qualities will not change for the three stakeholdergroups over the period from 2002 to 2005.
Measuring auditquality in an era
of change
407
MethodsSample selection and construction of mailing listThe sampling frame identified for this research uses an identical sampling frame toDuff (2004) for comparison purposes. Duff (2004) sampled UK AEPs (auditors), UKCFOs (auditees), and fund managers in the UK (investors), administering theAUDITQUAL inventory in February 2002. AEPs and CFOs are seen as the mostappropriate individuals to assess issues relating to audit quality the AEP and CFOrepresent the two most important parties in the relationship between the auditor andaudit client (Beattie et al., 2000)[5]. Fund managers are chosen to proxy for the widercommunity of investors, who maintain an agency relationship with the auditor. Asrelatively sophisticated investors, fund managers are likely to possess someknowledge of the function and process of audit.
In the present research, the auditor sample is drawn from the population of the 20largest firms in the UK, as defined by the accountancy age 2004 survey. AEPs (750)[6]were drawn at random from the Institute of Chartered Accountants in England andWales (ICAEW) Member Firms’ Directory 2004[7]. The auditee sample is drawn fromthe population of 2,011 UK companies listed on the London Stock Exchange, asreported in the Thompson Financial Global Access company database (December2004). This data set also contained addresses and the name of either the CFO or (in theabsence of this information) the company secretary. A systematic sample of 750 wasdrawn from this list. The investor sample is from the population of 1,550 fundmanagers based in the UK, as reported in the Caritas Data European Fund Managersdatabase. Fund managers (750) were chosen at random. Descriptive statistics about thecomposition of the samples is identified in Table III.
Research materials and AUDITQUAL inventory administration proceduresAn identical AUDITQUAL questionnaire as used by Duff (2004)[8] was mailed to thethree samples in February 2005: three years after Duff’s (2004) administration[9].The inventory used closed-form questions and contained five sections. The first sectionelicited the importance of 24 items relating to the audit firm using a five-point Likertscale with verbal anchors. The 16 items in the second section also use a five-pointLikert scale with verbal anchors and relate to engagement partner factors. The thirdsection contained 15 questions relating to audit team factors, employing a five-pointLikert scale with verbal anchors. The fourth section consisted on an open-endedquestion asking respondents for any other comments they may wish to make aboutaudit quality. The final section contained general questions, relating to thedemographics of the respondent.
The questionnaire was accompanied by an explanatory covering letter assuringthe confidentiality of responses. A post-paid return envelope was also provided.A reminder letter was sent out after 21 days. Finally, respondents were given the option ofreceiving a summary report of the results of the investigation as an incentive to respond.
Data analysisThe process of creating the revised four-factor AUDITQUAL model proceeds in fourparts. First, internal consistency reliability estimates – using coefficient a – arecalculated for the combined sample using the 52 variables[10] within the Duff (2004)AUDITQUAL model. Second, a confirmatory factor analysis (CFA) of a simple
MAJ24,5
408
Auditor Auditee investor2002 2005 2002 2005 2002 2005n (%) n (%) n (%) n (%) n (%) n (%)
Non-audit services as percentage of total fees paid to auditor0 3 4 10 8,25 22 29 32 2625-50 22 29 40 33.50 28 38 39 32Total 75 100 121 100
Panel D: individual characteristics of investorsExperience of audit workNo experience 9 12 5 5An understanding of audit work 28 37 41 38Significant, have worked as auditor 39 51 62 57Missing 3Total 76 100 111 100
Table III.Descriptive statistics
Measuring auditquality in an era
of change
409
nine-factor model is undertaken to calculate the standardized factor loadings andsquared multiple correlation of each item. Third, the short-form inventory is created bya joint process of:
. selecting those items with standardized factor loadings on each dimensionexceeding 0.4, with a maximum of four items per scale; and
. conducting an item attrition exercise using internal consistency reliabilityanalysis[11].
Fourth, the scales undergo a qualitative examination to ensure the scales still possesscontent validity, i.e. still usefully describe the attribute they intend to measure.
To test H1, both the original two-factor AUDITQUAL model and the four-factorrevision are subject to a CFA using AMOS (Arbuckle, 2003) to determine the quality ofthe overall fit. Maximum likelihood estimation via AMOS v5.0 was used to conductCFA using the covariance matrices of the scaled scores by group and time ofadministration. To evaluate the fit of the measurement models, the standardized rootmean square residual is used in tandem with the root mean square error ofapproximation (RMSEA) as recommended by Hu and Bentler (1999) and MacCallumand Austin (2001)[12,13]. Statistical significance testing is undertaken (a ¼ 0.05).
To test H2a, H2b, and H2c a multi-group CFA model (Joreskog, 1971) is used.Specifically, three models are tested representing metric invariance. Model 1 tests theequivalence of the three stakeholder groups in 2002, using the same measurement model asused in H1, but with additional constraints placed on parameters, i.e. factor pattern matrixcoefficients for like items are constrained to be equal across the groups. Therefore, Model 1provides a test of metric invariance. If Model 1 is not supported, the interpretation is thatgroups differ in terms of the extent to which items are seen as indicative of the variousdimensions. That is, the measure is not equivalent across groups. Model 2 is similar toModel 1, but tests the equivalence of the three groups in 2005. Finally, if Models 1 and 2 aresupported, a third model is tested. Model 3 treats the three groups as coming from onestakeholder population, and tests the equivalence of stakeholder views in 2002 and 2005.
To test H3a and H3b, changes in mean scores from 2002 to 2005 are assessed usingmultivariate analysis of variance (MANOVA). The nine AUDITQUAL dimensions aretreated as dependent variables; time of administration (2002 and 2005) and group(auditors, auditees, and investors) are coded as fixed factors. If the multivariatestatistics[14] are found to be statistically significant, univariate statistics are examinedto establish where the differences are found. Similarly MANOVA is undertaken on thehigher-order factors to assess differences at a summary level.
The analytic methods employed (CFA, assessment of factorial invariance, andMANOVA) allows the multiple testing of competing models. This approach allows anevaluation of the relationships between the hypothesized dimensions of audit qualityand an assessment of differences between three key participants in the audit servicesmarket: auditors, auditees, and investors, at two points in time: 2002 and 2005.
Results and analysisNon-response biasFrom the total auditor sample of 750, 183 useable responses were received, representinga response rate of 24 percent. From the total auditee sample of 750, 121 useable replieswere received representing a response rate of 16 percent. From the total investor sampleof 750, 111 useable replies were received representing a response rate of 15 percent.
MAJ24,5
410
The response rates are broadly comparable with Duff (2004) – Table IV. Although theresponse rate may appear relatively low, considering the questionnaire length, thesomewhat unorthodox nature of the subject within the accounting field and the fact thatmarketing-related studies usually achieve a response rate of between 10 and 30 percent(Green et al., 1988), the response rate is acceptable for a postal survey of this nature.
To tests for response rate bias on both 2002 and 2005 samples a comparison was appliedto early (first 33 percent) and late (last 33 percent) of respondents in 2002 and 2005 samplesusing the Wilcoxon-Mann-Whitney non-parametric test. This assumes late respondents aresimilar to non-respondents (Dillman, 1978). No statistically significant differences werefound across the nine AUDITQUAL dimensions between the two groups in auditor, auditeeor investor samples in either 2002 or 2005 (a ¼ 0.05). Although the limitations of such testsare well-known (Wallace and Mellor, 1988), it is unlikely that response bias will challenge thevalidity of the results of the present investigation (Table III).
An additional factor that may affect the validity of questionnaire research is thesuitability of individual respondents. In the present investigation, respondents neededto be knowledgeable of audit practices, and involved in decisions about the auditprocess at a senior level. In the case of the auditee sample all respondents were the CFOof the company. Considering the auditor sample, all respondents were AEPs in theaudit firm. The investor sample exclusively comprised fund managers. Evidently, allrespondents are senior individuals who are personally involved in the audit process. Itis concluded the risk of uninformed respondent bias is minimal.
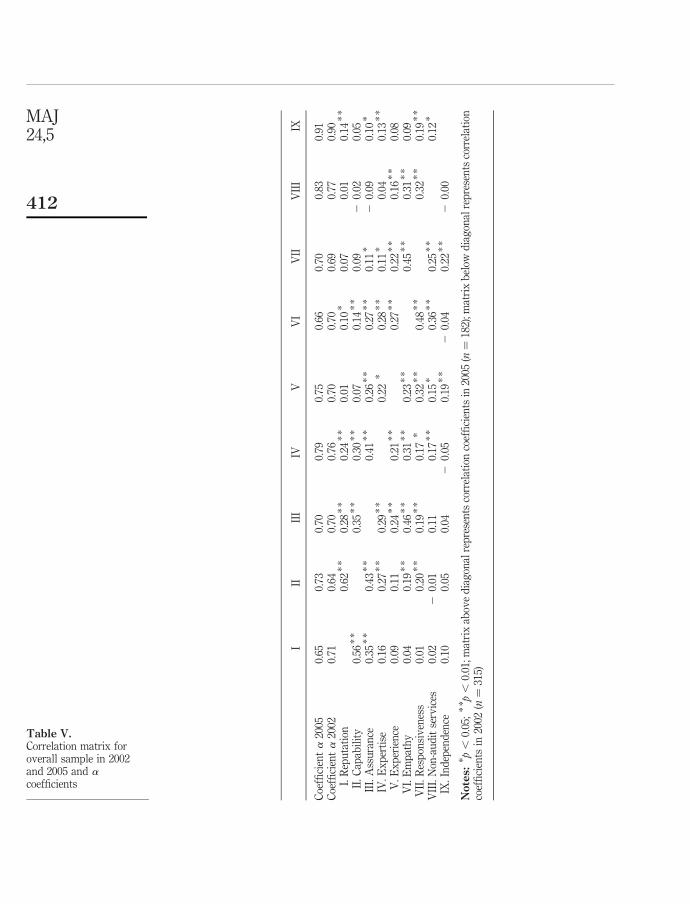
Hypothesis testingTable V reports the correlation matrix for the nine dimensions along with internalconsistency reliability estimates. Seven of the nine a coefficients exceed 0.7, a widelycited and conservative threshold (Nunnally and Bernstein, 1994); the other two exceed0.64, which is satisfactory for scales with as few as four items (Hinkin, 1995)[15].In sum, the instrument yields scores of satisfactory internal consistency reliability.
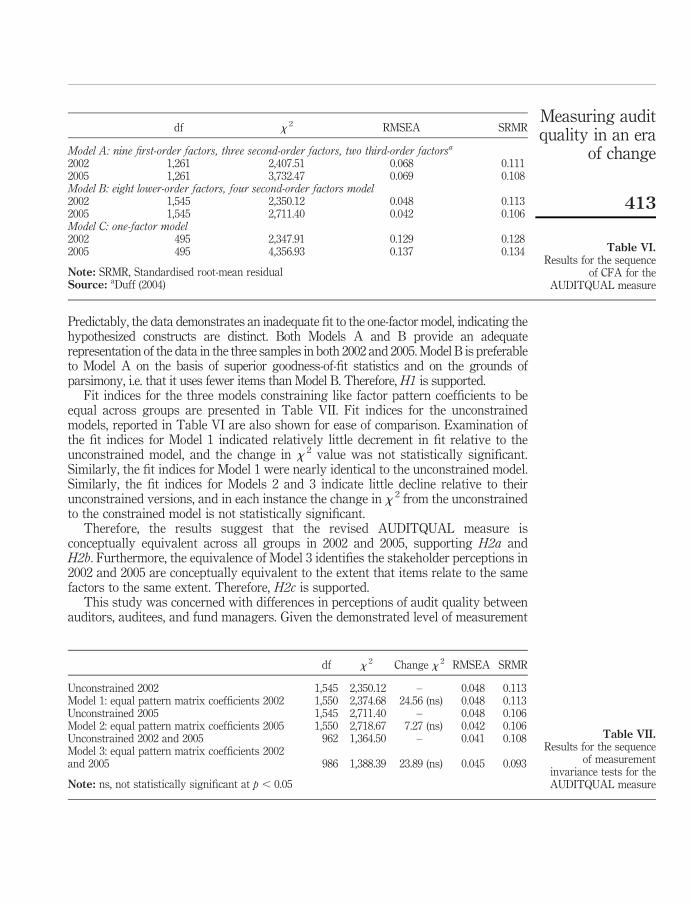
To establish the structure of the short-form AUDITQUAL model the data for thecombined samples were examined by means of CFA to test competing models. Table VIpresents data for three competing models. Model A consists of the original ninelower-order factor and two higher-order factor model identified by Duff (2004). Thesecond model tested (Model B) is the 36-item revision of the Duff (2004) model,consisting of eight lower-order factors and four higher-order factors, developed usingthe procedures described earlier. Model C is a one-factor model tested for comparisonpurposes.
Table V.Correlation matrix foroverall sample in 2002and 2005 and acoefficients
MAJ24,5
412
Predictably, the data demonstrates an inadequate fit to the one-factor model, indicating thehypothesized constructs are distinct. Both Models A and B provide an adequaterepresentation of the data in the three samples in both 2002 and 2005. Model B is preferableto Model A on the basis of superior goodness-of-fit statistics and on the grounds ofparsimony, i.e. that it uses fewer items than Model B. Therefore, H1 is supported.
Fit indices for the three models constraining like factor pattern coefficients to beequal across groups are presented in Table VII. Fit indices for the unconstrainedmodels, reported in Table VI are also shown for ease of comparison. Examination ofthe fit indices for Model 1 indicated relatively little decrement in fit relative to theunconstrained model, and the change in x 2 value was not statistically significant.Similarly, the fit indices for Model 1 were nearly identical to the unconstrained model.Similarly, the fit indices for Models 2 and 3 indicate little decline relative to theirunconstrained versions, and in each instance the change in x 2 from the unconstrainedto the constrained model is not statistically significant.
Therefore, the results suggest that the revised AUDITQUAL measure isconceptually equivalent across all groups in 2002 and 2005, supporting H2a andH2b. Furthermore, the equivalence of Model 3 identifies the stakeholder perceptions in2002 and 2005 are conceptually equivalent to the extent that items relate to the samefactors to the same extent. Therefore, H2c is supported.
This study was concerned with differences in perceptions of audit quality betweenauditors, auditees, and fund managers. Given the demonstrated level of measurement
df x 2 RMSEA SRMR
Model A: nine first-order factors, three second-order factors, two third-order factorsa
Note: ns, not statistically significant at p , 0.05
Table VII.Results for the sequence
of measurementinvariance tests for theAUDITQUAL measure
Measuring auditquality in an era
of change
413
equivalence between the auditor, auditee, and investor groups in 2002 and 2005,differences across groups with respect to the actual scores on the dimension scales (asopposed to latent factors) are examined.
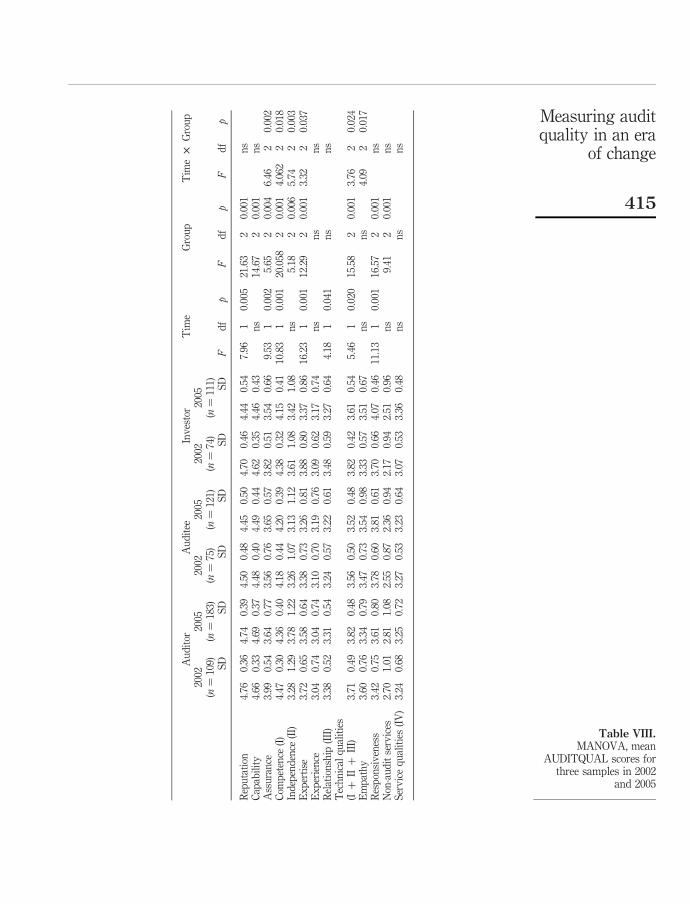
The results of a MANOVA first, on the nine AUDITQUAL dimensions, and second,on just the four higher-order factors, confirmed a statistically significant overalldifference in means attributable to group and time[16]. A closer study of the univariatecases for both analyses is thus justified (Table VIII). Statistically significantinter-group differences were identified, for seven (of nine) dimensions. By contrast,statistically significant differences attributable to time of administration wereidentified for just four of the nine dimensions. Statistically significant interactionsbetween time and group were observed for five of the dimensions. Collectively, theseresults suggest that perceptions of audit quality tend to be more attributable tostakeholder group, rather than to changes in the audit environment over the three-yearperiod subsequent to the Enron/Andersen collapse.
Considering these differences in terms of the four higher-order factors, Competence isstatistically significantly differentiated between the three groups, across the two timetrials, with a statistically significant interaction between time and group. Mean scores oncompetence decline over the three-year period for auditors and investors, while auditees’ratings increase slightly, explaining the interaction between group and time.
A statistically significant effect of group is noted for the independence factor. Theinvestor group consistently provides the highest rating for independence of the threegroups. Although no statistically significant time effect is identified, a statisticallysignificant interaction between group and time is reported. This finding reflects anincrease in auditors’ ratings of the independence factor from 2002 to almost the samelevel as the investor group. In 2002, the auditor group ascribed the lowest value toindependence of the three parties. By contrast, auditees’ and investors’ ratings ofindependence decreased over the three-year period.
Considering the relationship factor the effect of time is statistically significant. The timeeffect is attributable to the decline in scale scores from 2002 to 2005 for all three groups.
When a MANOVA is performed on the (new) technical qualities dimension andservice qualities as dependent variables, a statistically significant effect of time, group,and time-group interaction are identified. Aggregate scores for technical qualitiesdecline from 2002 to 2005. Consequently, H3a is not supported.
The analysis of the MANOVA results for the service qualities factor reveals nostatistically significant effect of group or time. Therefore, H3b is supported.
DiscussionThis study was concerned with:
. testing two hypothesized models of audit quality administering theAUDITQUAL instrument to samples of auditors, auditees, and investors, in2002 and 2005;
. to establish the measurement equivalence of AUDITQUAL across the threegroups; and
. the analysis of mean score across the three groups and two time periods.
The related hypotheses and test results are summarized in Table IX.
MAJ24,5
414
Au
dit
orA
ud
itee
Inv
esto
rT
ime
Gro
up
Tim
e£
Gro
up
2002
(n¼
109)
2005
(n¼
183)
2002
(n¼
75)
2005
(n¼
121)
2002
(n¼
74)
2005
(n¼
111)
SD
SD
SD
SD
SD
SD
Fd
fp
Fd
fp
Fd
fp
Rep
uta
tion
4.76
0.36
4.74
0.39
4.50
0.48
4.45
0.50
4.70
0.46
4.44
0.54
7.96
10.
005
21.6
32
0.00
1n
sC
apab
ilit
y4.
660.
334.
690.
374.
480.
404.
490.
444.
620.
354.
460.
43n
s14
.67
20.
001
ns
Ass
ura
nce
3.99
0.54
3.64
0.77
3.56
0.76
3.65
0.57
3.82
0.51
3.54
0.66
9.53
10.
002
5.65
20.
004
6.46
20.
002
Com
pet
ence
(I)
4.47
0.30
4.36
0.40
4.18
0.44
4.20
0.39
4.38
0.32
4.15
0.41
10.8
31
0.00
120
.058
20.
001
4.06
22
0.01
8In
dep
end
ence
(II)
3.28
1.29
3.78
1.22
3.26
1.07
3.13
1.12
3.61
1.08
3.42
1.08
ns
5.18
20.
006
5.74
20.
003
Ex
per
tise
3.72
0.65
3.58
0.64
3.38
0.73
3.26
0.81
3.88
0.80
3.37
0.86
16.2
31
0.00
112
.29
20.
001
3.32
20.
037
Ex
per
ien
ce3.
040.
743.
040.
743.
100.
703.
190.
763.
090.
623.
170.
74n
sn
sn
sR
elat
ion
ship
(III
)3.
380.
523.
310.
543.
240.
573.
220.
613.
480.
593.
270.
644.
181
0.04
1n
sn
sT
ech
nic
alq
ual
itie
s(I
þII
þII
I)3.
710.
493.
820.
483.
560.
503.
520.
483.
820.
423.
610.
545.
461
0.02
015
.58
20.
001
3.76
20.
024
Em
pat
hy
3.60
0.76
3.34
0.79
3.47
0.73
3.54
0.98
3.33
0.57
3.51
0.67
ns
ns
4.09
20.
017
Res
pon
siv
enes
s3.
420.
753.
610.
803.
780.
603.
810.
613.
700.
664.
070.
4611
.13
10.
001
16.5
72
0.00
1n
sN
on-a
ud
itse
rvic
es2.
701.
012.
811.
082.
550.
872.
360.
942.
170.
942.
510.
96n
s9.
412
0.00
1n
sS
erv
ice
qu
alit
ies
(IV
)3.
240.
683.
250.
723.
270.
533.
230.
643.
070.
533.
360.
48n
sn
sn
s
Table VIII.MANOVA, mean
AUDITQUAL scores forthree samples in 2002
and 2005
Measuring auditquality in an era
of change
415
The original AUDITQUAL model of two higher-order factors, with nine dimensions,was compared to an alternative model defined by four higher-order factors: competence(reputation, capability, assurance); the uni-dimensional construct of independence,relationship (expertise and experience), and service qualities (empathy, non-auditservices, responsiveness). CFA identified the alternative four-factor model providedbetter fit to the data. Invariance testing identified the measurement equivalence ofAUDITQUAL across the three groups and two time trials.
Two further H3a and H3b were tested using MANOVA on AUDITQUAL scoresconcerning stakeholder perceptions in 2002 and 2005. Contrary to expectations, meanscores on technical qualities (competence, independence, and relationship) decreasedover from 2002 to 2005. By contrast, scores on service qualities remained at the samelevel in 2005 as 2002 as predicted.
It is interesting that in a period where the auditing has undergone possiblyunparalleled scrutiny from wide range of stakeholders, that auditors’, auditees’, andinvestors’ ratings tend to decrease from 2002 to 2005 on the traditional “technical”attributes of auditing encapsulated in the competence, relationship, and independencefactors. Over the same time period, these three parties’ ratings of service qualitiesincreases. Both these findings are counter-intuitive. There are two possible reasons forthis finding. First, as the 2002 administration of AUDITQUAL was concurrent with theEnron/Andersen failure, respondents’ higher ratings of technical-related factors mayhave reflected the financial community’s shock at the failure of the regulatory regimeand the unprecedented downfall of a (then) big five auditor, Arthur Andersen. Second,the increases in service quality may reflect the greater marketing-orientation of modernaudit firms, and consequent increase in audit expectations from auditees and investors.Third, it is possible that stakeholder groups feel more comfortable that audit quality isbeing maintained as a consequence of greater regulatory efforts, implementedsubsequent to the 2002 administration of the inventory.
It is perhaps surprising that auditors rated the importance of competence higherthan both auditees and investors. The reputation and technical expertise of theauditor should allow the auditor to obtain a higher remuneration for their services,
Hypothesis Description Result
H1 The data fit to the revised four-factor model is superior toboth the original two-factor model of Duff (2004) and aone-factor model
Supported
H2a AUDITQUAL scores are invariant between the threegroups in 2002
Supported
H2b AUDITQUAL scores are invariant between the threegroups in 2005
Supported
H2c AUDITQUAL scores are invariant between the 2002 and2005 samples
Supported
H3a Mean scores on technical qualities will increase for the threestakeholder groups over the period from 2002 to 2005
Not supported
H3b Mean scores on service qualities will not change for thethree stakeholder groups over the period from 2002 to 2005
SupportedTable IX.Summary of resultsof hypothesis testing
MAJ24,5
416
the employment of a credible auditor signals management’s quality and integrity(Dopuch and Simunic, 1980, 1982). Consequently, all groups might be expected to valuecompetence equally highly. This observed difference may be explained by audit clientstaking competence for granted, while auditors are bound by legal, professional, andregulatory constraints that require them to continue to emphasize these aspects ofaudit services. It goes without saying that the “real” customer, external stakeholders,rely on the auditor to maintain these technical features of audit quality.
ConclusionThe paper presents evidence of the construct validity and measurement equivalence ofa measure of audit quality over two time periods and utilizing three samples. Thestudy assesses stakeholder attitudes at a time when the UK audit environment hasundergone significant change between the 2002 and 2005 administrations of theinstrument. It is concluded that stakeholders in audit markets consistently viewcompetence, service quality, relationship, and independence as related and part of alarger construct of audit quality.
Beyond the psychometric analysis, the study records two findings that appearcounter-intuitive. First, auditors and auditees perceive service qualities as no moreimportant than investors. This is surprising as service features of the audit processare largely invisible to investors, indicating that all stakeholders see servicequalities as integral to the audit process. Second, respondents rated the technicalqualities lower in 2005 than in 2002. This finding contradicts those commentators whospeculate that the downfall of (then) big five auditor Andersen, and the consequentfallout in the audit market is an antecedent of present levels of investor discomfortwith commercialism in auditing (Pierce, 2007). It is plausible that 2002 technicalqualities ratings were artificially inflated by public disgust at the Enron/Andersendebacle, and a perceived need for the accounting profession to “come out of theshadows” (Amernic and Craig, 2004). However, three years after the Enron debacle, itis concluded audit stakeholders take a more holistic view of what the company auditis about.
Notes
1. Assurance was labelled as client service in the original AUDITQUAL scale.
2. POB for accountancy is now known as the POB, reflecting the board’s oversight of theactuarial profession since 2006.
3. FTSE 100 companies represent the UK’s largest companies and are audited exclusively bythe big four.
4. Audit clients seeking non-audit advice may of course simply contract with a big four firmother than their current auditor without disclosure.
5. Audit committee chairs could have been a viable alternative to sampling CFOs. However,extant evidence indicates audit committees tend to assume a passive rather than active role(Cohen et al., 2002; Turley and Zaman, 2004). As Spira (2003) reports a lack of extantevidence for the efficacy of audit committees, CFOs are seen as the most appropriate auditeerespondent.
6. The sample size was increased from 500 in 2002 to 750 in 2005 to increase the size of thedataset. CFA as a statistical technique benefits from larger samples.
7. Three professional bodies issue licences for auditors in the UK. However, ICAEW isconsiderably larger than both the Institute of Chartered Accountants of Scotland and the
Measuring auditquality in an era
of change
417
Association of Chartered Certified Accountants. For example, all the firms inspected by AIUin 2004/2005 were registered with ICAEW. Therefore, ICAEW audit partner lists are seen asrepresentative of AEPs in the UK.
8. The development of the instrument is described in detail in Duff (2004).
9. The author gave consideration to changing some items within the questionnaire to changesoccurring between 2002 and 2005 in the UK audit regime. However, this would prevent anymeasurement comparison between the 2002 and 2005 samples, a key objective of the presentstudy.
10. Duff (2004) identifies five (of 57) items were removed from the final model.
11. Each pruned item was subsequently offered to each of the other eight dimensions toestablish whether the item was capable of improved the homogeneity of the remainingdimensions.
12. A number of authors (Hu and Bentler, 1998, 1999; Marsh et al., 1988) warn against use ofmore common goodness-of-fit indices (GFIs) such as the GFI and adjusted GFI which arewidely used in the structural equation modelling literature.
13. Hu and Bentler (1999, p. 26) indicate for samples n , 250, the combinational ruleSRMR , 0.115 and RMSEA , 0.08 is “extremely sensitive in detecting model withmispecified factor covariances”.
14. Pillai’s trace, Wilks’ L, Hotelling’s trace, and Roy’s largest root.
15. Reducing the number of items per scale has the effect of deflating the resulting internalconsistency estimates. Consequently, the a coefficients are calculated for the short-formdimensions are not directly comparable with the a coefficients calculated for the originalAUDITQUAL scales.
16. For the test statistics, respectively, for Wilks’ L, Pilling’s trace, Hotelling’s trace, Roy’sgreatest root, all p , 0.0001).
References
Amernic, J. and Craig, R. (2004), “Reform of accounting education in the post-Enron era: movingaccounting ‘out of the shadows’”, Abacus, Vol. 40 No. 3, pp. 342-78.
Arbuckle, J.L. (2003),Amos 5.0Update to the User’s Guide, Small Waters Corporation, Chicago, IL.
Arrunada, B. (1999), The Economics of Audit Quality: Private Incentives and the Regulation ofAudit and Non-audit Services, Kluwer, Dordrecht.
Beattie, V. and Fearnley, S. (1995), “The importance of audit firm characteristics and the driversof auditor change in UK listed companies”, Accounting and Business Research, Vol. 25No. 3, pp. 227-39.
Beattie, V. and Fearnley, S. (2004), “The reform of the UK’s auditor independenceframework after the Enron collapse”, International Journal of Auditing, Vol. 8 No. 2,pp. 117-38.
Beattie, V., Fearnley, S. and Brandt, R. (2000), Behind Closed Doors: What the Company Audit IsReally About, Palgrave, Basingstoke.
Behn, B.K., Carcello, J.V., Hermanson, D.R. and Hermanson, R.H. (1997), “The determinants ofaudit client satisfaction among clients of Big 6 firms”, Accounting Horizons, Vol. 11 No. 1,pp. 7-24.
Berry, L.L., Bennett, D.R. and Brown, C.B. (1989), Service Quality – A Profit Strategy for FinancialInstitutions, Dow-Jones-Irwin, Homewood, IL.
MAJ24,5
418
Boyd, C. (2004), “The structural origins of conflicts of interest in the accounting profession”,Business Ethics Quarterly, Vol. 39 No. 4, pp. 377-98.
Carcello, J.V., Hermanson, R.H. and McGrath, N.T. (1992), “Audit quality attributes:the perceptions of audit partners, preparers, and financial statement users”, Auditing:A Journal of Practice & Theory, Vol. 11 No. 1, pp. 1-15.
Co-ordinating Group on Audit and Accounting (CGAA) (2003), Final Report to the Secretary ofState for Trade and Industry and the Chancellor of the Exchequer: URN 02/1092,Co-ordinating Group on Audit and Accounting Issues, Department for Trade and Industry,London.
Coffee, J.C. (2006), Gatekeepers: The Role of the Professions in Corporate Governance, OxfordUniversity Press, Oxford.
Cohen, J.R., Krishnamorthy, G. and Wright, A. (2002), “Corporate governance and the auditprocess”, Contemporary Accounting Research, Vol. 19, pp. 573-94.
DeAngelo, L.E. (1981), “Auditor size and audit quality”, Journal of Accounting and Economics,Vol. 3 No. 2, pp. 183-99.
Dillman, D.A. (1978),Mail and Telephone Surveys: The Total DesignMethod, Wiley, New York, NY.
Dopuch, N. and Simunic, D. (1980), “The nature of competition in the auditing profession:a descriptive and normative view”, in Buckley, J.W. and Weston, J.F. (Eds), Regulation andthe Accounting Profession, Lifetime Learning Publications, Belmont, CA.
Dopuch, N. and Simunic, D. (1982), “Competition in auditing: an assessment”, paper presented atFourth Symposium on Auditing Research, University of Illinois, Urbana, IL.
DTI (2003), Review of the Regulatory Regime of the Accountancy Profession: Report to theSecretary of State for Trade and Industry, Department of Trade and Industry, London.
Duff, A. (2004), AUDITQUAL: Dimensions of Audit Quality, Institute of Chartered Accountantsof Scotland, Edinburgh.
Duff, A. (2008), “Understanding ‘our people’: representations of people in accounting firms’annual reviews”, working paper, University of the West of Scotland, Ayr.
Elliott, R.K. (1995), “The future of assurance services: implications for academia”, AccountingHorizons, Vol. 9 No. 4, pp. 118-27.
Fisher, L. (2004), “Big four hit by 14% fall in FTSE 100 audit client fees”, Accountancy,September, pp. 31-3.
Fisher, L. (2005), “Good times return for top 60 firms”, Accountancy, July, pp. 30-2.
Francis, J. (2004), “What do we know about audit quality?”, British Accounting Review, Vol. 36No. 3, pp. 345-68.
Frankel, R.M., Johnson, M.F. and Nelson, K.K. (2002), “The relation between auditors’ fees fornon-audit services and earnings managements”, The Accounting Review, Vol. 77,Supplement, pp. 71-105.
FRC (2003), Audit Committees: Combined Code Guidance, a report and proposed guidanceby an FRC appointed group chaired by Sir Robert Smith, Financial Reporting Council,London.
Green, P., Tull, D.S. and Albaum, G. (1988), Research for Marketing Decisions, Prentice-Hall,Englewood Cliffs, NJ.
Hanney, B. (2006), “Accounting firms with ‘core values’ perform better”, Accountancy, November,available at: www.accountancymagazine.com
Measuring auditquality in an era
of change
419
Herrbach, O. (2001), “Audit quality, auditor behaviour and the psychological contract”,The European Accounting Review, Vol. 10 No. 4, pp. 787-802.
Higgs, D. (2003), Review of the Role and Effectiveness of Non-executive Directors, Department ofTrade and Industry, London.
Hinkin, T.R. (1995), “A review of scale development practices in the study of organizations”,Journal of Management, Vol. 21 No. 5, pp. 967-88.
Horn, J.L. and McArdle, J.J. (1992), “A practical and theoretical guide to measurement invariancein aging research”, Experimental Aging Research, Vol. 18, pp. 117-44.
House of Commons Treasury Committee (2002), The Financial Regulation of Public ListedCompanies: Sixth Report of Session 2002/2 Volume 1 Report and Proceedings of theCommittee, The Stationary Office, London.
Hu, L. and Bentler, P.M. (1998), “Fit indices in covariance structure modelling: sensitivity tounderparameterized model misspecification”, Psychological Methods, Vol. 3, pp. 424-53.
Hu, L. and Bentler, P.M. (1999), “Cutoff criteria for fit indexes in covariance structure analysis:conventional criteria versus new alternatives”, Structural Equation Modeling, Vol. 6,pp. 1-55.
Joreskog, K.G. (1971), “Simultaneous factor analysis in several populations”, Psychometrika,Vol. 36 No. 4, pp. 409-26.
MacCallum, R.C. and Austin, J.T. (2001), “Applications of structural equation modeling inpsychological research”, American Review of Psychology, Vol. 51 No. 1, pp. 201-26.
Marsh, H.W., Balla, J.T.R. and McDonald, R.P. (1988), “Goodness-of-fit indexesin confirmatory factor analysis: the effect of sample size”, Psychological Bulletin,Vol. 103, pp. 391-410.
Mock, T.J. and Samet, M. (1982), “A multi-attribute model for audit evaluation”, Proceedingsof the VI University of Kansas Audit Symposium, May 20-21, University ofKansas, Kansas, KS.
Moizer, P. (1997), “Auditor reputation: the international empirical evidence”, InternationalJournal of Auditing, Vol. 1 No. 1, pp. 61-74.
Moizer, P. (1998), “Company directors’ views on the performance of the 1987 big eight and the1996 big six”, working paper, Leeds University Business School, Leeds.
Nixon, A. (2004), “Big four defend non-audit earnings”, Accountancy, September, pp. 34-5.
Nunnally, J.C. and Bernstein, I. (1994), Psychometric Theory, McGraw-Hill, New York, NY.
Oxera (2006), Competition and Choice in the UK Audit Market, Oxera, Oxford.
Parasuraman, A., Zeithaml, V.A. and Berry, L. (1988), “SERVQUAL: a multi-item scale formeasuring consumer perceptions of service quality”, Journal of Retailing, Vol. 64 No. 1,pp. 12-40.
Parasuraman, A., Zeithaml, V.A. and Berry, L. (1991), “Refinement and reassessment of theSERVQUAL scale”, Journal of Retailing, Vol. 67 No. 4, pp. 420-49.
Percy, S. (2007), “Investors seek transparency over audit quality: nearly 90% want the AIU todivulge more information”, Accountancy, September, available at: www.accountancymagazine.com
Pierce, A. (2007), Ethics and the Professional Accounting Firm, Institute of CharteredAccountants of Scotland, Edinburgh.
MAJ24,5
420
Reynolds, J.K., Deis, D.R. Jr and Francis, J.R. (2004), “Professional service fees and auditorobjectivity”, Auditing: A Journal of Theory and Practice, Vol. 23 No. 1, pp. 29-52.
Sarbanes-Oxley Act (2002), 107th Congress of the United States of America, Washington, DC.
Schroeder, M.S., Solomon, I. and Vickery, D.W. (1986), “Audit quality: the perceptions of auditcommittee chairperson and audit partners”, Auditing: A Journal of Practice & Theory,Vol. 5 No. 1, pp. 86-94.
Spira, L.F. (2003), “Audit committees: begging the question?”, Corporate Governance, Vol. 1 No. 3,pp. 180-8.
Sutton, S.G. (1993), “Toward an understanding of the factors affecting the quality of the auditprocess”, Decision Sciences, Vol. 24, pp. 88-105.
Sutton, S.G. and Lampe, J.G. (1990), “Formulating a process measurement system for auditquality”, Proceedings of the 1990 University of Southern California Audit JudgementSymposium, February 19-20, Newport Beach, CA.
Turley, S. and Zaman, M. (2004), “The corporate governance effects of audit committees”, Journalof Management & Governance, Vol. 8 No. 3, pp. 305-32.
Vandenberg, R.J. and Lance, C.E. (2000), “A review and synthesis of the measurement invarianceliterature: suggestions, practices, and recommendations for organizational research”,Organizational Research Methods, Vol. 3 No. 1, pp. 4-70.
Wallace, R.S.O. and Mellor, C.J. (1988), “Non-response bias in mail accounting surveys:a pedagogical note”, British Accounting Review, Vol. 20 No. 2, pp. 131-9.
Wallace, W. (1987), “The economic role of the audit in free and regulated markets: a review”,Research in Accounting Regulation, Vol. 1, pp. 7-34.
Warming-Rasmussen, B. and Jensen, L. (1998), “Quality dimensions in external auditservices – an external user perspective”, European Accounting Review, Vol. 7 No. 1,pp. 65-82.
Watkins, A.L., Hillison, W. and Morecroft, S.E. (2004), “Audit quality: a synthesis of theory andempirical evidence”, Journal of Accounting Literature, Vol. 23, pp. 153-93.
Zeithaml, V.A., Berry, L.L. and Parasuraman, A. (1990), Delivering Quality Services – BalancingCustomer Perceptions and Expectations, The Free Press, New York, NY.
Further reading
Ahmed, Z. and Hopson, J. (1990), “A strategic plan for marketing audit services”, CPA Journal,Vol. 60 No. 1, pp. 50-7.
Andersen, P. (1999), “Client or customer”, Accountancy, March, pp. 74-5.
de Ruyter, K. and Wetzels, M. (1999), “Commitment in auditor-client relationships:antecedents and consequences”, Accounting, Organizations and Society, Vol. 24 No. 1,pp. 57-75.
Diamantopoulos, A., O’Donahue, S. and Petersen, N. (1995), “Marketing priorities andpractice within the audit profession: does formalization make a difference?”,in Winstone, W. (Ed.), Marketing for CPAs, Auditors and Tax Professionals, Hayworth,New York, NY, pp. 51-72.
Ellis, B. and Mosher, J.S. (1995), “Six P’s for four characteristics: a complete positioningstrategy for the professional services firm (CPA firm example)”, in Winstone, W. (Ed.),Marketing for CPAs, Auditors and Tax Professionals, Hayworth, New York, NY,pp. 295-312.
Measuring auditquality in an era
of change
421
Marsh, H.W. and Hau, K.-T. (1999), “Confirmatory factor analysis: strategies for small samplesizes”, in Hoyle, R. (Ed.), Statistical Strategies for Small Sample Research, Sage, ThousandOaks, CA, pp. 251-84.
Parasuraman, A., Zeithaml, V.A. and Berry, L. (1985), “A conceptual model of service quality andits implications for future research”, Journal of Marketing, Vol. 49 No. 2, pp. 41-50.
Corresponding authorAngus Duff can be contacted at: [email protected]
MAJ24,5
422
To purchase reprints of this article please e-mail: [email protected] visit our web site for further details: www.emeraldinsight.com/reprints