MBNZ Spring Report, December 2019 The information in this document is correct as of December 2019 1 Measuring Broadband New Zealand Spring Report, December 2019 In 2018, the Commerce Commission appointed SamKnows to measure New Zealand’s internet performance. The programme, called Measuring Broadband New Zealand, gives internet users in New Zealand access to SamKnows Whiteboxes to measure the quality of their fixed-line internet. The aim of the programme is to increase transparency about actual in-home broadband performance and provide consumers with independent information about internet performance across different providers, plans, and technologies, to help them choose the best broadband for their homes. It will also encourage providers to improve and compete on their performance. This report provides an overview of the findings from data collected during September and October 2019.
Transcript
MBNZ Spring Report, December 2019 The information in this document is correct as of December 20191
Measuring Broadband New ZealandSpring Report, December 2019
In 2018, the Commerce Commission appointed SamKnows to
measure New Zealand’s internet performance. The
programme, called Measuring Broadband New Zealand, gives
internet users in New Zealand access to SamKnows
Whiteboxes to measure the quality of their fixed-line internet.
The aim of the programme is to increase transparency about
actual in-home broadband performance and provide
consumers with independent information about internet
performance across different providers, plans, and
technologies, to help them choose the best broadband for
their homes. It will also encourage providers to improve and
compete on their performance. This report provides an
overview of the findings from data collected during
September and October 2019.
MBNZ Spring Report, December 2019 The information in this document is correct as of December 20192
Overview15th September - 14th October 2019
This report presents key indicators of consumer internet performance in New Zealand. Some of the highlights of this report include:
1. A comparison of Fibre 100 package performance across RSPs. 2. An appraisal of high speed Fibre Max* packages. 3. Analysis of internet performance during the Rugby World Cup 2019 broadcasts. 4. Comparison of speeds across different regions of New Zealand.
SamKnows and the Commerce Commission are keen to publish more detailed information about a range of topics in following reports. The next report is anticipated early next year, and we aim to include:
1. More performance comparisons between providers. 2. More comparisons between different areas of New Zealand. 3. A breakdown of results by all technologies available.
This report is based on data from 969 Whiteboxes. In order to make performance comparisons we need to make sure we have enough volunteers with Whiteboxes on our panel. We still have lots to send out and we are particularly interested in finding people on these packages:
Gigantic Fibre Gigantic Fibre Max UltraFast HFC Max
We’d also really like to find people in Christchurch, Hamilton, and all rural areas, to make sure that our measurements include a wide range of Kiwis.
So if you want to help please sign up here: www.measuringbroadbandnewzealand.com to take part!
The Measuring Broadband New Zealand project has a code of conduct, the purpose of which is to ensure that parties involved in the MBNZ programme act in good faith and in accordance with principles relating to data validation, ‘gaming’ of results, and appropriate public usage of the MBNZ results. A list of signatories is included in the code, including the Commission and SamKnows. All tested RSPs complied with the code of conduct, including validation of data for this report. You can see the code of conduct on our website:
*All references to Fibre Max in this report encompass packages derived from ‘gigabit’ wholesale products, in particular: 2 Degrees’ Ultimate, MyRepublic’s Fibre Pro/Gamer Pro, Orcon and Slingshot’s Gigantic Fibre, Spark’s Fibre Max, Trustpower’s Fibre Max, and Vodafone’s Fibre Max packages.
MBNZ Spring Report, December 2019 The information in this document is correct as of December 20193
What’s nextThis is the third of many reports which will be released by the MBNZ project and will track improvements in internet performance over time. In future reports, we will aim to include results for Cable, and to break results down by provider for more products.
Please participate by volunteering to receive a Whitebox. The more volunteers we have, the more information we can provide to consumers in New Zealand in future reports.
Sign up at
www.measuringbroadband
newzealand.com
Executive Summary
ADSL Remains suitable for traditional web browsing and basic video streaming (though not Ultra High Definition) for single-user households.
Fixed Wireless (4G) Offers higher download speeds than ADSL. However, due to the cellular technology used to deliver these services, latency is especially high; many Fixed Wireless connections will experience issues with latency-sensitive applications such as video calls and gaming.
VDSL Is able to support more intensive internet usage for single-user households although, due to the technology underlying these products, performance will be inherently less stable than Fibre. Households with multiple user should consider Fibre, if available, for the most reliable performance.
Fibre 100 Is able to support Ultra High Definition streaming and other intensive internet applications, such as online gaming, for multi-user households. All major RSPs offer a reliable service which will accommodate the demands of most heavy users. In general the performance of these products appears to be stable across the country.
Fibre Max Provides higher raw speeds than Fibre 100, but this will have no effect on most applications. Consumers should have a specific reason and intended application (for example multiple users simultaneously accessing internationally-hosted streaming services) before opting for Fibre Max.
RSPs advertise their Fibre Max packages at different speeds, and the actual performance of Fibre Max connections can vary substantially from household to household. The Fair Trading Act 1986 requires RSPs to be able to substantiate any speed claim which is advertised for Fibre Max. These packages would be more predictable for consumers if advertised speeds were aligned with the performance actually delivered to a majority of connections.
MBNZ Spring Report, December 2019 The information in this document is correct as of December 2019
Figures 1 and 2 present an overview of download and upload speed across the nation. These are included in every report in order to provide a benchmark that can be tracked over time.
Figure 1 shows average download speeds by technology. Fibre Max delivers an average download speed of 658.2 Mbps, more than six times the speed of Fibre 100. ADSL is lowest at 9.3 Mbps.
Peak hours are the times when people typically use the internet; in New Zealand this is 7pm to 11pm on Monday-Friday. Average speeds for all technologies do not decrease substantially during the peak.
4
Speed Tests
The speeds of Fibre packages have improved since the previous measurement period. A large part of this increase is due to a technicality; there was previously an interconnection issue between one RSP and REANNZ, the hosting provider of our New Zealand test servers, which has now been rectified. The speeds of other technologies have remained at the same level as observed in the previous measurement period.
Figure 2 shows upload speeds by technology. Like download speeds, performance is highest on Fibre Max and lowest on ADSL. There is no significant drop-off in either download speed or upload speed at peak times, which means that most users can expect their experience to remain consistent despite more people using the network.
Figure 1: Download Speeds - Peak vs. 24/7
Dow
nloa
d Sp
eed
(Mbp
s)
0
100
200
300
400
500
600
700
ADSL Fibre 100 Fibre Max VDSL Fixed Wireless
22.743.0
637.2
98.6
9.1 25.843.6
658.2
99.0
9.3
24/7 Peak
Figure 2: Upload Speeds - Peak vs. 24/7
Upl
oad
Spee
d (M
bps)
0
100
200
300
400
500
600
700
ADSL Fibre 100 Fibre Max VDSL Fixed Wireless
15.812.6
470.1
21.20.8 16.112.7
471.1
21.20.9
24/7 Peak
15th September - 14th October 2019
MBNZ Spring Report, December 2019 The information in this document is correct as of December 2019
Our measurement period overlapped with this year’s Rugby World Cup. We wanted to look at performance during this extremely popular event. For many games, the only way to watch live was through the Spark Sport online streaming service, and we were interested in what impact this might have had on the network.
By all metrics, there was no material degradation in internet performance while matches were broadcast. In particular, there was no change during the All Blacks vs South Africa game on 21st September (which is likely to have attracted more viewers than other games during our measurement period).
Figure 3 shows performance in terms of download/upload speed, latency to NZ servers, and maximum streamable video quality through Netflix and YouTube. These results are indexed against the average peak period performance, allowing us to compare performance during Rugby World Cup games against performance during a regular evening.
5
Rugby World Cup 2019
It is important to note that we did not collect match-time measurements from volunteers who were streaming the games, as the stream and speed measurements would have interfered with each other. To make sure that we get the most accurate results possible, the SamKnows Whitebox can detect when someone is using their internet connection, and will only run tests when there is no ‘cross traffic’.
What these results show is that the performance of New Zealand’s internet as a whole was not affected by the additional load from people viewing a popular international broadcast. This is likely due to the use of CDN caches deep within RSPs’ networks which were used to serve the majority of traffic.
Figure 3: Comparison of Performance Indexed vs Peak During RWC 2019 Games
MBNZ Spring Report, December 2019 The information in this document is correct as of December 2019
Figures 4 and 5 compare speed test results against each technology’s advertised speed.
ADSL, VDSL, and Fibre 100 deliver speeds broadly in line with those advertised. However, Fibre Max, for which advertised download speeds range between 900 Mbps and 950 Mbps depending on RSP, performs at a much lower level than advertised overall.
For Fibre packages, we consider speed tests as a percentage of the speed advertised for that package on the RSP’s website. For ADSL and VDSL packages, RSPs do not advertise a single speed on their websites, as the maximum achievable speed will be different for each installation*. Fixed Wireless packages are not advertised based on speed and have been excluded from these graphs.
6
Advertised Speeds
Fibre download speeds have improved since the previous report, mainly as a result of an interconnection issue between one RSP and the test server host being resolved.
Upload speeds (with the exception of ADSL) are generally in line with those advertised:
Figure 4: % of Advertised Download Speed - Peak vs. 24/7
Dow
nloa
d Sp
eed
(% o
f Adv
ertis
ed)
0%
10%
20%
30%
40%
50%
60%
70%
80%
90%
100%
ADSL Fibre 100 Fibre Max VDSL
95.4%
70.2%
98.6%88.2% 96.0%
72.4%
99.0%89.7%
24/7 Peak
Figure 5: % of Advertised Upload Speed - Peak vs. 24/7
Upl
oad
Spee
d (%
of A
dver
tised
)
0%
10%
20%
30%
40%
50%
60%
70%
80%
90%
100%
110%
ADSL Fibre 100 Fibre Max VDSL
99.5%108.1%106.1%
86.0%99.2%
108.4%106.2%86.8%
24/7 Peak
15th September - 14th October 2019
* We consider speed test results as a percentage of each installation’s ‘synchronised speed’ and deduct 7% to allow for network overheads (such overheads are already accounted for in the advertised speeds of Fibre packages).
MBNZ Spring Report, December 2019 The information in this document is correct as of December 2019
As highlighted in the section on advertised speeds, Fibre 100 packages generally deliver download and upload speeds in line with advertising; all RSPs advertise 100 Mbps download and 20 Mbps upload.
As of this report, we will begin to compare the main RSPs on the performance of their 100 Mbps Fibre packages. Data from Whiteboxes connected to Orcon and Slingshot were included in the overall Fibre 100 results, but are not included in this graph because we need to have more volunteers on Orcon/Slingshot Fibre 100 before reporting results for these RSPs.
Figure 6 shows the average Fibre 100 download speed for each RSP. Most RSPs are delivering speeds as advertised for their average customer:
7
Fibre 100 Breakdown
Results are plotted with error bars, which display the 95% confidence interval for each RSP’s average speed. If we had repeated our measurements 100 times, we would expect average speeds to have fallen within the black bands in at least 95 cases.
Figure 7 shows the average Fibre 100 download speed in different areas of New Zealand. Average download speeds appear to be lower outside of Auckland and Wellington, although the difference is at a level which is not likely to have a practical effect on most internet applications:
Figure 6: Fibre 100 Download Speed by RSP - Peak vs. 24/7
Dow
nloa
d Sp
eed
(Mbp
s)
0
25
50
75
100
2 Degrees MyRepublic* Spark Trustpower Vodafone
97.992.6100.2100.499.0 98.292.7100.4101.499.3
24/7 Peak
Figure 7: Fibre 100 Download Speed by Region - Peak vs. 24/7
Dow
nloa
d Sp
eed
(Mbp
s)
0
25
50
75
100
Auckland Wellington North Island Other Urban South Island Urban
95.697.8100.8100.8 96.198.2101.3101.2
24/7 Peak
Fibre networks have generally not proliferated into rural areas, and so this comparison only considers urban areas.
15th September - 14th October 2019
*MyRepublic had 39 Whiteboxes online and reporting on the Fibre 100 tier compared to 40 or more for other RSPs. SamKnows threshold for the number of Whiteboxes needed is 40. As the 95% confidence interval width of MyRepublic's mean was in line with the other RSPs included in the report they have been included in the download speed chart shown above.
MBNZ Spring Report, December 2019 The information in this document is correct as of December 2019
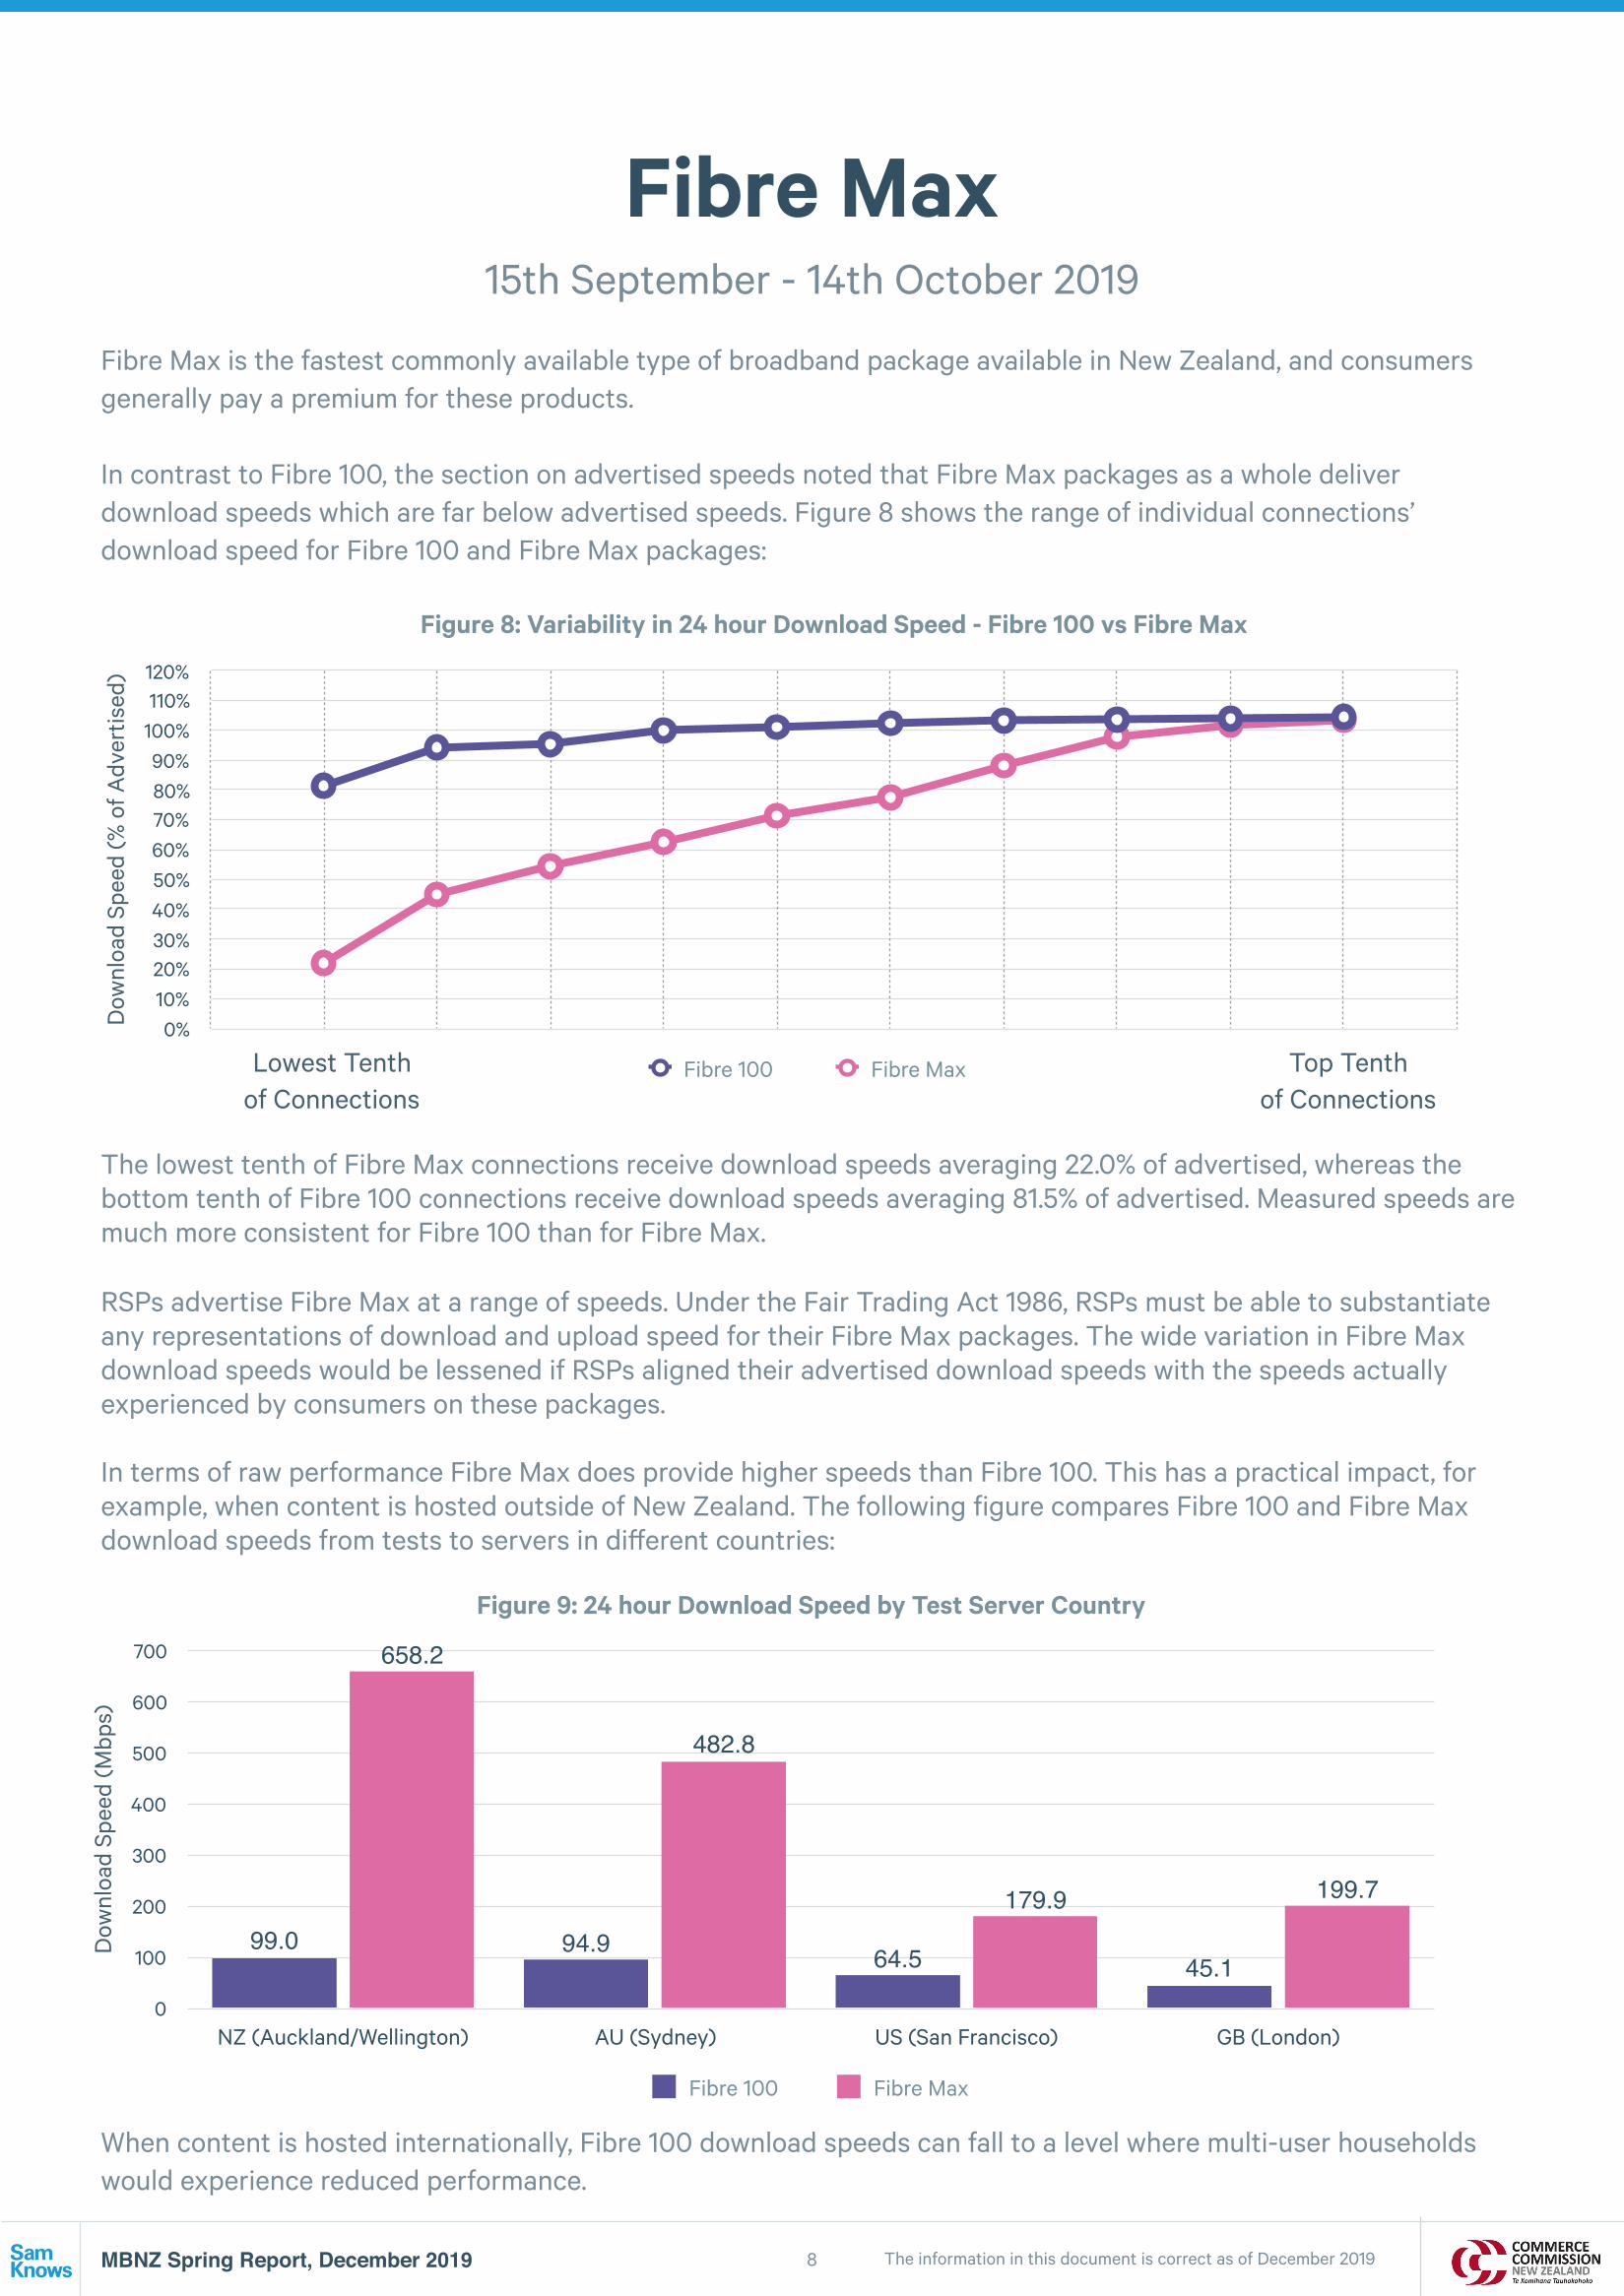
Fibre Max is the fastest commonly available type of broadband package available in New Zealand, and consumers generally pay a premium for these products.
In contrast to Fibre 100, the section on advertised speeds noted that Fibre Max packages as a whole deliver download speeds which are far below advertised speeds. Figure 8 shows the range of individual connections’ download speed for Fibre 100 and Fibre Max packages:
8
Fibre Max
The lowest tenth of Fibre Max connections receive download speeds averaging 22.0% of advertised, whereas the bottom tenth of Fibre 100 connections receive download speeds averaging 81.5% of advertised. Measured speeds are much more consistent for Fibre 100 than for Fibre Max.
RSPs advertise Fibre Max at a range of speeds. Under the Fair Trading Act 1986, RSPs must be able to substantiate any representations of download and upload speed for their Fibre Max packages. The wide variation in Fibre Max download speeds would be lessened if RSPs aligned their advertised download speeds with the speeds actually experienced by consumers on these packages.
In terms of raw performance Fibre Max does provide higher speeds than Fibre 100. This has a practical impact, for example, when content is hosted outside of New Zealand. The following figure compares Fibre 100 and Fibre Max download speeds from tests to servers in different countries:
Figure 8: Variability in 24 hour Download Speed - Fibre 100 vs Fibre Max
Dow
nloa
d Sp
eed
(% o
f Adv
ertis
ed)
0%10%20%30%40%50%60%70%80%90%
100%110%120%
Fibre 100 Fibre Max
Figure 9: 24 hour Download Speed by Test Server Country
Dow
nloa
d Sp
eed
(Mbp
s)
0
100
200
300
400
500
600
700
NZ (Auckland/Wellington) AU (Sydney) US (San Francisco) GB (London)
199.7179.9
482.8
658.2
45.164.594.999.0
Fibre 100 Fibre Max
When content is hosted internationally, Fibre 100 download speeds can fall to a level where multi-user households would experience reduced performance.
15th September - 14th October 2019
Lowest Tenth of Connections
Top Tenth of Connections
MBNZ Spring Report, December 2019 The information in this document is correct as of December 2019
Figure 10 looks at the highest quality which can be streamed over Netflix, compared across technologies:
9
Netflix
All technologies are able to stream in at least High Definition at least 90% of the time, and packages based on Fibre are able to stream in Ultra High Definition almost all of the time.
Many households have multiple users streaming different content at the same time. Figure 13 shows the percentage of times that a connection would be able to support a single Ultra High Definition stream, and the percentage of times that a connection would be able to support two or more Ultra High Definition streams:
Figure 10: Netflix Streaming by Technology
Succ
essf
ul S
trea
min
g (%
)
0%
10%
20%
30%
40%
50%
60%
70%
80%
90%
100%
ADSL Fibre 100 Fibre Max VDSL Fixed Wireless
1.9%1.3%0.3%0.6%10.0%
32.1%
9.7%
0.1%0.3%
72.7%
65.9%
89.0%99.7%99.2%
17.3%
UHD HD SD
Fibre 100 and Fibre Max can both comfortably support multiple people streaming different content simultaneously. The difference between Fibre 100 and Fibre Max only becomes apparent when there are 6 or more simultaneous UHD threads.
VDSL and Fixed Wireless can generally accommodate a single user streaming in Ultra High Definition, although performance will be variable and generally will not be able to accommodate multiple simultaneous users. ADSL will generally not support Ultra High Definition Netflix streaming.
These figures are derived from the throughput achieved when downloading content from Netflix servers, which is independent of video bitrate.
Figure 11: Number of Concurrent Users per Connection who can stream UHD
Perc
enta
ge o
f Con
nect
ions
0%
10%
20%
30%
40%
50%
60%
70%
80%
90%
100%
ADSL Fibre 100 Fibre Max VDSL Fixed Wireless
8.0%
56.6%
100.0%99.0%
0.0%
76.0%
89.1%
100.0%99.3%
15.3%
At least 1 UHD Stream on AverageAt least 2 UHD Streams on Average
15th September - 14th October 2019
MBNZ Spring Report, December 2019 The information in this document is correct as of December 2019
Figure 12 looks at the highest quality which can be streamed over YouTube, compared across technologies:
10
YouTube
Results are comparable with Netflix streaming performance: all technologies are able to stream YouTube in at least High Definition at least 86% of the time, and Fibre can support High Definition 99% of the time. These results compare favourably to the previous measurement period, in which Fibre could only support HD streaming 84% of the time.
Note that, for YouTube performance, HD and UHD have been combined into a single category. This is because the most popular content on YouTube may not be available in UHD (the most popular video in New Zealand could be a HD movie trailer or a low quality video filmed from a smartphone). By comparison, Netflix always makes its content available in Ultra High Definition.
Figure 12: YouTube Streaming by Technology
Succ
essf
ul S
trea
min
g (%
)
0%
10%
20%
30%
40%
50%
60%
70%
80%
90%
100%
ADSL Fibre 100 Fibre Max VDSL Fixed Wireless
96.9%98.3%99.0%99.0%86.2%
HD or Better SD
13.8%
15th September - 14th October 2019
MBNZ Spring Report, December 2019 The information in this document is correct as of December 201911
Figure 13 shows the distribution of latency results to servers hosted in New Zealand, by technology. It shows latency along the x-axis, and the bars indicate the percentage of tests that fell into each 10ms bucket for each technology.
Of all the latency tests performed on Fibre connections, 92% were below 20ms. At the other end of the chart, 95% of Fixed Wireless latency results were above 30ms. Latency above 30ms would cause stuttering and dropouts in latency-sensitive applications such as gaming or video calls.
Figure 14: Distribution of Packet Loss Rates by Technology
Perc
enta
ge o
f Pac
ket L
oss
Test
s
0%
10%
20%
30%
40%
50%
60%
70%
80%
90%
100%
Packet loss (%)
Zero 0.1% to 1% 1% and higher
1.0%
11.7%
87.4%
1.4%8.7%
89.8%
0.7%3.4%
96.0%
5.8%
19.3%
75.0%
ADSL Fibre VDSL Fixed Wireless
Figure 14 shows the distribution of packet loss rate recorded in tests, by technology. Packet loss below 1% should not cause issues with internet applications. ADSL packages saw packet loss rates higher than 1% in 5.8% of tests, which is a rate low enough that a minority of users may experience intermittent issues accessing webpages or using real time applications such as online gaming or voice calling.
15th September - 14th October 2019
MBNZ Spring Report, December 2019 The information in this document is correct as of December 201912
Download The speed data travels from our test server to your device, measured in bits per second.
Upload The speed data travels from your device to our test server, measured in bits per second.
Latency How long it takes a data packet to go from your device to our test server and back to your device.
Jitter Measures the amount of difference between packet delays, or the stability of your latency.
Packet Loss When a packet of data becomes lost (does not arrive for two seconds) measured as a percentage of packets lost out of packets sent.
YouTube Measures the highest bitrate you can reliably stream for the most popular video in your country.
Netflix An application-specific test, supporting the streaming of binary data from Netflix's servers using the same CDN selection logic as their real client uses. The test has been developed in direct cooperation with Netflix.
Web browsing Measures how long it takes to fetch the HTML and referenced resources of a popular website.
CDN measurements Measures download performance for the same (or very similar) object from a variety of popular Content Delivery Networks over HTTP.
Voice over IP Measures the suitability of a broadband connection for VoIP calls.
How we testSamKnows One analytics • View all your data in one place.
• Create customised charts and save the results that mean the most to you.
• Track changes in your connection over time.
Our tests
Volunteer today!
Measuring homes across New Zealand • The SamKnows Whitebox is a purpose-built testing agent
that connects to your router.
• Measures every aspect of your internet service delivered to your home.
• Runs at regular intervals when you’re not using the internet.
MBNZ Spring Report, December 2019 The information in this document is correct as of December 201913
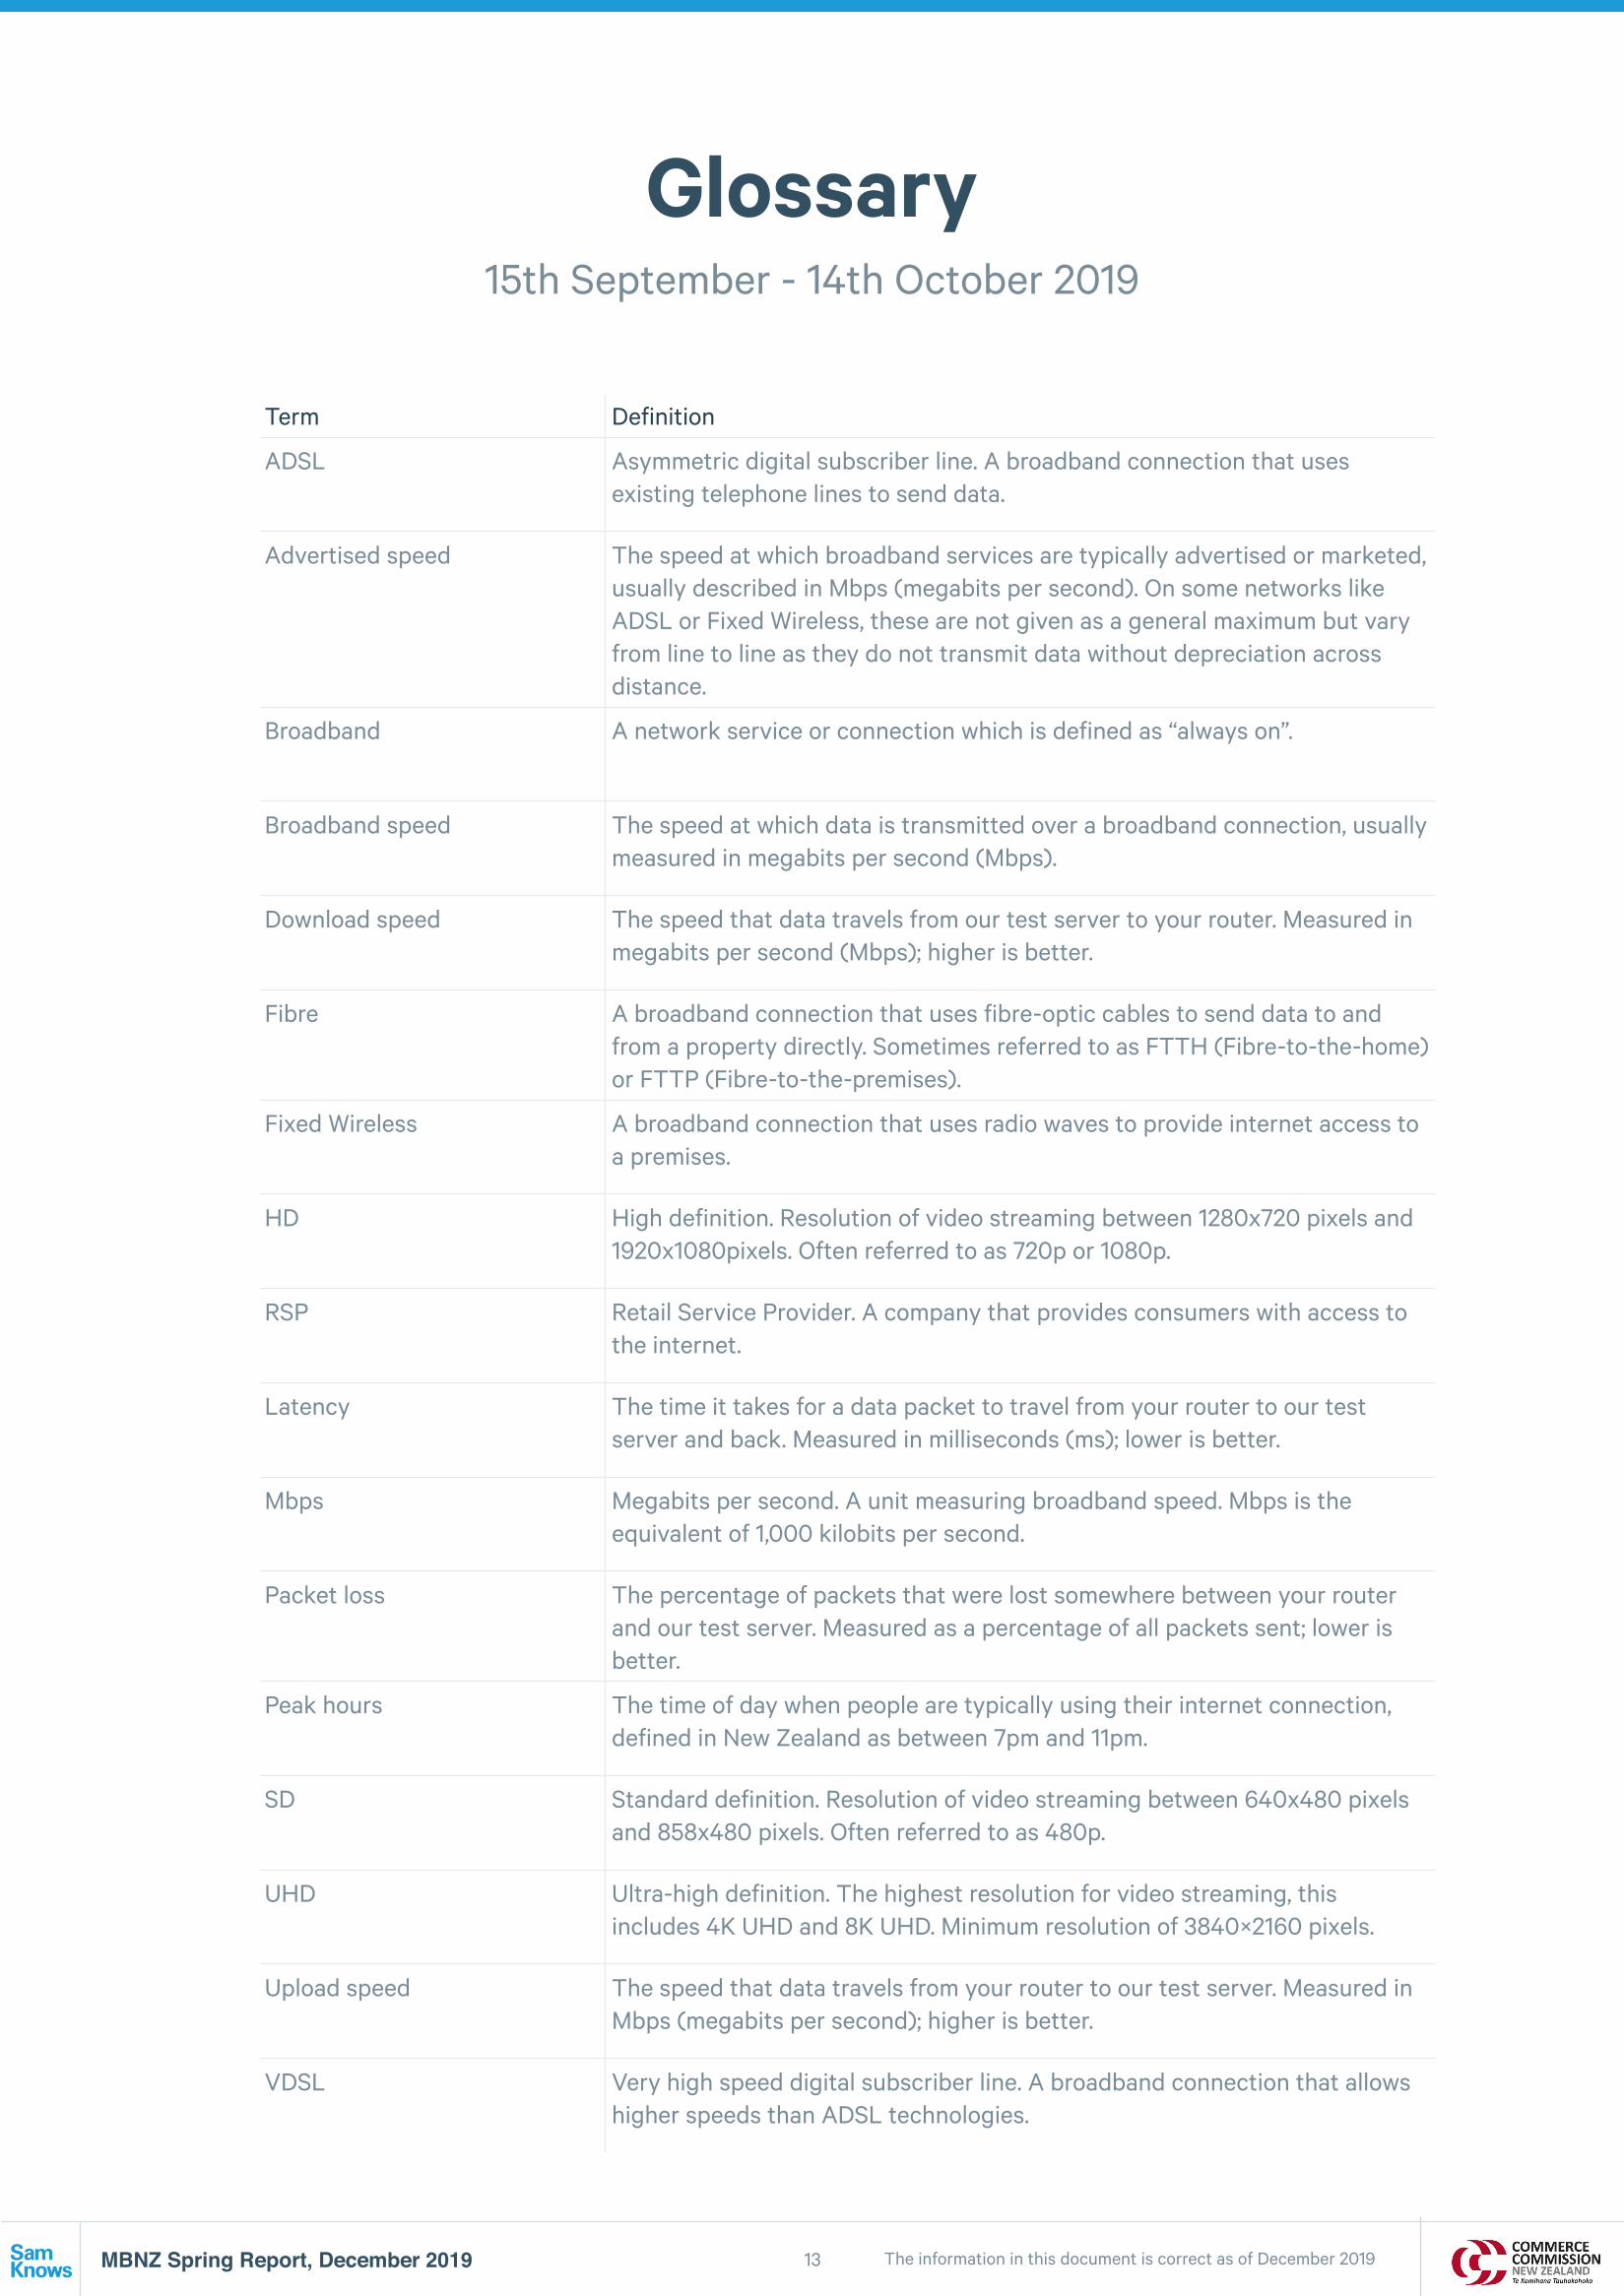
Glossary
Term Definition
ADSL Asymmetric digital subscriber line. A broadband connection that uses existing telephone lines to send data.
Advertised speed The speed at which broadband services are typically advertised or marketed, usually described in Mbps (megabits per second). On some networks like ADSL or Fixed Wireless, these are not given as a general maximum but vary from line to line as they do not transmit data without depreciation across distance.
Broadband A network service or connection which is defined as “always on”.
Broadband speed The speed at which data is transmitted over a broadband connection, usually measured in megabits per second (Mbps).
Download speed The speed that data travels from our test server to your router. Measured in megabits per second (Mbps); higher is better.
Fibre A broadband connection that uses fibre-optic cables to send data to and from a property directly. Sometimes referred to as FTTH (Fibre-to-the-home) or FTTP (Fibre-to-the-premises).
Fixed Wireless A broadband connection that uses radio waves to provide internet access to a premises.
HD High definition. Resolution of video streaming between 1280x720 pixels and 1920x1080pixels. Often referred to as 720p or 1080p.
RSP Retail Service Provider. A company that provides consumers with access to the internet.
Latency The time it takes for a data packet to travel from your router to our test server and back. Measured in milliseconds (ms); lower is better.
Mbps Megabits per second. A unit measuring broadband speed. Mbps is the equivalent of 1,000 kilobits per second.
Packet loss The percentage of packets that were lost somewhere between your router and our test server. Measured as a percentage of all packets sent; lower is better.
Peak hours The time of day when people are typically using their internet connection, defined in New Zealand as between 7pm and 11pm.
SD Standard definition. Resolution of video streaming between 640x480 pixels and 858x480 pixels. Often referred to as 480p.
UHD Ultra-high definition. The highest resolution for video streaming, this includes 4K UHD and 8K UHD. Minimum resolution of 3840×2160 pixels.
Upload speed The speed that data travels from your router to our test server. Measured in Mbps (megabits per second); higher is better.
VDSL Very high speed digital subscriber line. A broadband connection that allows higher speeds than ADSL technologies.