Policy Reawoh WORKING PAPERS L Financial Policy and Systme | Country Economics Department The WorldBank November 1 991 WPS806 Measuring CommercialBank Efficiency Useand Misuse of Bank Operating Ratios Dimitri Vittas Measuring bank efficiency is difficultbecause thereis no satis- factory definition of bank output. International comparisons based on operating costsandmargins arefraught with problems. These stem from substantialdifferencesin capital structure (leverage),business or productmix, range and quality of ser- vices, inflationrates, and accountingconventions(especially aboutthevaluation of assets, the levelof loanloss provisioning, andtheuseof hidden reserves). Facile anduncritical useof ratios cannot substitute for detailedknowledge and understanding of bankingstructure and practice. Policy RcarchWod&ing Paper disseminate the findings of woik inpms andc anogc theexchange of ideasarnong Bank staffand allothcrs ind sin devcIoprnet isucs.Thec papcn6t rs,d ibuted bythcRecwarh AdvisoryStaff,carythenames of theauthor5,rdlert onlytheirviews andshouldbeusedandcdaccordingly. Thefindings.intneprtations andconclusionssartheauthom'own.Theyshould not be attnbuted to theWodd Bank, its Board of Dicmtrs, its managemen, or any of its member countries. Public Disclosure Authorized Public Disclosure Authorized Public Disclosure Authorized Public Disclosure Authorized
Transcript
Policy Reawoh
WORKING PAPERS
L Financial Policy and Systme |
Country Economics DepartmentThe World BankNovember 1 991
WPS 806
MeasuringCommercial Bank
Efficiency
Use and Misuseof Bank Operating Ratios
Dimitri Vittas
Measuring bank efficiency is difficult because there is no satis-factory definition of bank output. International comparisonsbased on operating costs and margins are fraught with problems.These stem from substantial differences in capital structure(leverage), business or product mix, range and quality of ser-vices, inflation rates, and accounting conventions (especiallyabout the valuation of assets, the level of loan loss provisioning,and the use of hidden reserves). Facile and uncritical use of ratioscannot substitute for detailed knowledge and understanding ofbanking structure and practice.
Policy RcarchWod&ing Paper disseminate the findings of woik in pms andc anogc theexchange of ideasarnong Bank staff andallothcrs ind sin devcIoprnet isucs.Thec papcn6t rs,d ibuted by thcRecwarh AdvisoryStaff,carythenames of theauthor5,rdlertonlytheirviews andshouldbeusedandcdaccordingly. Thefindings.intneprtations andconclusionssartheauthom'own.Theyshouldnot be attnbuted to the Wodd Bank, its Board of Dicmtrs, its managemen, or any of its member countries.
Pub
lic D
iscl
osur
e A
utho
rized
Pub
lic D
iscl
osur
e A
utho
rized
Pub
lic D
iscl
osur
e A
utho
rized
Pub
lic D
iscl
osur
e A
utho
rized
Policy Research
Financial Policy anqd Systems
WPS 806
This paper- a product of the Financial Policy and Systems Division, Country Economics Department-is part of a largereffort in the Bank to disseminate the results of its research in financial sectordevelopment.Copies are available free from the World Bank, 1818 H Street NW, Washington DC 20433. Please contactWilai Pitayatonakam, room N9-003, extension 37666 (49 pages). Novemnber 1991.
Measuring bank efficiency is difficult because combines two simple identilies between profit-there is no satisfactory definition of bank output. ability ratios, bank leverage, and gross margins.Neither the number of accounts nor total assets, It copes quite well with the differential impact oftotal loans, and total deposits provide a good capital structure, product mix, and inflation butindex of output. Moreover, the value added of not with differences in accounting conventions.banks - given by their labor costs and profits- ROE analysis can also shed light on the relation-measures both the output and the cost of bank- ship between spreads, leverage, and inflation.ing.
Vittas applies his analysis to the perKor-Many analysts use accounting data on bank} mance of banks in OECD countries in the 1980s.
margins, costs, and profits as measures of bank He shows that U.K. building societies, Cermnanefficiency. But the usefulness of these data is savings banks, and commercial banks in Canada,undermined by substantial structural and ac- Germany, and the Netherlands were highlycounting differences across countries, among profitable and efficient. American money centerindividual banks, and over time. Great caution banks anI foreign banks in Canada were the leastand extensive knowledge of local banking profitable.conditions are required to interpret bank ratios.
The data also suggest that banks in consoli-Vittas uses three sets of operating ratios to dated banking systems with high concentration,
discuss the impact of differences in structure and as in Canada, the Netherlands, and Sweden, havepractice on bank performance: lower operating costs than banks in fragmented
syst,ms, as in Italy, Norway, and the United* Operating asset ratios (which relate all States.
revenues and costs to average assets).The analysis has major implications for
* Operating income ratios (which relate assessing bank performance in developingrevenues and costs to gross income). countries. Given the narrower range and lower
quality of their services and the lower level of* Operating equity ratios (which relate wages, their cost-asset and cost-income ratios
revenues and costs to average equity). should be smaller than for banks in developedcountries. But inflation, higher risk, and operat-
He also uses return-on-equity (ROE) analy- ing inefficiencies often cause cost and other banksis to highlight the effects of differences in ratios to be generally higher than in OECDbanking structure and practice. ROE analysis countries.
Policy Rcsarch Working Papers disseminate the findings of work under way in the Bank. An objectivc of the series is to getthese f.ndings out quickly, cven if presentations are less than fully polished. The findings, interpretations, and conclusions inthese papers do not necessarily represent official Bank policy.
Produced by the Policy Research Dissemination Center
TABLE OF CONTENTS
I. INTRODUCTION 1
II. DETERMINANTS OF OPERATING RATIOS 4
2.1 Operating Ratios of Stylized OECD Bank 42.2 Capital Structur6 52.3 Business or Product Mix 72.4 Range and CQuality of Services 92.5 The Impact of Inflation 102.6 Asset Valuation 132.7 l oss Provisions 152.8 Hidden Reserves 152.9 ROE Analysis 162.10 Spreads, Leverage and Inflation 18
Ill. THE EXPERIENCE OF BANKS IN SELECTED OECD COUNTRIES 21
4.1 ROE and Covariance Analysis 354.2 Differences between American and German Banks 414.3 Differences between UK commercial banks
and building societies 444.4 Implications for Developing Countries 47
REFERENCES 49
Measuing Commercial Bank Efficincy
Use and NMsuse of Bank Opeaing Rados
Dimitri Vktas
1. INTRODUCTION
A major plank of programs of banking and financial reform In developing countries isthe Improvement in bank efficiency that may result from exposing domestic institutionsand markets to greater competition. A basic benefit of enhanced efficiency is a reductionin spreads between lending and deposit rates. This is likely to stimulate both greater loandemand for industrlal investment (and thus contribute to higher economic growth) andgreater mobilization of financial savings through the banking system.
Banks in developing countries operate with relatively wide spreads. These arecaused by government policies and regulations and by operating Inefficiencies. ForInstance, a wedge between loan and deposit rates, at least for the nonprivileged customersof banks, is created by the imposition of onerous reserve requirements and other forms ofbank taxation, the operation of directed credit programs and a high level of Inflation. Inaddition, high operating costs, large loan losses and large profits from uncompetitivebehavior are also translated into wide bank spreads.
An issue that confronts policymakers of developing countries is how to measureimorovements in bank efficiency. One way is to collect detailed data on bank spreadsbefore and after the reform. Another Is to undertake a detailed comparative study ofspreads In different countries. Both of these approaches are quite laborious, becausebanks offer a wide range of loans and deposits as well as other types of services. Acareful identification of bank products and services and a compilation of detailed data onInterest rates and other fees would be required, while the findings may still be inconclusiveif spreads for specific products exhibit variations from country to country that have nosystematic pattern.
An alternative approach is to use some aggregate index of bank efficiency.However, constructing such an aggregate index is subject to great difficulties. The mostbasic problem is the lack of a satisfactory definition of bank output. Most econometricstudies of banking (for instance, in the extensive literature on bank economies of scale andscope) use either total assets, loans or deposits or the number of accounts as an index ofbank output even though none of these variables is able to capture the value of serviceprovided by banks.
A better alternative is perhaps a measure of the value added of banks, which Is givenby the labor costs and profits of banks. However, value added also measures the totalcost of banking. While it may give a better indication of the size of the banking industrythan either the number of loan accounts or the value of loan balances outstanding, it doesnot provide a satisfactory measure of bank efficiency. Value added may be as high for
1
banking systems that provide a wide range of services at low cost as for banking systemsthat offer a narrow range at high cost.
To obtain a good measure of bank efficiency it would be necessary to construct anindependent Index of bank output or at least an index of bank prices that could then beused to obtain a measure of bank output. Such a measure could then be combined withdata on bank costs to ascertain the relative efficiency of different banking systems orIndividual banKo.
Unfortunately. such independent measures of Lank prices and output are notgenerally available. Moreover, even if they were available, an important policy Issue wouldstill remain unresolved. It would still be possible for one banking system to offer a narrowrange of services at low unit cost and for another to offer a wider range of services athigher unit cost. While the latter might be less efficient in terms of unit costs, its totaleconomic contribution could be higher than the former system if the provision of a widerrange of services reduced the transaction and information costs of other economic agentsand led to a more efficient mobilization and allocation of resources by the economy as awhole.
Faced with these difficulties, most analysts resort to the use of accounting data onbank margins, costs and profits as measures of bank efficiency. Three types of operatingratios may be used in analyzing the performance of banks: operating asset ratios,operating income ratios and operating equity ratios. The first relate all revenues and coststo average total assets, the second to gross income and the third to average equity.
Although they are more readily available and widely used, the usefulness ofoperating ratios is undermined by differences in capital structure, business mix, andaccounting practices across countries, among individual banks, and over time. Operatingratios are also affected by variations in inflation rates.
Differences In capital structure refer to differences in the equity capitalization ratio ofdifferent banks, i.e. the ratio of average equity capital to average total assets: banks witha higher equity will genere'lv report higher operating ratios, such as interest and grossIncome margins and return -.- issets (ROA) and lower costlincome ratios, than banks witha lower equity, even thoug' ie basic interest spreads of the two banks may be thesame.
Differences in business mix derive from differing combinations of high and lowmargin business, while accounting practices that distort operating ratios cover such Issuesas the valuation of assets, the treatment of reserves for depreciation, pensions. and loanlosses, and the use of hidden reserves. The impact of Inflation also varies depending onthe capital structure, business mix and accounting conventions of banks In differentcountries.
The remainder of this paper is devoted to a critical examination of traditionalmeasures of bank efficiency such as bank margins, costs and profits. A fundamental pointof the paper Is that Interpreting and using data on bank margins, costs and profits requiresgreat caution and detailed knowledge of the operating characteristics of different banks.
2
The paper also emphasizes the fact that different ratiou .ave their merits anddemerits and that a combination of ratios from each type may provide a better, though stillnot fully satisfactory, indication of efficiency. Particular emphasis is placed on ROE (returnon equity) analysis that underscores the links between different profitability ratios,leverage and product mix. ROE analysis can also be used to shed light on the relationshipbetween bank spreads, leverage and inflation.
The next section of the paper provides an analytical discussion of the factors thatInfluence bank margins, while the third section reviews the experience of banking systemsin some OECD countries. The paper conc:udes with a discussion of some analytical andpolicy issues.
3
11. DElERMINANTS F OPERATING RATIOS
2.1 Operating Ratios of Styized OECD Bank
Table I shows the operating ratios of a stylized bank that would broadly correspondt. the average bank in OECD countries. Bank A has a loan portfol that represents 60*6of Its total assets. It also invests 25% of assets In securities and Interbank claims thatyield money market rates. The remaining 15% of assets are non-interest-earning, 5% Infixed assets and trade investments that may appreciate in nominal or real value terms and10% in assets that have a fixed nominal value. On the liabilities side, Bank A is assumedto have 15% of !labilltles in demand deposits and other Items that pay no Interest, 60% ininterest-bearing depcsits, 20% in borrowed funds that pay money market rates, and 5% Inequity. The spread between loan and deposit rates is 4%. The rates of interest on variousinstruments are as indicated in Table 1. The rates implicitly assume an infiation rate of5%. Noninterest Income amounts to 0.75% of assets and noninterest expenses (includingboth operating costs and provisions) to 2.6% of assets.
l3terest margin 2.85 79.2 57.0Noninterest income o 07 20.8 15. Gross income 3.60 100.0 72.0Noninterest expenses 2.60 72 2 52.0Not income 1.00 27.8 20.0
On the basis of these assumptions, Bank A has the following operating asset ratios(OAR): an Interest margin of 2.85%, a gross income margin of 3.6% and a ROA of 1%.(It should be noted that the interest spread of 4% is reduced to an average Interest marginof 2.85%). Its operating income ratios (OIR) show that Bank A generates 20.8% of itsgross income through non-interest fees, while its cost/income ratio is 72.2%. Theoperating equity ratios (OER) show a ROE of 20%. But they also show a gross Income toequity ratio of 72% and a cost to equity ratio of 52%. These last two ratios provide anIndication of the extent to which Bank A may be over- or under-trading by comparison toother banks.
4
The ROE of 20% is, of course, expressed In nominal terms. Allowing for Inflation,this would fall to 15%. although a correct calcul ation of the ROE under inflation shouldalso take account of the revaluation gains of fixed assets and trade investments.Prevailing accounting practice does not Include revaluation gains in annual profitcalculations, though this may be very misleading not only in countries suffering from highInflation but also in countries with low but persistent inflation.
The study of biank performance and efficiency would present law difficulties if allbanks had the samo capital structure, offered the same mix of services, followed identicalaccounting practices, were equally affected by inflation and operated under the sameregulatory restrictions. Under these circumstances, a simple comparison of Interestmargins, cost ratios and rates nf return would provide a clear indication of relativeefficiency even in the absence of a satisfactory deJinition of bank output.
However, banks exhibit considerable differences in their capital structure, theirbusiness mix and their accounting practices. Banks also operate in substantially differentmacroeconomic and regulatory environments. These differences have a large impact untheir operating ratios and east serious doubt on the usefulness of facile comparisons basedon ROAs, interest and gross income margins, and cost/income ratios. Moreover. theaccounting Jata, on which all types of operating ratios are based, suffer from manyqualitative problems that seriously undermine the usefulness of these ratios for analyticaland policy purposes.
2.2 Cardtai Structure
Most financial analysts focus on the return to assets (ROA) ratio as a mes3ure ofbank efficiency without paying adequate attention to the impact of differences in theequity capitalization ratio of different banks.
A bank with a higher equity capital will report a higher ROA than a bank with a lowerequity capital, even if all other spreads and costs are the same. Table 2 shows the impactof capital structure on various operating ratios. It assumes two banks that have identicalasset and liability structures as well as noninterest Incomes and expenses as Bank A,except for their equity capital and borrowed funds.
Bank B has an equity capital of 7.5% and reports a higher ROA of 1.22% but alower ROE of 16.2%. In contrast, Bank C has an equity capital of 2.5% and reports alower ROA of 0.77% but a higher ROE of 30.8%.
In general, and as already noted above, a higher equity capital Increases mostoperating asset ratios, such as the interest margin, gross income margin and ROA, butlowers operating income ratios (such as the share of noninterest income and thecost/income ratio) and operating equity ratios. The reason for this is very simple. A bankwith a higher equity capital needs to borrow less in order to support a given level ofassets. As a result Its interest expenses are lower and this causes the interest margin tobe higher. This is then reflected in a higher gross income to assets ratio. If costs andprovisions are unaffected by the higher level of equity, the result is a higher net income
5
Mablo 2
The Imoact of Caoital StruMtjUQ
Righ Equity Capital - Low Leverage
Asutat Liabilitios
Loans 60 11% Damand deposits 10 0%Securities 1S 9% Other deposits 60 TInterbank claims 10 9% Borrowed funds 17.5 9%Fixed a5uets 5 0% Other liabilities 5 0OOther assets IQ 0 Equity 705 0%Total 100 8.85% Total 100 5.78%
Interest margin 2.62 77.7 104.8Noninterest income 0.75 22A3 30.0gross income 3.37 100.0 134.8Noninterest expenses I 2162 104.0Net income 0.77 22.8 30.8
6
and lower cost/income ratios. Its operating equity ratios are lower because it has a higherequity base. In Table 2, Bank B shows a lower ROE as well as lower gross Income andcosts to equity ratios, implying that it is urdertrading compared to both Bank A and BankC.
These ratios result from the assumption that bank spreads and operating costs.including loss provisions, are the same for all three banks, irrespective of their differentcapital structures. They reflect the well known advantages of higher leverage, althoughthey disregard the greater r?sks normally associated with higher leverage. In principle,however, one would expect a bank with a lower capital to be more risky and therefore tobe faced with a higher cost of funds. But irrespective of whether or not the cost of fundsadjusts for the higher risk of more leveraged banks, the fact remains that for Bank B tohave the same ROE as Bank A it would need to operate with much higher spreads andmargins. In the example of Table 2, Bank B would need a ROA of 1.5% in order to earn a EROE of 20%. This would imply an interest margin of 3.35 (instead of 2.85%) and a grossIncome margin of 4.1% (instead of 3.6%). Conversely, Bank C could operate with a ROAof only 0.5% and still earn a 20% ROE. This would imply an interest margin of 2.35%and a gross income margin of 3.1%.
Data for different types of American banks show that their equity capitalizationratios range from 4.6% for the money center banks to 8.2% for small local banks. Also,data for commercial banks in different OECD countries show that equity capitalizationratios varied on average over the 1980-86 period from 7.9% for Spanish banks and 7.1%for Finnish banks to as low as 1.4% for Swedish banks and 2.4% for French andJapanese banks. Thus, differences in the equity capital of banks can be substantial andneed to be borne in mind in analyzing the performance of banks across countries or evenwithin a given country.
2.3 Business or Product Mix
The second factor that can influence bank ratios are differences in business orproduct mix. Table 3 provides an illustration of two banks with substantial differences Inbusiness mix. The example assumes three types of loans and two types of interest-bearing deposits. Bank D has a greater involvement in retail banking which is associatedwith higher loan rates, lower deposit rates and higher operating costs. Bank E specializesin wholesale corporate banking. Both banks are assumed to generate the same amount offee Income and to have the same capital structure.
The example of Table 3 is constructed in a way that illustrates that two banks canhave the same ROAs and ROEs, even though their interest margins, gross income marginsand operating cost ratios are widely different. Any conclusion that the bank with lowermargins and cost ratios (Bank E) is more efficient would be totally unwarranted. In fact,by assumption, both banks charge the same rates of interest on loans to the same typesof customers and also pay the same rates on similar deposits.
Many analysts looking at the low margins either of Japanese banks or of the UKbuilding societies postulate that these institutions are more efficient than the large
Interest margin 1.25 62.5 25.0Noninterest income 0.75 37.5 15.0gross income 2.00 100.0 40.0Noninterest expenses 1.00 50.0 20.0Net income 1.00 50.0 20.0
8
American and British commercial banks that generally exhibit much higher operatingmargins. But this disregards the fact that high margin business involves high operatingcosts - for Instance smaller loar.A are more expensive to process and monitor, while smallerdeposits require X jlgger branch network to collect and sewice.
Moreover, banks that offer a wider range of services, Including payment productsand investment banking services, will have much higher operating costS than banks thatconfine themselves to specialized areas of deposit and lending business. But banksoffering a wider range of services also have a greater opportunity to generate noninterestfees. Investment and merchan banks have traditionally relied on noninterest fees for tI..;rservices in trade and corporate financs, including mergers and acquisitions. The advent ofsecuritization In recent years has also contributed to an increase in fee income.
Securitization represents a new direction in product mix that may explain, at leastpartly, she upward trend in interest and gross income margins and operating cost ratios ofAmerican commercial banks. A bank that securitires the loans it originates will post a bigincrease in both its noninterest fee and operating cost ratios compared to a bank thatretains its loans and inctludes the interest spread in its interest margin. To the extent thatbusiness is non-asset based, operating ratios will be higher without necessarily implyinglower efficiency.
A further way in which differences in business mix may affect operating ratios isthrough differences in interest mismatch. Banks that extend fixed rate term loans on thebasis of short-term deposits assume a greater interest rate exposure than banks thatspecialize in short-term credits funded with short-term deposits or those that fund fixedrate term loans with fixed rate term deposits. Thus, even if they operate with similarspreads, banks with a greater interest mismatch will generally show lower margins wheninterest rates are rising and higher margins when interest rates are falling than banks witha smaller or no mismatch'.
2.4 Range and Quality of Services
An important consideration in assessing bank efficiency is the range and quality ofservices offered tn both corporate and individual customers. Banks that offer a limitedrange of services, operate a small number of branches, do not use computerized facilitiesand rely on labor-intensive and slow processing methods will tend to have low operatingcosts. However, despite their low operating cost ratios, it does not require much
' This assumes that mismatched banks have mors interest-sensitive deposits than loans.If the reverse occurs, i.e. if banks have more interest-sensitive loans than deposits, then theirmargins will be lower when interest are falling and higher when they are rising. This was thecase for the large UK clearing banks in the 1 970s and early 1 980s when they were fundingvariable-rate loans with non-interest bearing (and therefore fixed-;ate) deposits. The adventof interest-bearing demand deposits in the late 1980s has put an end to this kind ofmismatch.
9
Imagination to see that their efficiency leaves much to be desired. In effect, such bankstransfer the operating costs of banking to their customers.
A recent World Bank mission to Romania highlighted the low quality of serviceoffered by the Romanian savings bank. The savings bank has 26 million accounts whichare mostly handled manually and/or mechanically rather than by computerized systems.Because of this, int6rest rates are changed at very Infrequent intervals. This labor-intensive system of record keeping causes long delays in transaction processing with longand slow moving lines. Provisional data included In the report show that the operatingcosts of the Romanian savings bank were less than 0.17% of Its total assets (World Bank,1 990b).
In contrast, banks that offer a wide range of services, operate large branch networksand Invest heavily in computer facilities and ecotronic processing In order to enhance thequality of their services will tend to incur larger costs and will thus report higher operatingcost ratios than banks with a limited range and low quality of services.
Thus, differences in the range and quality of service must be borne in mind incomparing the performance of banks and other deposit institutions, especially whencomparing banks from developed and developing countries. As a rule, banks In developingcountries offer a much narrower range of generally lower quality services. Given theirlower labor costs one would expect bank- operating costs to be lower In developingcountries. the fact that banks in very few developing countries have operating costs thatare lower than those of banks in most developed countries suggests that developingcountry banks suffer from operating inefficiencies such as overstaffing and uneconomicbranching".
2.5 The Impact of Inflation
Apart from capital structure and business mix, differences in accounting practicescan have a big impact on operating ratios. Four aspects of accounting difference will bediscussed in this paper: the treatment and Impact of inflation, the valuation of assets andliabilities, the level of provisioning and th e use of hidden reserves.
The impact of Inflation is a very complex issue that depends on the treatment ofrevaluat;on gains on the fixed assets and trade investments of banks as well as onchanges In business mix caused by the response of economic agents to inflation. The
2 Many economists argue that developing countries suffer from bank overbranching. Theevidence produced for such claims is not, however, very convincing since branch densitiesIn developing countries are usually a fraction of those found In developed countries. Butbanks may suffer from uneconomic branching even if overall branch densities are low.Uneconomic branching implies that banks are forced to operate unprofitable branches and arenot allowed to change their interest rates and service charges to enhance the overallprofitability of their branch networks or to close down uneconomic branches.
interest margin 2.50 76.9 50.0Noninterest income 025 23.1 15.0Gross income 3.25 100.0 65.0Noninterest expenses 2. 0 0 2 0Net income 0.65 20.0 13.0Revaluation gains 1.00 30.8 amTotal income and gains 1.65 50.8 33.0Monetary correction 1.00 30.8 20.0Adjusted not income 0.65 20.0 13.0
11
latter depends on the extent to which interest rates and other bank charges adjust toInflation.
Banks would generally benefit from inflation if they have demand deposits that payzero interest, provided customers are slow in switching into interest-bearing instruments.On the other hand, banks would lose from inflation to the extent that they have "freeequity", I.e. to the extent that their equity capital exceeds their fixed assets and tradeInvestments and is therefore invested in loans. "Free equity" is sometimes called"financial capital" or "net monetary working capital".
As already noted, the data in Table 1 for Bank A are broadly based on the averagebank in the average OECD country and assume an inflation rate of 5%. Bank A hasnoninterest liabilities, including equity, equal to 20%, while its noninterest earning assetsare equal to 15%. Because its equity is equal to its fixed assets, Bank A has no "freeequity" and as long as the value of fixed assets increases with inflation and the structureof its assets and liabilities does not change, its real ROE will be equal to its nominal ROE of20%. This is because the revaluation gains on its fixed assets would not allow an erosionof the real value of its equity.
But a bank c;ould still benefit from inflation if its noninterest-bearing liabilities exceedits noninterest-earning assets. Table 4 shows the balance sheet structure and operatingratios of Bank F, which is assumed to operate in a country with a 20% rate of Inflation. Itcan be seen that its interest and gross margins are significantly higher than for Bank A andIts reported ROA and ROE are 1.75% and 35% respectively. Because it Is assumed that Ithas no "free equity", these are also its real ROA and ROE.
The results of Bank F depend crucially on the assumption that its structure of assetsand liabilities has not changed even though inflation accelerates from 5% to 20%.However, under high inflation, bank customers will try to economize on their noninterest-bearing demand deposits and switch their funds to other types of deposits, while banksmay start offering cash management and money market accounts. In countries, with nointerest rate controls, banks may also start paying interest on demand deposits at areasonable spread below time and savings deposits. If one assumes that half of demanddeposits are transferred to time deposits, then banks would lose substantially frominflation. The lower half of Table 4 shows Bank G with a less favorable deposit structure.Its ROA falls to 0.65% and its ROE to 13%.
Inflation may cause an increased use of banking services if customers make morefrequent bank visits to transfer funds across different accounts. This would cause a rise inoperating costs that banks would try to recoup by levying transaction fees. But inflationcan have an even bigger impact on operating ratios and bank profitability if it Involvesasset disintermediation and demonetization. Under such circumstances, banks wouldsuffer a loss of deposit and loan business but continue, for a while at least, to operatelarge branch networks and staff. Their equity capitalization ratios would increase becausetheir financial assets and liabilities would decline in real terms but their fixed assets wouldmaintain their real value. The impact on operating ratios would depend on the net effectof Inflation on their business mix, capital structure and noninterest revenues and expenses.
12
The impact of Inflation would also be greater if banks have 'free equity", the valueof which Is not hedged against inflation. Thus, in the examples of Table 4, if banks F andO have fixed assets equivalent to 2.5% of total assets, then the gains from revaluing fixedassets would add only 50 basis points to income. The real ROA, profit rstio and ROE ofBank F would fall to 1.25%, 2F 7% and 25% respectively, while those of Bank G iw '1-fall to 0.15%, 4.6% and 3%. liius, the combination of inflation losses from changes inproduct mix with the erosion of the value of 'free equity" can have a devastating effect o.1operating ratios and bank profitability.
2.6 Asset Valuation
There are many problems with the valuation of assets that affect banks In allcountries. For instance, the use of book rather than market values for instruments that arereadily traded, such as government securities, can distont trading incentives that may giverise to misleading operating results. Thus, banks with weak capital and profitability wouldhave an incentive to retain all securities that suffer a capital loss and sell all those thatshow a significant capital gain. By including the gains in their income statement, even asa nonrecurrent item, they would Increase their equity capital. In this way, both bankprofitability and equity capital may be artificially boosted while the quality of assets on thebalance sheet may deteriorate3.
The above policy of overstating profits and bank capital would be followed Incountries where banks are under regulatory pressure to boost their capital ratios. Incontrast, in cases where bank capital is strong, banks may follow the opposite policy ofselling depreciating securities to reduce their tax liabilities, while keeping appreciating onesin their balance sheets as a source of hidden strength.
Another way in which accounting policies may affect the true financial position ofbanks is through the undervaluation of assets due to a failure to adjust asset values totheir replacement cost. This approach would also tend to reduce depreciation charges andwould thus result in an overstatement of profits and an understatement of capital, so thatprofit ratios (ROEs) may be overstated on two counts.
On the other hand, accounting systems that allow banks to report depreciation andother reserves (for loan losses, pensions, etc) as liabilities rather than as asset offsets willtend to overstate total assets. The impact on operating asset ratios will then depend onthe nature of the reserves that are reported as other liabilities. If the reserves mainly coverdepreciation provisions, then both other assets and other liabilities will be overstated andoperating asset ratios will be reduced. Especially, interest and gross income margins aswell as operating cost ratios will be lower. However, operating income and equity ratioswill be unaffected.
3 It is argued that this practice has been extensively used by thrift Institutions in theUnited States in the 1 980s (see White, 1990). In Germany, banks are generally required toreport securities at the lower of cost or market price, although they also have the right undersome circumstances to report securities at cost (Deutsche Bundesbank, 1990).
13
Continental European banks tend also to report pension reserves and reserves forloan losses on their balance sheet. The impact of these reserves Is quite different fromthat of depreciation reserves. Pension reserves represent equitylike funds that can be.and are, invested In interest-earning assets. The impact of pension reserves will be toincrease the Interest and gross income margins as well as reported ROAs, though otheroperating ratios are unlikely to be affected.
The Impact of reserves for loan losses depends on whether they represent general orspecific provisions. General provisions have the same effect as pension reserves sincethey Imply no reduction in interest Income. But specific provisions should Involve asuspension of Interest accrual so that their effect would be more like that of depreciationreserves.
The ImDact ol Asset Valuation Rules
Bank Boverstatement of Other Assets and Other Liabilities
Amo ta LiabilitieLoans 52.2 11% Demand deposits 8.7 0%securities 13.1 9% Other deposits 52.2 7tinterbank 8.7 9% Borrowed funds 17.4 9%Fixed assets 4.3 0% Other liabilities 17.4 0%Other assets 21.7 0% Equity 4 0%Total 100.0 7.69% Total 100.0 5.22%
Oneratina Ratios OQR JInterest margin 2.47 79.2 57.4Noninterest income 0 65 iL it"Gross income 3.12 100.0 72.5Noninterest expenses 2.26 72.4 52.5Net income 0.86 27.6 20.0
Table 5 shows the case of a bank that overstates both its other assets and otherliabilities. The asset and liability structure as well as spreads and costs are the same asfor Bank A, except that Bank H is assumed to have an additional 15% of total assets inother liabilities and other assets. Equity falls to 4.3% and all other assets and liabilities areadjusted accordingly. Bank H reports lower operating asset ratios but Its operating incomeand equity ratios are identical to those of Bank A (minor discrepancies are due torounding). Banks In continental Europe tend to report reserves for depreciation as liabilitieson their balance sheet and this may partly explain their generally lower operating assetratios.
14
2.7 LonuProvnin
The treatment of provisions affects the balance sheet totals of banks, but the levelof provisioning impacts their reported profitability. Failure to suspend the accrual ofInterest on nonperforming loans will overstate interest revenues and the interest margin ofbanks, while failure to provide adequately for future loan losses will understate totalnoninterest expenses. Loan classification and provisioning are based on an assessment ofthe ability of borrowers to service their loans and are clearly subjective exercises.However, banks that fail to make adequate provisions, even when their customers are Infinancial distress and loan servicing is doubtful, overstate their profits as well as theirequity capital and total assets.
Although the impact of inadequate provisioning on bank operating ratios Is not indoubt, Its Importance in comparing ratios of different banks, especially across countries, Israther unclear. This is because provisioning is a subjective exercise and the need forprovisions can be hidden by informal rollovers and by companies borrowing from one bankto repay a maturing loan to another. In general, banks that report very low levels of lossprovisions are more likely than not to understate their provisions and overstate theirprofits.
Another problem with provisions Is that banks in some countries include their lossprovisions with other operating costs. This creates comparability problems that can beovercome only by considering total noninterest expenses together.
2.8 Hidden Reserve
An Issue that is closely related to provisioning policies is the use of hiddenreserves4. The problem with hidden reserves is not Inadequate provisioning as such, butrather the hidden nature of the provisions. The impact of hidden reserves on bankprofitability and reported operating ratios depends on whether hidden reserves are used tosmooth out annual fluctuations in bank profits or whether they are also used to build ahidden base of bank capital.
If hidden reserves are only used for smoothing purposes, their Impact on income andcost ratios will cancel out over longer periods, although they would hide fluctuations inannual profits and might make more difficult the detection of changes in trends. But Ifthey are used for building a hidden source of capital, then estimates of bank profits mustbe increased by the rise in hidden reserves over a particular period and bank equity capitalby the total volume of hidden reserves.
If a bank maintains its hidden reserves at a constant fraction of its reported equity,the return on reported equity and the total return on its true equity will be the same. The
4 Banks in some European countries, and especially Germany, the Netherlands,Switzerland and Luxembourg, are allowed by their supervisory authorities to use hiddenreserves as general contingencies against fluctuations in loan losses and profits.
is
true ROE will be higher than the reported ROE only If hidden reserves increase relative toreported equity. On the other hand, the true ROA of banks with hidden reserves will behigher than the reported ROA, because such banks will have a higher level of both trueprofits and true equity.
Table 6 shows the balance sheet and operating ratios of Bank 1, which has exactlythe same asset and liability structure as well as spreads and costs as Bank A, except that20% of Its equity is hidden. Hidden reserves represent 25% of its reported equity and areIncluded with other liabilities. The illustration assumes that hidden reserves are created byoverstating expenses by 0.20% of assets and thus increasing hidden reserves by 0.20%which is the same as the return on both reported and true equity. It can be seen thatalthough the interest and gross margins are unchanged, the ROA is lower at 0.80%compared to 1 % for Bank A. The true ROA would, of course, be I % if account Is takenof the overstatement of expenses. Also, the reported cost income ratio is higher sinceoperating costs are overstated while revenues are unchanged.
Table 6
The Impact of Hidden Reserves
Bank IHidden Reserves a Constant Fraction of Reported Bquity
Operating Ratios OAR OIR OERInterest margin 2.85 79.2 71.3Noninterest income 0.75 20.8 18.7Gross income 3.60 100.0 90.0Noninterest expenses 2.80 77.8 70.0Net income 0.80 22.2 20.0
This example shows how hidden reserves affect ROAs but not ROEs if the hiddenreserves do not change as a fraction of reported equity. It should, however, be noted thatthe interest and gross margins would be different if the hidden reserves are created byunderstating revenues.
2.9 ROE Analvsis
It should be abundantly clear by now that bank operating ratios are affected bydifferences in capital structure, business mix and accounting conventions. The effects of
16
many of these differences can only be assessed by detailed knowledge of the structureand practices of different financial systems. There are no easy shortcuts. However, thereIs one approach which highlights the effect of some of these differences. This is knownas the ROE analysis and is based on a combination of two simple identities. First, the ROEIs equal to the product of the ROA and bank leverago (i.e. the inverse of the equitycapitalization ratio); and second, the ROA Is equal to the product of the gross incomemargin (gross income as a proportion of total assets) and the profit ratio (net Income as aproportion of gross income).
Table 7 shows the ROE analysis for the stylized banks used in the precedingdiscussion. It should be remembered that by assumption the banks discussed in thedifferent examples operate with the same spreads between loan and deposit rates forsimilar lines of business. Their operating costs are also the same, except for banks D andE where the assumed operating costs reflect the high and low margin nature of theirbusiness respectively. The reported operating cost ratios are also different for banks Hand I but only because of the effect of accounting practices: in one case, they are lowerbecause of the overstatement of assets, while in the other they are higher becauseexpenses are overstated by the annual transfers to hidden reserves.
Table 7
ROE Analvsis
Profit Gross ROA Lever ROERatio Margin
Bank A 27.8 3.60 1.00 20.0 20.0
Bank B (high equity) 31.9 3.82 1.22 13.3 16.3Bank C (low equity) 22.8 3.37 0.77 40.0 30.8
Bank D (high margin) 18.9 5.30 1.00 20.0 20.0Bank E (low margin) 50.0 2.00 1.00 20.0 20.0
Bank F (inflation winner) 40.2 4.35 1.75 20.0 35.0Bank G (inflation loser) 20.0 3.25 0.65 20.0 13.0
Bank H (overstated assets) 27.6 3.12 0.86 23.3 20.0
Bank I (hidden reserves) 22.2 3.60 0.80 25.0 20.0
Table 7 shows clearly that banks with a high equity capital (and low leverage) havehigher profit ratios, gross margins and ROAs. However, their ROEs are lower, althoughthis may partly reflect their lower riskiness. The table also shows that high and lowmargin banks may have very different operating ratios and still be equally profitable andefficient. The table further highlights the potential distorting impact on bank ratios ofinflation as well as of asset valuation and other accounting practices.
17
2.10 SMads. Leveras ad latio
A question that is of particular concern in countries with high inflation regards theimpact of Inflation on average spreads. The question is whether ROAs in the region of 3%to 5% (or higher) and gross margins of 7% to 10% (or higher) can be explained by thelevel of Inflation. The ROE analysis can be used to shed light on this issue.
For any bank, the first identity used in ROE analysis states that the real ROE "r" Isequal to its leverage "g" times its real ROA 'a". or in algebraic terms,
r = g * a
Similarly, the nominal rate of return on equity "n" is equal to its leverage times thenominal return on assets "b"
n= g * b
With inflation 'p", the nominal return on equity is also equal to
n = {(0 +0 r) (1 + p)} -1I
so that the nominal return on assets "b" may also be given by
b = (1 +r) * 1 +o)) - 1
When inflation is zero, "b" equals "a". The last equation shows that the requirednominal ROA, representing the average spread or margin on all assets after the deductionof all costs, depends on the targeted real ROE, the level of Inflation and the degree ofleverage. A targeted real ROE of 10% would require a nominal ROA of 0.50% with zeroinflation and leverage of 20, but the required nominal ROA would rise to 0.78% with 5%Inflation, to 1.05% with 10% inflation and 2.15% with inflation of 30%. With a leverageof 10 instead of 20, the corresponding required nominal ROAs would be twice as high andwith a leverage of only 5, they would be four times as high.
The second identity used in ROE analysis stipulates that the nominal ROA "b" isequal to the product of the nominal gross income margin im" and the proflt ratio 'q'.
b= m * q
or
m= b/q
and
m = {(1 +r) * 1 +W)} - 1g q
18
The profit ratio is equal to (1-c), where "c" is the cost/income ratio based on totalcosts including all types of provisions. Thus, a high cost bank will have a low profit ratioand vice versa. A bank with a profit ratio of 20% would need a gross income margin thatIs 5 times its nominal ROA, but a bank with a 50% profit ratio would require a grossmargin of only twice its ROA. The profit ratio reflects the product mix and range andquality of services offered by a bank but It also depends on its operating efficiency. Table8 shows that a combination of high inflation, low geverage and high/cost operations mayrequire a very high gross Income margin in order to achieve a targeted real ROE of 10%.
Before concluding the general discussion of the determinants of bank operatirig ratiosIt Is worth stressing two points. First, the equity capitalization ratio used In this analysisdiffers from the risk-based capital ratio used under the Basle agreement. In the latter, thedenominator Is not total assets but risk-weighted assets, although off-balance sheet itemsare also Included, while the numerator may also cover non-equity-type capital, such assubordinated debt.
Second, the ROE analysis shows the strong Interrelationship between differentoperating ratios. For instance, a bank with an equity capitalization ratio of 6% and atarget ROE of 20% would need to earn a ROA of 1.2%. If such a bank also has a targetprofit ratio of 40% (i.e. a cost/income ratio of 60%), then It can achieve its targets with agross income margin of 3%. However, a bank may achieve the same ROE and ROA witha higher gross margin and a lower profit ratio. Thus, a hank with a gross margin of 5%would need a profit ratio of only 24%. Such a bank could operate equally profitably with acost/income ratio of 76%.
19
TABLE 8
SPREADS, LEVERAGE AND INFLATION
REQUIRED NOMINAL ROA FOR TARGETED REAL ROE OF 52 REQUIRED GROSS INCOME MARGINTARGETED REAL ROE OF 102 AND PROFIT RATIO OF 20X
Ill. THE EXPERIENCE OF BANKS IN SELECTED OECD COUNTRIES
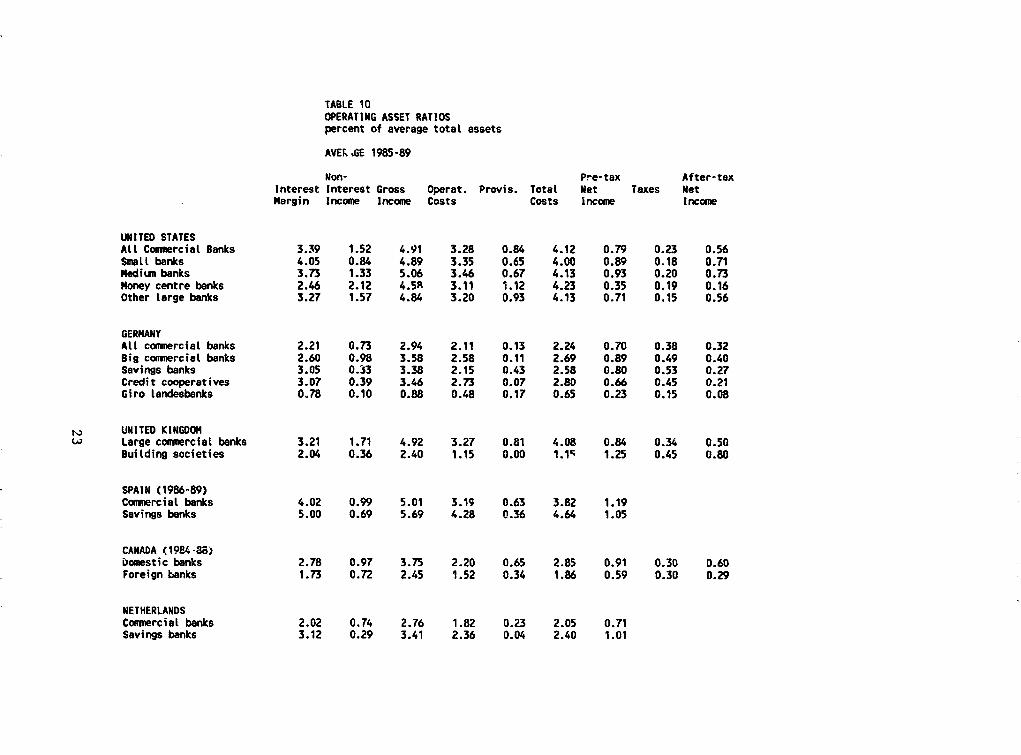
The operating performance of banks in some OECD countries is summarized inTables 9 to 14. Tables 9, 11 and 13 cover all commercial banks in 16 countries over theperiod 1980-86, while Tables 10, 12 and 14 cover various types of banks in 6 countriesover the period 1985-89. Tables 9 and 10 show operating asset ratios, Tables 1 1 and 12operating income ratios and Tables 13 and 14 operating equity ratios.
3.1 Qegratina Asset Ratios
Operating asset ratios relate bank revenues and expenses to average total assets.The main usefulness of operating asset ratios is that they are directly comparable to therates of Interest applied on loans and deposits. But operating asset ratios suffer frommany weaknesses. Their usefulness is seriously undermined by differences in capitalstructure, business mix, and accounting practices across countries, among individual banksand over time. Moreover, operating asset ratios tend to place an undue emphasis onbanks as financial intermediaries and holders of assets rather than as providers of financialservices.
Over the 1980-86 period the highest gross income margin was registered bycommercial banks in the UK with 4.93%, followed by Spanish, Norwegian, Italian andAmerican banks, all of which had gross margins in excess of 4% (Table 9). Finnish banksalso were very close to this group with a gross margin of 3.92%.
At the other end of the scale, the lowest gross margins were shown by banks inJapan and Luxembourg (less than 2%) and Switzerland and Belgium (less than 3%).Banks in Portugal, Canada, Germany, Sweden, France and the Netherlands had grossmargins between 3% and 3.5%.
The banks with the highest gross margins generally also had the highest interestmargins and total operating costs. Similarly, the banks with the lowest gross marginsreported the lowest interest margins and total operating costs. The close correlationbetween gross margins and total operating costs suggests that some banks specialize inhigh margin/high cost business while others focus on low margin/low cost business.
Banks in Japan and Luxembourg were involved to a greater extent than othercommercial banks in interbank and other wholesale banking, where both interest spreadsand operating costs were low and where the opportunities for generating noninterest feeswere limited. The last point Is highlighted by the low level of noninterest Income for banksfrom these countries. In contrast, although Swiss banks also engaged in low marginbusiness, they were able to generate significant fee income and thus their gross marginwas much higher than that of banks in either Japan or Luxembourg. The fee income ofSwiss banks mainly derives from their substantial fiduciary business.
Apart from Swiss banks, banks in Finland also posted a high :evel of noninterestIncome. Two possible explanations could be advanced for this. Finnish banks may haveresorted to charging their customers fees for various services in order to compensate for
21
TABLE 9OPERATING ASSET RATIOSpercent of average total assets
CCNERCIAL BAKS, AVERAGE 1980-86
Nan- Pre-tax After-taxInterest Interest Gross Operat. Provis. Total Net Taxes NetNargin Income Income Costs Costs Income Income
their low interest margin. But they may also have Provided a greater amount of fee-basedservices than banks in other countries. Until the recent financial liberalization, banks inScandinavian countries were encouraged to provide guarantees to large local corporationsto support their borrowings from the eurocurrency markets. They were also encouraged tooffer various seooices in the housing finance field but without undertaking the long-termfunding of residential mortgages. Both activities generated fees without increasing thebalance sheet totals of banks. It is notable that banks in Norway and Sweden also hadrelatively high levels of fee income.
Banks in several countries (Italy, Norway, Portugal, Spain and Sweden) hadunusually high levels of provisions. However, this item probably covered not onlyprovisions against doubtful debts, but also provisions for depreciation, pensions and losseson holdings of securities. In other countries, provisions for depreciation and pensionswould be classified under operating costs. In contrast, banks in Belgium and Japanshowed very low levels of provisions, which suggests that provisions in these countrieswere reported under operating costs. These differences in the accounting treatment ofprovisions imply that attention should perhaps be focussed only on total operating costs.
Table 10 presents the operating asset ratios of four types of commercial banks In theUnited States, several types of banks in Germany, and two types of banks in the UnitedKingdom, Spain, Canada and the Netherlands over the period 1985-895. The data showthat German giro landesbanks, the UK building societies, the Canadian foreign commercialbanks, the Dutch commercial banks and the German commercial banks had, in that order,the lowest gross margins. They also had the lowest interest margins and lowest operatingcostlasset ratios, although the order was slightly different for these ratios.
Thus, the correlation between the level of margins and the level of costs that wasfound in Table 9 for commercial banks in 16 OECD countries is confirmed for a moredetailed classification of banks in a smaller number of countries. This finding is furtherunderscored by the very lovw gross margins and other operating assst ratios of the girolandesbanks in Germany. These banks operate as the central clearing institutions for theGerman savings banks and specialize almost exclusively in interbank and wholesalebusiness.
American commercial banks operated with gross margins that were 200 basis pointsgreater than those of German commercial banks over the 1985-89 period. Moreover,theoperating ratios of US commercial banks increased during the 1 980s, whereas those ofGerman banks declined.
Among different types of American banks, the lowest gross m3rgin was registeredby the money center banks, which also had the lowest interest margin and lowestoperating costs. But money center banks reported very high levels of fee income, which isconsistent with their specialization in such services as trade and foreign exchange financeand their growing involvement in investment banking outside the United States.
5 The data for Spanish banks cover the period 1986-89 and those for Canadian banks theperiod 1984-88.
24
Worth noting also are the very high gross margins of the large UK commercial banksand the Spanish commercial and savings banks. These banks also continued to show highoperating costs.
American banks increased substantially their provisions in the secord half of the1980s, from 0.49% to 0.84%. For the money center banks, provisions reached astaggering 1.12% of average total assets. In contrast, German commercial banks reducedtheir provisions from 0.54% to only 0.13%. To a large extent, this reflected the earlierprovisioning against loans to developing countries by the more cautious German banks.But the loss provisions of American banks were inflated in recent years by their massivelosses and nonperforming loans in real estate loans and highly leveraged transactions. Thelarge UK commercial banks also experienced a big rise in their loss provisions.
Except for Canadian banks, the banks with the highest ROAs also had the highestgross margins in the early 1980s. At the other end of the scale, the banks with thelowest margins also reported the lowest ROAs, except for Swiss banks whlich showed arelatively high ROA, mainly because of their success in generating a high level of fe-income.
In the more recent period, most types of German banks as well as the UK buildingsocieties reported higher ROAs than the American commercial banks and the large UKcommercial banks, even though their gross margins were generally much lower. The ROAof US money center banks was particularly low. The breakdown of the correlationbetween high margins and higl ROAs should be attributed to the unusually high levels ofloss provisions experienced by commercial banks in the United States and the UnitedKingdom and the very special nature of the business of UK building societies. The patternstill held true for the Spanish commercial and savings banks and the German girolandesbanks.
3.2 Oneating Income Ratios
Operating income ratios relate revenues and costs to the gross income of banks.Like operating asset ratios, these ratios are also affected by differences in capital structureand accounting practices, but they are influenced less by differences in business mix.Three ratios are of particular importance: the share of fee income in total gross income,the cost/income ratio and the profit ratio, i.e the ratio of net income to gross income.
The structure of gross income is interesting because of the growing importance thatcommercial banks attach to the development of fee-based services. The share ofnoninterest income provides an indication of the extent to which banks are successful ingenerating income from fee-based services to offset the fall in income from the narrowingof interest rate spreads.
The securitization of corporate lending and household finance has resulted in theremoval of a growing volume of bank loans from bank balance sheets. It has alsostimulated the growth of noninterest income as banks have sought to provide varicus
25
services linked to the issue of commercial paper and other securities by the corporatesector and to the origination of mortgage loans and consumer credit.
Fee income is also generated in other more traditional bank services linked withforeign trade, bank guarantees, securities transactions and mergers and acquisitions.
Finnish and Swiss banks had the highest noninterest Income ratios of 53% and 47%respectively durirg the period 1980-86 (Table 11). UK, Swedish and Norwegian banksposted ratios in excess of 30%. Rather surprisingly, American and Canadian banksreported lower relative levels of fee income than German and Italian banks. It is not clearwhy Canadian banks did not develop further their fee-based services, but in the case ofthe American banks, the low ratio is due to the part played by the large number of smalllocal banks.
In the more recent period between 1985 and 1989, American commercial banksraised the contribution of noninterest income to 31 % of gross income (Table 12). Amongdifferent types of banks, the money center banks reported fee income equal to 46% ofgross income. They were followed by the group of other large banks, which mainlyincludes the so-called super-regionals, with 32%, the medium-size banks with 26% andthe small local banks with 17%.
In contrast to American banks, the German commercial banks did not show anincrease in their reliance on fee-based services. Moreover, noncommercial German banksshowed a very low contribution from fee-based services. The large UK commercial banks,the Canadian banks and the Dutch commercial banks showed above average levels ofnoninterest income.
Because of the general correlation between marginswand costs, the cost/income ratiodoes not show much variation across banks, despite some substantial differences inproduct mix. With the exception of banks in Switzerland and Luxembourg on the onehand, and Belgium and Finland on the other, banks in most countries reported operatingcost/income ratios in the region between 60% and 70% in the early 1980s. Banks withratios closer to the lower end of this range tended to include some provisions, such asthose for depreciation and pensions, with loss provisions rather than with operating costs.
The total costs to income ratio, which covers both operating expenses and all typesof provisions, shows a much narrower variation. Banks in 10 countries reported totalcost/income ratios in the region between 79% and 85%. Banks in Finland, France andPortugal had ratios slightly in excess of 85%, while banks in Japan, Switzerland andLuxembourg had ratios below 79%.
The pattern in the more recent period for banks in six countries was somewhatdifferent, especially for the total cost to income ratio. Because of the generally lowerlevels of provisions, German commercial banks reported total cost/income ratios of around76%. The savings banks also exhibited a similar ratio, although in their case, provisionswere higher but operating costs much lower, a pattern that was even more pronounced forthe giro landesbanks.
26
The large structural differences in the cost/income ratios of German savings banksand credit cooperatives is worth noting. Savings banks enjoyed substantially loweroperating costs, although these were largely, but not completely, offset by significantlyhigher levels of provisions. Three possible explanations can be advanced for this. Thefirst Is the possibility of substantial differences in accounting practices even amongdifferent types of banks in the same country. The second explanation is that, even thoughboth types of banks specialize in retail banking and serve the banking needs of smallerfirms, credit cooperatives are operationally less efficient than savings banks. The thirdexplanation Is that credit cooperatives are better at monitoring the performance of theircustomers and thus at avoiding loan losses than the savings banks, but their greatermonitoring effort is reflected in higher operating costs. Without more detailed knowledgeof the operations and accounting practices of these banks, it is not possible to say whichexplanation Is more likely to be valid.
Spanish commercial banks were able to report low total cost/income ratios at 76%.but commercial banks in the United States and the United Kingdom as well as the Spanishsavings banks had ratios between 80% and 95%, except for the US money center bankswhich posted a very high ratio of 92%. The ratio of provisions to gross Income at 24%was 8 times as large as the corresponding ratio of the big German banks.
Finally, the low cost/income ratio of Canadian commercial banks and, especially theUK building societies, are worth stressing. At 48%, the cost/income ratio of buildingsocieties Is at a level that most commercial bankers can only dream about. Buildingsocieties combine low margins with low costs that leave them with a very high profit ratioof 52% of gross Income, almost twice the level of any other group of banks shown inthese tables. The explanation for this remarkable performance lies in their specialization ina market with a well established demand for a proven product and the efficient offer of asimple range of services.
The profit ratio is equal to one minus the total cost/income ratio. It ranges between15% and 25% of gross income for most types of banks. Major exceptions are, on the onehand, the UK building socie les, which as already noted achieved a remarkable 52% profitratio, and, on the other, the US money center banks, which find themselves at the otherend of the spectrum with a profit ratio of only 8%.
27
TABLE 11OPERATING INCOME RATIOSpercent of gross income
COMMERCIAL BANKS, AVERAGE 1980-86
Non- Pre-tax After-taxInterest Interest Cross operat. Provis. Total Net Taxes NetMargin Income Income Costs Costs Income Income
Operating equity ratios relate revenues, costs and profits to average equity. Theyare not affected by differences in capital structure and business mix but, like the otherratios, they can be heavily distorted by differences in accounting practices.
Traditionally, analytical attention has focussed on the ROE, which is the ratio of notincome (before or after taxes) to average equity. The ROE is about the bottom line and isthe one measure that should matter most in analyzing bank performance. Some analystspay more attention to the ROA but, as already argued above, this is distorted by the levelof equity capitalization ratio. On the other hand, although the ROE would be higher for amore highly leveraged bank, this could merely reflect the higher risks faced by such banksand should not be taken as an indication of higher efficiency.
Two measures that provide an indication of the higher risks faced by more highlyleveraged banks are the gross income to equity ratio and the total costs to equity ratios.These two ratios wculd indicate the extent of overtrading or undertrading of banks andwould thus merit greater attention when analyzing the performance of different banks.
The equity capitalization ratios of banks varied over the 1980-86 period from a high7.9% for Spanish banks and 7.1 % for Finnish banks to a low 1.4% for Swedish banks and2.4% for French and Japanese banks (Table 13). In the more recent period, the smallAmerican commercial banks and the Dutch savings banks had the highest equitycapitalization ratio at over 8% (Table 14).
The gross income and total costs to equity ratios strongly suggest that Swedishbanks were heavily overtrading in the early 1980s with ratios in excess of 200%. In fact,because of their very low level of equity, Swedish commercial banks reported a ROE of34%. even though their ROA was only 0.47%. Other banks with high Income and cost toequity ratios included the French, Italian, UK and Norwegian banks. The first two hadlrather low equity levels but the last two were rather highly capitalized.
At the other end of the scale, banks in Luxembourg and Switzerland, and to a lesserextent, Spain and Portugal had low income and cost to equity ratios, suggesting that thesebanks were probably undertrading. But banks in these countries generally reported lowROEs, a finding that Is rather surprising in the case of Swiss banks. The highest ROE wasdisplayed by Swedish banks, followed by UK and Japanese banks.
The operating equity ratios for the more recent period 1985-89 underscore thedisastrous performance of American money center banks (Table 14). These banks hadrelatively high levels of trading with a gross income to equity ratio of 100%, but their costperformance, and especially their loss provisions, caused their pre-tax ROE to be as low as8% and their after tax ROE to be a paltry 3.5%. After allowing for Inflation, but withouttaking Into account revaluation gains on fixed assets and trade investments, the real ROEwas a paltry 0.3% (see below, Table 15). The small local American banks displayed lowlevels of trading v: Ith ratios of 60% and 49% but their ROE, though higher than the moneycenter banks, was low by comparison to European commercial banks.
30
TABLE 13OPERATING EQUITY RATIOSpercent of average equity
COMMERCIAL BANKS, AVERAGE 1980-86
Non- Pre-tax After-tax MemoInterest Interest Gross Operat. Provis. Total Net Taxes Net EquityMargin Incare Income Costs Costs Income Income Ratio
Among German banks, the giro landesbanks had low trading ratios as might beexpected, though rather surprisingly they also showed a low ROE. The income and cost toequity ratios of the other banks were generally in the middle range and their ROEs wererespectable but not too high.
The performance of UK building societies is again worth noting. These institutionsgenerally had low levels of Income and cost to equity ratios, suggesting a low level oftrading, but because of a better containment of costs (their cost to equity ratio was by farthe lowest among all types of institutions reviewed in this paper), their ROE was a quitehigh 29%.
The data on Tables 13 and 14 show the nominal ROEs for different banks withouttaking account of differences in Inflation rates. A full Inflation adjustment of nominalraturns would require an estimate of the revaluation gains on fixed assets, which are likelyto be large for banks with extensive branch networks, as well as on marketable securitiesfor those banks that report their securities at the lower of cost or market value. Such dataare not readily available.
Table 15 reports data on real ROEs on a pre-tax and after-tax basis by adjustingnominal returns by the average GDP deflator for each country. Although this is anincomplete adjustment, it provides an indication of the monetary correction that isnecessary In different countries. Thus, Spanish banks which report high nominal rates ofreturn, are shown after the adjustment to have moderate levels of real profitability. Incontrast, the UK building societies, German savings banks, and German, Dutch andCanadian commercial banks report high real rates of return. Worth noting are the very lowreal after-tax rates of return of American money center banks and foreign banks InCanada.
33
Table 15
Impact of Inflation
Commercial and Other Banks, 1985-89
Pro After Pro AfterTax Tax Inflation Tax TaxNominal Nominal Rate Real RealROE ROE ROE ROE
There are a number of analytical and policy issues that arise from the precedingdiscussion of bank operating ratios. Are the observed differences In operating ratiosmerely the result of differences In capital structure, business mix and accountingconventions or do they reflect, at least In part, differences in efficiency? What is thecorrelation between different ratios? Is there a combination of ratios that could be mostuseful In summarizing the performance of banks In different countries?
Moreover, two of the most striking results of the analysis of bank operating ratiosare the significant differences In performance between American and German banks on theone hand and between the large UK commercial banks and building societies on the other.In the context of the discussion of the determinants of bank operating ratios, twoquestions of wider interest arise. First, are American banks really so much less efficientthan German banks as their respective operating ratios suggest? And, second, whatspecial factors could explain the substantial differences In performance between UKcommercial banks and building societies?
Finally, there Is the question of what are the Implications of the approach and resultsof this paper for analyzing the performance of banks In developing countries.
4.1 ROE and Covariane Analysis
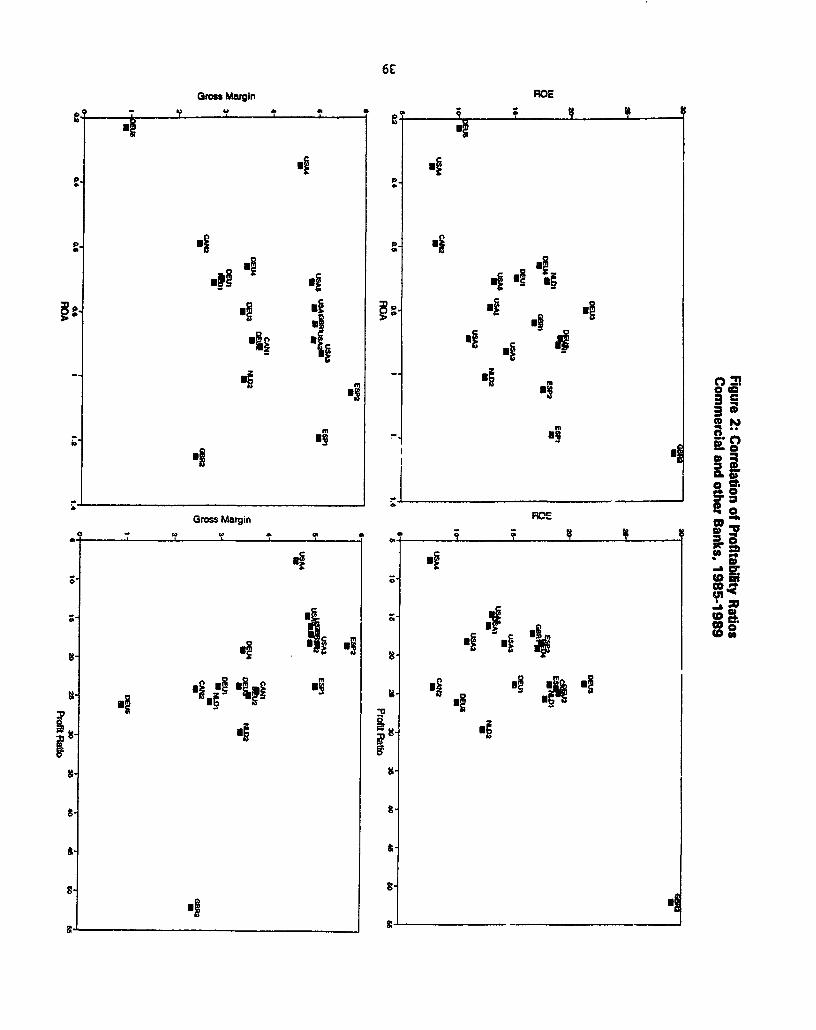
In terms of the first set of questions, a ROE analysis provides a combination of ratiosthat may best summarize the variuus operating ratios and may be most useful in analyzingdifferences In performance across groups of banks or across countries. The ROE analysisof Tables 16 and 17 brings together in a simple tabulated form, not only the ROE and ROAbut also the leverage, gross margin and profit ratio of different groups of banks.Moreover, although not shown explicitly, the total cost/asset and total cost/income ratioscan be easily Inferred from the tables. Table 16 shows the ROE analysis for the period1980-86 and Table 17 for the period 1985-89. The correlation between profitability ratiosis shown In Figures 1 and 2.
Table 16 shows clearly that both banks with low gross margins and low ROAs(Japan, Sweden) and banks with high gross margins and high ROAs (United Kingdom) canhave high ROEs. The table also suggests that countries with fragmented banking systems,such as the United States, Norway and Italy where there are large numbers of banks withregional specialization, tend to have higher operating ratios than countries with moreconsolidated banking systems, such as Canada, the Netherlands and Sweden, where thereis a smaller number of banks with nationwide operations. However, this pattern does notapply In all cases since the United Kingdom, and to a lesser extent, Spain haveconsolidated banking systems but their commercial banks exhibit high margins.
Table 17 summarizes the performance of banks in different countries In the morerecent period. The contrasting experience of money center banks and small and mediurnm-size banks in the United States is clearly highlighted as is that between commercial banks
35
Table l6
ROE Analysis
Commercial Banks, 1980-86
Profit Gross ROA Lever ROERatio Margin
Belgium (BEL) 17.0 2.18 0.37 40.7 15.0
Canada (CAN) (1982-86) 21.3 3.33 0.71 23.4 16.6
Finland (FIN) 13.3 3.92 0.52 14.1 7.4
France (FRA) 12.3 3.17 0.39 42.6 16.6
Germany (DEU) 18.8 3.30 0.62 24.3 1S.1
Italy (ITA) (1980-85) 17.2 4.42 0.76 26.1 19.8
Japan (JPN) 28.2 1.70 0.48 42.4 20.3
Luxembourg (LUX) 23.5 1.32 0.31 31.2 9.7
Netherlands (NLD) 16.2 3.02 0.49 29.0 14.2
Norway (NOR) 15.0 4.68 0.70 21.6 15.1
Portugal (PRT) 14.0 3.42 0.48 16.6 8.0
Spain (ESP) 14.8 4.73 0.70 12.7 8.9
Sweden (SWE) (1981-86) 14.6 3.22 0.47 73.0 34.3
Switzerland (CRE) 27.6 2.52 0.69 16.9 11.7
United Kingdom (GBR) 20.5 4.93 1.01 20.9 21.1
United States (USA) 20.6 4.33 0.89 16.7 14.8
36
Grow Margin ROE
P. I 0! . t
c, 1 XI X I I 1
a- 2 P -
91~I
o 0 oU! c
_ I _. _ IfCs3ross Margin ROE n<
; I! eI
- I tr 1
X E X !~~U
f § Z :_ S~~~~~~~~~~~~~~~~~~8 8 _ ~~~~~~~~~~~~~~~~~~~~~~~~~~~~~~~~~~~~~~~I
EI~~~~~~~~~~~~~~ 4 ~ ~ ~ ~ ~~~4I l lE 1~~~~~~~~~~~~~~~~~~~~~~~~~~~~~ j C '
G3ross Margin RO_ E
a. - a a v ,-0 B
Eji~~~~~~t
S il uEelE lilS l Z B |s
S l:a"
g
and building societies in the United Kingdom. commercial and savings banks in theNetherlands and Spain, and domestic and foreign commercial banks in Canada.
A simple covadiance analysis shows the degree of correlation between various bankoperating ratios. Table 18 summarizes the correlation coefficients for the ratios that areincluded in the ROE analysis, except that the equity capitalization ratio Is used instead ofits inverse. A clearly different pattern characterizes the data of the two different periods.This may reflect a change over time in the underlying performance of banks but it mayalso be due to differences in the characteristics of banks included in the two samples.
For the 1980-86 period, the data show that the ROE has a high negative correlationwith the equity capitalization ratio but is not closely linked with either the ROA, grossmargin or profit ratio. There is a strong positive correlation between the equitycapitalization ratio and both the ROA and the gross margin and especially between thegross margin and the ROA. A very high correlation (not shown in the table) also existsbetween the gross margin and the cost/asset ratio (0.99).
In the 1985-89 period, the matrix of correlation coefficients is substantially different.In the first place, the ROE is now highly and positively correlated with the profit ratio(0.68) and the ROA (0.67). Its negative correlation with the equity capitalization ratio ismuch reduced, The gross margin is less well correlated with the ROA, while in contrast,the profit ratio and ROA exhibit closer positive covariance. In general, the gross marginand equity capitalization ratio are less well correlated with other variables in the morerecent period. Note, however, that the gross margin and total cost/asset ratio continue tohave a very high correlation coefficient of 0.98.
As already noted, it is not clear whether the significant change in the correlationpattern of different operating ratios reflects a change in performance, resulting from agreater emphasis on profitability and smaller variation in equity capitalization ratios orwhether It is simply the result of sample differences. However, the covariance analysislends support to the argument that high gross margins, cost/asset ratios and ROAs are notnecessarily indicative of either high inefficiency or high profitability, but may mainly reflectthe business mix and capital structure of different banks.
4.2 Differences between American and German Banks
Table 19 shows the operating ratios of all commercial banks in the United States andGermany for two periods - 1980-86 and 1985-89 and for the money center banks and bigGerman banks for 1985-89.
German banks report much lower gross margins and cost/asset ratios than theirAmerican counterparts. The difference in gross margins for all commercial banks is almost200 basis points in the more recent period, while that between big banks is 100 basispoints. Differences in operating costs are less pronounced, while the profitability ofAmerican banks is much lower in the more recent period because of their very large lossprovisions.
Although German banks may indeed be more efficient than American banks, thereare a number of factors that may explain at least some of the difference in performance.The first such factor relates to their different equity capitalization ratios. US commercialbanks have higher capitalization than German ones. In the more recent period thedifference is just over 1.50% of total assets. To achieve the same ROE, American bankswould require a ROA of 0.93 against 0.70 for German banks. However, the capitalstructure of large banks is, if anything, the reverse, with the big German banks reporting aslightly higher level of equity than American money center banks.
The second factor relates to their business mix. American banks engage to a greaterextent in loan securitization and fee-based services than German banks. In addition,American households place a greater proportion of their financial assets in mutual fundsand marketable securities as well as in contractual savings than German households.Thus, German banks may be able to generate a greater volume of business from a givencost base (including branch networks and staff) than American banks. Differences inbusiness mix may be particularly important for the comparison of operating ratios of largebanks since money center banks in the United States generate almost half of their grossIncome from fee-based services.
German banks operate a much larger branch network in relation to population thanUS banks, both on an individual bank basis and for the system as a whole. Branch densityis over 750 branches per million people in Germany against 450 branches in the UnitedStates. Moreover, like their counterparts in other European countries, they offer a morecomplete range of payment services, with electronic payments, especially direct debits anddirect deposit of payroll and other credit transfers, representing 58% of all paymentsagainst only 3% for the United Stav.es. German banks also operate as universal banks,
acting as stockbrokers as well as issuing and underwriting houses in the securitiesmarkets. The implication of offering a more extensive range of financial services is thatcustomers have less need to maintain separate account facilities with independentstockbrokers, mutual funds or money market mutual funds as In the United States.German banks may benefit from both economies of scale and scope.
In the United States, the advent of mortgage securitization has a large potentialimpact on bank operating ratios. Traditionally, mortgage business has been a low margin,large value noncorporate line of business that helped lower operating ratios, while makinga significant contribution to profits, especially if banks were able to avoid losses frominterest rate mismatching and loan defaults. Mortgage securitization removes low margin,large value business from bank balance sheets and also generates hefty origination andservicing fees that tend to inflate noninterest income. Operating ratios for a bank thatengages in mortgage origination and securitization are therefore raised on two grounds:first, because the mix of business that is reported on the balance sheet is tilted towardshigh margin business and, second, because noninterest operating costs and revenues arehigher for a given asset base.
Mortgage-backed securities in the United States passed the 1 trillion dollar mark InSeptember 1990 and now represent 40% of all residential mortgages. Whether thegrowth of mortgage securitization explains the higher operating ratios of American banks Isdifficult to say. It should, however, be noted that the potential Impact of securitization onoperating ratios is weakened by the fact that commercial banks hold between 15% and20% of outstanding mortgage-backed securities.
Accounting differences may also contribute to the lower ratios reported by Germanbanks. For instance, German banks make use of hidden reserves, which may result in anunderstatement of reported profits and equity. Moreover, their fixed assets and holdingsof securities are reported at cost or market value, which also understates both equity andtotal assets. On the other hand, German banks report on their balance sheet pension anddepreciation reserves, which tend to overstate total assets.
If the large German banks have hidden reserves that are equal to half their reportedequity and If they maintain hidden reserves at a constant fraction of equity, then their trueequity would be 7.02%, instead of 4.68%, of assets and their ROA would be 1.33%rather than 0.89%. The difference of 0.44% would represent the average annual transferto hidden reserves. Assuming that this is split equally between an understatement of netinterest revenues and an overstatement of noninterest expenses, the gross margin wouldbe higher than reported at 3.80%, but the ratio of total operating costs to assets would belower at 2.47%. Thus, the use of hidden reserves Is likely to understate the operatingperformance of German banks, although under the assumptions used their reported ROEwould be the same as the true ROE.
The balance sheet and Income statement of German banks would also need to beadjusted for the pension and depreciation reserves that are carried on the balance sheet. Iftotal assets are overstated by 15%, then their effective gross margin would be 4.37%,their total cost ratio 2.84% and their ROA 1.53%. But as their effective equitycapitalization ratio would also rise to 8.08%, their ROE on equity would still be equal to
43
19%. It is interesting that these adjustments bring the gross margin of the big Germanbanks much closer to that of the big American money center banks, although theiroperating costs are still significantly lower. Moreover, their superior loan loss experiencewould be totally unaffected by these adjustments.
Of course, it Is very difficult, If not impossible, to tell how realistic are theassumptions that hidden reserves represent half the reported equity of German banks andpension and depreciation reserves overstate assets by 15%. However, these assumptionsprovide an indication of the orders of magnitude involved if the differences in operatingperformance between German and American banks are to be explained by differences inaccounting practices.
Before concluding this section it is worth noting that loss provisions amounted to24.5% of the equity of American money center banks. These are five-year averages,which suggests that either American banks have weak credit departments or competitionis causing a deterioration of credit standards. The operating margins of money centerbanks are quite strong, implying that a return to sounder loan books and more normallevels of provisioning could lift their ROEs back to very respectable levels.
4.3 Differenges between UK Commercial Banks and Butling Societies
The difference in operating ratios between the large UK commercial banks and thebuilding societies (Table 20) is interesting because it Is unlikely to be caused by differencesin accounting conventions or capital structure. Both groups of institutions follow broadlysimilar accounting rules, while their equity capitalization ratios are not very dissimilar -5.03% for the commercial banks against 4.29% for the building societies. Thus, thedifferences in operating ratios and performance can be largely explained by differences Inbusiness mix or in operating efficiency.
As already remarked above, building societies are extremely efficient institutions.They have cost/income ratios of less than 50% and a gross margin of only 2.40%, whileboth their ROA and ROE are very high at 1.25% and 29% respectively. These are amongthe best ratios reported by any group of institutions reviewed in this paper. The secret fortheir success appears to lie In their specialization In a market with a strong demand for aproven product and In their ability to offer a simple range of ancillary services thatcomplement their main product. Although societies have met increasing competition fromcommercial banks and specialized mortgage corporations in the UK market, they have beenable to hold onto their dominant market share.
Building societies have long offered some basic payment services attached topassbook savings accounts, but they have not been burdened with the offer of labor-intensive checking account services. In recent years they have expanded their paymentfacilities, introducing a full range of card-based and checking account services, but theirshare of the market for household payment services is still small and they do not have toIncur the operating costs of servicing large numbers of merchants and retailers as do thecommercial banks. In recent years, building societies have diversified into other fields,such as limited consumer credit and commercial lending, insurance brokerage and
44
Table 20
Oneratina Ratios of UK commercial banks and buildina societiex
1985-89
Commercial BuildingBanks Societies
Oneratin@ asset ratios
Interest margin 3.21 2.04
Noninterest income 1.71 0.36
Gross income 4.92 2.40
Operating costs 3.27 1.15
Loss provisions 0.81 --
Total costs 4.08 1.15
ROA 0.84 1.25
Equity capitalization 5.03 4.29
operatina income ratios
Interest margin 65.2 85.0
Noninterest income 34.8 15.0
operating costs 66.5 47.9
Loss provisions 16.5 --
Total cost. 82.9 47.9
Profit ratio 17.1 52.1
Oneratina equitv ratios
gross income 97.8 55.9
Total costs 81.1 26.8
ROE 16.7 29.1
45
underwriting, and real estate agency business. The larger societies have taken advantageof expansion opportunities in continental Europe, especially in countries with lessdeveloped housing finance markets, such as Italy, Spain and France.
Because of their diversification into high margin business, they have been able toincrease their overall margins. However, these developments In their business mix arelikely to increase their operating cost ratios, while their remarkable record of low loanlosses may also be marred, especially if they are forced to lower their credit and prudentialstandards.
The high operating ratios of the large UK commercial banks, effectively the large fourclearing banks, can be explained, largely but perhaps not fully, by their rather uniqueproduct mix. Historically, the UK clearing banks have specialized in providing short-term,self-lquidating loans. They have not engaged in medium and long-term lending to Industryor In providing mortgage finance to their personal customers. Despite building very largebranch networks, their share of household deposits and household loans has been low.
Their reluctance to engage in mortgage lending was premised on the adage that It IsImprudent to 'borrow short and lend long". Since the mid-I 970s, the clearing banks havechanged their approach to term lending, first by providing variable-rate medium-term loansto Industrial and commercial companies and then by engaging on a large scale in variable-rate housing finance. However, residential mortgages still represented less than 11 % oftotal domestic assets in 1989.
Apart from focussing on short-term, high margin business, the UK clearing bankshave also specialized in operating a nationwide paper-based payment and clearing system.This has taken longer to automate and replace with electronic payments than the paymentsystems of other European countries (electronic payments now represent about 25% of allnoncash payments - well below the levels achieved in Germany, the Netherlands andJapan though well above the United States). In addition to offering extensive paymentservices and operating the clearing system on their own with little operational Involvementfrom the Bank of England, the UK clearing banks have also provided extensive and labor-Intensive services in foreign exchange related business, including export/importdocumentary credits. Thus, the high operating ratios of the large UK commercial banksare a direct result of the high margin/low asset value business mix.
Nevertheless, their Involvement in high margin business may not explain fully thepersistence of their high operating ratios. The UK clearing banks have been Impeded intheir efforts to automate and modernize their operations by the sheer scale of their branchnetworks and staff levels. With an average of 3,000 branches and well over 60,000 staffcomplements, their plans to computerize their service delivery systems have Involvedmuch greater capital out sys, more extensive retraining and greater dislocation ofmanagement practices tnan for banks in most other countries. In contrast, the buildingsocieties have expanded their networks In the 1 960s and 1970s and have been able toimplement automation plans more effectively.
46
4.4 ImRlications for Develonina Countnes
As already noted in the introduction of this paper, banks in developing countriesgenerally operate with wide interest spreads. High spreads may be caused by governmentregulations (such as onerous reserve requirements and other forms of bank taxation), highIntiatlon, high loan losses and high costs and profits due to operating inefficiencies anduncompetitive behavior. A detailed examination of bank operating ratios in developingcountries Is beyond the scope of this paper". However, the discussion of these issues forbanks in developed countries has a number of Implications for analyzing bank operatingratios in developing countries.
The first concerns the comparability of operating cost data across banks that offersubstantially different types of services. Business or product mix is one of the mostImportant determinants of bank ratios7. Banks in developing countries generally offer anarrower range of services at a lower level of quality. Allowing for this, and the fact thatlabor costs are also generally lower in such countries, both their cost/asset andcost/income ratios should be smaller than those of banks In developed countries thatprovide a wider range of services of higher quality.
However, the data contained In Hanson and Rocha show that there are very fewdeveloping countries where cost/asset ratios are lower than those of developed countries.One example Is Malaysia where commercial banks are reported to have a cost/asset ratioof around 1.3% (Hanson and Rocha, p. 25). Banks in most other developing countriesoperate with cost/asset ratios of between 2.0 and 3.5%, except for high inflationcountries where cost ratios are well in excess of 4%.
The point of this analysis is that even a cost/asset ratio of 2% to 3% may be toohigh given the narrow range and low quality of services offered by banks in developingcountries. The relatively high costs may be explained by operating inefficiencies (e.g.limited use of modern technology), by induced overstaffing or by the operation of toomany uneconomic branches. The reasons may vary from country to country but the factremains that the operating ratios of commercial banks in developing countries should becompared with banks that offer a broadly similar range of services.
The second major implication concerns the impact of inflation. Banks operating incountries that suffer from high inflation exhibit very high margins and cost ratios. Asdiscussed In Hanson and Rocha (p 11), there are three reasons for this. First, banksemploy more staff because of the increased volume of paperwork. Second, chronicinflation may lead banks to compete for low cost deposits by expanding their branchnetworlks. Third, Inflation may cause bank disintermediation which lowers the real value ofassets while operating costs may rise. Disintermediation also affects bank operating cost
' Hanson and Rocha (1986) provide a comprehensive analysis of bank spreads andintermediation costs in 16 developing and 10 developed countries.
7 The Importance of product mix is highlighted in Hunter and Timme (1990), who discusschanges in employment patterns among the world's largest banks.
47
ratios by affecting the capital structure of banks. Under high inflation, the replacementvalue of fixed assets prevents the :osion of bank equity capital and leads to a big increaseIn the equity capitalization ratio of hanks. But the "free equity' of banks would be erodedunder high inflation so that banks may earn very high spreads In nominal terms bit achievea very low and sometimes negative real ROE.
The third implication concerns the impact of loan provisioning policies. As notedabove, banks in some European countries are allowed by their supervisory authorities tomaintain hidden reserves. The Impact of hidden reserves on bank profitability andoperating ratios depends on whether they are used to smooth out fluctuations in annualprofits or to build up a hidden source of capital. In developing countries, the problem isusually one of hidden losses rather than of hidden reserves. Failure to provide adequatelyfor nonperforming loans and to write off loan losses is a widespread problem among banksIn developing countries. In some countries, making proper allowance for such provisionsmay wipe out completely not only the annual profits of banks but also their entire equitycapital. In some countries, nonperforming loans may be severa! times reported bank equity(World Bank, 1990a. p. 53).
In conclusion, a main argument of this paper is that comparinq bank performanceamong banks from different countries, especially across developed and developingcountries, is fraught with great difficulties. Considerable care must be taken to allow fordifferences in product mix, capital structure, accounting conventions and especiallyInflation rates before drawing firm conclusions. The use of standardized ratios can behelpful In highlighting unusual patterns but such ratios cannot substitute for detailedknowledge and understanding of local conditions and practices.
48
REFERENCES
Banco de Espana (1990): 'La cuenta de resultados de bancos y caiss de ahorro en 1989".Boletin Economico, April.
Bank of England (1990): Banking Act Report 1989/90, London.
Broker, Gunther (1988): Bank Profitability Trends, OECD, mimeo.
Deutsche Bundesbank (1990): "The Profitability of German Banks in 1989". MonthlyReport, August.
Duca John and Mary McLaughlin (1990): "Developments Affecting the Profitability ofCommercial Banks". Federal Reserve Bulletin, July.
Hanson, James and Roberto Rocha (1986): High Interest Rates. Spreads, and the Costs ofIntermediation, World Bank, Industry and Finance Series, Volume 18.
Hunter, William and Stephen Timme (1990): "Employment in the World's Largest Banks",Economic Review, Federal Reserve bank of Atlanta, January/February.
World Bank (1990a): Financial Systems and Development, World Bank, Policy andResearch Series, PRS 15.
World Bank (1990b): The Romanian Financial System in Transition, World Bank, CECFP,mimeo, November.
49
EPalicy Reasearch Working Paper Selries
Contactv1 Ahx am fo "
WPS785 How Did the Asian Countries Avoid Ishrat Husain October 1991 S. King-Watsonthe Debt Crisis? 31047
WPS786 Fiscal Policy for Managing Sadiq Ahmed October 1991 B. PrasertwareeIndonesia's Environment 82477
WPS787 Private Investment Under Macroeco- Klaus Schmidt-Hebbel October 1991 S. Jonnakutynomic Adjustment in Morocco Tobias Muller 39074
WPS788 How Expectations Affect Reform Francesco Daveri October 1991 S. Jonn. kutyDynamics in Developing Countries 39074
WPS789 Intrahousehold Inequality and the Lawrence Haddad October 1991 J. SweeneyTheory of Targeting Ravi Kanbur 31021
WPS790 Reforming and Privatizing Hungary's Esra Bennathan October 1991 B. GregoryRoad Haulage Jeffrey Gutman 33744
Louis Thompson
WPS791 Measuring Real Exchange Rate Lant Pritchett October 1991 K. CabanaInstability in Developing Countries: 37947Empirical Evidence and Implications
WPS792 Reducing Labor Redundancy in Jan Svejnar October 1991 B. GregoryState-Owned Enterpri,as Katherine Terrell 33744
WPS793 Decollectivization and the Karen M. Brooks October 1991 C. SpoonerAgricultural Transition in Eastern and 30464Central Europe
WPS794 How Do National Policies Affect William Easterly October 1991 R. MartlinLong-Run Growth? A Research Robert King 39065Agenda Ross Levine
Sergio Rebelo
WPS795 Economic Stagnation, Fixed Factors, William Easterly October 1991 R. Martinand Policy Thresholds 39065
WPS796 Excess Liquidity and Monetary Gerard Caprio, Jr. October 1991 W. PitayatonakarnOverhangs Patrick Honohan 37666
WPS797 Using Field Visits to Improve the Richard Heaver October 1991 0. NadoraQuality of Family Planning, Health, 31091and Nutrition Programs: A Supervisor'sManual
WPS798 Agriculture's Decline in Indonesia Will Martin October 1991 M. SanchezSupply or Demand Determined? Peter G. Warr 33731
WPS799 Growth in Open Economies Sergio Rebelo November 1991 R. Martin39065
Policy Research Working Paper Series
Contact
Too AuAbg '°r Oa
WPS800 The Legal Framework for Private Cheryl W. Gray November 1991 CECSESector Development in a Transitional Rebecca J. Hanson 37188Economy: The Case of Poland Michael A. Heller
Peter lanachokovYoussef Djohane
WPS801 Unraveling the Mysterie. of China's Arvind Panagari,a Novenr.ber 1991 D. BallantyneForeign Trade Regime: A View from 37947Jiangsu Province
WPS802 Strengthening the Bank's Population Steven W. Sinding November 1991 0. Nadora
Work in the Nineties 31091
WPS803 Financial Regulation: Changing the Millard Long November 1991 W. PitayatonakarnRules of the Game Dimitri Vittas 37666
WPS804 Global Trends in Raw Materials Boum-Jong Choe November 1991 S. LipscombConsumption 33718
WPS805 Privatization in the Soviet Union: Sergei Shatalov November 1991 CECSEThe Beginnings of a Transition 37188
WPS806 Measuring Commercial Bank Dimitri Vittas November 1991 W. PitayatonakarnEfficiency: Use and Misuse of Bank 37666Operating Ratics