Measuring Displacement of Tall Concrete Columns During Construction Jeremiah Morrow Bridge Interstate 71, Lebanon, Ohio Abstract: 203 Paper Text: 4193 Figures/Tables: 3250 Total Word Count: 7443 Authors: Mehdi Norouzi - Graduate Research Assistant Department of Electrical Engineering and Computing Systems University of Cincinnati, 717 Engineering Research Center, ML-30, Cincinnati, OH 45221 Phone: 513-549-3435 Email: [email protected]Karen Cormier, P.E., Senior Associate T.Y. Lin International 11279 Cornell Park Drive Cincinnati, OH 45242 Phone: 415-603-0860 Email:[email protected], Murat Aydemir, S.E., P.E., Senior Squad Leader HNTB Corporation One South Wacker Drive, Ste. 900 Chicago, IL 60606 Phone: 312-903-9119 Email:[email protected], Seyedowjan Hashtroodi - Graduate Research Assistant Department of Civil Engineering University of Toledo Mail Stop 307, Toledo, Ohio 43606-3390 Phone: 404-465-8506 Email: [email protected], Victor J. Hunt - Associate Research Professor Department of Electrical Engineering and Computing Systems University of Cincinnati, 721 Engineering Research Center, ML-30, Cincinnati, OH 45221 Phone: 513-556-3687 Email: [email protected], Douglas K. Nims, Ph.D., P.E. - Associate Professor Department of Civil Engineering University of Toledo Mail Stop 307, Toledo, Ohio 43606-3390 Phone: 419-530-8122 Emai: [email protected], Arthur Helmicki - Professor and Head Department of Electrical Engineering and Computing Systems University of Cincinnati, Rhodes 812J, ML-30, Cincinnati, OH 45221 Phone: (513)556-6069 Email: [email protected]TRB 2014 Annual Meeting Paper revised from original submittal.
Transcript
Measuring Displacement of Tall Concrete Columns During Construction
Jeremiah Morrow Bridge
Interstate 71, Lebanon, Ohio
Abstract: 203
Paper Text: 4193
Figures/Tables: 3250
Total Word Count: 7443
Authors:
Mehdi Norouzi - Graduate Research Assistant
Department of Electrical Engineering and Computing Systems
University of Cincinnati, 717 Engineering Research Center, ML-30, Cincinnati, OH 45221
TRB 2014 Annual Meeting Paper revised from original submittal.
Abstract 1
Multiple-span segmental concrete bridges built by balanced cantilever construction demand precise geometry 2 control so that adjoining tips align at the time the closure segment is cast. When this type of bridge superstructure is 3 cast monolithically on tall piers, moment redistribution as well as creep, shrinkage, and temperature effects can 4 cause excessive demand to the exterior end spans and piers of the structure. To compensate, designers often utilize 5 horizontal forces (jacking) to induce a counteractive moment in the pier columns, but ensuring that the intended 6 displacement is realized at the needed structural elements is often overlooked. A methodology for measuring 7 deflections of tall pier elements using tilt meters during construction is presented for the Jeremiah Morrow 8 Replacement Bridge. Fast sampling data collection systems and post-processing algorithms including thermal effect 9 removal are detailed. In addition to the deflections due to unbalanced cantilever moment during the casting cycle, 10 fast sampling data for the first horizontal jacking event is discussed and compared with the data collected by 11 traditional laser survey techniques. The data was valuable information for the designer allowing for fine-tuning of 12 geometry set-up during the segment casting cycles, and provided real-time displacement readings that permitted 13 field decisions regarding final force application during the jacking event. 14
Introduction 15
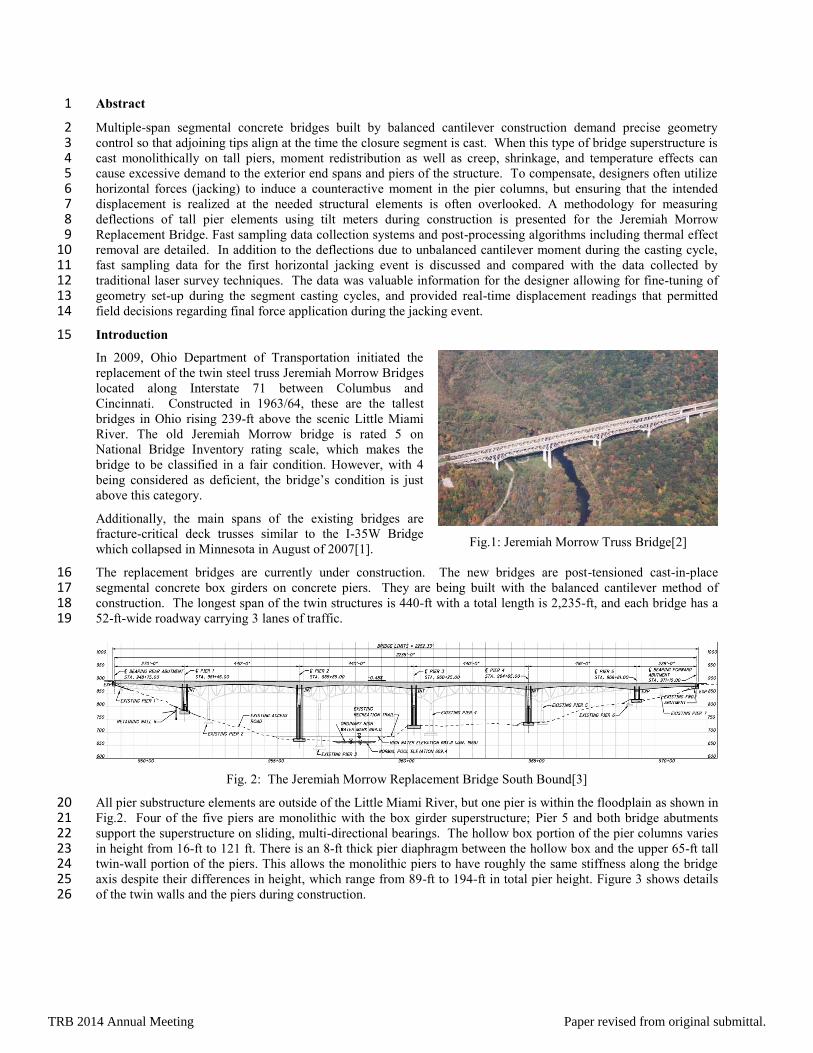
In 2009, Ohio Department of Transportation initiated the
replacement of the twin steel truss Jeremiah Morrow Bridges
located along Interstate 71 between Columbus and
Cincinnati. Constructed in 1963/64, these are the tallest
bridges in Ohio rising 239-ft above the scenic Little Miami
River. The old Jeremiah Morrow bridge is rated 5 on
National Bridge Inventory rating scale, which makes the
bridge to be classified in a fair condition. However, with 4
being considered as deficient, the bridge’s condition is just
above this category.
Additionally, the main spans of the existing bridges are
fracture-critical deck trusses similar to the I-35W Bridge
which collapsed in Minnesota in August of 2007[1].
Fig.1: Jeremiah Morrow Truss Bridge[2]
The replacement bridges are currently under construction. The new bridges are post-tensioned cast-in-place 16 segmental concrete box girders on concrete piers. They are being built with the balanced cantilever method of 17 construction. The longest span of the twin structures is 440-ft with a total length is 2,235-ft, and each bridge has a 18 52-ft-wide roadway carrying 3 lanes of traffic. 19
Fig. 2: The Jeremiah Morrow Replacement Bridge South Bound[3]
All pier substructure elements are outside of the Little Miami River, but one pier is within the floodplain as shown in 20 Fig.2. Four of the five piers are monolithic with the box girder superstructure; Pier 5 and both bridge abutments 21 support the superstructure on sliding, multi-directional bearings. The hollow box portion of the pier columns varies 22 in height from 16-ft to 121 ft. There is an 8-ft thick pier diaphragm between the hollow box and the upper 65-ft tall 23 twin-wall portion of the piers. This allows the monolithic piers to have roughly the same stiffness along the bridge 24 axis despite their differences in height, which range from 89-ft to 194-ft in total pier height. Figure 3 shows details 25 of the twin walls and the piers during construction. 26
TRB 2014 Annual Meeting Paper revised from original submittal.
1
Fig. 3: The piers are shown in various phases of construction 2
The superstructure is built on top of the pier beginning with a 40-ft long pier table segment, and then the cantilever 3 construction progresses with pairs of segments cast alternately on each side of the pier table. Each 16-ft long box 4 girder segment is post-tensioned with internal longitudinal cantilever post-tensioning tendons. Internal post-5 tensioning is further utilized for continuity once closure between cantilever superstructure tips is achieved. Finally, 6 external post-tensioned tendons housed inside HDPE ducts and anchored inside of the box girder segments are 7 stressed to add further capacity for live load. 8
The tall and flexible bridge piers with monolithic connection to the superstructure provide an element of geometric 9 control complexity that relies on precise time-dependent deflection predictions. Long-term moment and force 10 redistribution for this long, continuous structure requires the introduction of horizontal displacements at the tops of 11 the pier twin walls to compensate for a portion of the long-term creep and shrinkage as well as thermal movements 12 that will affect primarily the outer-most monolithic columns of Piers 1 and 4. The flexible twin wall piers are 13 designed to mitigate the forces induced by creep and shrinkage effects, and thermal movements while providing 14 adequate capacity for external loads. 15
The bridge plan documents indicate a horizontal jacking force and sequence of closure pours which initiate from the 16 center of the spans at Span 3 and proceed to the exterior spans. The horizontal jacking force was determined from 17 time-dependent finite element modeling assuming parameters of concrete properties, schedule progression and rate 18 of production, and assuming full fixity at the foundations. The purpose of the horizontal jacking procedure is to 19 induce displacements at the piers prior to closure to compensate for part of the long-term deformations due to creep 20 and shrinkage. 21
Survey Methods 22
The project requires the implementation of a geometry control program to assure that the alignment of the 23 cantilevers and the final profile grade at the end of construction will conform to the established elevation. As part of 24 quality assurance, the Ohio DOT provides an independent review, including survey of the structures following each 25 segment pour and other key operations, using traditional methods. 26
As mentioned, a key element of the design is the introduction of displacements at the piers by forcing apart the 27 cantilever tips by a horizontal jacking operation. Assessing this displacement as the jacking operation proceeds 28 requires a direct and reliable measurement on a continuous basis in order to confirm the actual displacements and 29 rotations that propagated to the pier top. Also beneficial is collection of data for the determination of target 30 displacements at jacking points required for the subsequent closures. However, because of the distances (hundreds 31 of feet) involved, direct measurement of displacement on an ongoing basis is not an option without either 32 continually employing multiple simultaneous surveys using traditional techniques, or installing pendulum, laser, 33 radar, GPS, or other expensive systems. [4, 5] The situation is further complicated by the design of the piers which 34 consist of twin walls supporting the pier table superstructure. These factors lead potentially to a complex mix of 35 bending and rotation during both cantilevered erection sequencing as well as horizontal jacking just prior to closure. 36
In order for the deflection data to be useful to the designer, the accuracy of the displacement measurements needs to 37 be approximately 10% of the anticipated measurement or within ¼”. The desired accuracy was achieved by 38
TRB 2014 Annual Meeting Paper revised from original submittal.
installing a network of gravity-referenced tiltmeters [7] at various elevations on the outside surface of Piers 2 and 3. 1 The measured Slopes were processed and used to calculate an estimate of the longitudinal displacements. 2
Additionally, a survey of three-dimensional coordinates at various elevations of all Piers 1 through 4 columns is 3 provided using an automated Total Station robotic measurement system. Permanent prisms, mounted to the column, 4 provide markers to read coordinates that are post-processed to convert to global displacement along the bridge’s 5 global longitudinal, transverse, and vertical axes. 6
These two survey methods are used to compare the actual deflections and rotations of the pier columns to the 7 predicted values during the normal cantilever construction cycle. Evaluating the bridge response during the 8 segmental cycle provided an understanding of the as-built stiffness of the system that would be valuable during the 9 subsequent horizontal jacking procedures. 10
Design of the Tiltmeter Monitoring System11
With the goal to develop a practical, cost-effective, and reliable 12 instrumentation package, a simple sensor network was designed to 13 achieve the desired accuracy. This was done by assuming a rigid 14 link model and determining the number of tiltmeters needed to be 15 distributed along the models height to achieve the necessary 16 accuracy. The tiltmeter network collects rotations due to tower 17 flexibility and rotation of the tower about an axes perpendicular to 18 the bridge longitudinal axis. The deformation of the tower is 19 estimated by a piecewise linear Approximation using the 20 distributed tiltmeters. The tiltmeter network is not sensitive to 21 longitudinal translation of the tower foundation. 22
Given a rigid tower height of H, a measure of the rotation about 23 an axis perpendicular to the bridge longitudinal axis (herein after 24 referred to as the longitudinal tilt) at the top of the tower would 25 allow for the calculation of longitudinal displacement X at that 26 same location by [6] 27
28
Fig. 4: Incremental Deflections and 29 Tiltmeter elevations for Pier 2 30
There is a limit on the accuracy of the tilt measurement, which also limits the accuracy of the longitudinal 31 displacement. Based on the gage specification, tilt is accurate to within 0.10% of full scale (+/- 0.01 degrees or 32 1.75e-4 rad)) [7]. So in order to achieve a desired accuracy of one-quarter inch with a rigid-link model, the authors 33 used a set of tilt meters on each pier that are roughly 40’ feet apart vertically. Fig. 4 shows the cumulative 34 deflections, and Table 1 shows the equations and the expected accuracies for Pier 2. By treating the error in 35 displacement measurement as the variance of a random variable due to the accuracy limit of the tiltmeter, an almost 36 arbitrary level of accuracy in the rigid link can be achieved. Thus, accuracy was calculated for each elevation using a 37 root mean square (RMS) formulation. For example, in Table 1 at level 755 Ft. the accuracy is calculated from the 38 following equation [8]: 39
)1(12.01075.112401075.11240
2
4
2
4
755 inchradft
inftrad
ft
inftAccuracy
40
41
TRB 2014 Annual Meeting Paper revised from original submittal.
Elevation Deflection Calculations in inch from Tilts in radians Accuracy of calculated
deflection
715 ft. 715tan"480 0.08” (One gage is used)
755 ft. 715755715755 tan480tan"480tan"480 d 0.12” (Two gages are used)
795 ft. 715755795755795 tan"480tan"480tan"480tan"480 d
0.15”
(Three gages are used)
835 ft. 715
755795835795835
tan"480
tan"480tan"480tan"480tan"480
d
0.17”
(Four gages are used)
893 ft. 715755
795835893835893
tan"480tan"480
tan"480tan"480tan"696tan"696
d
0.21”
(Five gages are used)
Table 1 Deflection calculations and Accuracy for Pier 2
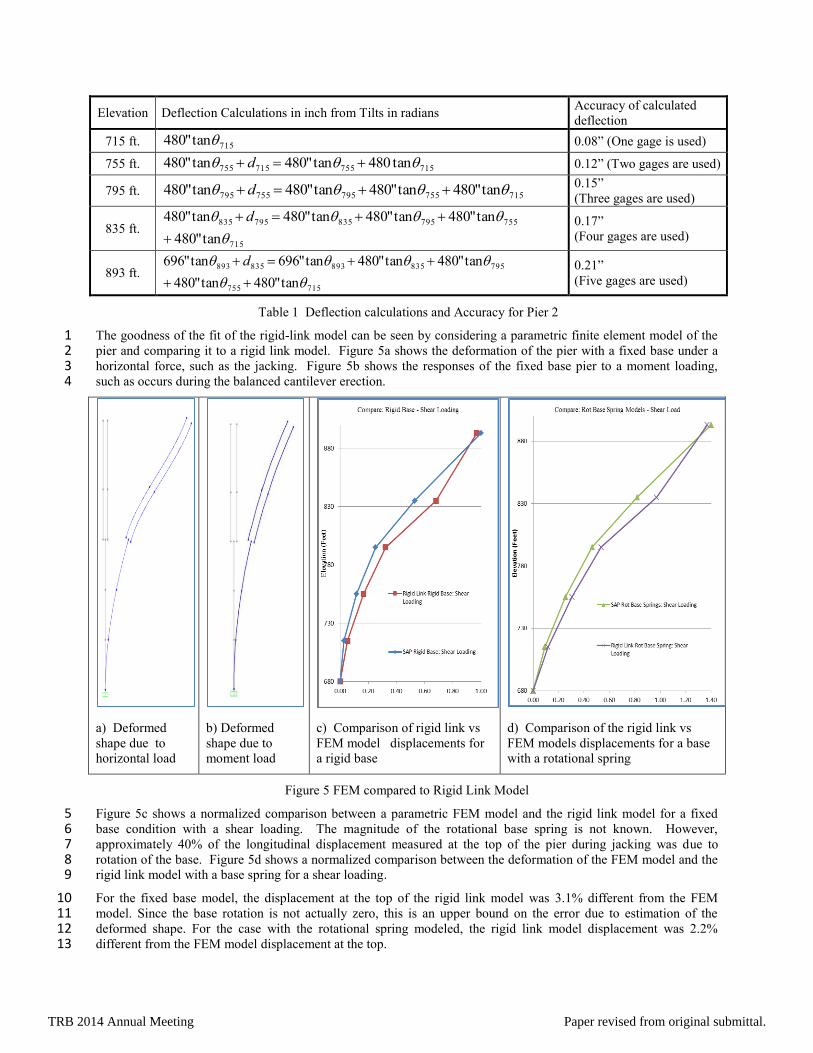
The goodness of the fit of the rigid-link model can be seen by considering a parametric finite element model of the 1 pier and comparing it to a rigid link model. Figure 5a shows the deformation of the pier with a fixed base under a 2 horizontal force, such as the jacking. Figure 5b shows the responses of the fixed base pier to a moment loading, 3 such as occurs during the balanced cantilever erection. 4
a) Deformed
shape due to
horizontal load
b) Deformed
shape due to
moment load
c) Comparison of rigid link vs
FEM model displacements for
a rigid base
d) Comparison of the rigid link vs
FEM models displacements for a base
with a rotational spring
Figure 5 FEM compared to Rigid Link Model
Figure 5c shows a normalized comparison between a parametric FEM model and the rigid link model for a fixed 5 base condition with a shear loading. The magnitude of the rotational base spring is not known. However, 6 approximately 40% of the longitudinal displacement measured at the top of the pier during jacking was due to 7 rotation of the base. Figure 5d shows a normalized comparison between the deformation of the FEM model and the 8 rigid link model with a base spring for a shear loading. 9
For the fixed base model, the displacement at the top of the rigid link model was 3.1% different from the FEM 10 model. Since the base rotation is not actually zero, this is an upper bound on the error due to estimation of the 11 deformed shape. For the case with the rotational spring modeled, the rigid link model displacement was 2.2% 12 different from the FEM model displacement at the top. 13
TRB 2014 Annual Meeting Paper revised from original submittal.
The error due to fit of the rigid link model to the actual deformed shape is small. Because the predicted 1 displacements are, on the order of a few inches, the error introduced by using a rigid-link fit is well within the 0.25 2 inch tolerance. 3
Data Collection System 4
In order to keep costs in line, two logging stations were designed compatible with the existing instrumentation, data-5 logging, and communications hardware that were already at the site.[12] Each data logging station is equipped with 6 solar panel charging system as well as battery backup system. 7
Each data logging station collects data from the tiltmeters that are installed on one pier and transfers the data to the 8 existing monitoring system through a wireless radio. The master station on the existing Jeremiah Morrow Bridge 9 then combines the data and sends it to the University of Cincinnati servers. 10
A processing program has been designed in Python [13] that processes the received data and pushes the data to a 11 MySQL database. Up-to-date processed data is available through a secure website to the designers and ODOT 12 officials. The designed system has the capability of recording the data from the inclinometers and processing the 13 data as fast as 30 seconds. 14
Sensor mapping 15
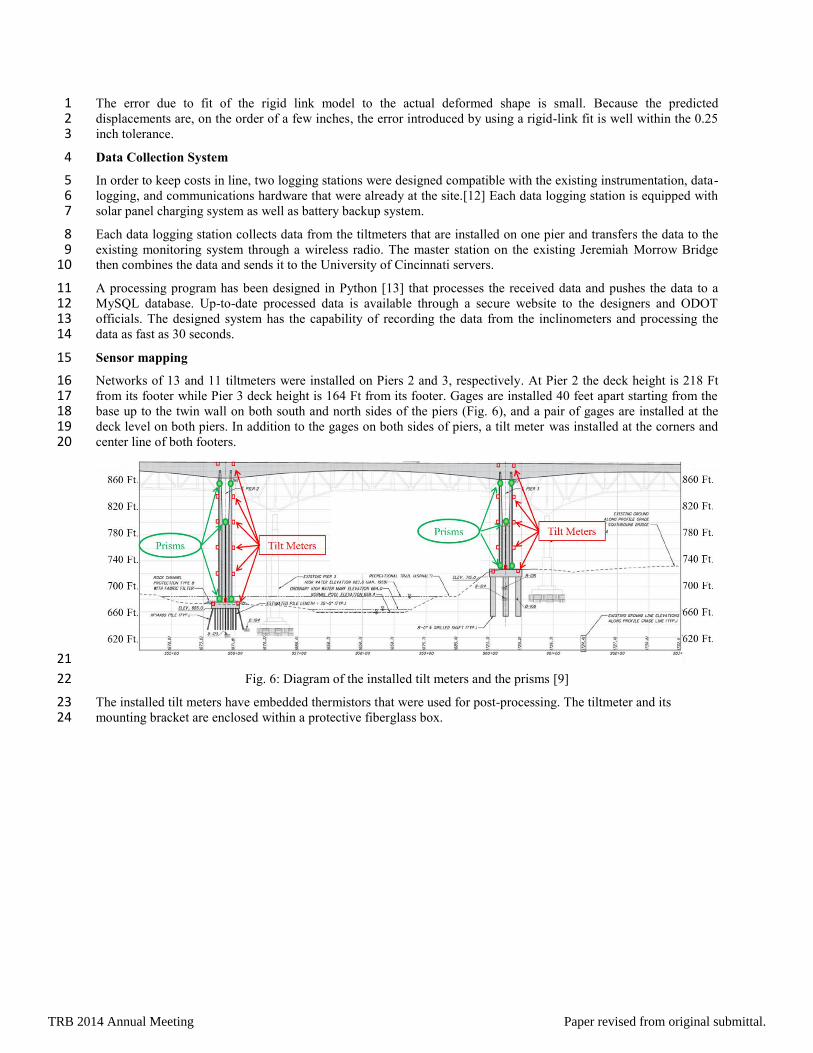
Networks of 13 and 11 tiltmeters were installed on Piers 2 and 3, respectively. At Pier 2 the deck height is 218 Ft 16 from its footer while Pier 3 deck height is 164 Ft from its footer. Gages are installed 40 feet apart starting from the 17 base up to the twin wall on both south and north sides of the piers (Fig. 6), and a pair of gages are installed at the 18 deck level on both piers. In addition to the gages on both sides of piers, a tilt meter was installed at the corners and 19 center line of both footers. 20
21
Fig. 6: Diagram of the installed tilt meters and the prisms [9] 22
The installed tilt meters have embedded thermistors that were used for post-processing. The tiltmeter and its 23 mounting bracket are enclosed within a protective fiberglass box. 24
TRB 2014 Annual Meeting Paper revised from original submittal.
Processing 1
A vibrating-wire tiltmeter is basically a transducer that is encapsulated in a stainless steel housing equipped with a 2 lug for mounting the sensor to an adjustable steel bracket. The bracket is bolted to the structure using a 3/8-inch 3 drop-in anchor. When at rest, in a vertical configuration, a pendulous mass attempts to swing (with gravity) beneath 4 the elastic hinge upon which it is supported; however, it is restrained from this rotation by a steel wire. As the tilt 5 increases or decreases, the tension on the wire changes, respectively, altering its vibrational frequency when 6 plucked. Custom electronics pluck the wire and measure the resonance frequency (and, hence, tilt or rotation of the 7 pendulous mass). [7] 8
Temperature Correction 9
Movement in the gages on a daily basis was expected in response to the daily thermal swing and any construction 10 loadings. [9, 10] This daily movement is the sum of three effects: the local temperature response of the tiltmeter, the 11 tilt of the pier due to thermal expansion and contraction of the pier, and the tilt of the pier due to construction 12 loadings (equation 2). 13
θind= θmech+ θloc+ θTpier (2) 14
Where: 15
θind: indicated tilt recorded by the data collection system 16
θmech: change in tilt of pier due to loads 17
θloc: change in output of the tilt meter due to change in temperature of the gage 18
θTpier: change in tilt of the pier due to temperature 19
There is an approximate linear procedure for removing the local temperature effect that is specified by the 20 manufacturer. In this procedure, a reference temperature value will help to identify and remove the thermal swings: 21
θloc= θlocu+ K(T-TR) (3) 22
Where: 23
θlocu: uncorrelated apparent tilt due to temperature 24
K(T-TR): correction for apparent tilt 25
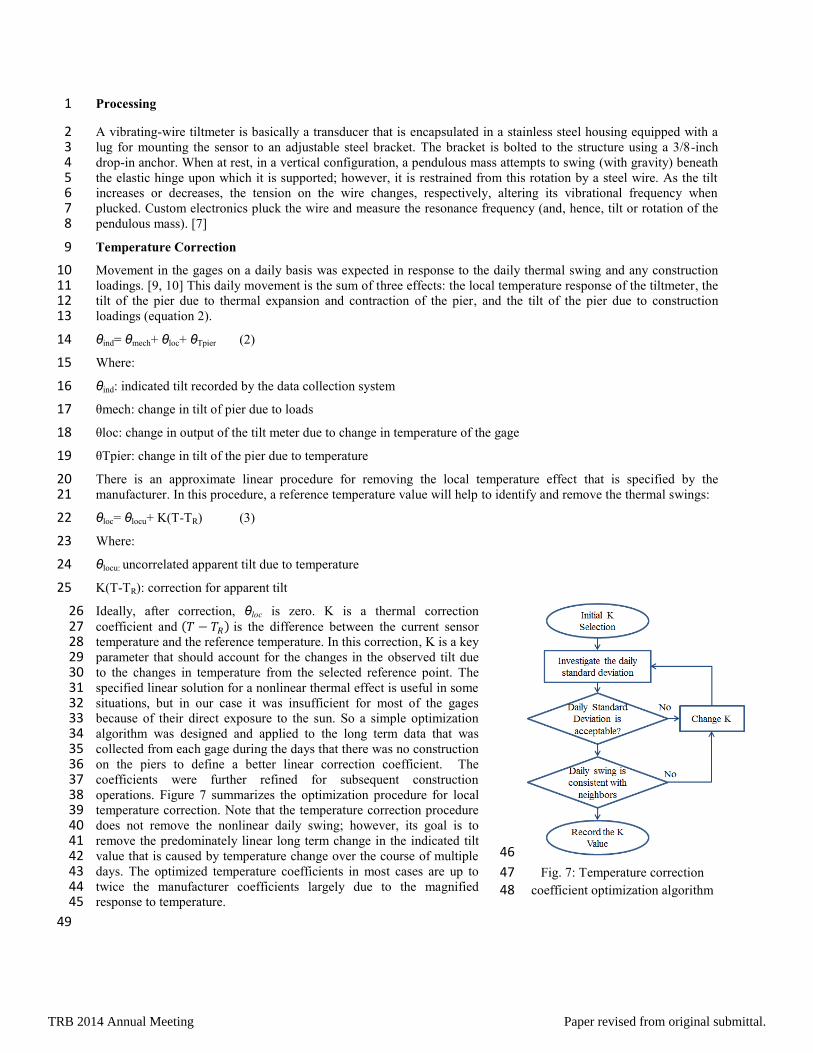
Ideally, after correction, θloc is zero. K is a thermal correction 26 coefficient and is the difference between the current sensor 27 temperature and the reference temperature. In this correction, K is a key 28 parameter that should account for the changes in the observed tilt due 29 to the changes in temperature from the selected reference point. The 30 specified linear solution for a nonlinear thermal effect is useful in some 31 situations, but in our case it was insufficient for most of the gages 32 because of their direct exposure to the sun. So a simple optimization 33 algorithm was designed and applied to the long term data that was 34 collected from each gage during the days that there was no construction 35 on the piers to define a better linear correction coefficient. The 36 coefficients were further refined for subsequent construction 37 operations. Figure 7 summarizes the optimization procedure for local 38 temperature correction. Note that the temperature correction procedure 39 does not remove the nonlinear daily swing; however, its goal is to 40 remove the predominately linear long term change in the indicated tilt 41 value that is caused by temperature change over the course of multiple 42 days. The optimized temperature coefficients in most cases are up to 43 twice the manufacturer coefficients largely due to the magnified 44 response to temperature. 45
46
Fig. 7: Temperature correction 47 coefficient optimization algorithm 48
49
TRB 2014 Annual Meeting Paper revised from original submittal.
Figure 8 shows the result of temperature correction for the gage that has the largest daily variation. (South side of 1 the Pier 2 twin walls) The figure show the tilt data over several days as three segments were erected on the south and 2 north side of the Pier 2. The step changes are segment installations; the majority of other variations are mostly due to 3 temperature. After correcting for the temperature, the tiltmeter readings became less noisy and more consistent. 4 This can also be achieved by averaging of collocated meters which experience the same structural response. 5
Fig. 8: Result of Temperature Correction for the Tilt meter that is installed on Pier 2 twin walls
The processing program receives the tilt data from the bridge every 30 minutes; archives the data, converts 6 frequencies to tilt based on calibration sheets, corrects the temperature effect and finally calculates the deflections. 7 All data is available for plotting and in tabulated form through the designed website. 8
Data Collection during Cantilever Construction 9
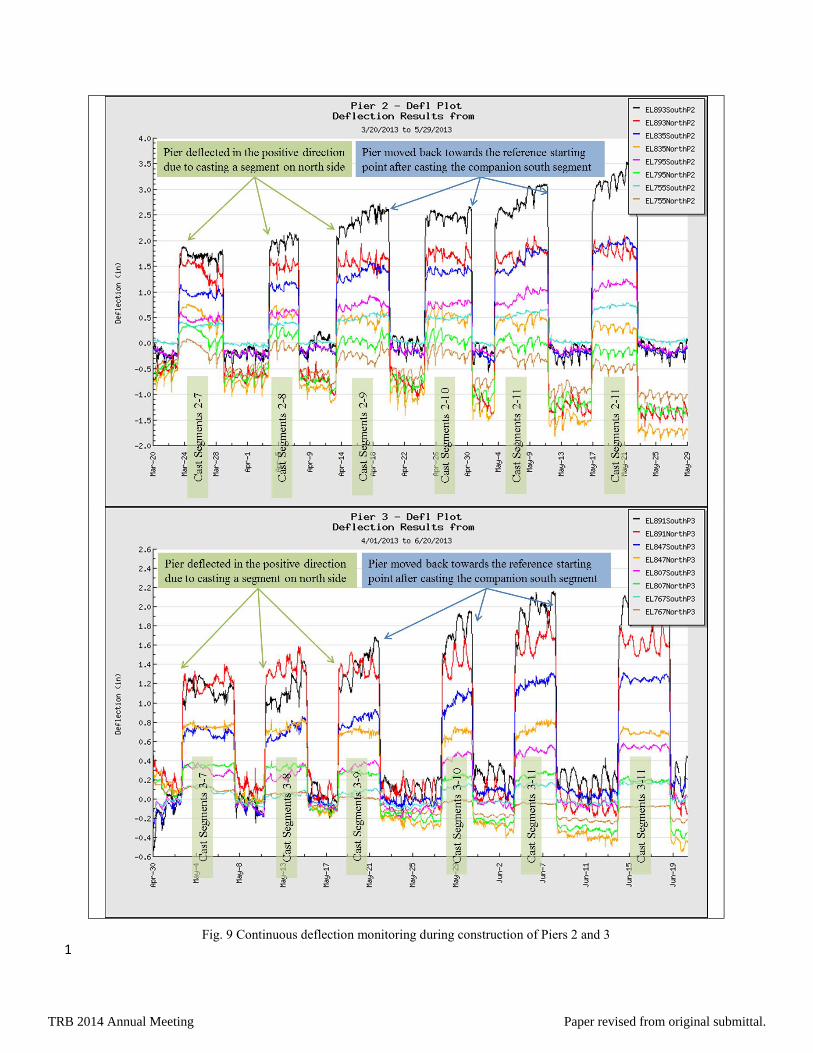
During the balanced cantilever construction cycle, the pier column experiences a net unbalanced moment following 10 the placement of a segment at the end of the cantilevered superstructure. Longitudinal deflection and rotation 11 resulting from the unbalanced moment can be measured at the top and along the height of the pier. Following the 12 installation of the monitoring system on Pier 2 and Pier 3, all the gages were monitored and processed regularly and 13 the data was compared with the laser survey measurements for verification. The reference starting measurement was 14 collected when the pier cantilever was out-of-balance by one-half segment to the south. Whenever a segment is 15 added to the north side of a pier, the pier tilts toward north (positive direction) and by installing the companion 16 segment on the south side, the pier deflects in the opposite direction towards south (negative direction) and its 17 neutral reference position. Figure 9 provides captured plots from the website that show the variation of deflection at 18 different elevations for Piers 2 and 3 during the segment casting cycle. As additional installed segments extend the 19 cantilever and thus increase the moment, the pier rotates more resulting in greater deflection. 20
TRB 2014 Annual Meeting Paper revised from original submittal.
Fig. 9 Continuous deflection monitoring during construction of Piers 2 and 3 1
TRB 2014 Annual Meeting Paper revised from original submittal.
The deflections collected from the tiltmeter monitoring system were compared to measurements from the traditional 1 survey methods and superimposed on predicted pier displacement from the construction model. Figure 10 below 2 provides these results for several of the last segments cast at Pier 2. 3
Fig. 10 Comparison of as-built measurements (measured by survey; monitored by tiltmeters) to predicted deflection
The comparison of measured versus predicted deflection indicated that both Piers 2 and 3 consistently deflected 4 more than anticipated due to the casting of additional segments that lengthened the free cantilever and increased the 5 unbalanced moment. The plot above indicates with solid lines the predicted deflection of the pier twin walls; long 6 dashed lines provide the approximate deflected shape as determined by laser-survey techniques. Short dashed lines 7 show the measured deflected shape from the tiltmeter data. Both surveyed and tiltmeter data seemed to indicate that 8 the pier column and twin walls were more flexible than predicted by the computer model. 9
Measured deflection data is utilized to make adjustments to camber elevation set-up data for casting subsequent 10 elements. Traditionally, normal survey methods are utilized at selected time intervals to measure elevations at 11 segment level, and make adjustments for camber set-up as construction progresses. However, components of pier 12 rotation and cantilever bending can be difficult to analyze and correct appropriately; having a historical record of 13 isolated pier deflection throughout the duration of construction was useful for future adjustments. 14
Data Collection during Horizontal Jacking Operation 15
A portable monitoring system was designed and implemented for monitoring the jacking events. The portable 16 monitoring system measures the two sets of gages (Pier 2 and Pier 3) simultaneously at intervals as small as 30 17 seconds. An active plotting system was designed to automatically collect and process the data and then create plots 18 in the field. The designed system has different visual plots as well as scripts to calculate the delta changes based on a 19 selected zero point. 20
-220
-170
-120
-70
-20
30
-0.3 -0.2 -0.1 0 0.1 0.2 0.3
Pier 2 twin leaf deflection 2-11D predicted
2-11D measured
monitored North 2-11D
monitored South 2-11D
2-12U predicted
2-12U measured
2-12U N monitored
2-12U S monitored
2-12D predicted
2-12D measured
2-12D N monitored
2-12D S monitored
2-13U predicted
measured 2-13U on 5-31
2-13U monitored on 5-30
2-13U monitored on 5-31
TRB 2014 Annual Meeting Paper revised from original submittal.
The first horizontal jacking operation occurred in Closure 3 between Pier 2 and Pier 3 on July 2nd
, 2013. The 1 procedure required that the jacking occur when thermal effects due to sun were minimal; therefore, the operation 2 was performed after dark. To accomplish the net longitudinal movement needed at the top of the pier columns, a 3 pair of stiff steel pipe struts were aligned in the 8-ft opening between the adjacent cantilever tips, and hydraulic 4 jacks were used to apply force to simultaneously spread the tips apart a prescribed net distance. A laser survey 5 system and the wireless tilt monitoring system both were set up in the field to monitor the displacement of the pier 6 columns; these measurements at the piers as well as at the closure opening were monitored during the jacking by the 7 designers. 8
This closure was to be jacked to the required force (220-k) or the estimated movement (2-3/8”), whichever occurred 9 first, or as directed by the Engineer. The measurements of pier deflection during the segment casting cycles 10 indicated that the piers were more flexible than assumed for design purposes. This apparent increase in pier 11 flexibility suggested that 2-3/8” spread at the closure opening might be achieved at a force of 170-kips. The 12 prescribed jacking load was initiated in 20% increments of the estimated 170-kips, and after each increment the 13 procedure was stopped until the monitoring systems achieved stable readings. The first significant movement at 14 both the superstructure gap opening and at the top of pier twin walls was noted when increasing the jack force from 15 40% to 60% of the anticipated 170-kip load. Following the first significant movement, the force was increased 16 incrementally as follows: 135k, 170k, 190k, and 220k. Since the targeted movement was not realized due to 17 inefficiencies in the tip alignment sliding restraint system, the force was increased to 240k. The fast sampling data 18 results for both piers is presented below in Fig. 11; the incremental application of the horizontal load appears in 19 these deflection plots as step changes. 20
a) Pier 2 fast-sampling data b) Pier 3 fast-sampling data
Fig. 11 Fast-sampling data and final deflections at different elevations for both piers
TRB 2014 Annual Meeting Paper revised from original submittal.
The results provided by the active plotting system for the fast sampling data at the time of the jacking event are 1 summarized in Table 2 and compared to measurements of prism movement as surveyed utilizing classical survey 2 methods as well as to the achieved superstructure gap opening. Note that an arbitrary zero point selected at the 3 beginning of the operation is used. 4
Desired
Closure net Gap
Opening
(average)
Prism
measurement
Tiltmeter
measurement
Superstructure gap 2-3/8” 1.94” n/a n/a
Pier 2 twinwall -1.21” n/a -0.97” -0.93”
Pier 3 twinwall +0.84” n/a +0.62” +0.71”
Table 2: Final deflections from first jacking event 5
The expected deflection of both pier cantilevers does not equate to the gap opening due to elastic shortening and the 6 flexural bending component of the superstructure deflection when the force is applied at the end of the cantilever. 7 Although the anticipated gap opening and the pier deflection were not realized, the proportions of gap opening to 8 pier deflection were uniform. The designer determined that the results were satisfactory for these interior piers. 9
The dual data collection provided by both fast-sampling of the tiltmeters and traditional survey of the prisms 10 mounted on the piers continued to be used for the subsequent jacking at span Closures 2 and 4. Since the jacking 11 procedure involved pushing between free cantilevers and partially-completed bridge span frames, the prescribed 12 jacking force was significantly higher with some increase in required deflection for the outer-most exterior piers. 13 The cantilever tip restraint system inefficiencies were resolved so that the desired deflection of the exterior piers was 14 achieved. 15
ODOT plans to transfer the tiltmeters from their present location to the outermost Piers 1 and 4 to monitor 16 deflections when building the northbound structure. The need to utilize traditional survey methods to confirm the 17 tiltmeter measurements could be omitted due to the consistent and acceptable agreement between both methods. 18
Conclusion 19
An inexpensive yet accurate system for measuring displacement of tall piers using measured slope of the piers was 20 designed and used in the field. The array of tiltmeters was large enough to accurately capture the displacement at the 21 top of the piers within the specified tolerance. The parametric FEM showed that the rigid link model was an 22 appropriate approximation of the pier shape for these deflection measurements. The close fit between the survey 23 results and the slope-based measurement system verified the accuracy of the proposed slope-based system. The 24 continuously-collected data provided engineers and constructors with instantaneous measurements that could be 25 quickly evaluated to make crucial decisions during complex construction procedures without having to rely solely 26 on classical surveying techniques. 27
TRB 2014 Annual Meeting Paper revised from original submittal.
References 1
[1] Surdahl, R., et al., "The Positive Legacy of a Bridge Collapse," Public Roads 73, Number 5, Federal Highway 2 Administration, FHWA-HRT-10-001 ( 2010). 3
[2] Strickland, T., “Grant Application for Transportation Investment Generating Economic Recovery for the 4 Jeremiah Morrow Bridge Modernization” State of Ohio (2009). 5
[3] “General Plan, Bridge No. WAR-71-1514L/R Interstate 71 Over Little Miami River”, State of Ohio Department 6 of Transportation (2008) 7
[4] “Use of Advance Geospatial Data, Tools, Technologies, and Information in Department of Transportation 8 Projects” TRB’s National Cooperative Highway Research Program (NCHRP) Synthesis 446 (2013) 9
[5] Washer, G. S., “Long-Term Remote Sensing System for Bridge Piers and Abutments” Final Report for Highway 10 IDEA Project 123, (December 2010) 11
[6] Holzhausen, G., “UsingTilt to Measure Displacement”, Measurements & Control (September 1993) 12 [7] Geokon 6350 Manual (revision 06,09) 13 [8] Papoulis, A. “Probability. Random Variables, and Stochastic Processes”, McGraw-Hill, New York, NY, 3
rd, 14
1991. 15 [9] Ozakgul, K., Caglayan, O., Uzgider, E., “Load Testing of Bridges Using Tiltmeters Proceedings of the SEM 16
Annual Conference”, Proceedings of the SEM Annual Conference New Mexico (June 2009) 17 [10] Ko, J.M., Ni, Y.Q., “Technology developments in structural health monitoring of large-scale bridges” 18
Engineering Structures 27 (2005) 19 [11] Helmicki, A, Hunt, V. and Nims, D. “Monitoring of the New Jeremiah Morrow Bridge Piers during 20
Construction: Inferring Displacements from Tilt Measurements”, ODOT Proposal. (August 2012) 21 [12] Norouzi, M., Kumpf, J., Hunt, V., and Helmicki, A. “An Integrated Monitor and Warning System for the 22
Jeremiah Morrow Bridge” NDE/NDT for Highways and Bridges: Structural Materials Technology (SMT) 23 Conference, New York, NY. (August 2012) 24
[13] Python Software Foundation (2011), "Python Programming Language - Official Website," Python Software 25 Foundation, <http://python.org/>(2011) 26
TRB 2014 Annual Meeting Paper revised from original submittal.