46
Measuring employment effects of technical cooperation interventions Some methodological guidelines Second revised edition Economic Development and Employment

Measuring employment effects of technical cooperation interventions Some methodological guidelinesSecond revised edition
Economic Development and Employment

Published by
Deutsche Gesellschaft fürInternationale Zusammenarbeit (GIZ) GmbH Registered officesBonn and Eschborn, Germany Friedrich-Ebert-Allee 4053113 Bonn, GermanyPhone: +49 228 44 60-0Fax: +49 228 44 60-17 66
Dag-Hammarskjöld-Weg 1-565760 Eschborn, GermanyPhone: +49 61 96 79-0Fax: +49 61 96 79-1115 E-Mail: [email protected]: www.giz.de
Economic Development and Employment Department
Contact: [email protected]
Contact at the Federal Ministry for Economic Cooperation and Development (BMZ)Sigrid Schenk-Dornbusch, Division 113
Responsible:Dr. Eva Weidnitzer
Authors: Prof. Dr. Jochen Kluve with Hanka Boldemann and Dr. Eva Weidnitzer
Design and Production: andreas korn visuelle kommunikation, Bad Homburg
The Deutsche Gesellschaft für Internationale Zusammenarbeit (GIZ) GmbH was formed on 1 January 2011. It brings together the long-standing expertise of DED, GTZ and InWEnt. For further information, go to www.giz.de.
© GIZ Eschborn. Second revised edition, July 2011

1
Measuring employment effects of technical cooperation interventions Some methodological guidelines
Second revised edition, July 2011
Commissioned by the sector project “Employment-oriented development strategies and projects”
Deutsche Gesellschaft für Internationale Zusammenarbeit (GIZ) GmbH
Prof. Dr. Jochen Kluve

2
Table of Contents
Abbreviations . . . . . . . . . . . . . . . . . . . . . . . . . . . . . . . . . . . . . . . . . . . . . . . . . . . . . . . . . . . . . . . . . . . . . . . . . . . . . . . . 3
Abstract . . . . . . . . . . . . . . . . . . . . . . . . . . . . . . . . . . . . . . . . . . . . . . . . . . . . . . . . . . . . . . . . . . . . . . . . . . . . . . . . . . . . 4
Acknowledgements . . . . . . . . . . . . . . . . . . . . . . . . . . . . . . . . . . . . . . . . . . . . . . . . . . . . . . . . . . . . . . . . . . . . . . . . . . . . 4
1 . Introduction . . . . . . . . . . . . . . . . . . . . . . . . . . . . . . . . . . . . . . . . . . . . . . . . . . . . . . . . . . . . . . . . . . . . . . . . . . . . . . . . 5
1.1 The interest in impact evaluation . . . . . . . . . . . . . . . . . . . . . . . . . . . . . . . . . . . . . . . . . . . . . . . . . . . . 5
1.2 Motivation for methodological guidance . . . . . . . . . . . . . . . . . . . . . . . . . . . . . . . . . . . . . . . . . . . . . . . 5
1.3 The focus on employment impacts . . . . . . . . . . . . . . . . . . . . . . . . . . . . . . . . . . . . . . . . . . . . . . . . . . . 5
1.4 This guide – purpose, principles, structure . . . . . . . . . . . . . . . . . . . . . . . . . . . . . . . . . . . . . . . . . . . . . 6
2 . Some definitions and clarifications up front . . . . . . . . . . . . . . . . . . . . . . . . . . . . . . . . . . . . . . . . . . . . . . . . . . . . . . 8
3 . Methods for IE: Approaches and challenges . . . . . . . . . . . . . . . . . . . . . . . . . . . . . . . . . . . . . . . . . . . . . . . . . . . . . 10
3.1 Two main approaches . . . . . . . . . . . . . . . . . . . . . . . . . . . . . . . . . . . . . . . . . . . . . . . . . . . . . . . . . . . . 10
3.2 The methodological challenge . . . . . . . . . . . . . . . . . . . . . . . . . . . . . . . . . . . . . . . . . . . . . . . . . . . . . . 10
3.3 Impact, output, gross and net effect . . . . . . . . . . . . . . . . . . . . . . . . . . . . . . . . . . . . . . . . . . . . . . . . . 11
4 . Principles of impact evaluation . . . . . . . . . . . . . . . . . . . . . . . . . . . . . . . . . . . . . . . . . . . . . . . . . . . . . . . . . . . . . . 14
5 . Impact evaluation: Step by step . . . . . . . . . . . . . . . . . . . . . . . . . . . . . . . . . . . . . . . . . . . . . . . . . . . . . . . . . . . . . . 15
5.1 Step one: Choice of unit of observation . . . . . . . . . . . . . . . . . . . . . . . . . . . . . . . . . . . . . . . . . . . . . . . 15
5.2 Step two: Choice of outcome . . . . . . . . . . . . . . . . . . . . . . . . . . . . . . . . . . . . . . . . . . . . . . . . . . . . . . . 15
5.3 Step three: Choosing the evaluation parameter and method . . . . . . . . . . . . . . . . . . . . . . . . . . . . . . . 15
5.4 Step four: Implementation and data collection . . . . . . . . . . . . . . . . . . . . . . . . . . . . . . . . . . . . . . . . . 17
5.5 Step five: Quantitative analysis . . . . . . . . . . . . . . . . . . . . . . . . . . . . . . . . . . . . . . . . . . . . . . . . . . . . . 19
5.6 Mixed methods . . . . . . . . . . . . . . . . . . . . . . . . . . . . . . . . . . . . . . . . . . . . . . . . . . . . . . . . . . . . . . . . . 19
6 . Applying the guideline – Context I: Vocational education and labor markets . . . . . . . . . . . . . . . . . . . . . . . . . . . 22
6.1 Example A – University reform in Ethiopia (BAC) . . . . . . . . . . . . . . . . . . . . . . . . . . . . . . . . . . . . . . . 22
6.2 Example B – Ex-post assessment of TVET support in Vietnam (CSC) . . . . . . . . . . . . . . . . . . . . . . . . 23
6.3 Example C – TVET support in Indonesia (DID) . . . . . . . . . . . . . . . . . . . . . . . . . . . . . . . . . . . . . . . . . . 25
7 . Applying the guideline – Context II: Private sector development and business support . . . . . . . . . . . . . . . . . . 28
7.1 Example D – Private sector support in Ethiopia (BAC) . . . . . . . . . . . . . . . . . . . . . . . . . . . . . . . . . . . 28
7.2 Example E – Private Sector Development in Yemen (tracing the results chain) . . . . . . . . . . . . . . . . 29
Annex: Sample Questionnaires . . . . . . . . . . . . . . . . . . . . . . . . . . . . . . . . . . . . . . . . . . . . . . . . . . . . . . . . . . . . . . . . . 34
A1: ecbp Ethiopia Component 1: University graduates, 1st wave (at time of graduation) . . . . . . . . . . . . 34
A2: Promotion of TVET Vietnam: Graduates 2nd wave (follow-up after 6 months) . . . . . . . . . . . . . . . . . . 35
A3: ecbp Ethiopia Component 4: Company questionnaire – assessing employers’ perspectives on graduate skills . . . . . . . . . . . . . . . . . . . . . . . . . . . . . . . . . . . . . . . . . . . . . . . . . . . . 38
References . . . . . . . . . . . . . . . . . . . . . . . . . . . . . . . . . . . . . . . . . . . . . . . . . . . . . . . . . . . . . . . . . . . . . . . . . . . . . . . . . 43

3
Abbreviations
AAU Addis Ababa University
ATET Average Treatment Effect on the Treated
BAC Before-After Comparison
BDS Business Development Services
BEE Business Enabling Environment
CSC Cross-sectional Comparison
DCED Donor Committee for Enterprise Development
DID Difference-in-Differences
ecbp Engineering Capacity Building Program
FS Financial Services
GDVT General Department of Vocational Training
GIA General Investment Authority
GIZ Deutsche Gesellschaft für Internationale Zusammenarbeit
IE Impact Evaluation
LBES Local Business Environment Survey
LMIA Labor Market Information Analysis
M&E Monitoring and Evaluation
MoIT Ministry of Industry and Trade
NIVT National Institute for Vocational Training
NONIE Network of Networks on Impact Evaluation
PSD Private Sector Development
PSDP Private Sector Development Project
RCT Randomized controlled trial
SED-TVET (Program) Sustainable Economic Development through Technical and Vocational Education and Training
SEDF Small Enterprise Development Fund
SMEs Small and Micro Enterprises
TVET Technical and Vocational Education and Training
3ie International Initiative for Impact Evaluation
4
Abstract
This guide provides a brief and accessible overview of methods for impact evaluation in the context of development cooperation. It is targeted at practitioners in technical cooperation and focuses on hands-on, low-cost impact evaluation that still provides the desired, sufficiently robust information and results. The guide specifically discusses employment effects brought about by two contexts of technical coopera-tion interventions, i) vocational education and labor markets, and ii) private sector development and business support. The main challenges facing the impact evaluation of an intervention of development cooperation are delineated, along with the principal methodological approaches to addressing these challenges. Several examples from both contexts illustrate how these approaches work in practice.
Acknowledgements
These guidelines are the outcome of work within the GIZ sector project “Employment-oriented devel-opment strategies and projects” conducted by the author in cooperation with Hanka Boldemann and Eva Weidnitzer. The first version of the guidelines was published in 2009, the current (2011) version constitutes an updated second edition. The author gratefully acknowledges valuable comments by GIZ colleagues from the head office in Eschborn, GIZ projects/programs in the field, by participants of a working group meeting of GIZ private sector development practitioners of the MENA Region held in Bonn in August 2009, and participants of a seminar presentation at Eschborn in May 2011.
Prof. Dr. Jochen Kluve Humboldt-Universität zu Berlin and RWI – Berlin Office Hessische Str. 10 10115 Berlin, Germany Tel +49 30 2021 598 13 [email protected]

5
1 . Introduction
1 .1 The interest in impact evaluation
In recent years there has been an increasing trend in virtually all policy fields to hold policy interven-tions accountable by assessing their effectiveness, i.e. evaluating them. This is particularly the case in the context of development cooperation, as borne out e.g. by initiatives such as NONIE or 3ie, etc.1 Evaluating policies and programs, interventions and treatments at various levels is important for a va-riety of reasons: First and foremost, impact evaluation (IE) assesses whether the intended results have been achieved at all – empirical evidence proving the effectiveness of an intervention serves to justify the intervention. Second, learning about impacts informs the discussion on both the current and future interventions by generating feedback and policy implications on altering, developing or terminating the intervention. Third, IE can help identify causal chains and, fourth, generally strengthens accountability and transparency of program use. Fifth, single impact evaluations may generate knowledge useful for development interventions in other contexts. Ultimately, all IE practice is geared towards serving as the basis for evidence-based policy making and improving the effectiveness and efficiency of interventions.
1 .2 Motivation for methodological guidance
In the above mentioned context, GIZ aims to expand its understanding about the effectiveness of the multitude of projects, programs, program components and interventions it is implementing worldwide. GIZ had substantiated this concern e.g. in its 2009 and 2010 annual objectives2. Moreover, GIZ has been involved in developing a methodological standard for results-based monitoring within the Donor Committee for Enterprise Development (DCED), focusing mainly on private sector development.3
Besides the more strategic nature of “impact” as a priority for development cooperation generally and GIZ specifically, it is clearly a concern of the program staff in particular countries to learn about the impacts of the interventions they are implementing. To this end, appropriate methods for measuring net intervention effects are needed. It is therefore useful to provide an overview of how the effects of inter-ventions can be assessed – which is the goal of this guide. A specific focus will be on the employment effects of technical cooperation interventions – at the same time, and in line with the focus on employ-ment, the interventions considered will be either in the context of “vocational education and labor mar-kets” or in the context “private sector development and business support”.
1 .3 The focus on employment impacts
Employment is one important result of development cooperation, besides the more general – and often more emphasized – objectives of economic stability or structural adjustment, or sector specific objec-tives. Indeed, UN member states have agreed to pay more attention to employment objectives: In the 2008 revision of the MDGs it was decided to add the target 1B aiming at “achieving full and productive
1 Network of Networks on Impact Evaluation, www.worldbank.org/ieg/nonie/, International Initiative for impact Evaluation, www.3ieimpact.org.
2 The GIZ 2009 annual objective stated that “evidence of the results of our work (facts and figures) is an essential component of our reporting and our presentation to the outside world”. Correspondingly, the annual objective 2010 stated that “GIZ provides evidence for the effectiveness of its services in the national and international context”.
3 DCED (2009), The Donor Committee for Enterprise Development Standard for Results-based Monitoring, www.enterprise-development.org.

6
employment and decent work for all, including women and young people” under the MDG 1 “Eradi-cate extreme poverty and hunger”.
Importantly, issues of “employment” or labor economics aspects also subsume fundamental issues such as educational systems in a country, the design of which likely has major effects on a country’s long-term development and corresponding macroeconomic outcomes (cf. the applications of IE regarding university reform or reforms of the vocational training systems in section 7). Moreover, employment – specifically: net additional jobs created – is one of the three universal indicators defined in the DCED standard for measuring results.4
1 .4 This guide – purpose, principles, structure
This guide is meant to illustrate the main challenges facing the impact evaluation of an intervention of technical cooperation, and the principal methodological approaches to addressing these challenges. The impacts referred to are employment effects. The guide focuses on quantitative methods for impact as-sessment. Some reference to qualitative methods will be discussed briefly in section 5.6, but addressing this issue more comprehensively is beyond the scope of this guide.
Essentially, the guide covers steps 3 (“Measuring changes in indicators”) and 4 (“Estimating attributable changes”) of the DCED standard for Measuring Results (cf. Figure 1)5. While the guide therefore can-not cover the first steps of impact-oriented monitoring – notably formulating results chains and appro-priate indicators, as well as setting up a comprehensive monitoring system – it is clear that these steps are essential for successfully implementing and interpreting comprehensive impact evaluations. Clearly laid out reference regarding these topics can be found in the DCED standard6 as well as the GIZ guide-line for results-based monitoring7.
Figure 1 . Overview of the DCED Standard for Measuring Results
1. Articulating the Result Chain
2. Defining indicators of change
3. Measuring changes in indicators
4. Estimating attributable changes
5. Capturing wider changes in the system or market
6. Tracking programme costs
7. Reporting results
8. Managing the system for results measurement
Source: ‘A Walk through the Standard’ (July 2010), www.enterprise-development.org/page/measuring-and-reporting-results
4 The DCED standard for measuring results in private sector development and supporting documents can be found here: www.enterprise-development.org/page/measuring-and-reporting-results.
5 The DCED Standard represents international best practice and is in line with GIZ guidelines for Monitoring (see GIZ (2008), Results-based monitoring: Guidelines for Technical Cooperation). Moreover, the DCED standard provides good guidance for implementation and operationalization.
6 See footnote 4.
7 GIZ (2008), Results-based monitoring: Guidelines for Technical Cooperation.

7
The guide follows several principles. First, brevity. The guide is supposed to be as concise and succinct as possible. Second, it addresses the main issues, not all issues. Hence, third, the guide intends to provide practitioner-oriented guidance for hands-on, low-cost impact evaluation that still provides the desired, sufficiently robust information and results. A comprehensive overview of IE in the development context can be found, for instance, in a recent volume published by NONIE.8
Section 2 contains several terminological definitions and clarifications. Section 3 discusses the main methodological challenges of IE, while section 4 proposes several principles that any impact evaluation exercise should follow. The fifth section constitutes the core of this guide and presents a step by step procedure of impact evaluation. The last part of this section (5.6) briefly discusses mixed methods. Sec-tions 6 and 7 each present a number of practical examples of IE within the contexts of vocational train-ing and university education (section 6) and private sector development (section 7).
8 NONIE, F. Leeuw and J. Vaessen (2009), Impact Evaluations and Development – NONIE Guidance on Impact Evaluation, World Bank Independent Evaluation Group, Washington, DC.

8
2 . Some definitions and clarifications up front
In order to make the subsequent presentation as precise as possible, it seems useful to define and clarify several terms up front.
Intervention and program are used in line with the German development cooperation understanding based on OECD-DAC terminology9. That is, a program refers to a set of interventions, marshaled to attain specific global, regional, country, or sector development objectives. A program typically consists of several components. In turn, an intervention is generally a subset of a component, and defined as a coherent set of activities that share a single results chain, and are designed to achieve a specific and lim-ited change. The methods described in this guide are mainly addressed at impact evaluation of particular interventions. This perspective is also closely related to the term “treatment” used in the statistics and econometrics literature dealing with IE. Correspondingly, the term “treatment group” generically refers to the group of individuals or entities exposed to a given intervention, and will also be used in this way in this guide.
The impact of an intervention/program /treatment (as defined above) is defined as the net effect of that intervention/program/treatment.10 In line with this definition the term “outcome” specifies (the real-ized value of ) the variable characterizing the results/output of the intervention.11
Several interventions in a particular country may complement each other, aiming at one main objec-tive (e.g. employment in the economy, competitiveness) via different channels, where each intervention affects (intermediate) outcomes. For instance, in a given country the promotion of vocational educa-tion and business support to a specific sector jointly target employment in the economy, but through separately achieving intervention-specific goals. The focus of this guide is the impact evaluation of such singular interventions. Combining the IEs of several interventions then draws a broader picture of de-velopment effectiveness in a given country.
The term baseline is commonly used in one of two different ways, which need to be distinguished. The first and more comprehensive usage of “baseline” refers to data that characterize the pre-intervention context (on the country level, or a more regional, intervention-focused level), and that can serve to identify the exact proceeding of the intervention, an adequate target group, etc. The corresponding term “baseline study” denotes an analysis describing the situation prior to a development intervention, against which progress can be assessed or comparisons made.12
The latter part of this definition comprises the second, narrower usage of “baseline” referring to evalua-tion purposes, where it simply defines the pre-intervention realization value of the outcome variable(s) of interest. This use of a baseline is the relevant one for IE. It implies that this type of baseline data can sometimes be collected/measured even after the start of the intervention. For example: A reform in technical and vocational education and training (TVET) aims at increasing the employability of TVET
9 OECD-DAC Glossary of Key Terms in Evaluation and Results-Based Management. See www.oecd.org/dac/evaluation.
10 This definition is the common definition used internationally in impact evaluation (see e.g. Gertler et al. 2011, Impact Evaluation in Practice, The World Bank: Washington, DC). GIZ monitoring terminology specifies “impact” as “indirect results” (“indirekte Wirkungen”). The term “results” refers to “Wirkungen” and “outcome” is used for “direct results” (“direkte Wirkungen”) (see: GIZ (2008), Results-based monitoring: Guidelines for Technical Cooperation).
11 This, too, is the common usage in the international impact evaluation literature (ibid.).
12 OECD-DAC (2002), Glossary of Key Terms in Evaluation and Results Based Management, www.oecd.org/dac/evaluationnetwork/documents. Further detail on baseline studies can be found, for instance, in GTZ (2010), Baseline Studies – A Guide to Planning and Conducting Studies, and to Evaluating and Using Results, GTZ Evaluation Unit, Eschborn.

9
graduates in a specific region measured e.g. by using the employment rate after graduation. Baseline data on pre-intervention employment rates among TVET graduates might in a given context be avail-able from administrative statistics even ex-post.
In sum, the broader and the narrower definition/usage of “baseline” serve two distinct objectives. While the first may certainly be informative for impact evaluation, generally the second type is all that is needed once a type of intervention is designed and objectives are defined. Hence, for IE purposes a non-comprehensive, focused (and thus typically inexpensive) baseline is often sufficient. A more com-prehensive baseline may be useful if one wants to characterize the target group of the intervention more broadly or needs to somehow identify appropriate treatment and control groups.

10
3 . Methods for IE: Approaches and challenges
3 .1 Two main approaches
In general, employment effects of international cooperation in development countries can be assessed on two main levels. First, at the microeconomic level using a so-called Bottom-Up-Approach. This type of analysis focuses on the individual actors on the (labor) market, i.e. typically either persons and/or enterprises. At the person-level, one would e.g. typically analyze whether a particular intervention increased the employment probability of individuals exposed to the intervention. At the enterprise-level, one would e.g. typically analyze whether a particular intervention increased competitiveness and em-ployment in those enterprises benefiting from the intervention.
Second, employment effects can be assessed at the macroeconomic level using a so-called Top-Down-Approach. This type of analysis focuses on intervention effectiveness regarding employment at more aggregate levels, i.e. at the sectoral, regional, or country level. Because of the aggregation, the evaluation would typically assess the effects of large programs or of all development cooperation interventions in a sector, region or country (development effectiveness).
One example is an ongoing study by the GIZ sector project “Employment-oriented development strat-egies and projects” 13: In El Salvador, regional data exist that comprehensively characterize – in terms of: female labor force participation, remittances, literacy rate, etc. – 50 regions (“municipios”) of the country, which are a representative subsample of the overall 262 municipios. Collecting these data over several years (e.g. 2002–2004) and relating them to data on the amount of aid that each region received in a given year, it is possible to use the variation in donor activity – over time and between regions – to measure the effects that this donor activity has on employment in the regions, controlling for back-ground factors.
The example illustrates that, in general, implementing a top-down-approach is much more challenging than a bottom-up-approach (see next subsection below). Whereas this guide will focus on bottom-up approaches, it has to be emphasized that only a combination of top-down and bottom-up can provide a complete picture of aid effectiveness in a particular country.
3 .2 The methodological challenge
Any impact evaluation exercise involves what has become known as the core “evaluation problem”, i.e. answering the counterfactual question “what would have happened (in terms of the outcome of inter-est, here: employment) in the absence of the program?”. Answering this question is necessary since only the difference between the factual outcome – i.e. the employment outcome that was actually achieved after implementation of the intervention – and the counterfactual outcome – i.e. the employment out-come that would have been realized had the intervention not taken place – measures the causal effect of the intervention. This formulation illustrates that one of the two required ingredients to program evalu-ation – the factual outcome – is measured with relative ease, whereas the second ingredient – the coun-terfactual – can only be assessed with appreciable methodological and data collection effort.
13 Kluve, J. (2007), Employment effects of the international cooperation in El Salvador at the municipal level, GIZ sector project “Employment-oriented development strategies and projects”, Mission report, December.
11
In practice, assessing employment effects at the individual level (bottom-up) generally involves the con-struction of a counterfactual comparison group14 of individual persons (or enterprises) who were not exposed to the particular intervention. At the macro level, the top-down approach generally requires variation in donor activity across sectors, regions, and/or over time to identify employment effects. In this case, non-supported sectors or regions, or time periods preceding the intervention serve as the com-parison dimension. While these methodological challenges are, without doubt, considerable, they can, in principle, be solved in a given context using an appropriate methodological design and, if necessary, using modern statistical/econometric methods.
To describe the counterfactual, some variant of control group or “comparison dimension” is always needed. This “comparison dimension” can e.g. be provided by the treatment group before the interven-tion (as is done in a so-called “Before-after-comparison” explained in detail below). That is, a simultane-ous, parallel control group is not necessarily required – what is always needed is a plausible comparison of someone who is exposed to the intervention (or to a larger extent) with someone who is, or was, not (or to a lesser extent).
The first difficulty in constructing the counterfactual is that it is hypothetical, a statement about what would have occurred without the intervention. The second difficulty is to identify a comparison group representing the counterfactual that is not affected by selection bias: Selection bias arises if a specific group of individuals/entities participates (self-selects) into the treatment – for instance, if only the best students from a TVET institution participate in supported occupational training. Comparing post-training outcomes (employment performance) of this group with a comparison group of non-partici-pating students yields biased impact estimates, because better average outcomes for the treatment group may not be due to the training, but due to the fact that they had better grades already before the inter-vention. That is, the comparison group is not really comparable. If selection bias arises from observed (by the researcher) factors – such as grades – it can often be controlled for using statistical techniques. If, however, the bias is due to unobserved factors that also affect the outcome – such as the inherently more motivated students participating in the training – then it is very difficult to control for.
3 .3 Impact, output, gross and net effect
Impact was defined above as net effectiveness. Suppose a given intervention consists of advisory for curricula changes and improved teaching methods at a technical college (TVET), aiming at improving employment chances for graduates of that college. Then the output of the intervention, delivered by the technical college, would be the fact that “500 students participated in the revised courses”. The gross effect of the intervention would be the fact that “of these 500 students, 300 found employment during the first six months after graduation”. Finally, the impact = net effect can only be assessed by comparing the factual outcome (= the gross effect = 300 out of 500 finding employment) with the counterfactual outcome, i.e. the number of students that would have found employment during the first six months after graduation in the absence of the intervention. The methodological challenge is obvious.
In the context of interventions of Private Sector Development (PSD) assessing net effects can be even more difficult. Suppose a given intervention by a partner organization (supported or advised by GIZ) consists of counseling to firms in a given sector, aiming at increasing their competitiveness and fostering employment in these firms. Then the output of this particular intervention by the partner organization
14 In practice, the terms “comparison group” and “control group” are frequently used interchangeably, though strictly speaking the latter is only applicable in the context of a Randomized Controlled Trial (RCT).

12
would be the “number of firms receiving the counseling”. Gross effects would be given, for instance, by the number of counseled firms that subsequently increased their turnover/profits, or by the total sub-sequent increase in employees. To assess net effects, the corresponding counterfactual questions “how many of the treated firms would have increased their turnover/profits without the counseling?” and “how many additional workers would be employed in the treated firms without the counseling?” need to be answered. Again, the methodological challenge appears obvious.
An additional complication in this specific example is the fact that successful counseling does not nec-essarily imply an increased number of employees. If production processes become more efficient, in-creased (or constant) profits might be achieved with decreasing labor input. Moreover, it might also be the case that PSD interventions positively affect labor productivity, thus impacting on the quality rather than the quantity of employment. Wages might then be used as a proxy for measuring labor productiv-ity. In sum, to assess employment effects of firm-level business support interventions, generally three outcomes need to be considered that together can draw a picture of intervention impacts: number of employees, wages, and turnover/profits.15
Moreover, in the context of PSD, it is usually important to take effects on non-treated entities into ac-count. Such indirect effects mostly regard potential displacement effects (crowding-out): If supported firms in a given sector improve their competitiveness and create employment, this might be at the ex-pense of employment in competing non-supported firms in the same sector. That is, even though net effects at the level of the treated firms are positive, net effects on the sector or the economy as a whole may be zero. Box 1 contains further detail on indirect effects.
While potential indirect effects are more prevalent in the context of PSD, they also cannot be ruled out in the context of TVET reform or human capital programs. Looking at the example above, for instance, it might be the case that graduates from supported TVET colleges improve their position in the market at the expense of graduates from non-supported colleges. Again, while net effects on the treated popula-tion would be positive, the macroeconomic effects might be smaller or zero.
15 PSD practitioners often point to the difficulty of collecting reliable data on profits, especially in the case of informal businesses. One potential remedy might be focusing on value-added, as it is the financial source for wages and profits and can be quite precisely estimated when turnover and the main production inputs are known.

13
Box 1: Indirect effects of technical cooperation interventions
In the context of Private Sector Development interventions, it is usually important to take effects on non-treated entities into account. The program evaluation literature in economics distinguishes several types of potential indirect effects – also called general equilibrium effects – of labor market programs, of which displacement effects (jobs created by one program at the expense of other jobs) are the most important. They are also referred to as “crowding out”. Other indirect effects are deadweight effects (the program subsidizes hiring that would also have occurred in the absence of the program), substitution effects (jobs created for a certain category of workers replace jobs for other categories because rela-tive wage costs have changed) and tax effects (the effects of taxation required to finance the programs on the behavior of everyone in society). ). On the positive side, systemic or market-wide changes (for instance, take-up of improved business-practices by non-supported enterprises) may increase the scale of intervention effects.
The main conclusion of this literature is that impact estimates from an individual-level (bottom-up, or partial-equilibrium) analysis may provide only incomplete information about the full impact of the intervention.
For further discussion see e.g. Heckman, J. J., R. J. LaLonde and J. A. Smith (1999), The economics and econometrics of active labor market programs, in Ashenfelter, O. and D. Card (eds.), Handbook of Labor Economics 3, Elsevier, Amsterdam.
Evaluation strategies to take into account such potential general equilibrium effects depend strongly on the context and exact nature of the technical cooperation intervention. If e.g. specific inputs in firms’ production processes are supported as part of a PSD intervention, then the general development of the individual firm and that of the other inputs within the firm needs to be monitored. If e.g. in a given sec-tor a sample of firms is supported, then the development of the remaining firms in the sector needs to be monitored. If a whole sector is supported, the remaining sectors (entire economy) need to be taken into account.

14
4 . Principles of impact evaluation
Two main principles underlie any effort at impact evaluation. First, no “magic bullet” design exists, i.e. there is not one single method that is always the right choice in any context. Second, “research design beats econometrics”, i.e. a basic but thoughtfully chosen method fitted to the given context is frequently more appropriate and informative than high-tech number crunching. In any case, a tailor-made design accompanied by appropriate data collection goes a long way in establishing program impacts.
These principles, in turn, have several implications when it comes to designing an impact evaluation study. The first implication could be called “Know your intervention” and the way the partner organiza-tion is delivering it (quality, dilution etc.), i.e. information as detailed as possible is required on a) who receives or is exposed to what and through whom?, b) what occurs due to implementing the interven-tion?, c) is something occurring at all? This directly relates to the program logic, and the clear formula-tion of a “program results chain” as defined in the DCED M&E Standard (step 1). A logical sequence, to understand what will actually happen when implementing the intervention, is also necessary to find the appropriate IE design (including above all the method and definition and measurement of outcomes).
The second implication regards the fact that every IE is intervention-specific. Whereas a guide can pro-vide the main tools and discuss the main aspects, any particular intervention will have a specific context, such that the methodological discussion together with several examples can merely illustrate the basic lines along which IE can be implemented.
Finally, the earlier one thinks about IE of an intervention, the better. Ideally, the evaluation should ac-company the program throughout the entire process from designing the intervention to implementing and completing it, such that decisions on the evaluation research design can be made as early as possi-ble, and necessary data can be collected in a baseline and as the intervention unfolds.

15
5 . Impact evaluation: Step by step
5 .1 Step one: Choice of unit of observation
This is generally straightforward given the type of intervention or target group of the program. It can be individual workers, firms, even regions, etc. Sometimes, however, the choice is not trivial, as e.g. “em-ployee training” may be a program intending to improve employment outcomes for workers, or firms, or both, and the evaluation needs to decide which the unit of observation of interest is.
5 .2 Step two: Choice of outcome
Choosing the appropriate outcome for the impact analysis generally follows from the type of interven-tion, i.e. the outcome of interest is directly linked to the objectives of the intervention. In the context of analyzing employment outcomes, frequently several outcomes can be of interest: Employment itself, but also related measures such as income or poverty.
An objective defined in rather qualitative terms can usually be translated into several quantitative out-comes. “Labor market performance of program participants” can be operationalized using “Currently employed yes/no”, “Job stability (duration, tenure)”, “Earnings”, etc. These outcomes may of course be influenced in differential ways by the same intervention; therefore often several outcomes are taken into account to draw a comprehensive picture of the effectiveness of one intervention (cf. also the cor-responding example on PSD interventions in section 3.3).16
The final step is to actually measure the outcome, e.g. the indicator “participant is employed yes/no” by conducting a survey asking for the current employment status. That is, choosing the outcome is always connected to how to measure it on the basis of available data (see Step 4 below).
The type of intervention and intervention logic not only defines the outcome(s) of interest, but it also implies which and how many outcomes need to be considered to provide a complete picture of inter-vention impacts. Clearly, when looking at firms, the number of jobs is usually one aspect only, and other outcomes such as turnover or labor productivity need to be taken into account.
5 .3 Step three: Choosing the evaluation parameter and method17
The evaluation parameter, or parameter of interest, that is most frequently used for bottom-up analyses is the Average Treatment Effect on the Treated (ATET). That is, the analysis measures the impact for exactly those individuals exposed to the intervention by comparing them to the appropriate counter-factual: The ATET is defined as the difference between the actual outcome of interest (such as average employment rate) for the participant population and the counterfactual outcome that would have been achieved for the participants had they not participated. In practice, it seems obvious that it is the effect
16 These considerations are closely linked with the formulation of indicators. The DCED Standard for Results Measurement provides useful guidance for formulating process indicators.
17 The exposition in this guide is necessarily a cutout of the relevant methodological discussion. See (among many others) for instance the chapters by M. Ravallion (“Evaluating Anti-Poverty Programs”, pp 3787–3846) and P. E. Todd (“Evaluating Social Programs with Endogenous Program Placement and Selection of the Treated”, pp 3847–3894) in the Handbook of Development Economics Vol. 4 (2008, R.E. Stevenson and T.P. Schultz (eds.), Amsterdam, North-Holland) or the textbook “Empirische Wirtschaftsforschung: Eine Einführung” by T.K. Bauer, M. Fertig, C. M. Schmidt (Berlin, Springer).

16
on the participants that one is interested in – the definition simply clarifies that without further as-sumptions no extrapolation of the empirical findings to other settings or populations can be made.
The methodologically most rigorous approach to estimating treatment effects is that of a randomized controlled trial (RCT), frequently advocated as the “gold standard” of policy evaluation. RCTs con-struct a treatment and control group by randomizing potential participants into one of the two groups – the virtues of randomization then ensure that both groups on average will not differ from each other, neither in observed nor unobserved characteristics. The control group in an RCT is thus generally unaf-fected by selection bias and provides the methodologically sound answer to the question what would have happened to participants in the absence of treatment, i.e. the counterfactual.
Since RCTs are often not feasible – for practical, ethical, financial reasons – impact evaluation has to resort to alternative, non-experimental approaches. The most important ones in the context of devel-opment interventions are i) Cross-sectional Comparison (CSC), ii) Before-After-Comparison (BAC), and iii) Difference-in-Differences (DID) and will be discussed in turn. “Most important ones” in this context refers to the fact that these are the non-experimental methods for which most likely data will be available, or data will be collectable in most contexts without prohibitively large effort or costs. Other, more sophisticated methods such as Instrumental Variables approaches or Regression Discontinuity de-sign are also important, yet less frequently applicable, as very particular settings are needed.
a . Cross-sectional Comparison
The idea of a Cross-sectional Comparison (CSC) is to use non-participants as the comparison group, i.e. the average outcome of non-participants measured at the same point in time – hence cross-sectional – is used as a counterfactual for the non-participant outcome of participants. The problem with this method is obvious: Individuals might self-select into treatment and control groups, thus invalidating the comparability of both groups and biasing the effect estimate. Some refined approaches – such as Statistical Matching techniques – try to improve on CSC by only com-paring treatment and control groups that are very similar or identical regarding observable charac-teristics (e.g. age, gender, education, etc, in the context of individual persons). However, differences between groups that are not observed in the data (such as motivation) cannot be controlled for and may potentially bias the effect estimate.
Appraisal. CSC is an intuitively appealing method, comparing entities exposed to the intervention with entities not exposed. In the development cooperation context, however, it may often be difficult to find cross-sectional comparison units, as interventions frequently target specific populations and no truly comparable non-exposed population exists. Thus, CSCs are relatively easy to implement, but controlling for potential biases remains an appreciable challenge.
An adequate setting for a CSC would be, for instance, if the limited scale of an intervention can only serve part of a generally eligible and homogenous target population, such that there is arguably a quasi-randomization into treatment and control groups.
b . Before-After-Comparison
The idea of a Before-After-Comparison (BAC) is to compare participants with themselves at two different points in time, i.e. usually before and after exposure to the intervention. That is, the coun-terfactual “what would have happened to participants (in terms of the outcome of interest) had they not participated?” is provided by their own outcome prior to the start of the intervention. Essentially, this counterfactual says that without the intervention things would have stayed the same. Again, the
17
problem with this method is rather obvious: If the BAC indeed finds a difference in the outcomes before and after, it may not always be clear that this difference was brought about exclusively by the intervention. Instead, or in addition, other factors (so-called “confounders”) may have also influ-enced the post-program outcome, such as a general cyclical upswing in the economy. The BAC is sensitive to the points in time when the before and after outcomes are measured, and it is useful if several measurements before and after can be made. Such a trend analysis can help make the BAC more plausible.
Appraisal. BAC also is an intuitively appealing method, perhaps even more so than CSC. In the development context it is usually the easiest IE design to implement, if the necessary baseline data on the pre-intervention outcome can be collected. It is, however, quite difficult to control for con-founding factors over time. If these can be plausibly excluded/controlled for, then BAC is the most straightforward and low-cost method to implement.
An adequate setting for a BAC would be, for instance, if the intervention consists of some innova-tion, some new technology – I.e. the intervention is something “really new” put into practice over a short time period, rather than a gradual change over time. Then a change in the before-after out-comes arguably must be due to the intervention. Also, it is usually easier to rule out confounders if the time period between measuring the before and after outcomes is relatively short.
c . Difference-in-Differences
The Difference-in-Differences (DID) method combines CSC and BAC. First, as in a CSC, a popu-lation of non-participants (chosen as comparable as possible) is used as a comparison group. Second, as in a BAC, changes in the average outcomes before and after are compared. That is, the differences in outcomes between participants and non-participants are taken before the intervention and again after the intervention, and then compared (hence DID). This procedure assumes that if participants had not been exposed to the intervention, then the difference in average outcomes between par-ticipants and non-participants would have remained constant over time. This way, the DID nicely controls for trends in the surrounding economic environment, because these would show up in the before-after difference of the non-participants.
Appraisal. DID is an intuitively appealing method, and strictly preferable to either BAC or CSC, as it generally convincingly eradicates major sources of bias. Hence, managing to implement a DID ap-proach in the development context usually implies reliable results, probably as reliable as they get if an RCT is not feasible. Just like the BAC the DID is sensitive to the points in time when outcomes are measured and considering several points in time increases its reliability.
An adequate setting for a DID would be, for instance, one in which – similar to the CSC – some adequate comparison group not exposed to the intervention exists, and, in addition, before and after outcomes can be measured for both treatment and comparison group.
5 .4 Step four: Implementation and data collection
This step goes hand in hand with – or: is parallel to – step three, since the decision on the appropriate method is intimately linked to the question which data are available or could be collected as the evalu-ation (and the intervention) unfolds. Clearly, most evaluators would prefer RCTs to analyze a given intervention, but in most cases corresponding data are just not available (for ethical, financial, practical reasons, etc). For the IE of a particular intervention it first has to be identified which design could be

18
implemented on the basis of available data. That is, data availability from existing sources such as ad-ministrative records (statistical agencies) or monitoring systems needs to be checked. Then a judgment needs to be made which, if any, IE design can be implemented using the existing data.
If no adequate IE design can be implemented on the basis of existing data and new data need to be col-lected, there is further interaction between the choice of method and that data collection, as costs for gathering data can be considerable. Decisions involve, first, the target population and sample size. Sec-ondly, the survey design: Each of the options written survey, telephone survey, face-to-face survey has specific advantages and disadvantages in terms of response rate, data reliability, costs involved, etc. As survey design is certainly a crucial aspect when collecting original data, Table 1 gives a brief overview of the advantages and disadvantages of the main survey types. In addition to the pros and cons of the types of data collection, practical problems can arise in the form of difficulties in obtaining address or phone number data, low literacy rate among respondents, etc.
Table 1 . Survey types for original data collection
Interview type Pros Cons/Question marks
Face-to-face High response rate ++Reliable information ++Little item non-response ++Useful for long questionnairesFiltering of questions
ExpensiveTime-consuming (especially for large
samples)Resources?Interviewer training?
Telephone (CATI) Good response rate +Reliable information +Little item non-response +Filtering
Resources?Quality of phone number data?Best for short questionnaires with
closed questions
Email/online InexpensiveUseful for large samplesOnline: direct data imputationOnline: filtering possible
Response rate?Item non-response?Quality of email data?Email: filtering difficult
Postal mail Useful for large samplesEasy to implement
Response rate??Item non-response??Filtering difficult
A third category of decision involves at what point in time will data be collected, and whether follow-up surveys or several waves of data collection are planned/needed, and if so, rather as panel data or repeated cross-sections, etc.
All these decisions on data collection are closely connected with the method, and it is particularly im-portant to take this into account from the very beginning (or as early as possible) when implementing the intervention.
If own data are collected, cooperation with the local partner is important. It is likely that the local part-ner also has incentives to collect data and/or learn about the effectiveness of the particular intervention or related policies. Involving the partner in data collection is clearly much preferable to own/exclusive

19
data collection by GIZ. First, GIZ resources are unlikely to be sufficient for extensive data collection. Second, capacity building is supported by involving the partner. Third, data collection can be made sus-tainable this way (For an example see TVET Vietnam in section 7.2).
5 .5 Step five: Quantitative analysis
While this guide focuses on the methodological design of IE and corresponding data collection, as pre-sented in the preceding steps one through four, a complete IE is finalized by quantitative analysis of the data collected following the chosen design. This quantitative analysis constitutes the fifth and final step of the impact evaluation.
The first part of the quantitative analysis consists usually of a descriptive analysis of the data. A sequence of descriptive/summary statistics (tables) serves to present details of the sample, its characteristics, etc. The second part consists of estimating the intervention effects using the chosen design (i.e. comparing outcomes of treatment and control groups in a CSC, BAC, or DID, respectively). Depending on the design and therefore the degree of econometric analysis (not) involved, this part can be more or less technical. In any case, it is the core part of the quantitative analysis. The final step then is to interpret the results and to formulate policy implications.
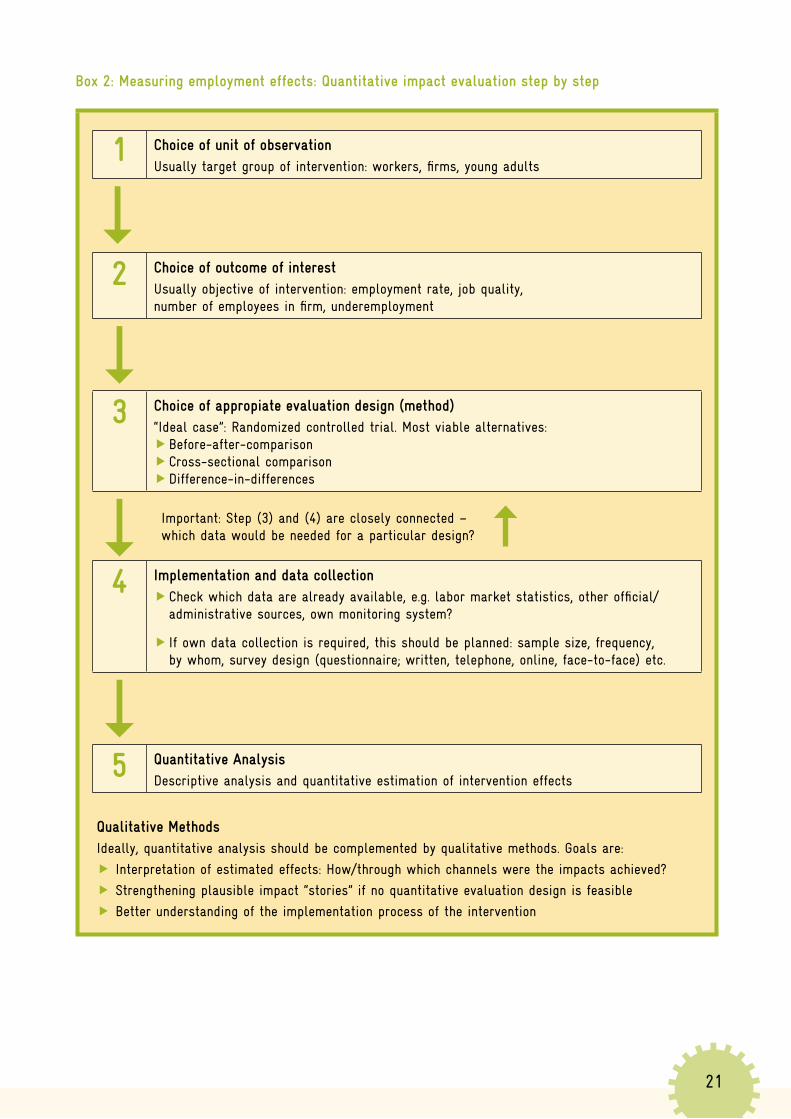
Box 2 (see page 21) gives a brief overview of the five steps of quantitative IE and complementing quali-tative analysis.
5 .6 Mixed methods
The importance of using a “mixed methods” approach to IE in the development context is frequently cited and emphasized (cf. NONIE 2009, footnote 8 above). This means that the quantitative analysis described in this guideline should be complemented by some qualitative analyses, such as case studies or face-to-face interviews with practitioners, beneficiaries of the intervention, and other stakeholders in-volved.18 Complementing the quantitative analysis in this way may serve three different purposes.
First, the interpretation of effects and understanding of causal mechanisms. The methods outlined in this guide focus on a quantitative assessment of the impacts of a given intervention. The objective of such an analysis (steps one through five in sections 5.1 to 5.5) is to determine - on the basis of empiri-cal evidence - that for instance the support of TVET schools in a particular country increased gradu-ates’ employment rate in a given sector by 10 percentage points. To be able to state such a result with sufficient confidence (i.e. as a robust estimate on the basis of a sound methodological design and corre-sponding data collection) is difficult enough, as hopefully made clear in the preceding discussion. None-theless, the point estimate itself – while certainly providing grounds justifying the intervention – cannot be informative regarding questions such as “How/through which channels did the intervention bring about this 10 percentage point increase?” or “Which activity contributed the most?” To answer such questions, additional information from qualitative analysis is required. This complements the analysis of whether an intervention works or does not work (the theme of this guide) by also answering the ques-tion why it works or does not work.
18 More detailed descriptions of qualitative evaluation methods are beyond the scope of this guide. There is extensive literature on this topic, see for example Patton, M. Q. (2002), Qualitative Research & Evaluation Methods, and Flick, U. (2006), Qualitative Evaluationsforschung – Konzepte, Methoden, Umsetzung.

20
Second, for impact assessment. Qualitative analysis can serve to strengthen the plausibility of results in the case of a methodologically limited quantitative analysis. It relates to the question “What to do when no (entirely convincing) causal design for IE can be put into practice?”, because in certain settings a strict methodological design from which a causal effect can be inferred may not be possible. For exam-ple, consider a setting in which a given sector is supported by a PSD intervention and only a BAC de-sign can be implemented, but that it remains likely that other factors may have contributed to changes over time. One possible approach then would be to do the BAC, but look at other sectors to get a feel-ing (approximate trend) for the development of the economy as a whole. This may not be a strict causal design per se, but it could still tell a plausible story about the impact of the intervention.
Third, to learn about the intervention. Frequently, it can be useful and informative to conduct inter-views with enterprise representatives, development practitioners and anybody involved in implementing the intervention to learn in which way and to what extent an intervention was implemented. This is especially important when no strict “with or without the intervention” regime exists, and one has vari-ous degrees of exposure to an intervention.
Qualitative data are typically collected by way of focus groups, or semi-structured/face-to-face interviews.
21
Box 2: Measuring employment effects: Quantitative impact evaluation step by step
1 Choice of unit of observationUsually target group of intervention: workers, firms, young adults
2 Choice of outcome of interest
Usually objective of intervention: employment rate, job quality, number of employees in firm, underemployment
3 Choice of appropiate evaluation design (method)
“Ideal case”: Randomized controlled trial. Most viable alternatives: Before-after-comparison Cross-sectional comparison Difference-in-differences
Important: Step (3) and (4) are closely connected – which data would be needed for a particular design?
4 Implementation and data collection Check which data are already available, e.g. labor market statistics, other official/
administrative sources, own monitoring system?
If own data collection is required, this should be planned: sample size, frequency, by whom, survey design (questionnaire; written, telephone, online, face-to-face) etc.
5 Quantitative Analysis
Descriptive analysis and quantitative estimation of intervention effects
Qualitative MethodsIdeally, quantitative analysis should be complemented by qualitative methods. Goals are:
Interpretation of estimated effects: How/through which channels were the impacts achieved?
Strengthening plausible impact “stories” if no quantitative evaluation design is feasible
Better understanding of the implementation process of the intervention

22
6 . Applying the guideline – Context I: Vocational education and labor markets
Specifics of the context: It is generally “easier” to find an appropriate IE design for estimating employ-ment effects in the context of training and labor market measures than in the context of PSD (see con-text II in section 7 below), because a) usually a more direct assignment (causal link) of the intervention to the outcome (and its measurement) is possible, b) comparable control groups are more easily identifi-able, and c) corresponding data can be collected in a more straightforward way (e.g. surveys of partici-pants and non-participants, with sufficiently large sample sizes).
6 .1 Example A – University reform in Ethiopia (BAC)
The intervention: The comprehensive ecbp (engineering capacity building program), supported by German development cooperation, consists of four components implemented by various Ethiopian partner organizations. Component 1 supports university reform. Specifically, curricula of engineering courses in the technical faculties were altered to contain more practical and on-the-job education and more appropriately qualify students for the labor market. As a result, courses delivered by the Ethiopian faculties will now last a total of five instead of previously four years of study with different contents and teaching methods. The first student cohort with the new curriculum started at Addis Ababa University (AAU) in 2006, and will thus graduate in 2011. In 2007, students at four more universities started their courses based on the reformed curriculum (graduation in 2012).
Specific challenge for IE: While the evaluation is accompanying the intervention (i.e. the reformed curricula at Ethiopian technical faculties) and a BAC can be implemented comparing labor market per-formance (employment rates) of pre-reform student cohorts (the last at AAU graduating in 2009) with post-reform cohorts (the first at AAU in 2011), it will be challenging to rule out confounding variables given the length of the timeline before-after.
Step 1:
The Ethiopian university reform supported by ecbp implies altered and improved curricula for the uni-versity education of engineering students. Hence, engineering graduates constitute the unit of observa-tion of interest.
Step 2:
The university reform targets that the graduates better meet the demands of the labor market, leading to higher employment, therewith contributing to economic growth. The core outcome indicator is there-fore the employment rate among cohorts of graduates. Also, tenure on these jobs is of interest. Various subjective outcomes – such as whether graduates feel appropriately trained for the labor market or how difficult it was finding a job – can also be taken into account on the basis of a follow-up survey (tracer study) among graduates.
Step 3:
The employment effects of the university reform in Ethiopia are being assessed using a BAC. The pre-re-form employment performance – average employment rate – of AAU university graduates in 2008 and 2009 will be monitored (cf. data collection below) to provide a measurement of the “before” outcome. For the other four universities, which introduced the new curriculum one year later, the pre-reform co-horts will be 2009 and 2010. Then, starting with graduates in 2011 (AAU, in 2012 at the other univer-sities), the “after” outcome will be measured.
23
It had been discussed if in 2009, and also from 2010 onwards, comparable non-reform universities might be included and students from these universities also surveyed – this would have allowed the implementation of a DID approach, comparing students’ outcomes for reform and non-reform uni-versities both before and after curricula reform took place. This idea, while methodologically promis-ing, proved to be too intricate to implement. Some variant of a DID approach, however, will likely be implementable within the reform universities due to the different starting dates, because due to the ‘sliding’ implementation of the reform across universities some of the universities – those that will then reform their curricula in later years – constitute a “before” comparison group for the other universities that implement the reform earlier.
To understand more about the labor market orientation of the revised curricula, surveys of (potential) employers are conducted which assess their satisfaction with the (perceived) knowledge and skills of the graduates.
Step 4:
Checking data availability found that no administrative data exist to implement this design (or any other feasible approach). Consequently, to analyze the reform effects new data are necessary. Tracer stud-ies are implemented, in which graduates are interviewed at the time of graduation, and followed-up in email surveys about 6 months and 12 months after graduation to measure employment rates and job tenure (among other outcomes). A net sample size of 100 graduates per school and year, and eventually at least five universities is targeted. Average outcomes of the cohorts before and after the reform are used to implement the BAC and measure program effectiveness. Data collection is undertaken in cooperation with the universities, which have an inherent interest in the career progression of their students, and in the medium-term should be done by universities alone. A sample questionnaire collecting 1st wave data at the time of graduation is given in Annex A1.
6 .2 Example B – Ex-post assessment of TVET support in Vietnam (CSC)
The intervention: 11 TVET colleges across the country receive support within the GIZ program “Promotion of Key Vocational Training Centres”. The support comprises teacher training, changes in curricula (to some extent), and technical support. As a result, the Vietnamese TVET colleges will offer revised curricula. The timeframe of the program was 2006–2010.
Specific challenge for IE: Ex-post evaluation. While the program had been running since 2006, evalu-ation efforts started only in 2009. Thus, a BAC is not possible, as no baseline data on pre-intervention outcomes (employment rates among graduates of supported colleges, cf. below) exist, and a retrospec-tive collection of this baseline information is not possible. Further challenges: the 11 schools are spread across the country, and comparisons across regions are problematic, as is the possibility of finding com-parable non-supported schools within regions.
Step 1:
The program intends to make Vietnamese TVET education congruent with “labor market needs”. TVET graduates constitute the unit of observation of interest.
Step 2:
The objective of making TVET congruent with labor market needs implies increased employment chances for TVET graduates. This is measured using post-graduation employment rates among graduates.

24
Step 3:
Since the program had been running for some years already, a BAC was not possible. Also a baseline on pre-program outcomes (= retrospective collection of employment rate data for pre-intervention co-horts of TVET graduates) could not be implemented. Therefore, a CSC seemed to be the only feasible option. At first glance, this also appeared difficult, if not impossible, since data on comparable non-supported schools seemed impossible to collect – first, because identifying comparable schools at all is difficult, and secondly, even if comparable schools were identified, it would be difficult to convince them to cooperate in collecting data (step 4 below), as non-supported schools have very little incentive to allocate resources to collecting tracer study data and follow up students.
Eventually the following design was chosen: The intervention targeted only specific occupations within each school. That is, a CSC can be implemented within schools comparing outcomes (employment rates) for graduates in supported occupations with those graduates in non-supported occupations.
Advantages of this approach: It was virtually the only way to do an IE in this context at all. Moreover, heterogeneity between schools and regions (controlling for which would be a major challenge in analyz-ing this type of program) is controlled for as graduates from the same school are compared with each other, who then try to find employment in the same local labor market. One potential drawback to the chosen approach remains: Within-school spill-over effects from training those teachers in specific occu-pations to teachers in other occupations cannot be ruled out, i.e. it may be questionable to what extent the non-supported occupational courses are really not supported.
Moreover, there may be different labor market demand for the different occupations. To take this into account, either another wave of data collection over time is required (the next cohort of graduates) or some complementing analysis on the general (previous) situation of TVET graduates in the Vietnamese labor market on the basis of administrative data.
Step 4:
No administrative data for the IE itself exist. Data were collected using a tracer study. In each of the 11 TVET schools, all graduates in 2009 were interviewed at the time of graduation (1st wave), and subse-quently at 6 months after leaving school (2nd wave = follow-up). The 1st wave interview covers students’ immediate subjective training evaluation and their personal employment expectations. The 2nd wave col-lects data on graduates’ actual post-graduation experience on the labor market. Interviews were on the basis of a written survey, covering the full sample (population) of graduates in each school. Graduates not responding to the written survey were followed up by telephone. This was done by the 11 TVET schools themselves – who were provided with the survey instrument by GIZ and were trained by the consultants to conduct the tracer study.
The timeline was as follows: In June 2009 a first workshop took place in Hanoi during which the tracer study design was presented and discussed with the 11 schools. In August 2009 a second workshop took place during which the survey instrument was presented and discussed, and schools were trained in sending out surveys, following up students, and imputing the collected information into Excel sheets. The Excel sheets were provided by GIZ to the Vietnamese partners and included easy-to-use drop-down menus for data imputation. Directly after the second workshop, schools started to send out the 1st wave surveys for the 2009 graduates. During the time period October – December 2009 the 1st wave data collection and imputation was completed.

25
In February – March 2010 the 2nd wave follow-up survey was conducted in the same way. At a subse-quent training workshop in May 2010 schools were then trained in basic descriptive analysis of the data they collected for their own school/graduates. The aggregate data of all schools was analyzed by GIZ/consultants and presented at a results workshop, also in May 2010. The sample questionnaire for the 2nd wave is presented in Annex A2.
It is worth emphasizing the structures of capacity building and cooperation implied in this evaluation project. First, the supported TVET schools were informed about the usefulness of tracer studies for their own steering purposes, they were involved in designing the survey instrument, and they were trained in implementing the tracer study and basic data analysis. Second, the process was accompanied by the in-volvement of GDVT (General Department of Vocational Training), i.e. the responsible national author-ity, which actively supported the project through its National Institute for Vocational Training (NIVT), whose researchers in turn assisted the schools in the practical process of implementing the survey. This set-up ensured that both the capacities (at school and NIVT level) and the administrative structures (between schools, GDVT, and NIVT) were built in a sustainable way in order to continue the tracer studies annually beyond the end of the GIZ project. In fact, a second round of graduates’ tracer study was already implemented in this way in 2010/2011. Third, besides the (small) costs for the workshops, the implementation of the tracer study evaluation incurred no further costs to the project due to the full integration of local stakeholders.
Step 5:
Aggregate data from all schools and both the 2009/10 and 2010/11 rounds of the tracer study are cur-rently being analyzed by GIZ/project consultants. A full report jointly prepared with GDVT is sched-uled to be published in the second half of 2011. First results from the 2009/10 round indicate satisfac-tory sample sizes and response rates (about 4,600 students in the 1st wave, about 2,500 students in the 2nd wave) and a positive subjective training evaluation by the TVET graduates.
6 .3 Example C – TVET support in Indonesia (DID)
The intervention: The program Sustainable Economic Development through Technical and Vocational Education and Training (SED-TVET) consists of 4 components: 1) improvement of the regulatory framework for TVET and employment promotion; 2) provision and utilisation of labor market in-formation; 3) consolidation of job-relevant training and further training models; 4) introduction of a national examination/certification system. During the SED-TVET starting phase in 2010, 11 senior secondary schools and respective trades/occupations were selected for comprehensive support, which encompasses devising school development plans, improving maintenance and quality management, adapting curricula as well as capacity building at the level of teachers and school management.
Specific challenge for IE: The selected institutes are located in 5 geographically and economically dif-ferent provinces - Central Java, West Java, DI Yogyakarta, South Sulawesi and East Kalimantan – which are characterized by distinct labor market demands. In addition, each school offers a different set of competency programs, which provide skills relevant to different types of employment. The methodo-logical challenge therefore is to construct an appropriate comparison group that adequately reflects the counterfactual situation.

26
Step 1:
TVET graduates of supported vocational education institutes constitute the unit of observation.
Step 2:
The evaluation design aims to answer the question “What is the impact of strengthening promoted vocational education institutes on (female and male) students’ educational and labor market outcomes?”
Step 3:
Since the program is still in its initial phase, it is feasible to collect baseline data for both treatment and comparison groups. As the most appropriate method a Difference-in-Differences (DID) approach was chosen. DID relies on a comparison of participants and non-participants before and after the inter-vention. This approach allows to control for observable and unobserved differences between graduates from supported institutes (treatment group) and graduates from non-supported institutes (comparison group), on the condition that these are time-invariant. In the case of SED-TVET, the DID has the dis-tinct advantage that it serves (a) to mitigate the described heterogeneity of the supported schools and comparison schools, and (b) to factor out time-variant changes in employment prospects due to the general economic situation.
While different selection procedures were considered, it was finally decided to select comparison institutes (the control group) in a step by step procedure, based on a set of weighted criteria, see below.
1 . Cluster by provinces
Only institutes from the same province as the promoted institutes have been considered for the control group. The number of comparison institutes should then equal the number of promoted in-stitutes within each province. The concerned provinces are: Central Java, West Java, DI Yogyakarta, South Sulawesi and East Kalimantan.
2 . The potential comparison institutes were then ranked according to the following criteria and weights:
a. Overlap of competency programs (criteria 1, weight: 1)
b. Economic situation of student’s families (criteria 2, weight: 0.4)
c. Average of three qualitative criteria (criteria 3, weight: 0.6)
– Applied/accepted students ratio (criteria 3.1)
– Student/teacher ratio (criteria 3.2)
– National accreditation score (criteria 3.4)
The following rules were applied:
For all criteria each comparison institute is compared to the average of the treatment institutes with-in that province. Then the comparison institutes are assigned corresponding values (10–0): 10 for the closest match, descending until 0.
The first 50% of institutes with the best match for competency programs are pre-selected; institutes with 0% competency program match are cancelled automatically.

27
If no data are available on certain qualitative criteria, the respective institute automatically receives the lowest number of points.
Applying this methodology, 11 institutes were selected as comparison group for the SED-TVET promoted institutes.
Step 4:
To measure student’s educational and labor market outcomes, SED-TVET will conduct tracer studies in cooperation with both promoted and comparison institutes. It is envisaged to integrate the implementa-tion of tracer studies into the broader capacity building that the institutes receive.

28
7 . Applying the guideline – Context II: Private sector development and business support
Specific challenges: In the context of PSD and business support the comparison dimension is gener-ally more difficult to identify than in context I, because of heterogeneity between companies, sectors, regions. Moreover, for typical technical cooperation interventions in this context – such as institutional support, advising ministries – no direct link exists between the intervention and targeted employment outcomes (such as aggregate employment rates), because the connection between intervention and outcome is through several steps in the results chain. Frequently in PSD interventions, firms in a tar-geted sector may not be supported directly, and are therefore not known. This ‘intermediary approach’ presents a considerable challenge both methodologically as well as with regard to data collection. Finally, net effects, even if identifiable at the firm level, may still be offset e.g. by displacement effects within a sector or across sectors (cf. above).
There is also a potential conflict between competitiveness and employment creation: Employment ef-fects may not materialize in supported firms themselves, but in partner firms, in particular when sup-porting value chains. Also when supporting competitiveness/organizational restructuring, employment effects may materialize in outsourcing to partners. Potential control for this: non-competitive firms dis-appear, as there is more job destruction in these firms relative to competitive ones.
7 .1 Example D – Private sector support in Ethiopia (BAC)
Intervention: Component 4 of ecbp consists of support to firms through specifically supported Ethio-pian institutions in the leather sector, textile, agro-processing, and various other sectors.
Specific challenge: A comparison of firms within-sector is difficult because often all or most firms in the sector are supported. And a between-sector comparison is difficult because sectors are very heteroge-neous and thus not comparable.
Step 1:
The business support to the private sector delivered by ecbp in Ethiopia targets e.g. companies in the leather sector. Hence these constitute the unit of observation of interest.
Step 2:
Employment outcomes of business support measures are not easily defined. At the firm level, increasing numbers of employees may constitute a sign of firm success – and therefore also program success – if turnover and profits show similar developments. On the other hand, business support may help make production more efficient, thus potentially lowering employee numbers while being successful. Hence, the appropriate definition and measuring of employment outcomes of ecbp’s business support in Ethio-pia needs to take into account a) exact definition of program objectives, b) parallel development of other outcomes (turnover, profits, wages), c) in-depth look at program mechanisms while the support is being implemented, e.g. by interviewing firm managers and experts providing the support.
Step 3:
To evaluate business support measures in Ethiopia using a CSC is difficult, since ecbp provides support to whole subsectors, and therefore comparable non-supported firms within the same subsector are not available – also, a comparison of sectors is difficult due to substantial heterogeneity between sectors.

29
Hence, a BAC of supported firms was chosen as the only feasible method. Of course, the assumption that the “after” outcomes (employment, turnover, profits) are only influenced by the intervention but not by other factors – cyclical development in the economic environment – is particularly tricky in this context. The solution to this is a complementing descriptive/qualitative analysis of developments in other sectors of the economy.
Step 4:
A baseline survey of firms was conducted in 2007, providing the counterfactual of firms before support measures started. From 2009 onwards the “after” outcomes are assessed using data from face-to-face interviews of supported firms. The questionnaire that is the basis for the face-to-face interviews is pre-sented in Annex A3.
7 .2 Example E – Private Sector Development in Yemen (tracing the results chain)
The following example serves to illustrate the challenge of measuring employment effects in programs which operate mainly through political advisory. While it is difficult to implement the quantitative eval-uation designs described in chapter 5, using a pragmatic approach may still allow programs to generate meaningful and reliable data, which can be used for communication on impacts.
The intervention: Against the background of a set of core challenges for the Yemeni economy – includ-ing insufficient growth, low levels of investment, and high unemployment – the Private Sector Develop-ment Project (PSDP) was launched in October 2007 to help the Yemeni government address these eco-nomic challenges. The project intends to promote and facilitate private sector growth in Yemen through institutional counseling, advice and capacity building, operating at both the national and regional level. PSDP interventions are focused on three components:
1) Business enabling environment (BEE),
2) Business development services (BDS),
3) Financial Services (FS).
As private sector growth constitutes one key avenue to consolidating job growth, PSDP aims to increase aggregate employment through the result chain delineated in Figure 2 . The figure covers all of PSDP and is composed of the three component-specific result chains.
Specific challenge: As illustrated by Figure 2, the aggregate outcome is very distant from the input/in-tervention. This makes the task of attributing employment effects in the Yemeni economy to PSDP ac-tivities particularly challenging. A second challenge arises from the fact that, in order to address the first challenge and connect the intervention with the aggregate outcome, a reliable measure of the aggregate outcome is required. This can be an issue in the context of a developing economy, and in fact is the case for Yemen (see steps 3 and 4 below).

30
Figure 2: PSDP Result chain
Source: Elaborated by PSDP team.
Step 1:
The unit of observation of interest is the country Yemen, as the evaluation question to be answered con-siders the changes that PSDP has brought about in Yemen.
Step 2:
The outcome of interest is employment, ideally measured at the most aggregate level possible that can be connected with the intervention.
EmploymentIncome Generation
Outputs
Use ofOutput
Direct Benefit
IndirectBenefits
Highly Aggregated Benefits
PovertyReduction (MDG 1)
a) Donorscoordinateinterventions
a) A PSD working group have been established and meets regularly.
a) The network and relationship between CCIs and FYCCI is improved
b) GIA has improved capacity to promote investment and provide services to investors.
c) MoIT has increased capacities to provide information and develop support programs for Yemeni industries
d) Instruments, structures and regulations are in place to make PPD and PPP possible
e) Institutions (LEDD, MoIT, GIA, …) are enabled to implement economic development measures
a) FYCCI uses improved relationship to reinforce representation
b) GIA promotes investment efficiently and provides improved services to investors.
c) MoIT provides better information and implement support programs for Yemeni industries.
d) Public and private institutions engage in PPD and PPP events
e) Partner institutions (LEDD, MoIT, GIA, …) implement economic development measures.
Business Enabling EnvironmentPromotional set-up more responsive to private sector growth
Business Development ServicesThe private sector has better access to effective promotion services
Financial services Framework conditions for financial institu-tions have improved
a) Partner organizations enabled to support business women
b) SMEPS has improved capacities, necessary instruments to support clients and develop certain subsectors
c) CCIs in Mukalla, Aden and Taiz are qualified to provide better services in selected fields to private sector
a) Partners provide better services to business women
b) SMEPS provides support to clints and develop certain subsectors
c) CCIs offer better services in selected fields to private sector
a) A concept for transforming SEDF into a bank is developed.
b) CBY has trained staff for bank supervision and regulation.
c) The staff of CBY is qualified to establish and operate the credit bureau.
a) SEDF is transformed into a bank
b) CBY efficiently supervises and regulates banking sector
c) CBY operates efficiently and effectively the credit bureau
Overall objective: The legal, institutional and regulatory framework and support instruments for private sector development have been improved
Higher economic growthHigher competitiveness (MDG competitiveness of SME) More investment (MDG improved economic dynamics)

31
Steps 3 and 4:
The classic micro-level evaluation methods outlined in this guideline are not applicable in this context. A CSC is not feasible, since there exists no comparable non-intervention country that could be used as a convincing counterfactual. In principle, a BAC might be used to get at least a vague idea of how aggre-gate employment in Yemen has developed during the timeline “before PSDP” until “after PSDP”. The clear problem is, of course, that it would be virtually impossible to rule out confounding factors possi-bly explaining any before-after changes. In addition, data restrictions preclude this approach, as no reli-able estimate of aggregate employment “before PSDP” exists: The last labor force survey in Yemen was undertaken in 1999, and current employment figures are extrapolations from the 2004 census, making both sources equally inadequate for measuring the employment development in Yemen. Two surveys by the ILO and the World Bank, respectively, are scheduled to be implemented soon, but will not generate data on aggregate employment before early 2012.
The methodological suggestion identified for assessing employment effects of PSDP therefore centers on the idea of breaking down the result chain, linking and monitoring as detailed as possible the inter-vention step-by-step with employment outcomes effectuated by stakeholders that PSDP works with. This essentially consists of three steps that are illustrated in Figure 3, in which the top part takes out the main boxes from the result chain (here using the BEE component as one example), the red text at the bottom illustrates the core steps to be undertaken (1–3), and the blue text refers to the data sources that can be used to undertake the three steps.
Step one consists of a detailed monitoring of PSDP activities along with the output of the interven-tion. Data for this come from the PSDP monitoring system. Step two consists of linking the output with the effect it has on the partner organization. For instance, if staff of the Ministry of Industry and Trade (MoIT) has been trained in technical issues and organizational development (output), this has a beneficial effect on MoIT’s service provision and implementation of strategies for economic develop-ment (benefit at partner level). It is important that an effort be made to quantify this link: This can be done e.g. through measuring PSDP activity with a specific partner as a fraction of the total activity that the partner has with all donors (taking into account also that part of an effective service provision can be ascribed idiosyncratically to the partner), or through structured interviews (a qualitative evaluation technique) with the objective of measuring the (percentage) contribution that PSDP has with regard to partner activity. In a third step, the partner activity is linked to quantitative employment outcomes. These employment outcomes will be measured partner-specific (and component-specific), and the over-all effect of PSDP on aggregate employment can then be quantified by summing over these component- and partner-specific employment impacts. Data sources for quantifying the employment outcomes in-fluenced by partner activity include partner monitoring systems (e.g. in the case of the Yemeni General Investment Authority/GIA) or other sources such as the Local Business Environment Survey (LBES) initiated by PSDP, or the Labor Market Information Analysis (LMIA).
The approach of “breaking down the result chain” therefore builds on the following procedure:
Proceed by component: BEE, BDS, FS,
Within a given component, proceed by partner.

32
For each particular component-partner-combination, assess/monitor/measure the three steps described above:
1. Project activities = intervention, and their output,
2. Benefit at the partner level (i.e. improved partner actions),
3. Partner impacts on employment.
For all three steps, data sources need to be identified (and existing data will need to be developed further to measure future PSDP effects); collect these data from the available sources.
Once the link between 1) and 2) has been quantified – i.e. the % contribution of PSDP to partner activity – and the link between 2) and 3) has been quantified – employment outcomes associated with partner activity – for all components and partners, then PSDP employment effects can be measured by aggregating across components and partners.
It is clear that for implementing this approach assumptions (about percentages, about links) will have to be made, which need to be laid open and justified. Also, it is likely that in some cases a broader look at "employment" outcomes will be required: For instance, for the link between 2) and 3) some data sources monitor number of Small and Micro Enterprises (SMEs) only. In order to translate this into quantitative employment effects, some assumption on the average number of employees per newly cre-ated SME will likely be required. This can be done, and can be justified, however (the Yemeni Small Enterprise Development Fund/SEDF, one of the PSDP project partners, for instance, proceeds on the assumption that each business created comes with an average of 4–5 jobs).
Moreover, in implementing the approach it will have to be seen whether it is more useful to do so on the basis of annual data or by project phase. This likely depends on data availability. In principle it is desirable to collect data as disaggregated as possible – in this case: annual – since subsequent aggregation is then always possible.
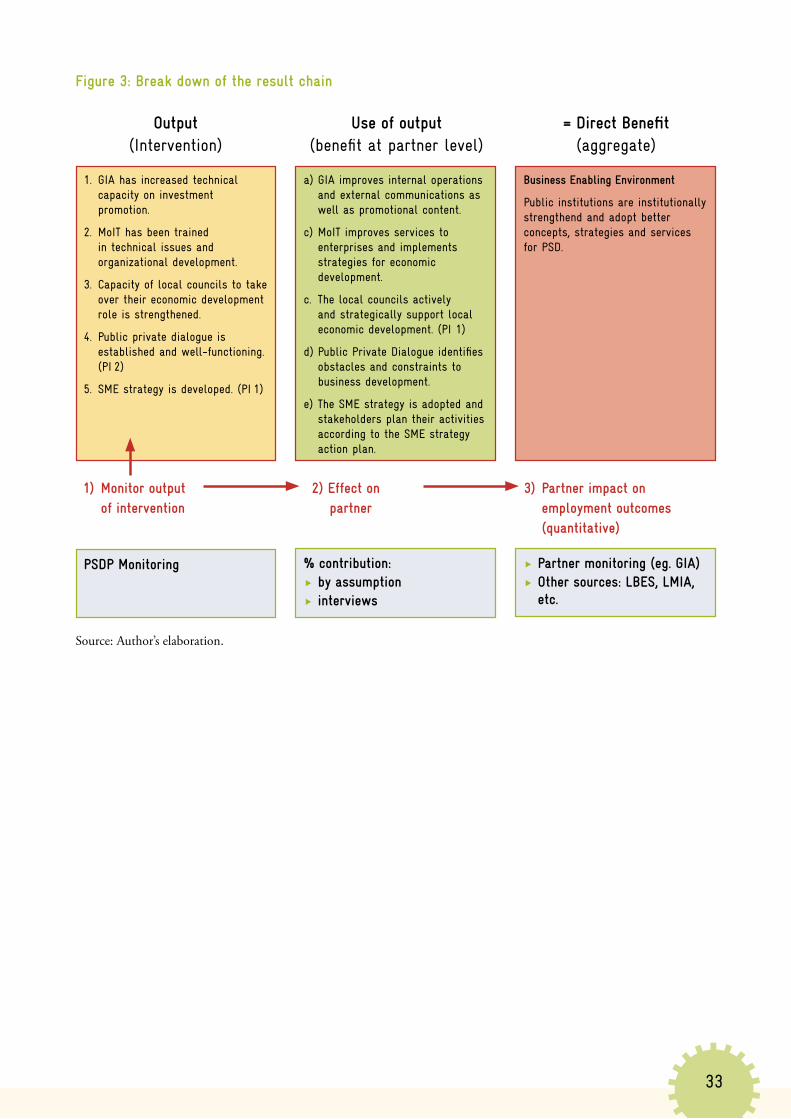
33
Figure 3: Break down of the result chain
Source: Author’s elaboration.
Output(Intervention)
Use of output(benefit at partner level)
= Direct Benefit(aggregate)
1. GIA has increased technical capacity on investment promotion.
2. MoIT has been trained in technical issues and organizational development.
3. Capacity of local councils to take over their economic development role is strengthened.
4. Public private dialogue is established and well-functioning. (PI 2)
5. SME strategy is developed. (PI 1)
a) GIA improves internal operations and external communications as well as promotional content.
c) MoIT improves services to enterprises and implements strategies for economic development.
c. The local councils actively and strategically support local economic development. (PI 1)
d) Public Private Dialogue identifies obstacles and constraints to business development.
e) The SME strategy is adopted and stakeholders plan their activities according to the SME strategy action plan.
Business Enabling Environment
Public institutions are institutionally strengthend and adopt better concepts, strategies and services for PSD.
PSDP Monitoring % contribution:by assumptioninterviews
3) Partner impact on employment outcomes (quantitative)
1) Monitor output of intervention
2) Effect on partner
Partner monitoring (eg . GIA)Other sources: LBES, LMIA,
etc .

34
Annex: Sample Questionnaires A1: ecbp Ethiopia Component 1: University graduates, 1st wave (at time of graduation)1. How old are you?
2. What is your gender? Male Female
3. What region are you originally from?
Addis Ababa Dire Dawa Somali Afar Gambela SNNPR Amhara Harari Tigray Benishangul Oromia
4. In which department have you been studying?
Civil Engineering Construction Technology and Management Chemical Engineering Urban and Regional Planning Mechanical Engineering Electrical Engineering Standard Architecture Computer Engineering
5. Is this the field you wanted to specialize in (one of the priorities you have chosen in the beginning)?
Yes No6. If “No“, what study program would you have liked to study?”
7. Do you plan to continue with a Master‘s degree or do you plan to start working?
Continue studying Work 8. What kind of work would you like to take up after graduation?
Employee public enterprise Government Organization Employee private enterprise Non Government Organization Self-employment I don’t know Consultant
9. Do you think finding that type of job will be:
Easy Difficult I don‘t know 10. Did you already start searching?
Yes No11. How are you searching/will you search for a job?
Internet Personal contacts (family, friends) Newspaper Other, please specify: Placement by University
12. Which of the following extra-curricula classes have you ever taken?
Computer classes Business plan writing Training on specific software CV writing Entrepreneurship Other, please specify: None
13. How do you rate your laboratory practice within the Faculty of Technology?
Very good Poor No laboratory practice Good Very poor
14. Have you ever done an internship practice in the industry during your studies?
Yes No15. Have you ever got consultation from the university on how to find a job after graduation (career counselling)?
Yes No

35
A2: Promotion of TVET Vietnam: Graduates 2nd wave (follow-up after 6 months)
Please put the code of graduate before sendingAddress and Logo of the TVET Institute
TVET Monitoring Questionnaire
Dear Graduate,We would be most grateful if you could kindly fill out the following questionnaire about your job-experience since you graduated from [name of the TVET Institute]. The provided information will be of great importance for the TVET Institute to improve the training quality.If you have any question or need any explanation to answer this questionnaire, please feel free to contact us:
Contact person:
Name:
Phone number: Email:
Thank you very much!(Please tick only one box per question)
A . Personal information
1. Your gender Male Female
2. Your date of birth: ……/……/19……
3. Regarding your training at [name of the TVET Institute], please state how your certificate/degree was ranked:
Pass Pass plus Good Very good Excellent
B . Labor market experience and education
4. Please indicate your current labor market status:
Wage paid Self employed Not employed –> continue with question 145. How many hours per week do you work on average? hours
6. how long did it take you to start your current (self )employment after graduation?
Less than 1 month 1–3 months More than 3 months7. How did you find this job?
Placement by vocational training institute Personal contacts (family, friends) Placement by a job agency Job advertisement in the internet Job advertisement in newspaper/radio/TV Job fare Other, please specify:
8. Is your job related to the training you received at [name of the TVET Institute]?
Closely related Somewhat related Not related9. Please state your monthly salary. In case you are self employed, please state the monthly income that is generated
by your self-employment. Write either the exact amount or tick the appropriate category.
Exact amount: VNDCategory: <1 million 1–2 million 2–4 million 4–8 million >8 million
10. How many employees work in the enterprise you are currently employed in? In case of self-employment, please state the total number of employees in your business including yourself:
1 2–10 10–200 200–800 More than 800

36
11. Did you receive any on-the-job-training since you started working in this firm?
No (please continue with question 13) Yes. Please state the total length of the on-the-job-training you received in this firm? < 2 weeks 2–5 weeks 1–2 months 2–5 months > 5 months
12. Assume that your firm’s hierarchy/positions range from 1, which is the lowest possible position in your firm, to 10, the highest position. Please indicate where you locate your job in this hierarchy by crossing one of the numbers:
1 2 3 4 5 6 7 8 9 8 9 10 13. Please indicate name, address and phone number of the company you work in:
Company name:
Address:
Phone number: Email/website:
Please indicate the sector of the company:
Agriculture, forestry, fishery Construction Industrie production Services (hotel, restaurant, bank, …) Education/training State office (ministry, province committee, …) Trade Others, please specify:
Please answer this section (from Qs. 14 to 16) if you are currently NOT employed14. What is the reason for your non-employment?
Could not find a job –> continue with question 15 Further education –> continue with section C Other reason (please specify): –> continue with section D
15. For which jobs did you apply?
Jobs related to my trained occupation Jobs unrelated to my trained occupation
16. In your opinion, what were the reasons that you did not find a job? (you can tick more than one options)
Training did not fit job needs Lack of foreign language skills Lack of computer skills Lack of working experience Lack of information about the job Other, please specify:
C . Further education
17. Are you currently in further education?
No (please continue with question 18) Yes If yes, please indicate the name of the training institution and the kind of further education you are
currently participating in:
Name of training institution:
Name of the course:
Level of the course: University College Secondary Other

37
D . Training evaluation
How much do you agree to the following statements regarding the training at [name of the TVET Institute]?18. The training that I received provided the skills and knowledge required in the actual job
Strongly agree Agree Somewhat agree Disagree Strongly disagree19. The teaching staff of the vocational training institute was qualified and up to the training requirements
Strongly agree Agree Somewhat agree Disagree Strongly disagree20. The curriculum and subject syllabi are updated to be relevant to practical relevance
Strongly agree Agree Somewhat agree Disagree Strongly disagree21. Please consider theoretical and practical parts of the training course separately, how well did they prepare you for
working life?
Practical courses: Very good Good Average Bad Very badTheoretical courses: Very good Good Average Bad Very bad
22. In your opinion, where would you see highest need of improvement?
Learning materials (books, etc.) Teachers’ didactic qualification Equipment (machines, tools, etc.) Teachers’ specialized knowledge in his/her field Facilities (class rooms, library etc.) Internship/practical in-company training
23. Overall evaluation: The vocational training institute is a reputable training institution
Strongly agree Agree Somewhat agree Disagree Strongly disagree24. Overall evaluation: I am satisfied with the quality of training that I received in the vocational training institute
Strongly agree Agree Somewhat agree Disagree Strongly disagree
Data-protection statement:All given answers will be kept confidential, it will not be possible for persons or institutions other than the school that sent you this questionnaire to identify whether you participated in the survey or which answers you gave. Any reference that could be used to identify you, such as your name or your address, will be removed from the dataset at the end of this tracing period (approx. after one year).

38
A3: ecbp Ethiopia Component 4: Company questionnaire – assessing employers’ perspectives on graduate skills
Company Questionnaire 2010
Date and company:
Interviewer:
Respondent (name, position): M: F:
1. Region company is located:
1 A 5 B 9 CI . Company Activity
1.1 Sector of activity:
1) Construction 5) Textile/Garment 3) Chemicals & Pharmaceuticals 7) Others:
1.2 Product range (main products of the company):
1.3 Start of activity (approx.):
1.4 Member of business associations? (please specify) :
II . Business Climate
2.1 How do you evaluate the present state of business?
Bad Good
1 2 3 4 5 6 7 8 9 8 9 10 2.2 How do you evaluate your 3 years business outlook?
Worse Better
1 2 3 4 5 6 7 8 9 8 9 10

39
2.3 How do you rate the strengths and weaknesses of the business environment in Ethiopia?
Worse Better
Field 1 2 3 4 5 6 7 8 9 10
1) Access to capital 2) Access to skilled labor 3) Access to land 4) Infrastructure 5) Power supply 6) – tax 7) – export 8) – import 9) – labor laws 10) – licensing 11) – red tape 12) – corruption 13) Access to market information 14) Access to technology
III . Basic Economic Data
4.1 Turnover 2001 (if no exact figure, use categories):
< 2.000.000 12.000.000 – 14.000.000
2.000.000 – 4.000.000 14.000.000 – 16.000.000
4.000.000 – 6.000.000 16.000.000 – 18.000.000
6.000.000 – 8.000.000 18.000.000 – 20.000.000
8.000.000 – 10.000.000 > 20.000.000
10.000.000 – 12.000.000
4.1.1
1 Growing 2 Decreasing 3 No Growth
(explain briefly that this category targets the upgrading of employees, following the demands of the company)5.1 How many employees currently work in your company?
5.2 How many employees worked in your company a year ago?
5.3 How do you think your number of employees will develop in the next years?
A) 1 Year B) 3 Years1) Decrease (if yes, percent) 2) Stable 3) Increase (if yes, percent)

40
5.4 What is the percentage of women in your company?
1) Management: 2) Support Staff: 3) Production Staff: 5.5 What is the educational background of your employees? (percentages)
1) University (Engineering Faculties) 2)TVET 3) Other5.7 Which of the following competencies are you lacking the most in your company?
Easy to find Not availablea) Practical competence:
1 2 3 4 5 6 7 8 9 8 9 10 b) Theoretical competence?
1 2 3 4 5 6 7 8 9 8 9 10 c) Leadership competence?
1 2 3 4 5 6 7 8 9 8 9 10 d) Managerial competence?
1 2 3 4 5 6 7 8 9 8 9 10 5.8 Which of the qualification levels as listed below are the most difficult to find in the labor market?
Easy to find Not available
a) PhD:
1 2 3 4 5 6 7 8 9 8 9 10 b) Master:
1 2 3 4 5 6 7 8 9 8 9 10 easy to find Not availablec) Bachelor:
1 2 3 4 5 6 7 8 9 8 9 10 d) Polytechnic Technician (Level 5):
1 2 3 4 5 6 7 8 9 8 9 10 e) Master Craftsman (Level 4):
1 2 3 4 5 6 7 8 9 8 9 10 f ) Craftsman (Level 3):
1 2 3 4 5 6 7 8 9 8 9 10 g) Basic Craftsman (Level 2):
1 2 3 4 5 6 7 8 9 8 9 10 h) Semi-skilled Laborer (Level 1):
1 2 3 4 5 6 7 8 9 8 9 10
V .I TVET – Employees
5.9 Did you hire any TVET graduates?
1) Yes 2) No 5.9.1 How many TVET graduates did you hire in 2001?
5.10 How many of those were women?
5.11 What is the average salary of;
a) New TVET employees (less than one year): b) Old TVET employees
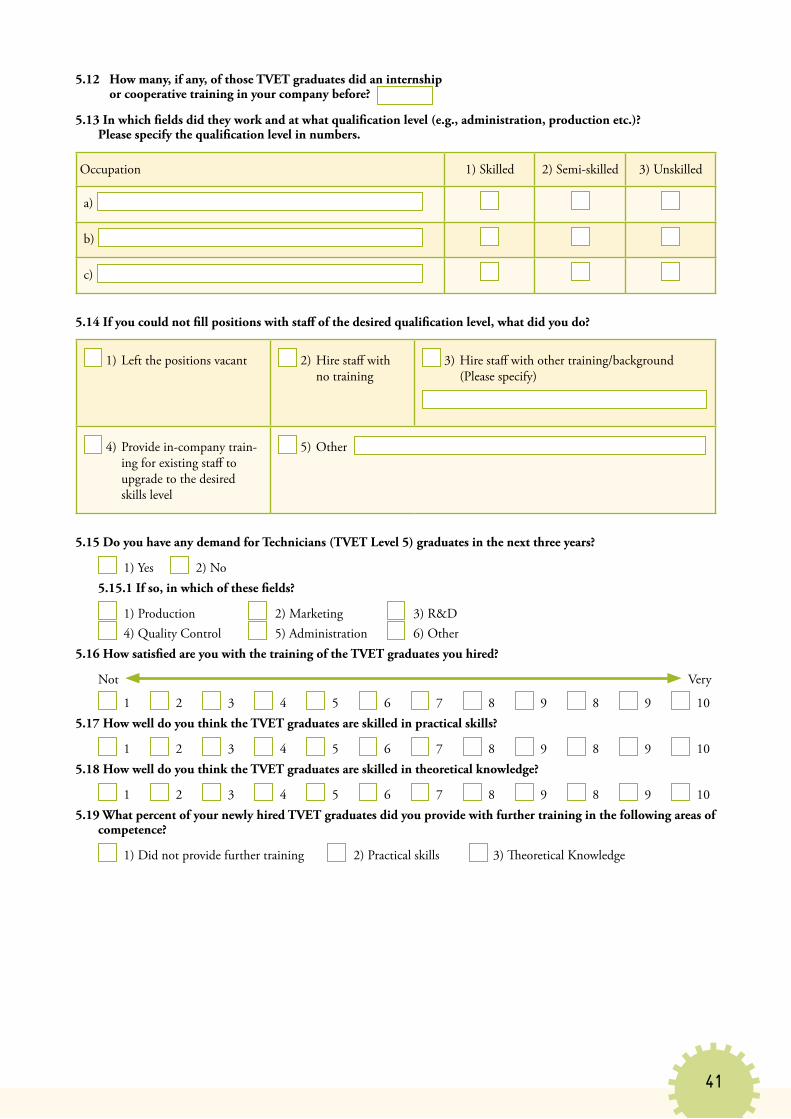
41
5.12 How many, if any, of those TVET graduates did an internship or cooperative training in your company before?
5.13 In which fields did they work and at what qualification level (e.g., administration, production etc.)? Please specify the qualification level in numbers.
Occupation 1) Skilled 2) Semi-skilled 3) Unskilled
a)
b)
c)
5.14 If you could not fill positions with staff of the desired qualification level, what did you do?
1) Left the positions vacant 2) Hire staff with no training
3) Hire staff with other training/background (Please specify)
4) Provide in-company train-ing for existing staff to upgrade to the desired skills level
5) Other
5.15 Do you have any demand for Technicians (TVET Level 5) graduates in the next three years?
1) Yes 2) No 5.15.1 If so, in which of these fields?
1) Production 2) Marketing 3) R&D 4) Quality Control 5) Administration 6) Other
5.16 How satisfied are you with the training of the TVET graduates you hired?
Not Very
1 2 3 4 5 6 7 8 9 8 9 10 5.17 How well do you think the TVET graduates are skilled in practical skills?
1 2 3 4 5 6 7 8 9 8 9 10 5.18 How well do you think the TVET graduates are skilled in theoretical knowledge?
1 2 3 4 5 6 7 8 9 8 9 10 5.19 What percent of your newly hired TVET graduates did you provide with further training in the following areas of
competence?
1) Did not provide further training 2) Practical skills 3) Theoretical Knowledge

42
V .II TVET – Internships & Cooperative training
5.31. Do you provide any internships for TVET graduates?
1) Yes 2) No5.31.1 How many TVET graduates did you provide with an internship in year x?
5.32 Which TVET Institutions did you cooperate with?
5.33 How satisfied are you with the cooperation?
Not Verya) College 1:
1 2 3 4 5 6 7 8 9 8 9 10 b) College 2:
1 2 3 4 5 6 7 8 9 8 9 10 5.34 Was the internship/Cooperative Training organized by
1) College 2) Student 3) Company5.35 Did the TVET Institution provide support through monitoring and site visits in order to improve the efficiency
of the internship/Cooperative training
1) Yes 2) No5.36 What is the average duration of a TVET internship in your company?
5.37 What benefits did you provide to the interns?
1) Allowance (salary) 2) Medical cost coverage 3) Meals
4) Medical Insurance 5)Transport costs allowance
5.38 How satisfied are you with the competence of the interns/trainees?Not Very
1 2 3 4 5 6 7 8 9 8 9 10
5.39 Do you consider hiring any of those interns?
1) Yes 2) No
43
References
Bauer, T. K., M. Fertig, C. M. Schmidt (2009), Empirische Wirtschaftsforschung: Eine Einführung, Springer Verlag, Berlin.
Donor Committee for Enterprise Development (2010), DCED Standard for Measuring Achievements in Private Sector Development. Control Points and Compliance Criteria; Version V, 13 January 2010. www.enterprise-development.org/page/measuring-and-reporting-results
Flick, U. (2006), Qualitative Evaluationsforschung – Konzepte, Methoden, Umsetzung, rororo: Reinbek.
Gertler, P. J., S. Martinez, P. Premand, L. B. Rawlings and C. M. J. Vermeersch (2011), Impact Evaluation in Practice, The International Bank for Reconstruction and Development/The World Bank: Washington, DC.
GTZ (2008), Results-based monitoring: Guidelines for Technical Cooperation. Eschborn, September.
GTZ (2010), Baseline Studies – A Guide to Planning and Conducting Studies, and to Evaluating and Using Results, GTZ Evaluation Unit, Eschborn.
Heckman, J. J., R. J. LaLonde and J. A. Smith (1999), The economics and econometrics of active labor market programs, in Ashenfelter, O. and D. Card (eds.), Handbook of Labor Economics 3, Elsevier, Amsterdam.
Kluve, J. (2007), Employment effects of the international cooperation in El Salvador at the municipal level, GTZ sector project “Employment-oriented development strategies and projects”, Mission report, December.
NONIE, F. Leeuw and J. Vaessen (2009), Impact Evaluations and Development – NONIE Guidance on Impact Evaluation, World Bank Independent Evaluation Group, Washington, DC.
OECD-DAC (2002), Glossary of Key Terms in Evaluation and Results Based Management. www.oecd.org/dac/evaluationnetwork/documents
Patton, M. Q. (2002), Qualitative Research & Evaluation Methods, Sage Publications, 3rd edition.
Ravallion, M. (2008), Evaluating Anti-Poverty Programs, pp 3787–3846, Handbook of Development Economics Vol. 4 (2008, R. E. Stevenson and T. P. Schultz (eds.), Amsterdam, North-Holland).
Todd, P. E. (2008), Evaluating Social Programs with Endogenous Program Placement and Selection of the Treated, pp 3847–3894, Handbook of Development Economics Vol. 4 (2008, R. E. Stevenson and T. P. Schultz (eds.), Amsterdam, North-Holland).

Deutsche Gesellschaft fürInternationale Zusammenarbeit Registered offices:Bonn and Eschborn, Germany Dag-Hammarskjöld-Weg 1-565760 EschbornPhone: +49 61 96 79-0Fax: +49 61 96 79-1115E-Mail: [email protected]: www.giz.de


