Page 1
© January 14, 2013 Dr. Lynn Fuller, Professor
Measuring Factory Performance
Page 1
Rochester Institute of Technology
Microelectronic Engineering
ROCHESTER INSTITUTE OF TECHNOLOGYMICROELECTRONIC ENGINEERING
Measuring Factory Performance
Dr. Lynn FullerWebpage: http://people.rit.edu/lffeee
Microelectronic EngineeringRochester Institute of Technology
82 Lomb Memorial DriveRochester, NY 14623-5604
Tel (585) 475-2035Fax (585) 475-5041
Email: [email protected] Webpage: http://www.microe.rit.edu
1-14-2013 Fac_pfm.ppt
Page 2
© January 14, 2013 Dr. Lynn Fuller, Professor
Measuring Factory Performance
Page 2
Rochester Institute of Technology
Microelectronic Engineering
ADOBE PRESENTER
This PowerPoint module has been published using Adobe Presenter. Please click on the Notes tab in the left panel to read the instructors comments for each slide. Manually advance the slide by clicking on the play arrow or pressing the page down key.
Page 3
© January 14, 2013 Dr. Lynn Fuller, Professor
Measuring Factory Performance
Page 3
Rochester Institute of Technology
Microelectronic Engineering
OUTLINE
Overview of Key Factory Measures
Details on Each Measurement
RIT Factory Performance
Lot StatusLine Speed
Cycle Time
Productivity
References
Review Questions
Page 4
© January 14, 2013 Dr. Lynn Fuller, Professor
Measuring Factory Performance
Page 4
Rochester Institute of Technology
Microelectronic Engineering
KEY FACTORY MEASURES
How much money is being made by the factory ($FAC)
Throughput - Factory Output (OUTS) - Ships
Line Yield (Yline)
Die Yield (Ydie)Inventory or Work in Progress (WIP)
Line Speed (Turns, T) turn refers to the movement
of one wafer through a manufacturing operation
WIP Turns (Ratio Turns/WIP)
Cycle Time (CT) times theoretical single wafer cycle timeProductivity (Turns/direct labor hour or T/DLH)
Page 5
© January 14, 2013 Dr. Lynn Fuller, Professor
Measuring Factory Performance
Page 5
Rochester Institute of Technology
Microelectronic Engineering
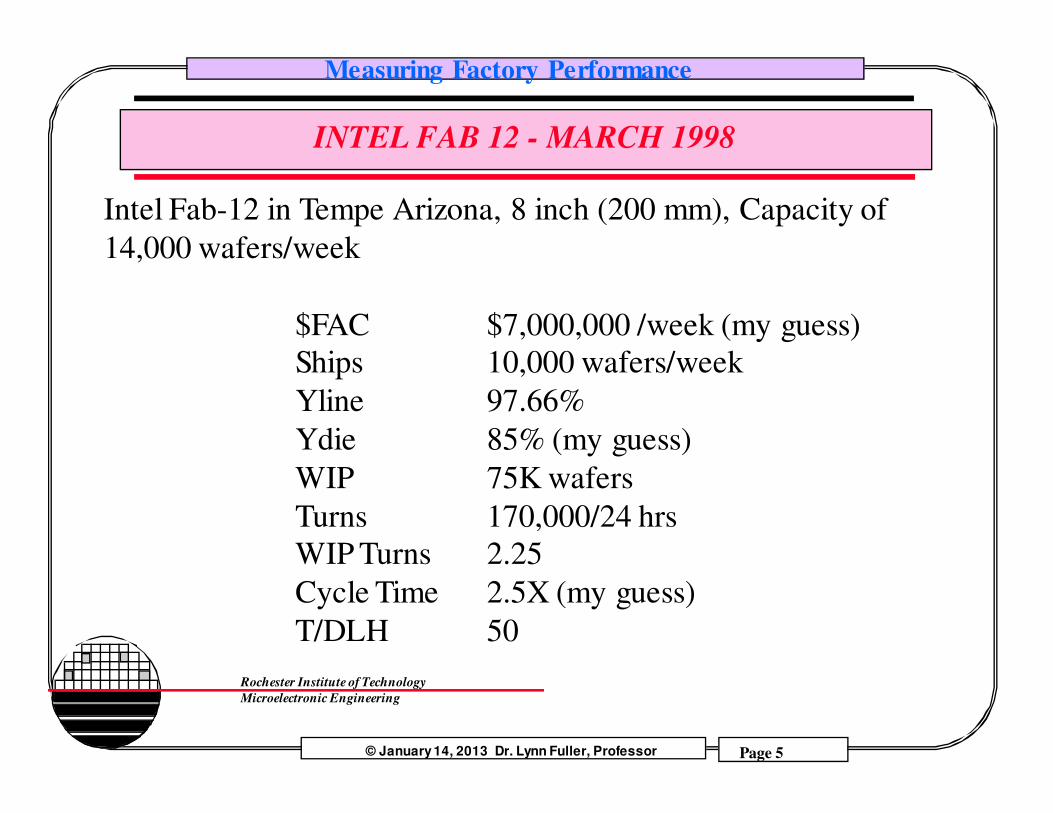
INTEL FAB 12 - MARCH 1998
Intel Fab-12 in Tempe Arizona, 8 inch (200 mm), Capacity of
14,000 wafers/week
$FAC $7,000,000 /week (my guess)Ships 10,000 wafers/week
Yline 97.66%
Ydie 85% (my guess)
WIP 75K wafers
Turns 170,000/24 hrsWIP Turns 2.25
Cycle Time 2.5X (my guess)
T/DLH 50
Page 6
© January 14, 2013 Dr. Lynn Fuller, Professor
Measuring Factory Performance
Page 6
Rochester Institute of Technology
Microelectronic Engineering
HOW MUCH MONEY IS BEING MADE
How many wafers are being produced per unit time (OUTS)
What is the cost per wafer ($W)
How many die per wafer (#DIE)
What is the line yield and the die yield What is the selling price per die ($SELL)
Example 1: 5000 wafers per week at $1500/wafer containing
200 die/wafer with line yield of 90% and die yield of 60%
and selling price of $30 each die.
$FAC = OUTS x #DIE x Ydie x Yline x $SELL - OUTS x $W)
= 5000 w/wk x 200 die/w x 90% x 60% x $30/die - 5000w/wk x $1500/w
= $16,200,000 - $7,500,000 = $8,700,000 per week
Page 7
© January 14, 2013 Dr. Lynn Fuller, Professor
Measuring Factory Performance
Page 7
Rochester Institute of Technology
Microelectronic Engineering
EXAMPLES
Example 2: If the selling price of the die drops to $15/die find $FAC
= $16,200,000/2 - $7,500,000 = $600,000 per week
Example 3: If the die yield is improved to 90% find $FAC for a die
selling price of $15
= ($16,200,000/2) x 0.9/0.6- $7,500,000 = $4,650,000 per week
Page 8
© January 14, 2013 Dr. Lynn Fuller, Professor
Measuring Factory Performance
Page 8
Rochester Institute of Technology
Microelectronic Engineering
WAFERS PRODUCED PER UNIT TIME
Factory Throughput - Ships - Outs Process FlowProduct MixInput (Ins)Factory CapacityEquipment Utilization
The process flow and product mix combine with the equipment capacity and defines bottlenecks, work in process and other factory dynamics. An increase in wafers input to the factory can increase the output up to the capacity of the factory and the bottlenecks in the factory.
Page 9
© January 14, 2013 Dr. Lynn Fuller, Professor
Measuring Factory Performance
Page 9
Rochester Institute of Technology
Microelectronic Engineering
PROCESS FLOW
A sequence of qualified operations - steps
Reentrant - the process returns to a given operation
more than once. Example: Photolithography
Several slightly different process flows such as 2layer poly, 3 layer metal, etc. are usually found
in a given factory.
Rework is allowed within a subset of steps.
Example: RIT p-well CMOS process
Step 1: Wafer Scribe Step 5: Photolithography Step 9: RCA Clean
Step 2: Four Point Probe Step 6: Oxide Etch Step 10: Well Drive
Step 3: RCA Clean Step 7: Implant Well etc.
Step 4: Alignment Oxide Step 8: Ash Resist etc.
Page 10
© January 14, 2013 Dr. Lynn Fuller, Professor
Measuring Factory Performance
Page 10
Rochester Institute of Technology
Microelectronic Engineering
PRODUCT MIX
Each factory has many products
Up to 100 different products
Masksets for each product
Process flow for each group of products
Example: A factory may run 5 CMOS like process and make 100 different products with 100 different masksets, each maskset consisting of 20-30 masks and a few revisions in either process or maskset.
Page 11
© January 14, 2013 Dr. Lynn Fuller, Professor
Measuring Factory Performance
Page 11
Rochester Institute of Technology
Microelectronic Engineering
EQUIPMENT UTILIZATION
Tool Capacity and ThroughputMTBF, MTTRMaintenanceEngineering LotsSetups
Depending on the products currently being run in the factory the factory will have different needs for tools. The tools each have a given capacity, mean time between failure MTBF, mean time to repair MTTR, maintenance schedule, etc.
Example: A stepper may have a capacity of 100 wafers per hour depending on the step size, chip size, photoresist speed, etc. In addition MTBF, MTTR, maintenance, engineering lots, setups (maskset changes), scheduling, etc., all contribute to the actual throughput. When the throughput is close to the capacity (~80%) then the tool is likely a bottleneck.
Page 12
© January 14, 2013 Dr. Lynn Fuller, Professor
Measuring Factory Performance
Page 12
Rochester Institute of Technology
Microelectronic Engineering
COST PER WAFER
Cost of Ownership ($COO)
Equipment Purchase Price ($P)
Variable Cost ($V)
Yield Loss Cost ($Y)
Cost of ownership is the total cost of owning a given tool. COO includes the purchase price, cost of borrowing money, variable costs such as cost of chemicals, electricity, and the cost of yield loss. Often the purchase price is less than the combined other costs over a year of operation. The cost is spread out over the total volume of wafers, amortized per wafer cost.
Page 13
© January 14, 2013 Dr. Lynn Fuller, Professor
Measuring Factory Performance
Page 13
Rochester Institute of Technology
Microelectronic Engineering
LINE YIELD AND DIE YIELD
Line Yield (Yline) is the % of wafers that finish the process
The best model is to extract from the manufacturing
database the yield at each step in the process and the overall yield
for the process. Some insight can be gained by using a model that takes the
average yield per step raised to the number of steps power.
Yline = (Yave) #Steps
Die Yield (Ydie) can be modeled
Ydie = exp (-AD) where A is die area
D is a defect density per cm2.
Page 14
© January 14, 2013 Dr. Lynn Fuller, Professor
Measuring Factory Performance
Page 14
Rochester Institute of Technology
Microelectronic Engineering
YIELD EXAMPLES
Example 4: If the average yield per step is 99%, find the overall
line yield after 250 steps
Yline = (Yave) #Steps
= 0.99^250
= 61%
Example 5: What defect density will give a die yield of 90% for
a chip with area of 1 cm2
Ydie = exp (-AD)
0.90 = exp (-1D)
D = - ln (0.90) = 0.105
Page 15
© January 14, 2013 Dr. Lynn Fuller, Professor
Measuring Factory Performance
Page 15
Rochester Institute of Technology
Microelectronic Engineering
SELLING PRICE
$100
$10
$1 time
1 2 3 4 5 6 7
year
Page 16
© January 14, 2013 Dr. Lynn Fuller, Professor
Measuring Factory Performance
Page 16
Rochester Institute of Technology
Microelectronic Engineering
RIT STUDENT RUN FACTORY WEEKLY REPORT
A weekly report is made by doing a query on the database to
find the current status of the lots in the factory and the lot
forward advancement made during the week. Lot starts, ships,
WIP, Yield Loss (Yline), number of moves, number of moves for each employee and other data are extracted and presented in
tabular and graphical form as shown on the following pages.
Page 17
© January 14, 2013 Dr. Lynn Fuller, Professor
Measuring Factory Performance
Page 17
Rochester Institute of Technology
Microelectronic Engineering
LOT FORWARD PROGRESS PER WEEK
RIT FACTORY - LOT FORWARD ADVANCEMENT FOR WEEK
0 10 20 30 40 50 60 70
F970117
F970317
F970414
F970924
F971208
F980113
LO
T N
UM
BE
R
STEP NUMBER
Previous
#/w eek
# to go
Page 18
© January 14, 2013 Dr. Lynn Fuller, Professor
Measuring Factory Performance
Page 18
Rochester Institute of Technology
Microelectronic Engineering
DAILY WAFER MOVES
0
10
20
30
40
50
60
DAILY WAFER MOVES
Page 19
© January 14, 2013 Dr. Lynn Fuller, Professor
Measuring Factory Performance
Page 19
Rochester Institute of Technology
Microelectronic Engineering
LOT CYCLE TIME
CYCLE T IME
CALENDAR FACTORY
X CURRENTCALENDARFACTORY X
LOT FACTOR STEP WEEKS DAYS FACTOR
F970117 21.35 48 41 82 8.54
F970123 25.64 39 40 80 10.26
F970317 17.78 45 32 64 7.11
F970324 20.39 38 31 62 8.16
F970409 25.00 29 29 28 4.83
F970414 20.59 34 28 56 8.24
F970620 18.18 22 16 36 8.18
F970924 7.50 10 3 7 3.50
F971006 7.14 7 2 5 3.57
F971008 3.57 7 1 3 2.14
THEORETICAL IS 25 LOT MOVES/WEEK
5 LOT MOVES/FACTORY DAY
Page 20
© January 14, 2013 Dr. Lynn Fuller, Professor
Measuring Factory Performance
Page 20
Rochester Institute of Technology
Microelectronic Engineering
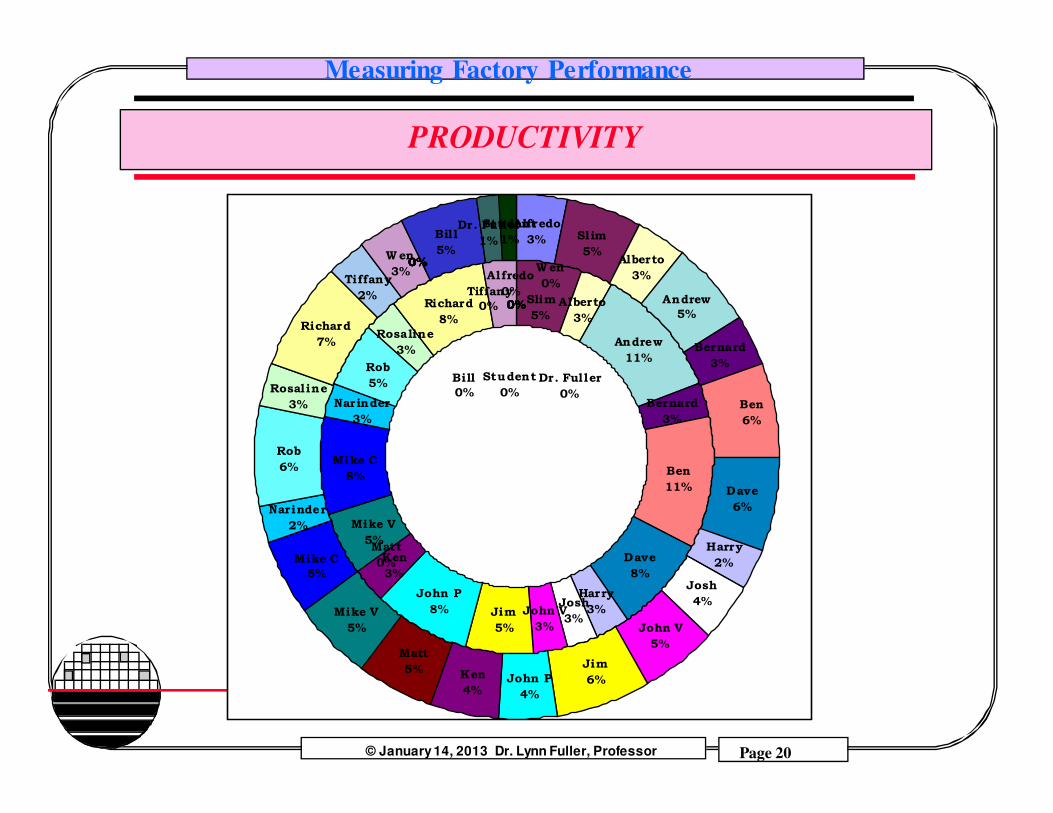
PRODUCTIVITY
Andrew
11%
Bernard
3%
Ben
11%
Dave
8%
John V
3%
Jim
5%
John P
8%
Ken
3%
Matt
0%
Mike V
5%
Mike C
8%
Narinder
3%
Rob
5%
Rosaline
3%
Richard
8%
Tiffany
0% 0%0%0%0%0%0%0%0%0%0%
Slim
5%Alberto
3%
Andrew
5%
Bernard
3%
Harry
2%
John V
5%
Jim
6%John P
4%
Ken
4%
Matt
5%
Mike V
5%
Mike C
5%
Narinder
2%
Rob
6%
Rosaline
3%
Richard
7%
Tiffany
2%
0%0%0%0%0%0%0%0%0%0%
Bill
5%
Dr. Fuller
1%
Student
1%
Alfredo
0%
Harry
3%
Alberto
3%
Josh
3%
Wen
0%
Student
0%
Dr. Fuller
0%
Bill
0%
Slim
5%
Ben
6%
Alfredo
3%
Dave
6%
Josh
4%
Wen
3%
Page 21
© January 14, 2013 Dr. Lynn Fuller, Professor
Measuring Factory Performance
Page 21
Rochester Institute of Technology
Microelectronic Engineering
REFERENCES
1. Wafer Fabrication: Factory Performance and Analysis, Linda F.
Atherton and Robert W. Atherton, Kluwer Academic Publishers,
1995.
Page 22
© January 14, 2013 Dr. Lynn Fuller, Professor
Measuring Factory Performance
Page 22
Rochester Institute of Technology
Microelectronic Engineering
HOMEWORK - FACTORY PERFORMANCE
1. Discuss the implications of reducing a chip from 1.414 cm by 1.414 cm to 1 cm
by 1cm. How much more money could be made in 1 year of production at 5000
wafers per week, selling price of $20 per chip and 150 mm wafer size. State any
approximations and assumptions you use.
2. Create a table that shows the relationship between all of the following variables
and the results. Use up/down arrows and horizontal lines indicating increases,
decreases and no effect, leave blank if not applicable. Include variable/results:
$FAC, OUTS, Yline, Ydie, WIP, Turns, Turns/WIP, CT, T/DLH, OUTS, Yline,
Ydie, WIP, Turns, CT, T/DLH, $W, #DIE, $SELL, flow, mix, factory capacity, tool
capacity, tool throughput, utilization, MTBF, MTTR, maintenance, engineering lots,
setup, $COO, $P, $V, $Y, D, A, #steps, etc.$FAC OUTS, Yline CT
WIP
OUTS
Ylineincr
easi
ng