Page 1
EU AND ITS NEIGHBOURHOOD: ENHANCING EU ACTORNESS IN THE EASTERN BORDERLANDS • EURINT 2020 | 172
MEASURING FINANCIAL PERFORMANCE:
FINANCIAL RATIOS VS. ECONOMIC VALUE ADDED
Mihaela Brîndușa TUDOSE*, Valentina Diana RUSU**,
Silvia AVASILCĂI***
Abstract
The study presents a model of comparative analysis of financial performance based
on two categories of instruments and evaluates the interdependencies between
different performance measures. Based on the information gathered from secondary
sources, we determined, interpreted and dynamically analysed the following
indicators: return on assets, return on equity, degree of global indebtedness, current
and quick liquidity and economic added value. The obtained results allowed the
shaping of two performance profiles on the basis of which the ranking of the
analysed companies was made. In order to identify the interdependencies between
the different performance measures, we performed a first regression analysis which
indicated that the company’s ability to create added economic value depends on
achieving high rates of economic profitability. Because in the analysed period there
were major variations of the macroeconomic indicators, we performed a second
regression analysis which indicated that the economic growth rate positively
influences the two rates of return.
Keywords: financial performance, ratios, economic value added, companies
Introduction
The study is based on the premise that the success of a business depends both
on the quality of methods, techniques and tools for measuring performance, and on
the skills of managers to implement the most appropriate methods. Summarizing the
results of previous research, we have identified evidence that a fair assessment of
organizational performance (reflecting the interests of all interested parties) depends
on the quality and usefulness of the system of indicators used. Rajnoha et al. (2016)
* Mihaela Brîndușa TUDOSE is lecturer at “Gheorghe Asachi” Technical University of Iasi,
Romania; e-mail: [email protected] . ** Valentina Diana RUSU is researcher at Institute of Interdisciplinary Research, Social
Sciences and Humanities Research Department, “Alexandru Ioan Cuza” University of Iași,
Romania; e-mail: [email protected] . *** Silvia AVASILCĂI is professor at “Gheorghe Asachi” Technical University of Iasi,
Romania; e-mail: [email protected]
Page 2
Mihaela Brîndușa TUDOSE, Valentina Diana RUSU, Silvia AVASILCĂI | 173
pointed out that the use of certain methods, techniques and measuring instruments
allows to achieve superior performance. Afonina (2015) showed that there is a
significant positive relationship between the quality of the tools and techniques of
management used and organizational performance. Other studies have found that the
use of different business valuation methods depends on management structure
(Suriyankietkaew and Avery, 2016; Dobija and Kravchenko, 2017), shareholder
structure (Liu et al., 2019) and business size (Lee, 2009).
From a practical point of view, one of the challenges of performance
management is the selection of the system of indicator that underlie the measurement
and evaluation of performance. The use of simple indicators does not provide a
complete picture of performance, which requires the use of more complex indicators.
Due to changes in the business environment, as well as changes in organizational
objectives, some indicators have limited “validity”. Last but not least, the indicators
can be interpreted differently by the interested parties. For example, an indicator that
measures a company’s indebtedness (used to assess the impact of the financing
structure on financial performance) may be considered valuable by managers, but
less valuable by shareholders, who see it as a measure of the risk of sharing profits
with external financiers.
This article represents a starting point of a broader research that aims to assess
the usefulness and significance of the various indicators used to measure corporate
performance. Specifically, we consider two categories of indicators for assessing
financial performance - ROA and ROE, respectively, economic added value. The
element of originality assumed by the authors is the analysis of the extent to which
the variations of the first two performance indicators have an impact on the variations
of the third performance indicator. From what is known by the authors, such a
research direction has not been addressed so far (at least at the level of performance
analysis of Romanian companies).
To complete the knowledge framework, the analysis of the interdependencies
between the selected performance indicators also includes the use of three
complementary variables (global indebtedness, current ratio and quick ratio) and a
control variable (firm size). Then, to transcend beyond the analysis at corporate level,
the performance analysis is extended by taking into account the real impact of GDP
growth rate on the targeted performance indicators. Therefore, this study presents
the peculiarities of measuring financial performance based on financial ratios and
added value and assesses the interdependencies between different performance
measures. In developing the study, we aimed for research to have a dual use:
scientific (by providing an overview of the state of knowledge in the field) and
practical (by providing practical clues to facilitate the selection and use of various
measures to assess performance).
Page 3
174 | MEASURING FINANCIAL PERFORMANCE: FINANCIAL RATIOS VS. EVA
1. Review of the literature on measuring financial performance
The first performance measurement systems were based on financial rates,
defined as the expression of the ratios between two quantities (Kieso et al., 2013).
Through the easy way of determining (but also due to the ease of interpretation),
financial rates have been and are considered valuable tools that allow measuring and
monitoring the performance of a company (Babalola and Abiola, 2013). At the same
time, the rates were considered useful tools underlying the adoption of investment
decisions. The argument on which this idea was built was that rates “offer investors
a more complete measure of performance” (Demmer, 2015).
Summarizing the incipient research, Salmi et al. (1990) identified three
approaches to the classification of financial ratios:
a) a pragmatic approach in which the classification was based on established
practices and personal opinions of financial analysts;
b) a deductive approach, focused on the technical relations between the
different financial rates (later applied in the Du Pont model) and on the observed
statistical behaviour;
c) an inductive approach, which classifies rates from the perspective of
statistical techniques (such as factor analysis) and of empirical utility; the purpose of
this approach was threefold: to eliminate mutually exclusive financial rates from the
analysis; ensuring the spatial and temporal representativeness of the results;
increasing the degree of coverage, respectively, evaluating the extent to which the
selected rates can characterize all the activities of the organization.
In the literature but also in financial practice have been identified and used a
series of rates (tables 1) that can be grouped as follows: rates of return, which
describe the extent to which the use of resources (means) of a company generates
profit; financial leverage ratios, which show the extent to which the use of borrowed
funds has led to an increase in the return on equity; liquidity rates, which show
whether a company has enough assets to pay off short-term debt; efficiency rates,
which allow the assessment of the company’s ability to manage its assets. There are
relationships of mutual interdependence between the categories of rates listed. For
example, rates of return on assets (ROA), equity (ROE) and investments (ROI) are
dependent on liquidity rates (current and immediate) (Pal, 2015). On the other hand,
holding liquid assets can improve profitability for a certain period of time.
Due to the generous possibilities for determining the rates, the researchers
resorted to factor analyses following the correlation between the variables (Ugurlu
and Aksoy, 2006; De et al., 2011; Chen, 2011); the aim was to select the most
representative rates starting from the most representative determinants of financial
performance. There are other research directions aimed at: a) financial rates that
satisfy the condition of proportionality with the size of the company (Sudarsanam
and Taffler, 1995); b) the possibilities of adjusting financial rates (Gallizo and
Salvador, 2003); c) the longitudinal properties of financial rates (McLeay and
Stevenson, 2009).
Page 4
Mihaela Brîndușa TUDOSE, Valentina Diana RUSU, Silvia AVASILCĂI | 175
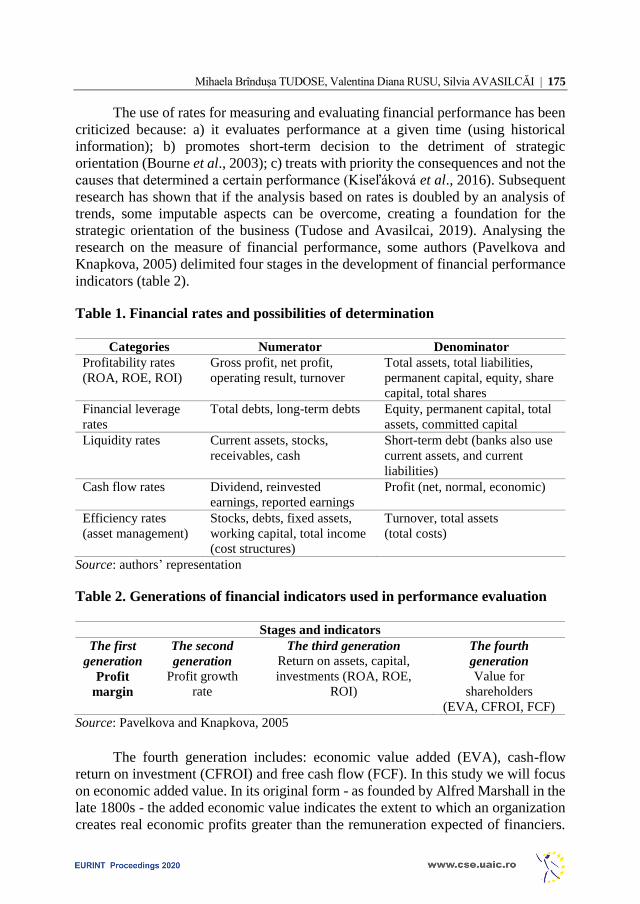
The use of rates for measuring and evaluating financial performance has been
criticized because: a) it evaluates performance at a given time (using historical
information); b) promotes short-term decision to the detriment of strategic
orientation (Bourne et al., 2003); c) treats with priority the consequences and not the
causes that determined a certain performance (Kiseľáková et al., 2016). Subsequent
research has shown that if the analysis based on rates is doubled by an analysis of
trends, some imputable aspects can be overcome, creating a foundation for the
strategic orientation of the business (Tudose and Avasilcai, 2019). Analysing the
research on the measure of financial performance, some authors (Pavelkova and
Knapkova, 2005) delimited four stages in the development of financial performance
indicators (table 2).
Table 1. Financial rates and possibilities of determination
Categories Numerator Denominator
Profitability rates
(ROA, ROE, ROI)
Gross profit, net profit,
operating result, turnover
Total assets, total liabilities,
permanent capital, equity, share
capital, total shares
Financial leverage
rates
Total debts, long-term debts Equity, permanent capital, total
assets, committed capital
Liquidity rates Current assets, stocks,
receivables, cash
Short-term debt (banks also use
current assets, and current
liabilities)
Cash flow rates Dividend, reinvested
earnings, reported earnings
Profit (net, normal, economic)
Efficiency rates
(asset management)
Stocks, debts, fixed assets,
working capital, total income
(cost structures)
Turnover, total assets
(total costs)
Source: authors’ representation
Table 2. Generations of financial indicators used in performance evaluation
Stages and indicators
The first
generation
Profit
margin
The second
generation
Profit growth
rate
The third generation
Return on assets, capital,
investments (ROA, ROE,
ROI)
The fourth
generation
Value for
shareholders
(EVA, CFROI, FCF)
Source: Pavelkova and Knapkova, 2005
The fourth generation includes: economic value added (EVA), cash-flow
return on investment (CFROI) and free cash flow (FCF). In this study we will focus
on economic added value. In its original form - as founded by Alfred Marshall in the
late 1800s - the added economic value indicates the extent to which an organization
creates real economic profits greater than the remuneration expected of financiers.
Page 5
176 | MEASURING FINANCIAL PERFORMANCE: FINANCIAL RATIOS VS. EVA
One hundred years later, the concept was developed (by the consulting firm Stern
Value Management) from the perspective of the ability to generate value for
shareholders. Currently, EVA is recognized as a method of measuring performance,
being used by many organizations (such as Coca Cola, DuPont, Eli Lilly, Polaroid,
Pharmacia and Whirlpool) (Annamalah et al., 2018).
As an indicator of measuring financial performance, EVA is determined as the
difference between net operating profit after tax and the opportunity cost of invested
capital. If the result of this difference is positive, it is admitted that the organization
creates value. Otherwise, it is admitted that the organization (through its
management) loses value.
Although the determination of EVA seems relatively simple, from a practical
point of view it is more complex because it involves making several adjustments to
remove the influence of different accounting practices. Research shows that of the
160 possible adjustments, only 10 have a more significant influence on net operating
profit after tax and on the opportunity cost of invested capital (Brad and Munteanu,
2012; Almeida et al., 2016). These adjustments refer to: depreciation; research,
development and training expenses; advertising costs; deferred taxes; intangible
assets (such as goodwill); non-interest-bearing debts (such as advances received
from customers, salaries and associated expenses), etc. When the analyses aim at
evaluating a sample of firms that apply different accounting rules, in order to ensure
the representativeness of the results, the achievement of adjustments must also be
doubled by the harmonization of the methodologies for determining the variables
according to which the performance is assessed.
According to specialists (Daraban, 2017), EVA differs from other
performance indicators (such as earnings per share, gross operating surplus and
profitability of sales) in that it measures all the costs of running a business (operating
costs and financing costs) and focuses on the control of production time, operating
costs and capital. At the same time, it has been shown that this method neutralizes
the differences in the level of risk that underlie each strategic business unit (Mocciaro
Li Destri et al., 2012). Moreover, some authors (although they initially opined that
there is no convergence of results that unequivocally support the superiority of EVA
over traditional performance measurement tools) have concluded that EVA
translates the financial performance indicator into corporate language from recent
times (Bhusan and Pramanik, 2016).
EVA is considered one of the most appreciated performance measurement
indicators because it involves all resources and allows decision decentralization
(Morard and Balu, 2010). Although the decision centre responsible for monitoring
and evaluating performance is placed in the area of financial management (similar
to traditional methods that use rates to measure financial performance), this
placement does not neglect the overall performance of the company.
Beyond the appreciations received, EVA was considered a vulnerable
indicator from an application point of view due to lack of synchronization in
traditional accounting systems (due to multiple adjustments to both net operating
Page 6
Mihaela Brîndușa TUDOSE, Valentina Diana RUSU, Silvia AVASILCĂI | 177
profit and invested capital), which generate difficulties of transposition/
determination. Bhusan Sahoo and Kumar Pramanik (2016) showed that EVA
analysis: a) does not include elements such as brand capital or human resources; b)
does not provide information on the financial performance of companies affected by
changes in the business cycle; c) does not stimulate the development of a business’s
assets (because the acquisition of fixed assets has a negative impact on the
performance assessed by EVA).
2. Research methodology
Kijewska (2016) pointed out that the results of EVA studies differ
significantly from country to country, from sector to sector and even from company
to company. For this reason, we opted for a comparative analysis of financial
performance for three companies selected according to the following criteria: they
operate in the same field of activity (automotive), they are joint stock companies and
they are the most important operators on the Romanian market. The analysis period
was 2010-2019.
To assess financial performance based on rates, we considered two rates of
return (ROA and ROE), a global debt ratio (GI) and two liquidity rates (current ratio
- CR and quick ratio - QR). To measure performance using EVA we made three
preliminary determinations (see table 3):
- net operation profit after tax (NOPat) adjusted for current depreciation, research
and development expenses and advertising expenses;
- invested capital (Ic), including only debt that involves costs (including financial
leasing); as part of the invested capital were also considered research,
development and advertising expenses, as they produce effects over several
years and contribute to the development of the business; from the total invested
capital were deducted the amounts that are not related to the management period
(advance expenses) and the assets not related to the operational activities
(securities held and loans granted); this last adjustment is justified by the fact
that both the investments in securities and the loans granted represent cash
outflows from the company, reducing the possibilities of financing current
activities;
- weighted average cost of capital (WACC) determined according to the cost and
share of different financing resources; the determination methodology took into
account the particularities of the different sources of financing (own and
borrowed); the cost of equity (representing the expected remuneration of
shareholders) was determined by reporting the net result to equity; the cost of
external capital was determined by relating the expenses related to the debts
(after operating the tax deductions) to the value of these cost-bearing financing.
Based on the information collected from secondary sources (annual financial
statements, reports of directors / boards of directors), the indicators for assessing
financial performance were determined, interpreted and analysed in dynamics. The
Page 7
178 | MEASURING FINANCIAL PERFORMANCE: FINANCIAL RATIOS VS. EVA
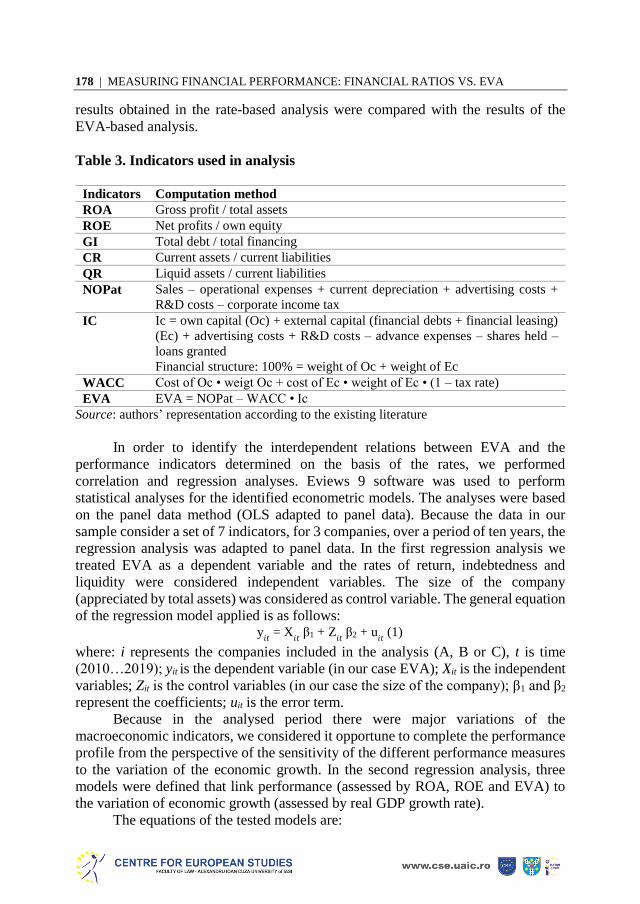
results obtained in the rate-based analysis were compared with the results of the
EVA-based analysis.
Table 3. Indicators used in analysis
Indicators Computation method
ROA Gross profit / total assets
ROE Net profits / own equity
GI Total debt / total financing
CR Current assets / current liabilities
QR Liquid assets / current liabilities
NOPat Sales – operational expenses + current depreciation + advertising costs +
R&D costs – corporate income tax
IC Ic = own capital (Oc) + external capital (financial debts + financial leasing)
(Ec) + advertising costs + R&D costs – advance expenses – shares held –
loans granted
Financial structure: 100% = weight of Oc + weight of Ec
WACC Cost of Oc • weigt Oc + cost of Ec • weight of Ec • (1 – tax rate)
EVA EVA = NOPat – WACC • Ic
Source: authors’ representation according to the existing literature
In order to identify the interdependent relations between EVA and the
performance indicators determined on the basis of the rates, we performed
correlation and regression analyses. Eviews 9 software was used to perform
statistical analyses for the identified econometric models. The analyses were based
on the panel data method (OLS adapted to panel data). Because the data in our
sample consider a set of 7 indicators, for 3 companies, over a period of ten years, the
regression analysis was adapted to panel data. In the first regression analysis we
treated EVA as a dependent variable and the rates of return, indebtedness and
liquidity were considered independent variables. The size of the company
(appreciated by total assets) was considered as control variable. The general equation
of the regression model applied is as follows: y
𝑖𝑡 = X𝑖𝑡 β1 + Z
𝑖𝑡 β2 + u
𝑖𝑡 (1)
where: i represents the companies included in the analysis (A, B or C), t is time
(2010…2019); yit is the dependent variable (in our case EVA); Xit is the independent
variables; Zit is the control variables (in our case the size of the company); β1 and β2
represent the coefficients; uit is the error term.
Because in the analysed period there were major variations of the
macroeconomic indicators, we considered it opportune to complete the performance
profile from the perspective of the sensitivity of the different performance measures
to the variation of the economic growth. In the second regression analysis, three
models were defined that link performance (assessed by ROA, ROE and EVA) to
the variation of economic growth (assessed by real GDP growth rate).
The equations of the tested models are:
Page 8
Mihaela Brîndușa TUDOSE, Valentina Diana RUSU, Silvia AVASILCĂI | 179
ROA𝑖𝑡 = GDP
𝑖𝑡 β1 + u
𝑖𝑡 (2),
ROE𝑖𝑡 = GDP
𝑖𝑡 β1 + u
𝑖𝑡 (3)
EVA𝑖𝑡 = GDP
𝑖𝑡 β1 + u
𝑖𝑡 (4)
where: i represents the companies included in the analysis (A, B or C), t is time
(2010…2019); ROAit, ROEit and EVAit are the dependent variables; GDPit is the
independent variable; β1 represent the coefficient; uit is the error term.
3. Results and discussions
To identify the performance profile, two steps were taken: measurement and
evaluation. From a management perspective, measuring performance involves
collecting information and determining a set of indicators in order to provide useful
information for analysis. The measurement was completed by attaching a value for
the measured aspect. In the second stage, the evaluation stage, a preference order
was established and opinions were issued on the measured aspect.
For building the performance profile we measured the variables associated
with performance. Profitability, liquidity and indebtedness rates were determined for
each company (Table 4); then EVA was determined, corresponding to the
methodology presented in the previous section (Table 5).
Table 4. Dynamics of performance measures determined on the basis of reports
Rates 2010 2011 2012 2013 2014 2015 2016 2017 2018 2019
Co
mp
any
A ROA 6.03 6.03 5.22 4.56 5.62 6.73 6.37 3.86 8.14 7.02
ROE 9.05 7.78 7.80 9.29 10.08 11.78 11.73 12.38 14.73 11.97
CR 1.39 1.40 1.02 1.08 1.11 1.22 1.12 1.04 1.23 1.20
QR 1.15 1.20 0.89 1.01 0.95 1.06 0.97 0.90 1.09 1.07
GI 38.19 40.55 44.83 48.83 47.24 47.31 50.06 51.36 47.85 45.56
Co
mp
any
B ROA 3.04 4.71 5.31 5.79 6.29 5.43 9.42 7.14 5.75 4.63
ROE 3.46 5.81 7.55 6.56 7.37 8.54 8.64 9.13 8.05 6.86
CR 1.49 1.64 1.57 1.97 1.84 1.81 1.64 1.88 2.02 2.24
QR 0.95 1.09 1.42 1.35 1.05 1.05 0.90 1.05 1.23 1.35
GI 40.93 37.14 39.60 31.19 29.39 43.72 35.42 32.29 34.77 34.37
Co
mp
any
C ROA 0.48 0.80 2.99 8.17 5.18 3.83 4.97 4.47 1.47 1.18
ROE 0.67 1.17 4.88 13.28 6.86 5.00 6.58 5.87 1.97 1.61
CR 1.17 1.08 1.41 1.46 1.45 1.65 1.83 1.70 1.78 2.09
QR 0.37 0.54 0.93 1.07 1.02 1.24 1.45 1.14 1.15 1.32
GI 52.29 51.87 45.00 43.33 35.83 34.95 35.63 37.77 33.69 34.17
Source: authors’ representation
Page 9
180 | MEASURING FINANCIAL PERFORMANCE: FINANCIAL RATIOS VS. EVA
During the 10 years period, company A records the highest rates of return.
With a degree of indebtedness that varies between 38.19% and 51.36% and with
ROE greater than ROA, company A proves a superior capitalization of borrowed
capital (the cost of interest being lower than the internal profitability of the business).
The framing of the two liquidity rates in the accepted reference ranges - [1-2] for
current liquidity and [0.65-1] for quick liquidity - completes the profile of a superior
performance. Company B has lower rates of return; the degree of indebtedness varies
between 29.39% and 43.72%, and the ROE is higher than the ROA; liquidity rates
exceed the reference limits, which indicates the existence of excess current assets;
the accelerated growth of receivables was the main cause of the lack of fit for the
liquidity indicators. Company C has lower rates of return, but with the specification
that - even in this case - ROE is higher than ROA (in terms of a degree of
indebtedness between 33.69% and 52.29%).
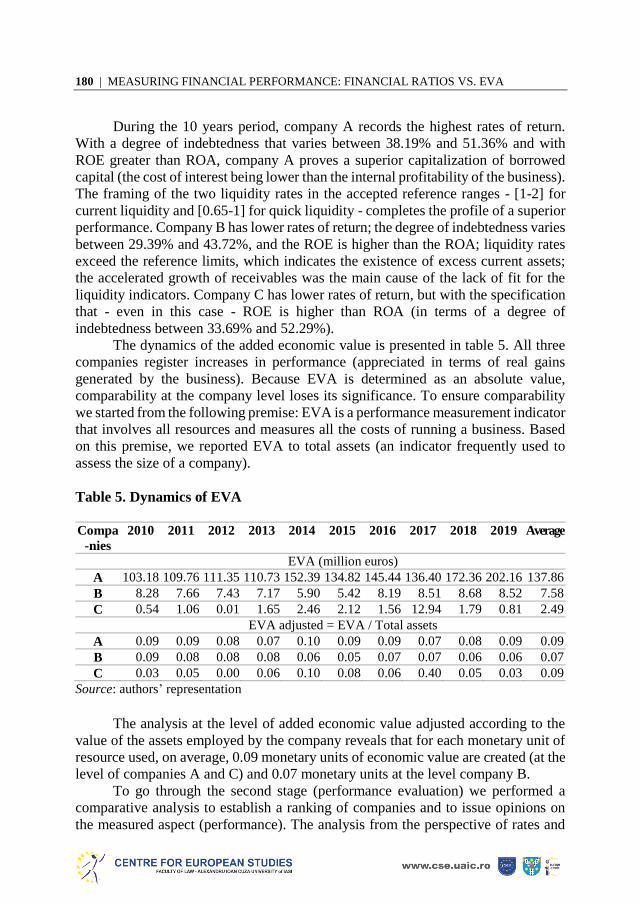
The dynamics of the added economic value is presented in table 5. All three
companies register increases in performance (appreciated in terms of real gains
generated by the business). Because EVA is determined as an absolute value,
comparability at the company level loses its significance. To ensure comparability
we started from the following premise: EVA is a performance measurement indicator
that involves all resources and measures all the costs of running a business. Based
on this premise, we reported EVA to total assets (an indicator frequently used to
assess the size of a company).
Table 5. Dynamics of EVA
Compa
-nies
2010 2011 2012 2013 2014 2015 2016 2017 2018 2019 Average
EVA (million euros)
A 103.18 109.76 111.35 110.73 152.39 134.82 145.44 136.40 172.36 202.16 137.86
B 8.28 7.66 7.43 7.17 5.90 5.42 8.19 8.51 8.68 8.52 7.58
C 0.54 1.06 0.01 1.65 2.46 2.12 1.56 12.94 1.79 0.81 2.49
EVA adjusted = EVA / Total assets
A 0.09 0.09 0.08 0.07 0.10 0.09 0.09 0.07 0.08 0.09 0.09
B 0.09 0.08 0.08 0.08 0.06 0.05 0.07 0.07 0.06 0.06 0.07
C 0.03 0.05 0.00 0.06 0.10 0.08 0.06 0.40 0.05 0.03 0.09
Source: authors’ representation
The analysis at the level of added economic value adjusted according to the
value of the assets employed by the company reveals that for each monetary unit of
resource used, on average, 0.09 monetary units of economic value are created (at the
level of companies A and C) and 0.07 monetary units at the level company B.
To go through the second stage (performance evaluation) we performed a
comparative analysis to establish a ranking of companies and to issue opinions on
the measured aspect (performance). The analysis from the perspective of rates and
Page 10
Mihaela Brîndușa TUDOSE, Valentina Diana RUSU, Silvia AVASILCĂI | 181
EVA (as an absolute measure, expressed in monetary units) allows a clear hierarchy
of the three companies: A is more efficient than B, and B more efficient than C.
Instead, when EVA (as an absolute measure) is replaced by EVA adjusted (according
to total assets), the performance ranking changes. Compared to the size of the
business, companies A and C have the same ability to create added value. These
results confirm that EVA (in the version adjusted according to the size of the
company) takes into account all resources (Morard and Balu, 2010), measures all the
costs of running a business (Daraban, 2017) and neutralizes the differences in risk
level that lie at the basis of each strategic business unit (Mocciaro Li Destri et al.,
2012). Moreover, EVA adjusted according to the size of the invested resources
allows comparative analysis between companies.
As described in the methodology section, for identifying the interdependent
relationships between EVA and performance indicators determined on the basis of
rates, we performed a correlation and regression analysis. Before performing the
regression analysis, we analysed the results obtained for descriptive statistics (see
table 6). The results highlight the fact that the indicators considered in the analysis
varied significantly during the analysed period, registering also important
differences depending on the company. Thus, the highest value of EVA was recorded
by company A in 2019. While the lowest value of this indicator was recorded by
company C in 2012. Due to the fact that EVA is an indicator calculated in absolute
terms, to obtain correct results in future analyses we calculated natural logarithm
from EVA (LEVA). We did the same for the enterprise size indicator.
Table 6. Descriptive statistics of the variables\
Mean Median Maximum Minimum Std. Dev.
EVA 49.309 8.235 202.160 0.010 66.154
LEVA 2.318 2.108 5.309 -4.605 2.280
ROA 5.021 5.265 9.420 0.480 2.157
ROE 7.548 7.665 14.730 0.670 3.585
CR 1.517 1.475 2.240 1.020 0.347
QR 1.065 1.065 1.450 0.370 0.227
GI 40.837 40.075 52.290 29.390 6.782
SIZE 580.108 109.290 2146.130 19.940 757.792
LSIZE 5.120 4.691 7.671 2.992 1.724
Source: authors’ representation
The correlation matrix of the variables indicates that some of the variables
considered in the analysis are strongly correlated with each other, with a correlation
coefficient higher than 0.8 (see table 7). Thus, we observe that ROA and ROE are
strongly correlated with each other. CR is also strongly correlated with GI.
In order to eliminate the problem of the existence of multicollinearity and to
obtain the most accurate results, we formulated regression models that exclude by
Page 11
182 | MEASURING FINANCIAL PERFORMANCE: FINANCIAL RATIOS VS. EVA
rotation the strongly correlated variables. Thus, the equations of the regression
models tested are:
LEVA
𝑖𝑡 = ROA𝑖𝑡 β1 + CR
𝑖𝑡 β2 + QR
𝑖𝑡 β3 + LSIZE
𝑖𝑡 β4 + u
𝑖𝑡 (5)
LEVA𝑖𝑡 = ROA
𝑖𝑡 β1 + QR
𝑖𝑡 β2 + GI
𝑖𝑡 β3 + LSIZE
𝑖𝑡 β4 + u
𝑖𝑡 (6)
LEVA𝑖𝑡 = ROE
𝑖𝑡 β1 + CR
𝑖𝑡 β2 + QR
𝑖𝑡 β3 + LSIZE
𝑖𝑡 β4 + u
𝑖𝑡 (7)
LEVA𝑖𝑡 = ROE
𝑖𝑡 β1 + QR
𝑖𝑡 β2 + GI
𝑖𝑡 β3 + LSIZE
𝑖𝑡 β4 + u
𝑖𝑡 (8)
Table 7. The correlation matrix of the variables
EVA LEVA ROA ROE CR QR GI SIZE LSIZE
EVA 1.000
LEVA 0.819 1.000
(0.000)
ROA 0.367 0.504 1.000
(0.045) (0.004)
ROE 0.680 0.667 0.828 1.000
(0.000) (0.000) (0.000)
CR -0.665 -0.404 -0.002 -0.313 1.000
(0.000) (0.026) (0.987) (0.092)
QR -0.101 0.084 0.291 0.175 0.637 1.000
(0.593) (0.655) (0.117) (0.354) (0.000)
GI 0.565 0.264 -0.149 0.254 -0.859 -0.652 1.000
(0.001) (0.158) (0.430) (0.174) (0.000) (0.000)
SIZE 0.991 0.818 0.351 0.690 -0.671 -0.109 0.583 1.000
(0.000) (0.000) (0.056) (0.000) (0.000) (0.565) (0.000)
LSIZE 0.926 0.896 0.469 0.712 -0.514 0.006 0.418 0.937 1.000
(0.000) (0.000) (0.000) (0.000) (0.003) (0.973) (0.021) (0.000)
Note: In parentheses are presented the values for the probability. With bold are marked the
highly correlated variables.
Source: authors’ representation
The results of the regression analysis adapted to the panel data are centralized
in Table 8. The values obtained for the regression coefficients indicate that the ROA
exerts a positive and statistically significant influence on the ability to create
economic value by the analysed companies. Therefore, increasing the return on
assets can be considered a precondition for increasing added value. The regression
analysis also indicated that the indebtedness rate exerts a statistically negative and
significant influence on the ability of companies to create real economic profits,
showing that an increase in companies’ indebtedness will lead to a reduction in EVA.
These results are relevant because, in the formula for determining the EVA, the
opportunity cost of the invested capital is deducted from the net operating profit
(after tax). Therefore, it is expected that with the increase of the invested capital
(respectively, the cost of this capital) the EVA will decrease.
Page 12
Mihaela Brîndușa TUDOSE, Valentina Diana RUSU, Silvia AVASILCĂI | 183
The coefficients obtained for the control variable are positive and statistically
significant in all 4 models, which shows that the size of the company determines in
an increased proportion its ability to create added economic value. In this study, the
size of the company was assessed by the total volume of assets. Therefore, the
statistical models formulated confirm that the performance of a company (assessed
by EVA) can increase as the volume of resources invested increases. Our results are
in line with previous research that has shown that financial performance reflects the
ability of companies to efficiently manage and use the resources at their disposal
(Mahrani and Soewarno, 2018, Orozco et al., 2018), respectively, the effectiveness
and efficiency of management in use of company resources (Egbunike and
Okerekeoti, 2018).
Table 8. Regression analysis
Dependent
variable LEVA
Model 1 Model 2 Model 3 Model 4
ROA 0.091**
(0.039)
0.062*
(0.035)
- -
ROE - - 0.022
(0.029)
0.080
(0.058)
CR 0.031
(0.707) - 0.166
(0.711) -
QR 0.511
(0.498)
-0.205
(0.520)
0.568
(0.428)
-0.670
(0.565)
GI - -0.093**
(0.041)
- -0.119***
(0.041)
LSIZE 1.134***
(0.173)
1.219***
(0.161)
1.168***
(0.197)
0.002***
(0.004)
Constant -4.545**
(1.879) -2.284**
(1.017)
-4.698**
(1.920)
5.672***
(1.706)
Observations 30 30 30 30
R-squared 0.815 0.821 0.810 0.747
Adjusted R-
squared
0.785 0.792 0.780 0.706
F-statistic 27.604*** 28.689*** 26.782*** 18.473***
Note: *, ** and *** show that the coefficients are statistically significant with a probability
of 1%, 5% or 10%
Source: authors’ representation
The other variables, ROE, CR and QR, did not resulted in having a statistically
significant effect on the added value created by the companies considered in the
analysis.
The Adjusted R Square result indicates that about 78% of the EVA variation
is explained by the independent variables included in the regression model. The
values of the significance test F provided non-zero values, indicating that there is at
least a non-zero coefficient. This test covers all independent variables and verifies
Page 13
184 | MEASURING FINANCIAL PERFORMANCE: FINANCIAL RATIOS VS. EVA
the significance of the entire regression. The results in Table 8 indicate that the model
validation condition is met (P-value <0.05). Therefore, regression models are
statistically significant, for which it can be admitted that the ability to create
economic value depends on the achievement of high rates of economic profitability.
Macroeconomic factors, which are not under the control of management, also
make their mark on corporate performance (Barakat et al., 2016; Akinyomi, 2013).
Given the fact that the analysed period was characterized by major variations of
macroeconomic indicators, we considered it appropriate to analyse the sensitivity of
different performance measures to changes in macroeconomic variables. To test
these interdependencies, we defined three models that link performance (assessed by
profitability rates, respectively by EVA) to the variation of economic growth
(assessed by real GDP growth rate). The results are summarized in Table 9.
Table 9. Interdependencies: performance – real GDP growth rate
Variables Dependent variable
ROA
Dependent variable
ROE
Dependent variable
LEVA
Real GDP growth
rate
0.254***
(0.063)
0.495***
(0.052)
0.114*
(0.058)
Constant 4.093***
(0.213)
5.744***
(0.402)
1.902***
(0.330)
Observations 30 30 30
R-squared 0.106 0.145 0.019
Adjusted R-
squared
0.074 0.115 -0.015
F-statistic 3.334*** 4.774*** 0.465
Note: *, ** and *** show that the coefficients are statistically significant with a probability
of 1%, 5% or 10%
Source: authors’ representation
The data in Table 9 show that 10.6% of the ROA variation, respectively 14.5%
of the ROE variation can be explained by the real GDP growth rate variation. The
regression analysis at the level of the three models revealed that only two models are
statistically significant, models for which the P-value was less than 0.05 (for ROA
and ROE as dependent variables). The model that tests the influence of real GDP
growth rate on the added economic value of companies is not statistically significant.
The coefficients obtained show that a 10% increase in the real GDP growth rate can
lead to an increase in ROA for the analysed companies of 2.5%, and an increase of
4.9% in ROE. Our results confirm the results of previous research which showed
that macroeconomic indicators, such as inflation rate and growth rate, have a
significant impact on financial performance (Egbunike and Okerekeoti, 2018).
Page 14
Mihaela Brîndușa TUDOSE, Valentina Diana RUSU, Silvia AVASILCĂI | 185
Conclusions
The option for analysing the financial performance profile built on the basis
of rates and economic value added is justified by the fact that both analyses are
placed in the area of financial management. The importance of the researched topic
flows from the fact that, in order to be sustainable, companies must take care of their
financial performance. In choosing the performance indicators we started from the
consideration that financial performance shows “how effective and efficient an
organization is in achieving its goals” (Suhadak et al., 2019), highlights “the
company’s ability to manage and control its resources” (Mahrani and Soewarno,
2018) and reflects “the ability to create economic value” (Orozco et al, 2018).
The study begins with the theoretical substantiation of the particularities of
measuring financial performance based on financial reports and economic value
added. In this context, the advantages and disadvantages of using different
performance measures are pointed out. Empirical research is carried out on the
example of three companies in the automotive industry. To assess the financial
performance based on the rates, we considered two rates of return (ROA and ROE),
a global debt ratio and two liquidity rates (current ratio and quick ratio). To measure
performance using EVA, we performed three preliminary determinations: net
operation profit after tax (NOPat), invested capital (Ic) and weighted average cost of
capital (WACC). Based on these indicators, two performance profiles were built.
The first performance profile allowed the ranking of companies according to the size
and dynamics of the determined financial rates. This first preliminary analysis
indicated that the highest rates of return are obtained in terms of a degree of
indebtedness of over 45% and liquidity rates within the recommended reference
ranges. The second performance profile was built based on EVA dynamics. To
ensure comparability, we proposed adjusting the EVA according to the size of the
total assets held by the company. This adjustment changed the performance
hierarchy based on financial rates (pointing out that the size of assets is more
important than indebtedness and liquidity when performance is assessed in terms of
added value).
In order to identify the interdependence relations between EVA and the
performance indicators determined on the basis of the rates, we performed
correlation and regression analyses. In the first regression analysis we treated EVA
as a dependent variable and the rates of return, indebtedness and liquidity were
considered independent variables. The size of the company (appreciated by total
assets) was considered a control variable. The results of this first regression analysis
indicated that:
1) ROA has a positive and statistically significant influence on the ability to create
the economic value of the analysed companies;
2) the indebtedness rate exerts a negative and statistically significant influence on
the capacity to create the real economic profits of the companies;
3) the size of the company (appreciated by the value of the assets) positively
influences the ability to create added economic value.
Page 15
186 | MEASURING FINANCIAL PERFORMANCE: FINANCIAL RATIOS VS. EVA
Given the fact that the analysed period was characterized by major variations
of macroeconomic indicators, we considered it appropriate to analyse the sensitivity
of different performance measures to the variation of economic growth. To test these
interdependencies, we defined three models that focus on identifying the link
between performance (assessed by ROA, ROE and EVA) and the variation of
economic growth (assessed by real GDP growth rate). The regression analysis at the
level of the three models revealed that only two models are statistically significant.
The coefficients obtained show that an increase in real GDP growth rate can lead to
an increase in ROA and ROE.
The study is useful to both researchers (because it presents an original review
of the literature on measuring financial performance and provides evidence of the
interdependence between different measures of performance) and practitioners
(because empirical research can serve as a guide for a correct measurement and
evaluation of financial performance of companies).
References
Afonina, A. (2015), Strategic Management Tools and Techniques and Organizational
Performance: Findings from the Czech Republic, Journal of Competitiveness, 7(3),
pp. 19-36.
Akinyomi, O. J. (2013), Effect of firm size on profitability: evidence from Nigeria
manufacturing sector, Prime Journal of Business Administration and Management,
3(9), pp. 1171-1175.
Almeida, L. S. F., Neto, J. V., Salles, M. T., Pereira Soares, C. A. and Oliveira Esteves, Y.
(2016), Comparative analysis between EVA and traditional financial (accounting)
indicators in Brazilian civil construction companies: a documentary study, Gestão &
Produção, 23(4), pp. 736-756.
Annamalah, S., Raman, M., Marthandan, G. and Logeswaran, A. K. (2018), Implementation
of enterprise risk management (ERM). Framework in enhancing business
performances in oil and gas sector, Economies, 6(4), pp. 1-13.
Babalola, Y. A. and Abiola, F. R. (2013), Financial ratio analysis of firms: A tool for decision
making, International journal of management sciences, 1(4), pp. 132-137.
Barakat, M. R., Elgazzar, S. H. and Hanafy, K. M. (2016), Impact of macroeconomic
variables on stock markets: evidence from emerging markets, International Journal
of Economics and Finance, 8(1), pp. 195-207.
Bhusan Sahoo, B. and Kumar Pramanik, A. (2016), Economic Value Added: A Better
Technique for Performance Measurement, International Journal of Advances in
Management and Economics, 5(6), pp. 1-12.
Bourne, M., Neely, A., Mills, J. and Platts, K. (2003), Implementing performance
measurement systems: a literature review, International Journal of Business
Performance Management, 5(5), pp. 1-24.
Page 16
Mihaela Brîndușa TUDOSE, Valentina Diana RUSU, Silvia AVASILCĂI | 187
Brad, L. and Munteanu, A. (2012), An adjustment model for EVA computation in financial
institutions and non-financial companies, in: Proceedings of the 7th International
Conference Accounting and management information systems, AMIS 2012, June 13-
14, 2012, Bucharest University of Economic Studies, pp. 1368-1383.
Chen, M. (2011), Predicting corporate financial distress based on integration of decision tree
classification and logistic regression, Expert Systems with Applications, 38(9), pp.
11261-11272.
Daraban, M. C. (2017), Economic Value Added – A General Review of the Concept,
“Ovidius” University Annals, Economic Sciences Series, XVII(1), pp. 163-173.
De, A., Bandyopadhyay, G. and Chakraborty, B. N. (2011), Application of factor analysis on
the financial ratios of Indian cement industry and validation of the results by cluster
analysis, Journal of Business Studies Quarterly, 2(3), pp. 13-31.
Demmer, M. (2015), Improving profitability forecasts with information on Earning Quality.
School of Business and Economics. Discussion paper (retrieved from
http://www.diss.fu-berlin.de/docs/servlets/ MCRFile).
Dobija, D. and Kravchenko, G. (2017), Supervisory Board Composition and Firm Financial
Performance: A Case of Companies Listed on the Warsaw Stock Exchange, Journal
of Management and Business Administration, Central Europe, 25(4), pp. 75-95.
Egbunike, C. F. and Okerekeoti, C. U. (2018), Macroeconomic factors, firm characteristics
and financial performance: A study of selected quoted manufacturing firms in Nigeria,
Asian Journal of Accounting Research, 3(2), pp. 42–168.
Gallizo, J. and Salvador, M. (2003), Understanding the behavior of financial ratios: The
adjustment process, Journal of Economics and Business, 55(2003), pp. 267-283.
Kieso, D., Weygandt, J. and Warfield, T. (2013), Intermediate Accounting, Fifteenth Edition.
Hoboken, NJ: JohnWiley & Sons, Inc.
Kijewska, A. (2016), Causal analysis of determinants influencing the Economic Value Added
(EVA) – a case of Polish entity, Journal of Economics and Management, 26(4), pp.
52-71.
Kiseľáková, D., Horváthová, J. and Šofranková, B. (2016), Controlling rizík podnikania v
modeloch ovplyvňujúcich výkonnosť a prognózovanie rizík v EÚ [Controlling
business risks in models affecting performance and risk forecasting in the EU],
Prešov: Prešovská Univerzita v Prešove.
Lee, J. (2009), Does size matter in firm performance? Evidence from US public firms,
International Journal of the Economics of Business, 16(2), pp. 189-203.
Liu, T., Zhang, Y. and Liang, D. (2019), Can ownership structure improve environmental
performance in Chinese manufacturing firms? The moderating effect of financial
performance, Journal of Cleaner Production, 225, pp. 58-71.
Mahrani, M. and Soewarno, N. (2018), The effect of good corporate governance mechanism
and corporate social responsibility on financial performance with earnings
management as mediating variable, Asian Journal of Accounting Research, 3(1), pp.
41-60.
McLeay, S. and Stevenson, M. (2009), Modelling the longitudinal properties of financial
ratios, Applied Financial Economics, 19(4), pp. 305-318.
Page 17
188 | MEASURING FINANCIAL PERFORMANCE: FINANCIAL RATIOS VS. EVA
Mocciaro Li Destri, A., Picone, P. M. and Mina, A. (2012), From ‘Strategic Fit’ to Synergy
Evaluation in M&A Deals, Caspian Journal of Applied Sciences Research, 1(12), pp.
25-38.
Morard, B. and Balu, F.O., (2010), Developing a practical model for economic value added,
Economic Computation and Economic Cybernetics Studies and Research, 43(3), pp.
107-122.
Orozco, L. A., Vargas, J. and Galindo-Dorado, R. (2018), Trends on the relationship between
board size and financial and reputational corporate performance: The Colombian case,
European Journal of Management and Business Economics, 27(2), pp. 183–197.
Pal, S. (2015), Evaluation of financial performance in terms of financial ratios- an empirical
study on Indian automobile industry, International Journal of Business
Management& Research, 5(3), pp. 1-8
Pavelková, D. and Knápková, A. (2005), Výkonnosť podniku z pohledu finančního manažéra
[Company performance from the perspective of a financial manager], Praha: Linde.
Rajnoha, R., Lesníková, P. and Korauš, A. (2016), From Financial Measures to Strategic
Performance Measurement System and Corporate Sustainability: Empirical Evidence
from Slovakia, Economics and Sociology, 9(4), pp. 134-152.
Salmi, T., Virtanen, I. and Yli-Olli, P. (1990), On the classification of financial ratios: A
factor and transformation analysis of accrual, cash flow, and market-based ratios, Acta
Wasaensia, 25, pp. 1-60.
Sudarsanam, P. S. and Taffler, R. J. (1995), Financial ratio proportionality and inter-temporal
stability: An empirical analysis, Journal of Banking & Finance, 19(1), pp. 45-60.
Suhadak, S., Kurniaty, K., Handayani, S. and Rahayu, S. (2019), Stock return and financial
performance as moderation variable in influence of good corporate governance
towards corporate value, Asian Journal of Accounting Research, 4(1), pp. 18-34.
Suriyankietkaew, S. and Avery G. (2016), Sustainable Leadership Practices Driving
Financial Performance: Empirical Evidence from Thai SMEs, Sustainability, 8(4), pp.
1-14.
Tudose, M. B., Avasilcăi, S. and Golban, R. (2019), Assessing financial performance of
companies manufacturing industrial goods. Evidence on performance dynamics in the
period before and after the crisis, European Union’s Structural Challenges: The Way
Forward, EURINT 2019, pp. 335-354. +
Ugurlu, M. and Aksoy, H. (2006), Prediction of corporate financial distress in an emerging
market: the case of Turkey, Cross Cultural Management: An International Journal,
13(4), pp. 277-295.