MEASURING HYDROCARBON DEW POINT ACCURATELY AND ITS FINANCIAL IMPACT Jack C. Herring Mi ch ell Instruments, Inc. 319 Newburyport Turnpike, Suite 207 Rowley, Massachusetts, 01969 USA INTRODUCTION Measuring Hydrocarbon Dew Point (HCDP) accurately is critical to the profitability ufproducinglproccssing natural gas. End users want a quality product and for good reason. When HCDP limits are written into the gas contract the producer/processors and pipeline operators each play a ro le in delivering that quality product. Accurately measuring HCDP in order to satisfY the customer touches every link in this vital supply chain. What is HCDP? What is involved in measuring HCOP accurately? HYDROCARBON DEW POINT DEFINITION The scientific definition for the hydrocarbon dew point is the temperature at which the first fonnation of liquid hydrocarbon in a gas at a constant pressure. This is not very workable since it could identify the temperature when the first two molecules find it irresistible to stay apart and connect to fonn a microdroplet of liquid that no longer obeys the gas laws which moments before governed their behavior. Experience in the field proves this is not a practical definition fo r HCDP. The theoretical conditions above will not necessarily have an adverse impact on the operation of a turbine or create liquid drop-out in a pipeline that cou ld damage turbine compressors. A more workable definition and one that generally practiced in North America, is the temperature when the first appear- ance of liquid hydrocarbon droplets fonn on a surface at a constant pressure. Under currently approved practices, the pressure for this measurement is the contract pressure. The de facto industry standard for observing the appear- ance of these droplets and measuring the temperature when it occurs is the Bureau of Mines device operated in accordance with ASTM 0 1142. Hydrocarbon Oew point is dependent on pressure, temperature and the composition of the gas. The heavier compounds will condense at higher temperatures. A good rule of thumb is the higher the BTU content, the higher the HCDP. Figure I below is a typical phase envelope for natural gas showing three HCDP curves at different stages of processing and one of water dew point. The three cricondenthenn points are identified. These are maximum temperatures on the respective hydrocarbon dew point curves. Every field and producer/processors' gas will ha ve a different curve due to the change in composition. • - • • UNPROCESSED GAS J Cric_ ... -...77 " PROCESSED GAS _ n '\: UQUID PHASE ---- -- / "J. (F / ". / -H r ......... ·f Figure II ./ WATER V DINT \ ""- PHAS. ./ 'N HCDP MEASUREMENT METHODS There are three primary methods used in North America - Manual visual dew point method Equations of state (EOS) method using gas chromatograph (GC) analysis Automatic optical condensation dew point method. Each of these methods are described below with their advantages and disadvantages. Manual Visual Dew Point Method This is the most widely used method for measuring HCDP and requires the simplest hardware. It can also be used to measure water dew point (WDP) in natural gas. This Bureau of Mines device has been used since the 1930s to provide manual dew point measurements. This method is used for "spot checking" the dew point of a sample as extracted fr om a tap on the pipeline from any location in a gas processing facility, or point of use. It allows a trained operator to detect the dew point visua ll y and interpret that image as a HCOP or a WOP or a contaminated dew point. It requires patience and training to be able to operate this instrument properly. There are two chambers within the instrument. One is the sample chamber that is suitable for pipeline pressures to 5000 psig, containing a mirror visible through a window. There is also a method for measuring the temperature of the mirror. A second chamber allows a coolant to be conducted across the back ofthe mirror.
Transcript
MEASURING HYDROCARBON DEW POINT ACCURATELY AND ITS FINANCIAL IMPACT
Jack C. Herring
Michell Instruments, Inc. 319 Newburyport Turnpike, Suite 207 Rowley, Massachusetts, 01969 USA
INTRODUCTION
Measuring Hydrocarbon Dew Point (HCDP) accurately is critical to the profitability ufproducinglproccssing natural gas. End users want a quality product and for good reason. When HCDP limits are written into the gas contract the producer/processors and pipeline operators each play a role in delivering that quality product. Accurately measuring HCDP in order to satisfY the customer touches every link in this vital supply chain.
What is HCDP? What is involved in measuring HCOP accurately?
HYDROCARBON DEW POINT DEFINITION
The scientific definition for the hydrocarbon dew point is the temperature at which the first fonnation of liquid hydrocarbon in a gas at a constant pressure. This is not very workable since it could identify the temperature when the first two molecules find it irresistible to stay apart and connect to fonn a microdroplet of liquid that no longer obeys the gas laws which moments before governed their behavior.
Experience in the field proves this is not a practical definition for HCDP. The theoretical conditions above will not necessarily have an adverse impact on the operation of a turbine or create liquid drop-out in a pipeline that could damage turbine compressors. A more workable definition and one that generally practiced in North America, is the temperature when the first appearance of liquid hydrocarbon droplets fonn on a surface at a constant pressure. Under currently approved practices, the pressure for this measurement is the contract pressure. The de facto industry standard for observing the appearance of these droplets and measuring the temperature when it occurs is the Bureau of Mines device operated in accordance with ASTM 0 1142.
Hydrocarbon Oew point is dependent on pressure, temperature and the composition of the gas. The heavier compounds will condense at higher temperatures. A good rule of thumb is the higher the BTU content, the higher the HCDP. Figure I below is a typical phase envelope for natural gas showing three HCDP curves at different stages of processing and one of water dew point. The three cricondenthenn points are identified. These are maximum temperatures on the respective hydrocarbon dew point curves. Every field and producer/processors' gas will have a different curve due to the change in composition.
•
-• •
UNPROCESSED GAS J Cric_ ... -...77"
PROCESSED GAS ~ ,"<_~h~ _ n ~ '\:
? ~ UQUID PHASE
------/ "J.
(F / ". /
-H r ......... · f
Figure I I
./
WATER
V DINT
\
""-~ PHAS.
./ 'N
HCDP MEASUREMENT METHODS
There are three primary methods used in North America Manual visual dew point method Equations of state (EOS) method using gas chromatograph (GC) analysis Automatic optical condensation dew point method.
Each of these methods are described below with their advantages and disadvantages.
Manual Visual Dew Point Method
This is the most widely used method for measuring HCDP and requires the simplest hardware. It can also be used to measure water dew point (WDP) in natural gas. This Bureau of Mines device has been used since the 1930s to provide manual dew point measurements. This method is used for "spot checking" the dew point of a sample as extracted from a tap on the pipeline from any location in a gas processing facility, or point of use. It allows a trained operator to detect the dew point visually and interpret that image as a HCOP or a WOP or a contaminated dew point. It requires patience and training to be able to operate this instrument properly.
There are two chambers within the instrument. One is the sample chamber that is suitable for pipeline pressures to 5000 psig, containing a mirror visible through a window. There is also a method for measuring the temperature of the mirror. A second chamber allows a coolant to be conducted across the back ofthe mirror.
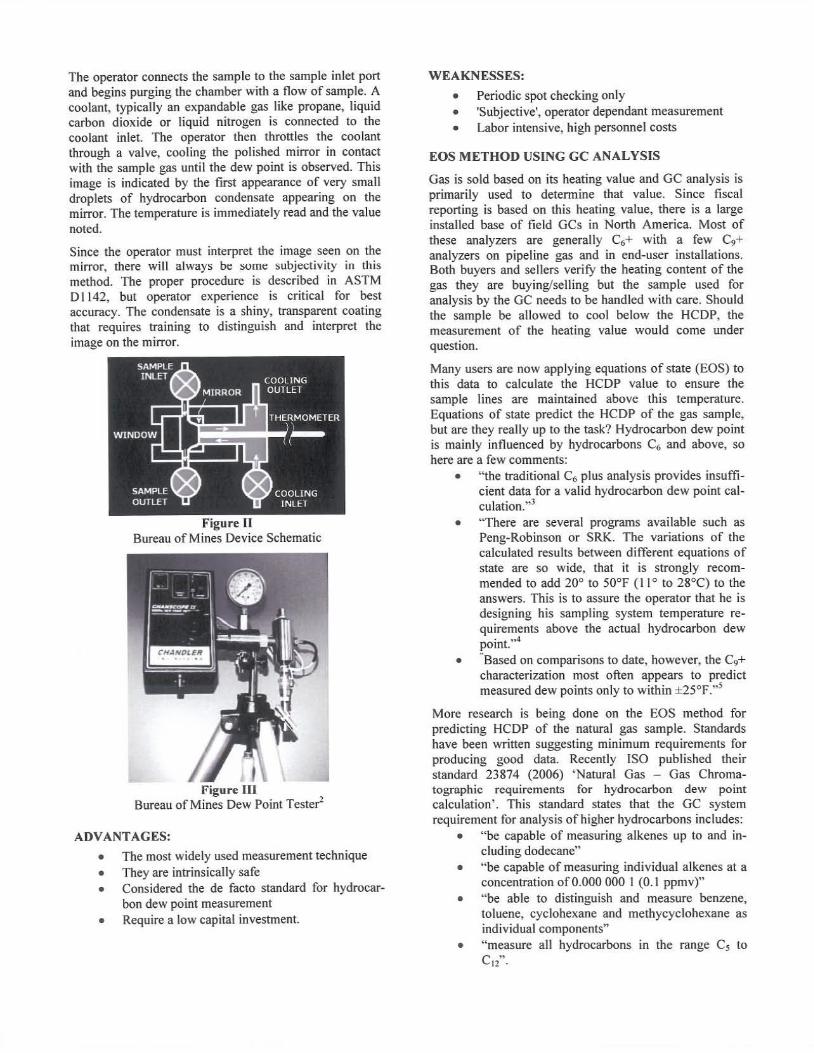
The operator connects the sample to the sample inlet port and begins purging the chamber with a flow of sample. A coolant. typically an expandable gas like propane, liquid carbon dioxide or liquid nitrogen is connected to the coolant inlet. The operator then throttles the coolant through a valve, cooling the polished mirror in contact with the sample gas until the dew point is observed. This image is indicated by the first appearance of very small droplets of hydrocarbon condensate appearing on the mirror. The temperature is immediately read and the value noted.
Since the operator must interpret the image seen on the mirror, there will a lways be SUIllt: subje<.ctivity in this method. The proper procedure is described in ASTM D 1142, but operator experience is critical for best accuracy. The condensate is a shiny, transparent coating that requires training to distinguish and interpret the image on the mirror.
; Bureau of Mines Device Schematic
I Figure III
Bureau of Mines Dew Point Tester
ADVANTAGES:
• The most widely used measurement technique • They are intrinsically safe • Considered the de facto standard for hydrocar·
bon dew point measurement • Require a low capital investment.
WEAKNESSES:
• Periodic spot checking only • 'Subjective', operator dependant measurement • Labor intensive, high personnel costs
EOS METHOD USING GC ANALYSIS
Gas is sold based on its heating value and GC analysis is primarily used to detennine that value. Since fiscal reporting is based on this heating value, there is a large installed base of field GCs in North America. Most of these analyzers are generally C6+ with a few C9+ analyzers on pipeline gas and in end·user installations. Both buyers and sellers verify the heating content of the gas they are buying/selling but the sample used for analysis by the GC needs to be handled with care. Should the sample be allowed to cool below the HCDP, the measurement of the heating value would come under question.
Many users are now applying equations of state (EOS) to this data to calculate the HCDP value to ensure the sample lines are maintained above this temperature. Equations of state predict the HCDP of the gas samp le, but are they really up to the task? Hydrocarbon dew point is mainly influenced by hydrocarbons C6 and above, so here are a few comments:
• "the traditional C6 plus analysis provides insufficient data for a valid hydrocarbon dew point calculation. ,,3
• "There are several programs available such as Peng-Robinson or SRK. The variations of the calculated results between different equations of state are so wide, that it is strongly recommended to add 20° to 50°F (11 ° to 28°C) to the answers. This is to assure the operator that he is designing his sampling system temperature requirements above the actual hydrocarbon dew point.',.(
• -Based on comparisons to date, however, the C9+ characterization most often appears to predict measured dew points on ly to within ±25°F.,,5
More research is being done on the EOS method for predicting HCDP of the natural gas sample. Standards have been written suggesting minimum requirements for producing good data. Recently ISO published their standard 23874 (2006) 'Natural Gas - Gas Chromatographic requirements for hydrocarbon dew point calculation'. This standard states that the GC system requirement for analysis of higher hydrocarbons includes:
• "be capable of measuring alkenes up to and including dodecane"
• "be capable of measuring individual alkenes at a concentration of 0.000 000 1 (0.1 ppmv)"
• "be able to distinguish and measure benzene, toluene, cyclohexane and methycyclohexane as individual components"
• "measure all hydrocarbons in the range Cs to Cll" ·
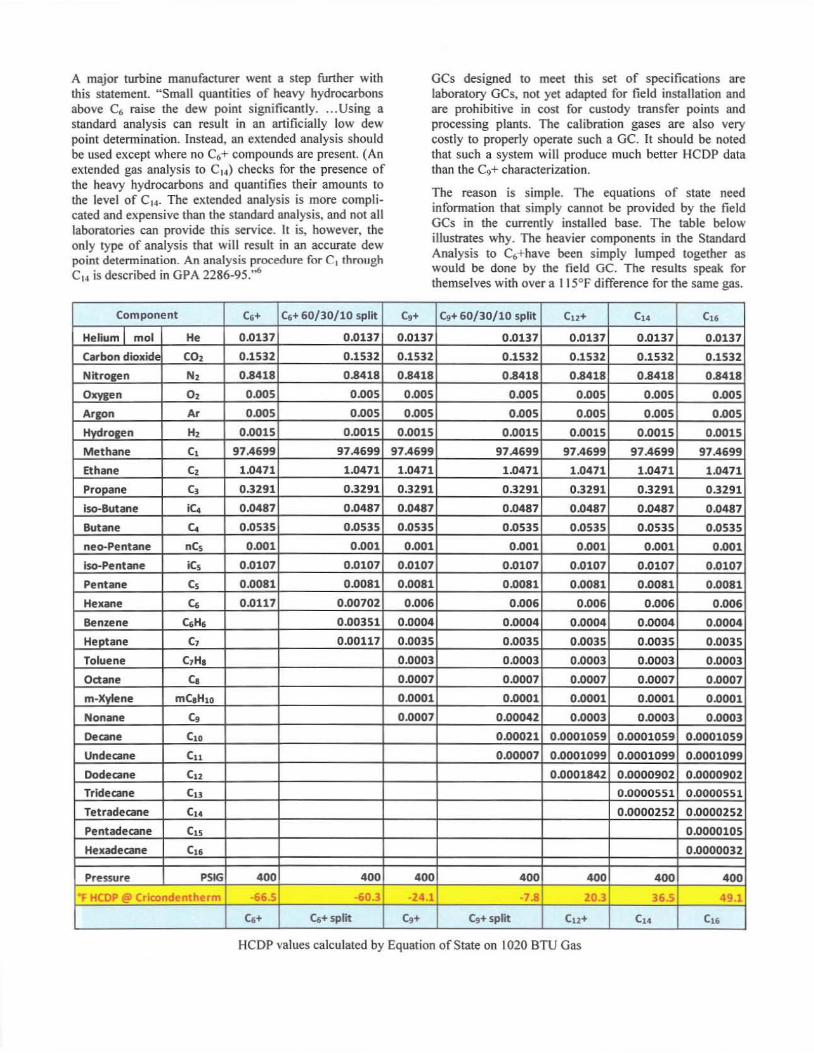
A major turbine manufacturer went a step further with this statement. "Small quantities of heavy hydrocarbons above C6 raise the dew point significantly . ... Using a standard analysis can result in an artificially low dew point detennination. Instead. an extended analysis should be used except where no C6+ compounds are present. (An extended gas analysis to C I~ ) checks for the presence of the heavy hydrocarbons and quantifies their amounts to the level of C14• The extended analysis is more complicated and expensive than the standard analysis. and not all laboratories can provide this service. It is. however. the only type of analysis that will result in an accurate dew point determination. An analysis procedure for C1 through C14 is described in GPA 2286-95:.6
Component C, . C, + 60/30/10 split
Helium I mol He 0.0137 0.0137
Carbon dioxid CO, 0.1532 0.1532
NitrOftn N, 0.8418 0.8418
O,..,..n 0, 0.00. 0.00'
Anton A. 0.00' 0.005
Hydroaen H, 0.0015 0.0015
Methane C, 97A699 97A699
Ethane C, 1.0471 1.0471
Propane C, 0.3291 03291
Iso-Butane ;c. 0.0487 0.0487
Butane C. 0.0535 0.0535
neo-Pentane nC, 0.001 0.001
iso-Pentane ;C, 0.0107 0.0107
Pentane C, 0.0081 0.0081
Hexane C. 0.0117 0.00702
Benzene C.H, 0.00351
Heptane C, 0.00117
Toklene CIH,
Octane Co m-Xylene mCaHlo
Nonane C,
Qeane C .. Undecane Cn Dodecane Cn Tridecane C" Tetradecane C .. Pentadecane Cn Hexadecane C"
Pressure P.IG 400 400
-r HCDP tP Cricondentherm -665 -603
c.. 4 + split
GCs designed to meet this set of specifications are laboratory GCs, not yet adapted for field installation and are prohibitive in cost for custody transfer points and processing plants. The calibration gases are also very costly to properly operate such a Gc. It should be noted that such a system will produce much better HCDP data than the C'l+ characterization.
The reason is simple. The equations of slate need infonnation that simply cannot be provided by the field GCs in the currently installed base. The table below illustrates why. The heavier components in the Standard Analysis to Ct,+have been simply lumped together as would be done by the field Gc. The results speak for themselves with over a 115°F difference for the same gas.
HCDP values calculated by Equation of State on 1020 BTU Gas
The difference is that even small quantities of heavier hydrocarbons strongly influence this calculation. These heavier components are the ones that cause problems inside the pipeline too.
ADVANTAGES:
• Potential to combine a number of gas qualitylfiscal metering parameters into one analyzer
• Possibility to provide a theoretical phase envelope curve
• Adding software to an e)(i~t ing mea"uremenl technology may have a lower installation cost.
• The components contributing to a high dew point level may be identified and help to detennine the reason or source of these components.
WEAKNESSES:
• An indirect method relying on the correct application and suitability of the equation of state being used
• Accuracy of extended analys is, dependent on correct and regular use of special reference gases
• The limit of analysis sensitivity and compositional changes especially of aromatics, e.g. benzene and toluene, can produce large measurement elTors
• Specialist staff required to operate/maintain perfonnance
• High initial outlay for a GC with C9 capability. installation costs (analyzer house) and operating costs (personnel and reference gases) and EOS Software
AUTOMATIC OPTICAL CONDENSATION METHOD
Automatic Optical Condensation HCDP Analyzers have been in commercial use for over twenty years. Independent laboratory testing has shown them to have very good accurac ies to better than "± loP ,1 when compared to the Bureau of Mines manual dew point method. They can also provide the user with up to six measurement cycles per hour.
An optical detector is chilled until a thin layer of condensate fonn_" nn that surface. Measuring the detector temperature when that occurs gives the HCDP temperature. Automatic Dew Point Analyzers are not influenced by individual operators and include all gas constituents in their analysis. They are available in fie ld installable units that can be mounted very near the sample tap, providing a fast response to any change in the properties of the gas.
The dew point principle is one of the oldest methods of measuring WOP accurately and is also the oldest method for measuring HCDP (manual method). It has long been thought that the same technique could be automated to eliminate the subjectivity of the manual method. The
benefit would be an increase in accuracy and repeatability. But hydrocarbon condensates do not behave as water condensates do.
Water condensates disturb a light path in both the liquid and solid phases where hydrocarbon condensates do not. This is due to the unique high surface tension of water - a single molecule with very well documented characteristics. By comparison, hydrocarbon condensates have a very low surface tension and the issue is fu rther complicated by the fact that they are a mix of related compounds. Because the mixture of components cascade sequentially on a surface as it is chilled, the HCDP will occur gradually across a small range of temperatures. This is one reason that the manual method dew point technique needed a new approach.
In the mid- 1980s, researchers found that since hydrocarbon condensates have a very low surface tension and were shiny, they could be used as the mirror in an automatic system. A dry chemically etched dry sensor, with a strong light illuminating it, would diffuse the light instead of reflecting it. Then condensing a hydrocarbon dew layer onto the surface by cooling it wi ll focus the reflected light producing a strong image that can be detected easily. It was also discovered that a conical depression on the optical surface dramatically improved the repeatability.
.... ~
. " " Coy Opt\cII5tlrhce
Figure (IV
.
The detector 'sees' an image of just diffused light.
Figure V The detector 'Sees' an image of focused light as a ring
with a dark spot in the middle.
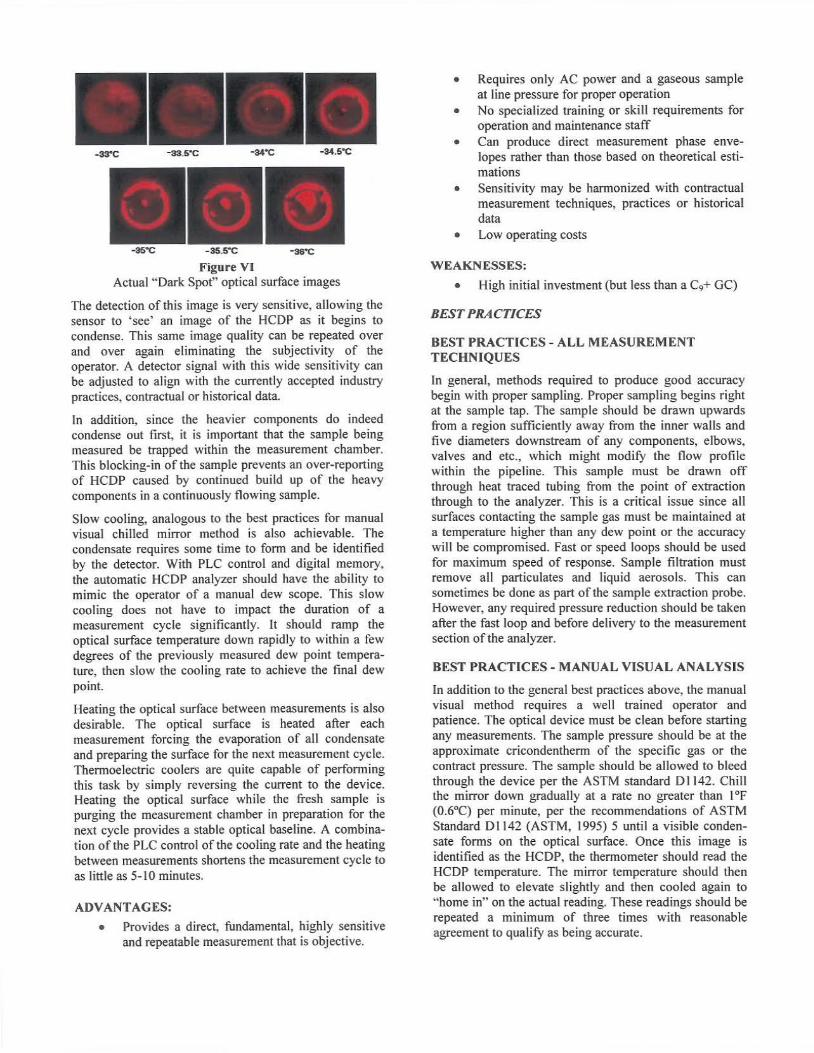
figure VI Actual "Dark Spot" optical surface images
The detection of this image is very sensitive, allowing the sensor to 'see' an image of the HCDP as it begins to condense. This same image quality can be repeated over and over again elim inating the subjectivity of the operator. A detector signal with this wide sensitivity can be adjusted to align with the currently accepted industry practices, contractual or historical data.
In addition, since the heavier components do indeed condense out first, it is important that the sample being measured be trapped within the measurement chamber. This blocking·in of the sample prevents an oveHeporting of HCDP caused by continued build up of the heavy components in a continuously flowing sample.
Slow cooling, analogous to the best practices for manual visual chilled mirror method is also achievable. The condensate requires some time to fonn and be identified by the detector. With PLC control and digital memory. the automatic HCDP analyzer should have the ability to mimic the operator of a manual dew scope. This slow cooling does not have to impact the duration of a measurement cycle significantly. It should ramp the optical surface temperature down rapidly to within a few degrees of the previously measured dew point tempera· ture, then slow the cooling rate to achieve the final dew point.
Heating the optical surface between measurements is also desirable. The optical surface is heated after each measurement forcing the evaporation of all condensate and preparing the surface for the next measurement cycle. Thennoelectric coolers are quite capable of performing this task by simply reversing the current to the device. Heating the optical surface while the fresh sample is purging the measurement chamber in preparation for the next cycle provides a stable optical baseline. A combina· tion of the PLC control of the cooling rate and the heating between measurements shortens the measurement cycle to as little as 5·10 minutes.
ADVANTAGES:
• Provides a direct, fundamental , highly sensitive and repeatable measurement that is objective.
• Requires only AC power and a gaseous sample at line pressure for proper operation
• No specialized training or skill requirements for operation and maintenance staff
• Can produce direct measurement phase enve· lopes rather than those based on theoretical esti· mations
• Sensitivity may be hannonized with contractual measurement techniques, practices or historical data
• Low operating costs
WEAKNESSES;
• High initial investment (but less than a C)+ GC)
BEST PRACTICES
BEST PRACTICES· ALL MEASUREMENT TECHNIQUES
In general, methods required to produce good accuracy begin with proper sampling. Proper sampling begins right at the sample tap. The sample should be drawn upwards from a region sufficiently away from the inner walls and five diameters downstream of any components, elbows, valves and etc., which might modify the flow profile within the pipeline. This sample must be drawn off through heat traced tubing from the point of extraction through to the analyzer. This is a critical issue since all surfaces contacting the sample gas must be maintained at a temperature higher than any dew point or the accuracy will be compromised. Fast or speed loops should be used for maximum speed of response. Sample filtration must remove all particulates and liquid aerosols. This can sometimes be done as part of the sample extraction probe. However, any required pressure reduction should be taken after the fast loop and before delivery to the measurement section of the analyzer.
BEST PRACTICES - MANUAL VISUAL ANALYSIS
In addition to the general best practices above, the manual visual method requires a well trained operator and patience. The optical device must be clean before starting any measurements. The sample pressure should be at the approximate cricondentherm of the specific gas or the contract pressure. The sample should be allowed to bleed through the device per the ASTM standard 01 142. Chill the mirror down gradually at a rate no greater than IOF (0.6"C) per minute, per the recommendations of ASTM Standard 01142 (ASTM, 1995) 5 until a visible condensate forms on the optical surface. Once this image is identified as the HCDP, the thermometer should read the HCDP temperature. The mirror temperature should then be allowed to elevate sl ightly and then cooled again to "home in" on the actual reading. These readings should be repeated a minimum of three times with reasonable agreement to qualify as being accurate.
BEST PRACTICES - GC ANALYSIS WITH EOS
GC best practices include using a C9+ GC and then adding data to C12 from periodic laboratory analysis to improve accuracy of the EOS calculations. These results should periodically be compared to actual manual visual measurements to further enhance predictability. Using multiple EOS may also provide data comparison review over time that will determine the historical significance of one formula over another for a specific field or supplier. Keep in mind that field GC installations may not comply with all of the above general best practices and may produce less accurate results. GC samples are analyzed at very low pressures compared to pipeline pressures and are predicting values by measurements at conditions far different from those of the actual pipeline.
BEST PRACTICES - AUTOMATIC DEW POINT ANALYZERS
RELIABLE DETECTION METHOD
A reliable detector is a given for all instruments. Rough or etched surfaces will be able to discriminate the HCDP because the condensate will make the optical surface more reflective and the image easier to detect.
CLOSE PROXIMITY TO PIPELINE SAMPLE POINT Automatic units should be able to be mounted near the sample tap with internal heaters and insulated housings. Using a sample already piped to an instrument house may be convenient. but the resulting delay in the update may cause serious lag in reaction time for control purposes. Since each manufacturer has different operating temperature specifications, environmental conditions often dictate this choice.
TRAP THE SAMPLE DURING THE MEASUREMENT
A sample that is allowed to flow continuously creates an abnormal build up of the heavier hydrocarbons on the optical surface. Blocking in the sample during the measurement cycle will produce more accurate readings.
CONTROLLING MEASUREMENT PRESSURE
The derivation of the word cricondentherm is Critical condenSfllion thennal curve - also called the "phase envelope". The cricondentherm is the point on this curve where pressure and temperature indicate that the maximum HCDP is to be found, so the measurement pressure must be controlled.
Many contracts are written with this cricondentherm point as the measuring point for the maximum allowable HCDP in the gas. Contracts written with the reference to the maximum HCDP at any pressure, are describing the same point.
The cricondentherm pressure is not as critical as may be anticipated. Since the profile of this region of the curve is nearly vertical. a change of fifty to a hundred psi either way can be shown to produce very little change in the accuracy of the measurement. In the expanded graph example below, a change of 100 psi results in influencing the HCDP a maximum of only 2°F. In contrast, just I ppmv of a C IO component in the sample can change the HCDP by as much as lOoP It is however. always good practice for the measurement 10 be performed at the contract pressure which is often the cricondentherm pressure.
Phase Envelope At The Cricondel Itl teRn
900
800
700
500
JOO
200
1'-. t-...
;::::
• 8 HCdpoF
Figure VII
I'"
~ 51'
10
HEAT THE OPTICAL SURFACE BETWEEN MEASUREMENTS
Without sensor heating the total cycle time can be three times that of the heated one and result in less reliability of the measurement.
KEEP INTERNAL VOLUMES SMALL
When the volume of sample in the measuring chamber is reduced, it will speed the measurement and allow faster purging of the measurement chamber.
FREQUENT SAMPLING
Many of the above practices will allow automatic dew point analyzers to make more frequent measurements. Frequent measurement cycles provide for beher response to changes in the gas conditions and a llow control functions to be implemented in a more timely fashion.
CAPABILITY FOR ALIGNING WITH CONTRACT DATA
Historically the working definitions of HCDP have been slightly modified and standards have been reviewed with
consideration to incorporate them. If this trend will continues and changes come into effect, it is essential to have the ability to adjust the analyzer to align with newly refined standards.
WHAT IS AT RISK WHEN HCDP IS NOT MEASURED ACCURATELY?
When measuring the heat content of natural gas that governs all fiscal transactions of gas purchasing certain practices have become industry accepted for proper sampling and conditioning for accurate measurements. The hydrocarbon dew point is perhaps the single most important propeny to consider in natural gas sampling. If the sample temperature drops below the hydrocarbon dew point temperature, a significant loss in hydrocarbon content can occur, resulting in errors in volumetric flow rate, heating value and other gas property calculations. I It of vital concern for all parties to the transaction to follow these same procedures to have the same results and eliminate disputes over billing for gas delivered.
End User Risks
Large natural gas consumers using natural gas for firing aeroderivative turbines are becoming more aware of the impact they can feel if the HCDP is out of specification. Gas fueled turbine power generation plants have been hit with high exposure risk of fines for NOX em issions which become excessive as the HCOP climbs over the contract limits.
Turbine manufacturers specify a superheat of the gas of 50"F - the gas temperature must be 50"F higher than either the HCDP or the WOP whichever is greater. This is to protect against condensate formation as the pressure is let down from pipeline pressure to burner operating pressure caused by the Joule-Thompson coefficient. If liquid hydrocarbons condense out during the pressure letdown, flashback can occur. "For a GE Frame 7 gas turbine, 50°F of superheat amounts to about 740 k W, which means energy costs can be as high as $324,120 per year.'.11 If HCOP is maintained at contract levels this parasitic load to heat the gas can be dramatically reduced increasing the power available for sale.
Excessive HCDP causes turbine flashback where the flame ITont reverses and moves toward the source of the gas instead of the turbine. "This is known as flashback and can lead to significant damage to the gas turbine within seconds of it occurring.,,9 Often, the operator must reduce power on the turbine to sustain consistent power output at a lower level or risk continued flashbacks. "Flashback can be a significant issue during combustion turbine operation, as it can reduce combustor life and, in extreme cases, cause combustor damage and extensive repairs."'o
Long term effects of high HCDP are excessive maintenance costs as the heavier hydrocarbons damage burner sections and even the IUrbine blade tips of this expensive equipment. Rebuilding just the burner section is a $2 .5 -
$3 million direct cost in addition to lost production for this unscheduled outage. These unbudgeted costs seriously impact the profitability and potentially the viability of these operations. This risk drives this critical gas quality measurement where compliance to the fuel specification is not optional.
Pipeline Operator Risks
The demand for quality gas shifts upstream to the pipeline operators who have a custodial function in addition to the transportation function of the gas. Obviously, their delivery of good quality gas is dependent on their receipt of good quality gas. Thus the responsibility for measuring and recording their receipts are the only way their custodianship can be verified.
If their gas receipts do not comply with the contract, there is a resultant shut-in risk for these operators. They only get paid as long as the gas is moving to the end users.
If this measurement is inaccurate and liquids build up in their pipelines, their investment in turbine compressors is put at risk. Turbine compressors do not do well with multiphase flow. Increased frequency of pigging operations, when liquid flow is detected, adds to the cost of moving the gas effectively.
Producer / Processor Risks
Finally, the producer/processor has the initial control over this resource. If they do not comply with the gas contract, they will be shut-in. Their operation comes to an abrupt halt and another vendor will often step in to fill the end users' demand. In any business, allowing a competitor to fill your customers' need is a huge risk for that operation to remain viable. More and more, shut-ins carry contractual penalties as the additional cost for changing over to a competitive suppl ier impacts the end user as well.
The unprocessed gas also has many recoverable compounds that can bring added income to the producer/processors' operation. These NGLs currently have significant value to drive their recovery to the limit of the processors' capabil ity. The economics of their recovery will fluctuate as market conditions change but NGLs will always have value and recovering them adds to the security of not experiencing shut-ins.
Some of the costs are identifiable but impossible to quantify. Onc cxample is the legal costs when there is a dispute over shut-ins driven by gas quality measurement by the end user. These can be avoided when the producer/processor and pipeline operator accurately measure the HCOP along with the water content and encourage their customer to do the same. Accountability is always preferable to litigation.
Some of these costs can be quantified as in the case of the cost ofa shut-in as illustrated below:
These substantial costs are not the total picture. In addition to costs above there are other costs, e.g. the cost of litigation.
CONCLUSION
Gas contracts are more restrictive now as the market demands continue to tighten. Accurate data is the only enforcement method available for contract quality issues. Accurate on-line instruments are now available that confinn these contractual specifications afe met.
In the choice of methods used to measure hydrocarbon dew point, installed cost is an important consideration. Less expensive instrumentation techniques may underreport the dew point risking shut-ins and lost revenue. Even if the installed cost is somewhat higher, choosing an accurate method has been shown to be a bener value. An inaccurate instrument choice can also over-report the dew point temperature which would drive the control system to over-process incoming gas. This would significantly add to the operational cost whi le cutting profits.
Reliable accurate HCDP instrumentation assists in controlling the gas processing operation thereby enhancing the profitability in this complex business. Fullfeatured automatic HCDP analyzers will produce the best results and will often have a ROI that will pay ror their installation in just a few months of operation. Should an upset in the gas supply occur, these analyzers will certainly pay for themselves on the first occurrence by alerting operations to such an event in time to prevent a shut-in.
ACKNOWLEDGMENT
The author would like to thank Andy Benton, Michell Instruments, ltd., Ely, Cambridgeshire, II. K. for his. hody of work on the topic of measuring HCDP. He has written and presented many papers upon which much of this document is based. With over 25 years of experience in the technology and appl ication of this measurement, his input has been invaluable. He has presented at ISHM, ASGMT and NGS Tech as well as several other schools and conferences globally.
REFERENCES
I . "Natural Gas Quali ty: Hydrocarbon Liquid Drop Out and Interchangeability - An Update on NGC+ Efforts", Terry Boss - Interstate Natural Gas Association of America, NGC+ Interchangeability Work Group Presentation, February 28, 2005.
2. "Chilled Mirror Device For Water & Hydrocarbon Dew Point Detenn ination", Eric D. Thompson, Chandler Engineering, AGMSC 2003.
3.
4.
5.
6.
7.
8.
9.
10.
"Hydrocarbon Dew Point Monitoring or Natural Gas Using Field-Mounted On-Line vas Chromatographs", K. Ernst. D. Pettigrew, Emerson Process Managemem, Pipeline & Gas Journal, July 2005.
'"The Impact of API 14.1 and Other Standards to Practical Considerations for Gas Sampling", David J. Fish, Welker Engineering Company.
"The Need for Accurate Hydrocarbon Dew Point Detennination", D. George, Ph.D. et al., Southwest Research Institute, Pipeline & Gas Journal, September 2005.
"Gas Fuel Clean-Up System Design Considerations for GE Heavy-Duty Gas Turbines", C. Wilkes, GE Power Systems, GE Publication GER·3942 .
"Tests of Instruments for Measuring Hydrocarbon Dew Points in Natural Gas Streams, Phase 1", Prepared for the Measurement Technical Comm ittee of Pipeline Research Councillnternational, Inc., D. L. George, Ph.D .• R. C. Burkey, Southwest Research Institute.
"DLN Combustors Demand Better Fue l-Gas Conditioning", Power, March I April 2001, Craig Tiras, PE, Flowtronex International.
"Utilizing Associated Gas in Industrial Gas Turbines", Geraldine Roy, Senior Market Analyst, Siemens Industrial Turbomach inery ltd, Power-Gen Worldwide, Published: Jan 1, 2010.
"Flexible Fuel Combustor Design Accommodates LNG", Pratyush Nag and Ranjeet Vader, Siemens Energy Inc., Power Magazine, August 1,2009.