Measuring Labour Mismatch in Europe * Ant´ onio Morgado † Tiago Neves Sequeira ‡ Marcelo Santos § Alexandra Ferreira-Lopes ¶ Ana Balc˜ao Reis k Abstract In this paper we purpose six new measures of mismatch in the labor market and apply them to a group of European Countries. These indicators measure educational level mis- match (total, overeducation, and undereducation) and field mismatch. We characterize them by country, sector and occupation between 1993 and 2011. From 15% to near 35% of European workers have a job for which they have more (or less) qualifications than the usual level, depending on the country. From 25% to nearly 50% work in a job for which they do not have the usual field qualification. There is a great difference in mismatch among European labour markets. Undereducation affects more workers than overeduca- tion in most European countries. Among sectors of activity, Agriculture, forestry and fishery and Household production are the ones in which there is the highest proportion of mismatch. Among occupations, there is also among Agricultural, forestry and fish- ery workers that mismatch is higher. However, this also differs a lot among European countries. We study the influence of the different measures of mismatch on the evolution of per capita output both in the short and the long-run. We found evidence of strong short-run effects of mismatch. JEL Classification: J24, O50. Keywords: Education, Human Capital, Mismatch, Labour Market. * We kindly acknowledge financial support by Funda¸ c˜ ao para a Ciˆ encia e Tecnologia, under project Education Mismatches and Productivity Differences (PTDC/EGE-ECO/112499/2009). The raw micro-data used in this paper is from the Labour Force Survey (LFS) and was supplied by the Eurostat, under contract LFS/2012/22, which we acknowledge. The responsibility for the conclusions in this paper are from the authors and not those of Eurostat, the European Commission or any of the national authorities whose data have been used. † ISCAL - IPL. Polithecnic Institute of Lisbon ‡ Corresponding author. Departamento de Gest˜ ao e Economia and CEFAGE-UBI. Universidade da Beira Interior. Estrada do Sineiro. 6200-209 Covilh˜ a, Portugal. email: [email protected]§ Departamento de Gest˜ ao e Economia and CEFAGE-UBI. Universidade da Beira Interior. ¶ Instituto Universit´ ario de Lisboa, ISCTE-IUL, ISCTE Business School Economics Department, BRU-IUL (Business Research Unit), Lisboa, Portugal, and CEFAGE-UBI. k NOVA School of Business and Economics and INOVA. 1
Transcript
Measuring Labour Mismatch in Europe∗
Antonio Morgado† Tiago Neves Sequeira‡ Marcelo Santos§
Alexandra Ferreira-Lopes¶ Ana Balcao Reis‖
Abstract
In this paper we purpose six new measures of mismatch in the labor market and applythem to a group of European Countries. These indicators measure educational level mis-match (total, overeducation, and undereducation) and field mismatch. We characterizethem by country, sector and occupation between 1993 and 2011. From 15% to near 35%of European workers have a job for which they have more (or less) qualifications than theusual level, depending on the country. From 25% to nearly 50% work in a job for whichthey do not have the usual field qualification. There is a great difference in mismatchamong European labour markets. Undereducation affects more workers than overeduca-tion in most European countries. Among sectors of activity, Agriculture, forestry andfishery and Household production are the ones in which there is the highest proportionof mismatch. Among occupations, there is also among Agricultural, forestry and fish-ery workers that mismatch is higher. However, this also differs a lot among Europeancountries. We study the influence of the different measures of mismatch on the evolutionof per capita output both in the short and the long-run. We found evidence of strongshort-run effects of mismatch.
JEL Classification: J24, O50.Keywords: Education, Human Capital, Mismatch, Labour Market.
∗We kindly acknowledge financial support by Fundacao para a Ciencia e Tecnologia, under project EducationMismatches and Productivity Differences (PTDC/EGE-ECO/112499/2009). The raw micro-data used in thispaper is from the Labour Force Survey (LFS) and was supplied by the Eurostat, under contract LFS/2012/22,which we acknowledge. The responsibility for the conclusions in this paper are from the authors and not thoseof Eurostat, the European Commission or any of the national authorities whose data have been used.†ISCAL - IPL. Polithecnic Institute of Lisbon‡Corresponding author. Departamento de Gestao e Economia and CEFAGE-UBI. Universidade da Beira
Interior. Estrada do Sineiro. 6200-209 Covilha, Portugal. email: [email protected]§Departamento de Gestao e Economia and CEFAGE-UBI. Universidade da Beira Interior.¶Instituto Universitario de Lisboa, ISCTE-IUL, ISCTE Business School Economics Department, BRU-IUL
(Business Research Unit), Lisboa, Portugal, and CEFAGE-UBI.‖NOVA School of Business and Economics and INOVA.
1
1 Introduction
Mismatch in labour markets is usually associated to the presence of overeducation and undere-
ducation, meaning the extent to which individuals possess a level of education and/or training
above or below the one required for their job, respectively. Mismatch has been widely referred
to in the literature, specifically related to unemployment duration and wage inequality, for
which Ordine and Rose (2011) (13) and Budria and Moro-Egido (2008) (3) are good examples.
We may think that mismatch is a transitory short-term phenomenon, eventually associated
with rigidities in flows in and out of employment. Actually, overeducation is referred to by
Ordine and Rose (2011) (13) as a voluntary short-term strategy to enter the labour market,
but as they point out, it may also be a consequence of low individual ability for that level of
education or it may just be a matter of choice related to compensating advantages in the choice
occupation/payoff. Also, overeducation can be the outcome of long periods of unemployment,
giving rise to an exacerbation of the availability to enter the labour market loosing the wage
premia associated with higher education. Tracing the reasons for mismatches between labour
supply and demand is very important, as they can potentially be very costly to the economy, by
restricting productivity growth. Hence, measuring mismatch adequately is of central relevance
for subsequent analysis.
Following Hartog (2000) (8), we identify and discuss three methods of measuring over and
undereducation, which we describe shortly:
1. Job Analysis, where professional job analysts specify the required level and type of edu-
cation for the job titles in an occupational classification. The Dictionary of Occupational
Titles is the result of such an analysis. Detecting mismatch using this method consists
basically in comparing a current worker’s situation with the standard match described
in, e.g., the Dictionary of Occupational Titles.
2. Worker Self-Assessment, where the worker specifies the education she deems required
for the job. This can be done directly through the explicit specification of the type of
schooling required, or indirectly, through comparison to the workers’ actual education,
assessing whether a higher, or lower, or different education is needed.
3. Realized Matches, where the required education for a job or occupation is derived from
2
what workers in that job or occupation usually have attained. Mismatch in this method-
ology is, therefore, assessed by comparing a worker’s education to the mean or mode of
education of workers in the same job or occupation, resulting in a measure similar to the
variance of the distribution of education levels for the workers in that job or occupation.
Job Analysis, even though objective, can be unreliable, dated, and has a large measurement
error in relation to the assignment of job level codes to any survey responses on the type of work.
Also, this assignment can be country-specific, which invalidates international comparisons.
Furthermore, any error or ad-hoc choice as far as the matching education/occupation/job is
concerned, has a contamination effect throughout the whole analysis, as that matching depends
on the personal judgement of job analysts. For Portugal, an occupational classification exists in
Quadros de Pessoal, and a matching of level and type of education for each type of occupation
has been done in a very aggregate form (Coelho et al. , 1982 (5)). This can be seen in Kiker
et al. (1997) (10), where they conclude that this method detects the higher mismatch (in
relation to Realized Matches).1
As an alternative to Job Analysis, Worker Self-Assessment, however, is subjective. Even
though it deals with the survey respondent’s job specifically and doesn’t try to match the
responses to any pre-existent standard, it lacks rigorous instructions. The worker may over-
state the requirements of education and/or training to the job due to a status effect, or the
responses may reproduce the hiring standards, not the match between education/training and
job/occupation. Actually, as school levels increase with time, employers tend to adjust hir-
ing standards, even though the nature and skills of a job may not have changed accordingly.
Worker Self-Assessment is widely used as a method due to its relative simplicity. Budria and
Moro-Egido (2008) (3) use the worker responses from the survey of European Community
Household Panel (ECHP) to que following questions:
1. Do you feel that you have skills or qualifications to do a more demanding job than the
one you have now?
1Specifically, Job Analysis detects that, of all workers, 33.1% are overeducated, 37.5% are undereducatedand 29.4% are correct matches. Realized Matches methodology, using the mean as the reference, detects 85.6%of correct matches (9.4% overeducation and 5% of undereducation), but using the mode as the reference,correct matches are no more than 57.5% (25.5% overeducation and 17% undereducation). As we may concludebelow, these results are in line with the ones we obtain for Portugal, with very close values for overeducation,although we analyse a more recent period. This comparative study was performed using Quadros de Pessoalfor the period 1985-1991. Comparison with Worker Self-Assessment method is not feasible.
3
2. Have you had formal training or education that has given you skills needed for your
present type of work?
The answers are, then, classified according to the following rule: if ‘yes’ to both, worker is
over qualified, if ‘no’ to both, the worker is incorrectly qualified, if ‘yes’ to question 1 and ‘no’
to question 2, the worker is strongly mismatched, and finally, if ‘no’ to question 1 and ‘yes’ to
question 2, the worker is correctly qualified.
An example of the use of Realized Matches methodology can be found in Kiker and Santos
(1991) (9) for Portugal, where they classify a worker as overeducated if he has the number
of years of schooling greater than one standard deviation above the mean for his (essentially)
three-digit occupational code, whereas a worker is classified as undereducated if his years of
schooling are more than one standard deviation below the mean for his occupational code.
Also, Mendes de Oliveira et al. (2000) (12) use this method, but instead of the mean, they
use the mode as the reference. This methodology to measure mismatch has a structural
problem: it is using the endogenous (equilibrium) assignment of jobs, which depends on hiring
standards and labour market conditions, to track an error in that same assignment, that
is, mismatch, without using any exogenous information to separate correct matches from
mismatches. Mismatch should be understood as a shift indicator for the market demand for
jobs, which cannot be traced simply by analysing the distribution of endogenous equilibrium
values in relation to the mean or mode of the workers’ education. As a method, it basically
uses observations on the realised equilibrium between demand and supply.
Our first objective in this paper is to provide (equilibrium) measures of mismatch in Eu-
ropean countries, thus the realised matches method fits perfectly well our purposes. Our
contribution to the literature is three-fold: (i) we provide new evidence on mismatch levels
(total, under- and overeducation, strong under- and overeducation) comparable by countries
and years, presenting a new panel dataset with 30 countries during nearly 20 years; (ii) for the
first time, we provide joint and comparable evidence on educational level mismatch and field
mismatch and (iii) we relate the constructed measures with the short and long-run evolution
of the economy.
This work has the following structure: In Section 2 we describe the methodology and data
used. Section 3 describes our new measures of mismatch, detailing the evidence they highlight
4
for European countries and Section 4 analyzes the influence of mismatch in the short and
long-run economic performance.
2 Methodology and Data
Using the Labour Force Survey (LFS) we propose to measure mismatch using the Realized
Matches approach, following the works of Kiker (10), (12), and (9). We choose this method-
ology given that we want to guarantee international comparison of results as well as time-
coherence.
We start by calculating the average highest level of education, measured in years of edu-
cation, attained by the workers in a given occupation in a certain economic activity in each
country.
Because in different waves of the LFS, the included ISCED levels in the database are differ-
ent, we had to consider a correspondence scale between ISCED levels and years of education.2
If one worker falls beyond one standard-deviation from the mean, we consider that there
is mismatch and signal it with 1 or -1 depending on being above or below the higher and
lower limits of the interval. In those cases we say that the individual is overeducated or
undereducated, respectively. We also signal the cases that fall beyond two standard-deviations
from the mean, and signal those with 2 or -2, respectively depending on wether the observation
is over or under the limits of the interval. In these cases, we say that the individual is
strongly overeducated and strongly undereducated, respectively. Our measure of mismatch is
the proportion of cases signaled -2, -1, 1 and 2 in relation to the total number of observations
for a given country in a given year. They represent respectively undermatch and overmatch.
That measure will have a value between 0 and 1, such that 0 means no mismatch and 1 means
that all workers are mismatched. Overmatch and undermatch are aditive and they total the
percentage of mismatch.
More precisely, let ei represent the highest level of education for worker i as indicated in
the data of LFS. Let oi be the ocupation of that worker and ai the economic activity according
to NACE classification. We define the indicator function, specific for country c and year y as
2This procedure has now become common since large country surveys use ISCED levels and not years ofeducation as a measure of schooling attainment. (see e.g. Biagetti and Scicchitano (2001) (1) and Gloker andSteiner (2011) (7)). The definition of the source HATLEVEL variable, as well as the correspondence scalebetween the HATLEVEL and years of education is presented in the Appendix.
5
IEicy (ei|oi, ai, ci, yi) = −2⇐= ei − e < −2seIEicy (ei|oi, ai, ci, yi) = −1⇐= −2se < ei − e < −se
IEicy (ei|oi, ai, ci, yi) = 0⇐= −se < ei − e < seIEicy (ei|oi, ai, ci, yi) = 1⇐= se < ei − e < 2se
IEicy (ei|oi, ai, ci, yi) = 2⇐= ei − e > 2se
Thus, our measure of mismatch for a given country c and year y is
MEc,y =
∑i:IEicy 6=0
|IEicy|
ncy
An overeducation measure can thus be obtained using just IE = 1 or IE = 2 and an
undereducation measure using IE = −1 or IE = −2. A strongly overeducated measure is
obtained using just IE = 2 and a strongly undereducated measure is obtained using just
IE = −2.
Applying this methodology to a variable that indicates the highest level of education at-
tained, allows us to identify the proportion of workers that have less education or more ed-
ucation that the one that is typically required for the job in a given occupation, economic
activity and country (which is the interpretation of the value for the mean level of education).
Hence the sum of both proportions yields the level of mismatch, which is the value of indicator
MEc,y.
We also apply this methodology to measure the mismatch in the field of education, i.e.,
if a worker has not completed the usual field of education to perform a given job. We name
variable fi, representing the field of education for worker i. However, since fi is a categorical
variable, results are meaningless if taken as a value over one standard-deviation from the mean
or below it. Therefore, the objective is understanding whether a worker possesses adequate
training for her job or if she is performing a task completely unrelated to the training she
received, which will be a case of mismatch.3 Our measure of field-mismatch is thus:
IFicy (fi|oi, ai, ci, yi) = 0⇐= −sf < fi − f < sf
3An alternative approach here would be to consider any deviation from the mode, as a mismatched worker,concerning the field of education. However, given that the definitions of the source variable HATFIELD havea certain notion of ‘proximity’ between the needed skills to attain different fields of study (e.g. Humanities,languages and arts (200) is closer to Foreign languages (222) than from Computer science (481)) we choose theapproach that measure distance from the average, which we think better explores this notion of ‘proximity’between fields of study. Definitions of the source variable HATFIELD are detailed in the Appendix.
6
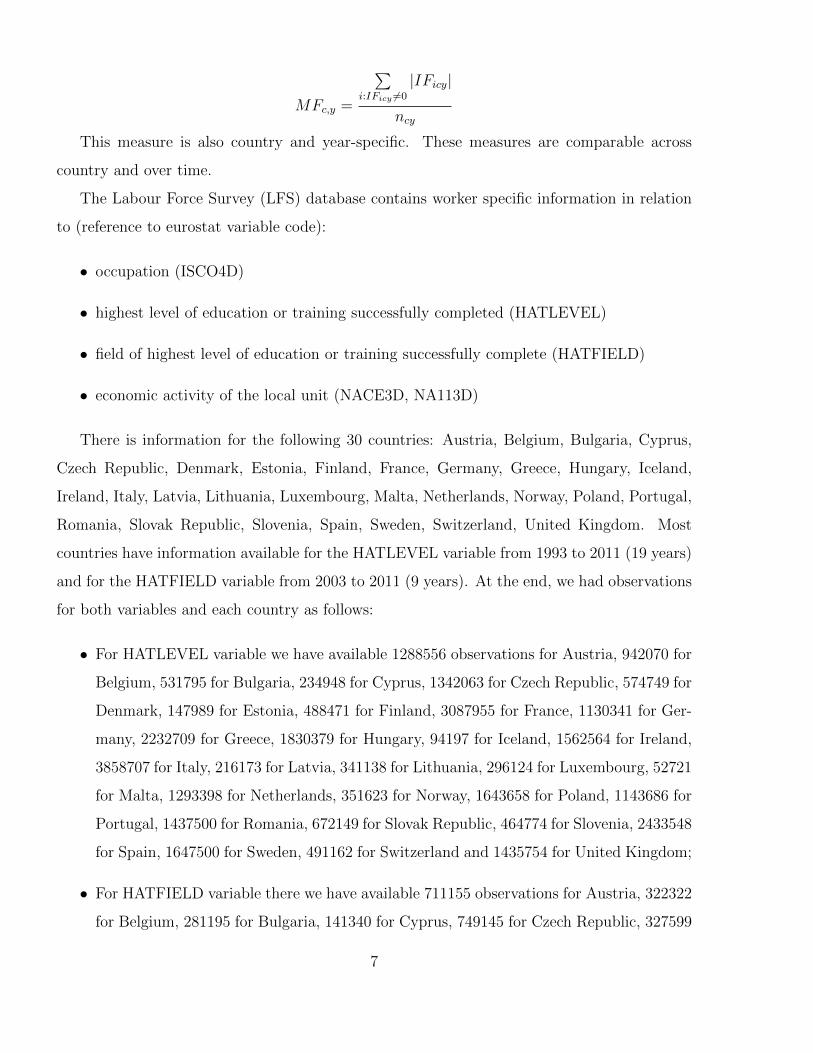
MFc,y =
∑i:IFicy 6=0
|IFicy|
ncy
This measure is also country and year-specific. These measures are comparable across
country and over time.
The Labour Force Survey (LFS) database contains worker specific information in relation
to (reference to eurostat variable code):
• occupation (ISCO4D)
• highest level of education or training successfully completed (HATLEVEL)
• field of highest level of education or training successfully complete (HATFIELD)
• economic activity of the local unit (NACE3D, NA113D)
There is information for the following 30 countries: Austria, Belgium, Bulgaria, Cyprus,
Czech Republic, Denmark, Estonia, Finland, France, Germany, Greece, Hungary, Iceland,
Ireland, Italy, Latvia, Lithuania, Luxembourg, Malta, Netherlands, Norway, Poland, Portugal,
Romania, Slovak Republic, Slovenia, Spain, Sweden, Switzerland, United Kingdom. Most
countries have information available for the HATLEVEL variable from 1993 to 2011 (19 years)
and for the HATFIELD variable from 2003 to 2011 (9 years). At the end, we had observations
for both variables and each country as follows:
• For HATLEVEL variable we have available 1288556 observations for Austria, 942070 for
Belgium, 531795 for Bulgaria, 234948 for Cyprus, 1342063 for Czech Republic, 574749 for
Denmark, 147989 for Estonia, 488471 for Finland, 3087955 for France, 1130341 for Ger-
many, 2232709 for Greece, 1830379 for Hungary, 94197 for Iceland, 1562564 for Ireland,
3858707 for Italy, 216173 for Latvia, 341138 for Lithuania, 296124 for Luxembourg, 52721
for Malta, 1293398 for Netherlands, 351623 for Norway, 1643658 for Poland, 1143686 for
Portugal, 1437500 for Romania, 672149 for Slovak Republic, 464774 for Slovenia, 2433548
for Spain, 1647500 for Sweden, 491162 for Switzerland and 1435754 for United Kingdom;
• For HATFIELD variable there we have available 711155 observations for Austria, 322322
for Belgium, 281195 for Bulgaria, 141340 for Cyprus, 749145 for Czech Republic, 327599
7
for Denmark, 84242 for Estonia, 233986 for Finland, 1251307 for France, 649987 for
Germany, 821746 for Greece, 1043699 for Hungary, 43033 for Iceland, 431997 for Ireland,
1606183 for Italy, 117825 for Latvia, 237564 for Lithuania, 145196 for Luxembourg, 15973
for Malta, 614926 for Netherlands, 173987 for Norway, 1002464 for Poland, 221632 for
Portugal, 836328 for Romania, 460423 for Slovak Republic, 281122 for Slovenia, 306184
for Spain, 1139786 for Sweden, 269252 for Switzerland and 477807 for United Kingdom.
Definitions for different variables are in the Appendix.
3 Mismatch in Europe
In this section we will concentrate on describing the mismatch measures in Europe. First, we
will analyse education level mismatch (under and overeducation) and then we will analyse field
mismatch.4
3.1 Under and Overeducation in Europe
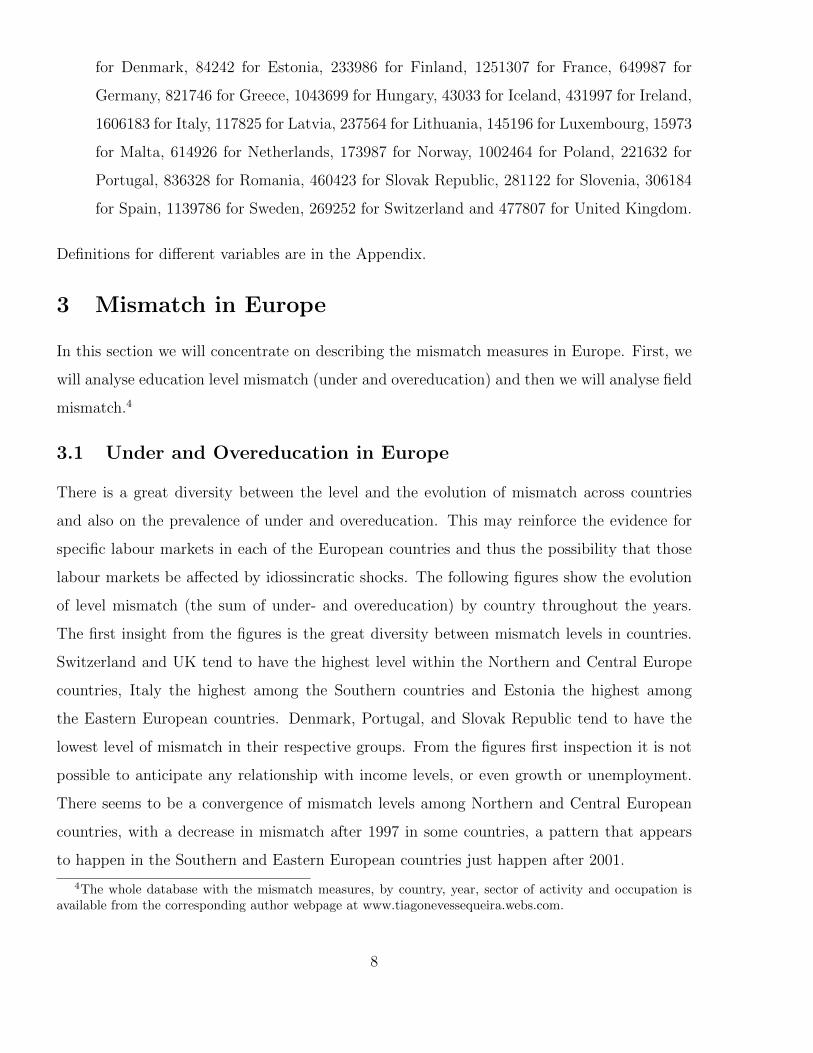
There is a great diversity between the level and the evolution of mismatch across countries
and also on the prevalence of under and overeducation. This may reinforce the evidence for
specific labour markets in each of the European countries and thus the possibility that those
labour markets be affected by idiossincratic shocks. The following figures show the evolution
of level mismatch (the sum of under- and overeducation) by country throughout the years.
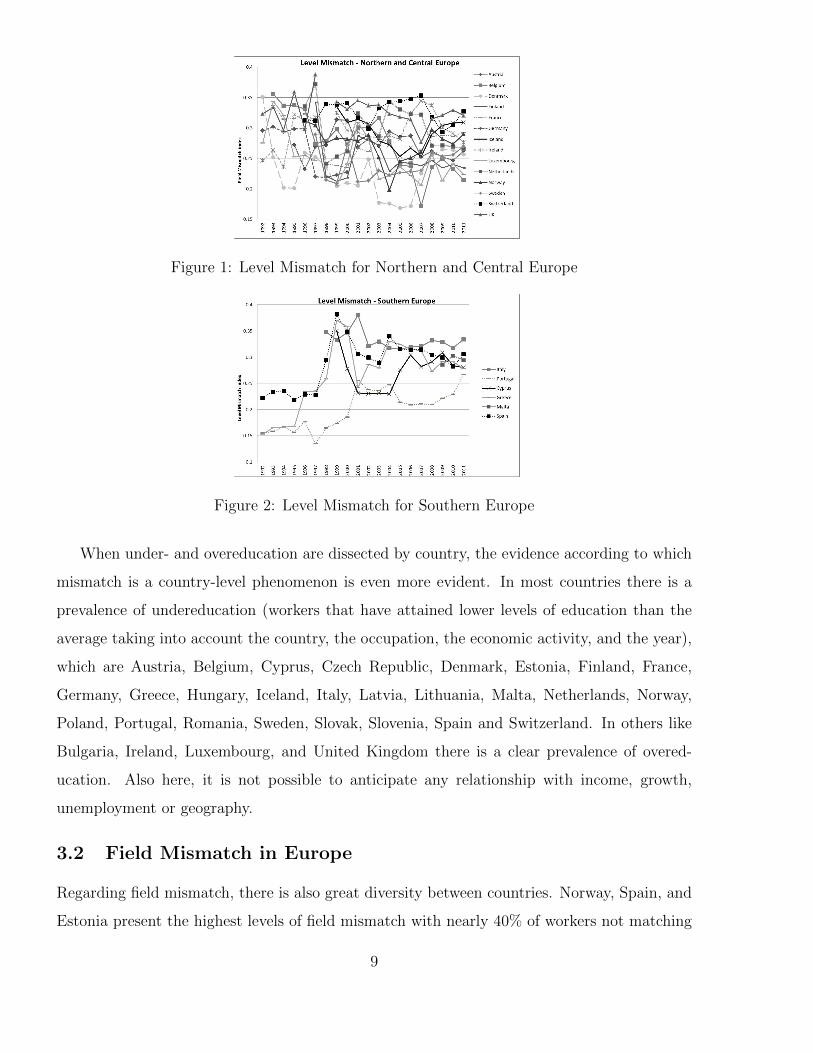
The first insight from the figures is the great diversity between mismatch levels in countries.
Switzerland and UK tend to have the highest level within the Northern and Central Europe
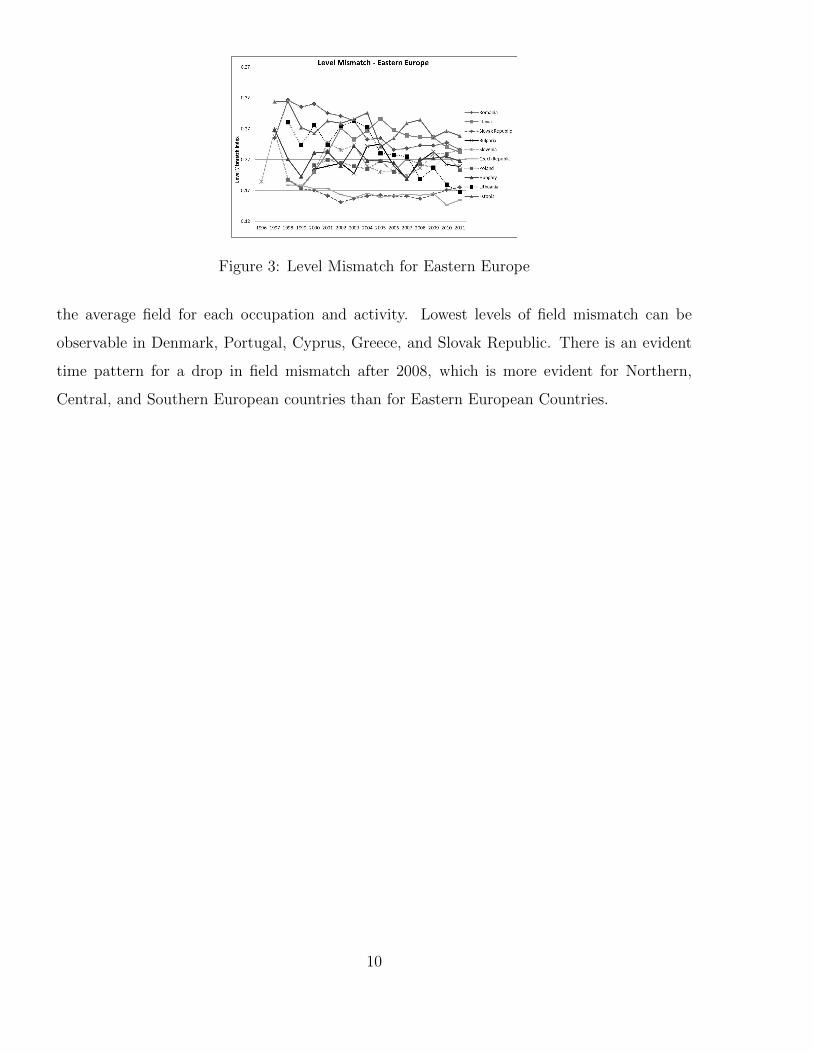
countries, Italy the highest among the Southern countries and Estonia the highest among
the Eastern European countries. Denmark, Portugal, and Slovak Republic tend to have the
lowest level of mismatch in their respective groups. From the figures first inspection it is not
possible to anticipate any relationship with income levels, or even growth or unemployment.
There seems to be a convergence of mismatch levels among Northern and Central European
countries, with a decrease in mismatch after 1997 in some countries, a pattern that appears
to happen in the Southern and Eastern European countries just happen after 2001.
4The whole database with the mismatch measures, by country, year, sector of activity and occupation isavailable from the corresponding author webpage at www.tiagonevessequeira.webs.com.
8
Figure 1: Level Mismatch for Northern and Central Europe
Figure 2: Level Mismatch for Southern Europe
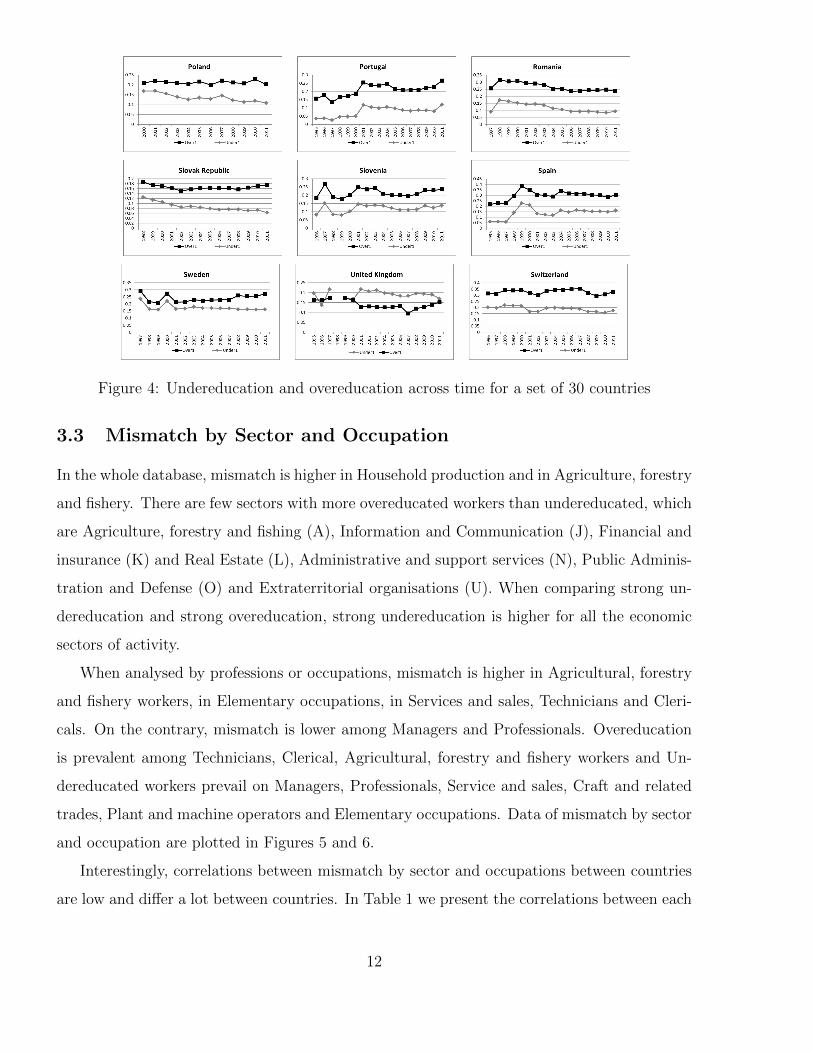
When under- and overeducation are dissected by country, the evidence according to which
mismatch is a country-level phenomenon is even more evident. In most countries there is a
prevalence of undereducation (workers that have attained lower levels of education than the
average taking into account the country, the occupation, the economic activity, and the year),
which are Austria, Belgium, Cyprus, Czech Republic, Denmark, Estonia, Finland, France,
Germany, Greece, Hungary, Iceland, Italy, Latvia, Lithuania, Malta, Netherlands, Norway,
Poland, Portugal, Romania, Sweden, Slovak, Slovenia, Spain and Switzerland. In others like
Bulgaria, Ireland, Luxembourg, and United Kingdom there is a clear prevalence of overed-
ucation. Also here, it is not possible to anticipate any relationship with income, growth,
unemployment or geography.
3.2 Field Mismatch in Europe
Regarding field mismatch, there is also great diversity between countries. Norway, Spain, and
Estonia present the highest levels of field mismatch with nearly 40% of workers not matching
9
Figure 3: Level Mismatch for Eastern Europe
the average field for each occupation and activity. Lowest levels of field mismatch can be
observable in Denmark, Portugal, Cyprus, Greece, and Slovak Republic. There is an evident
time pattern for a drop in field mismatch after 2008, which is more evident for Northern,
Central, and Southern European countries than for Eastern European Countries.
10
11
Figure 4: Undereducation and overeducation across time for a set of 30 countries
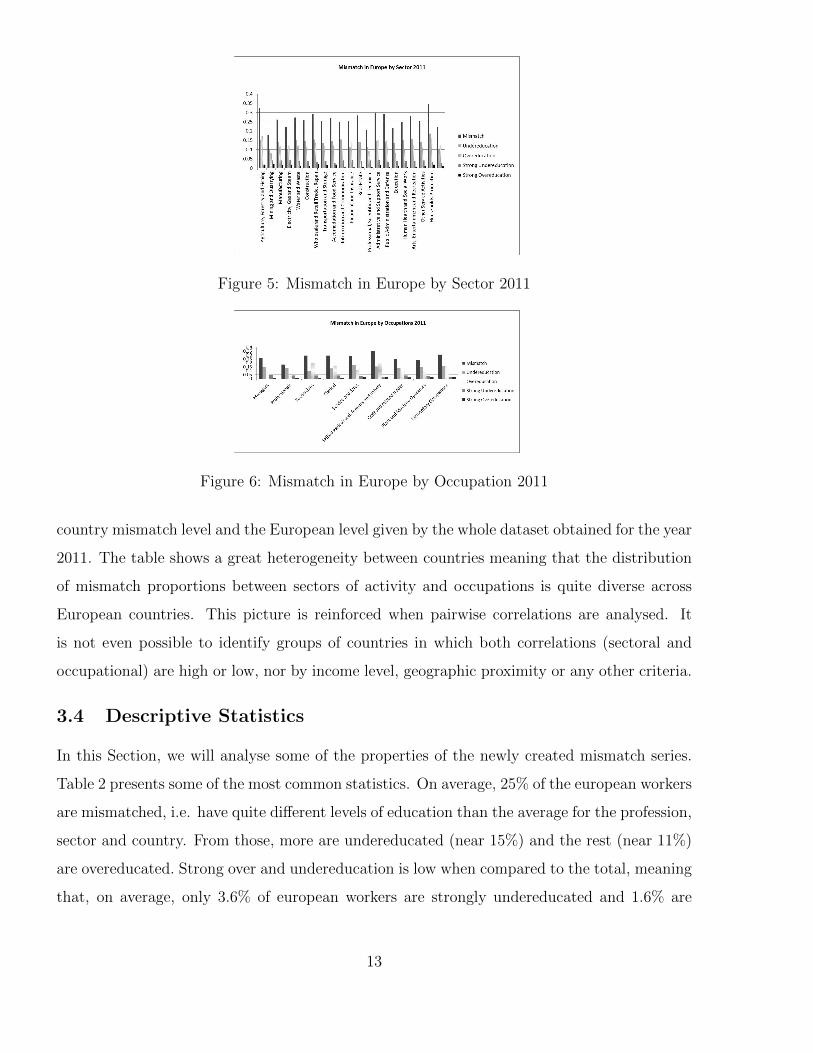
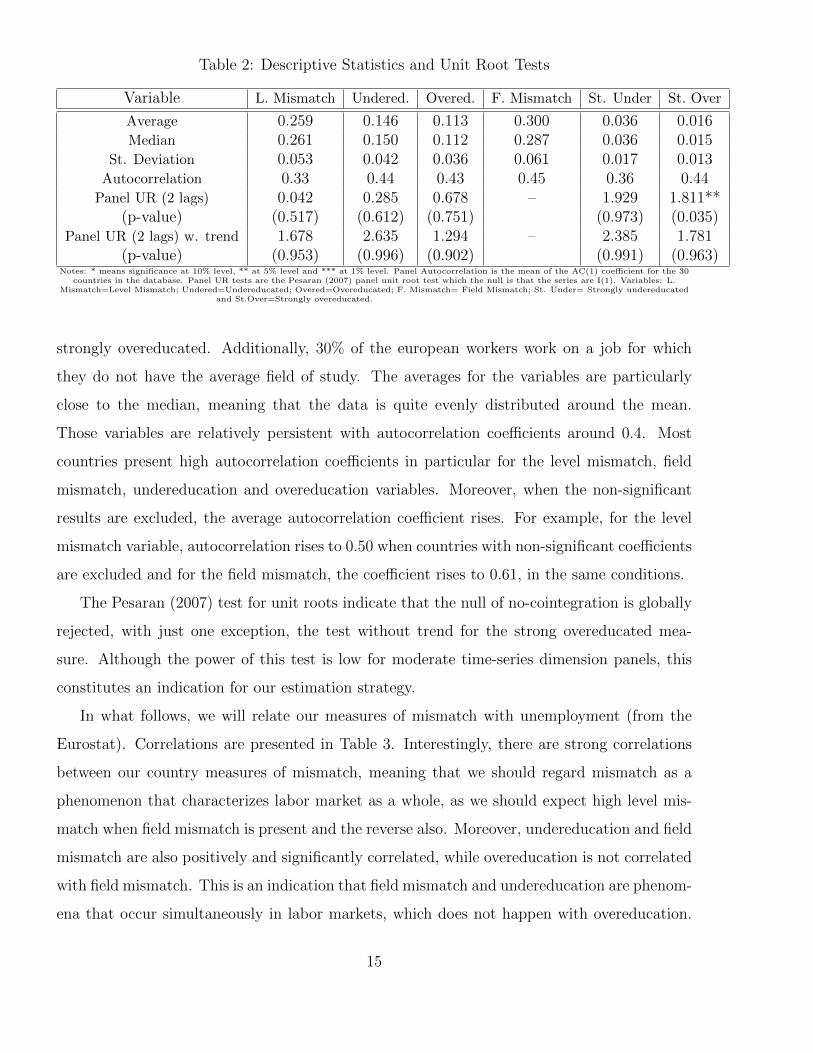
3.3 Mismatch by Sector and Occupation
In the whole database, mismatch is higher in Household production and in Agriculture, forestry
and fishery. There are few sectors with more overeducated workers than undereducated, which
are Agriculture, forestry and fishing (A), Information and Communication (J), Financial and
insurance (K) and Real Estate (L), Administrative and support services (N), Public Adminis-
tration and Defense (O) and Extraterritorial organisations (U). When comparing strong un-
dereducation and strong overeducation, strong undereducation is higher for all the economic
sectors of activity.
When analysed by professions or occupations, mismatch is higher in Agricultural, forestry
and fishery workers, in Elementary occupations, in Services and sales, Technicians and Cleri-
cals. On the contrary, mismatch is lower among Managers and Professionals. Overeducation
is prevalent among Technicians, Clerical, Agricultural, forestry and fishery workers and Un-
dereducated workers prevail on Managers, Professionals, Service and sales, Craft and related
trades, Plant and machine operators and Elementary occupations. Data of mismatch by sector
and occupation are plotted in Figures 5 and 6.
Interestingly, correlations between mismatch by sector and occupations between countries
are low and differ a lot between countries. In Table 1 we present the correlations between each
12
Figure 5: Mismatch in Europe by Sector 2011
Figure 6: Mismatch in Europe by Occupation 2011
country mismatch level and the European level given by the whole dataset obtained for the year
2011. The table shows a great heterogeneity between countries meaning that the distribution
of mismatch proportions between sectors of activity and occupations is quite diverse across
European countries. This picture is reinforced when pairwise correlations are analysed. It
is not even possible to identify groups of countries in which both correlations (sectoral and
occupational) are high or low, nor by income level, geographic proximity or any other criteria.
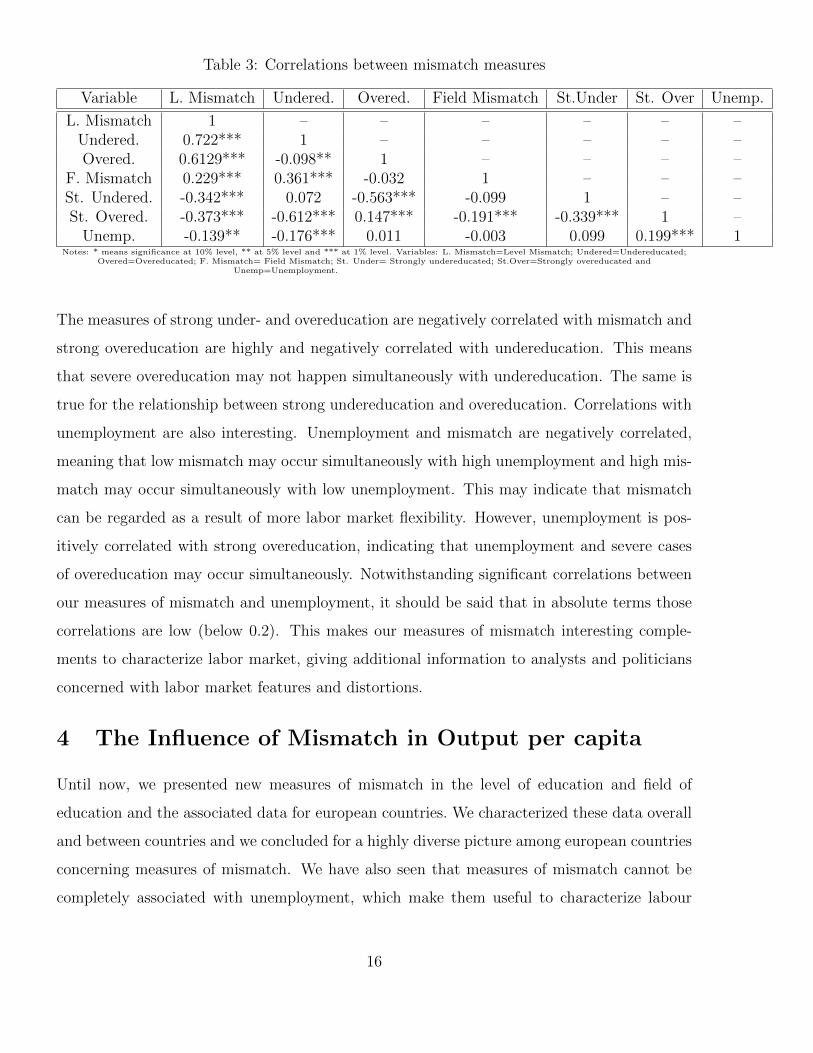
3.4 Descriptive Statistics
In this Section, we will analyse some of the properties of the newly created mismatch series.
Table 2 presents some of the most common statistics. On average, 25% of the european workers
are mismatched, i.e. have quite different levels of education than the average for the profession,
sector and country. From those, more are undereducated (near 15%) and the rest (near 11%)
are overeducated. Strong over and undereducation is low when compared to the total, meaning
that, on average, only 3.6% of european workers are strongly undereducated and 1.6% are
13
Table 1: Sectoral and Occupational Mismatch correlations between Countries and Europe
Country Sectoral Mismatch Occupational Mismatch
Austria 0.20 0.25Belgium 0.23 0.60Bulgaria 0.21 0.12
Panel UR (2 lags) w. trend 1.678 2.635 1.294 – 2.385 1.781(p-value) (0.953) (0.996) (0.902) (0.991) (0.963)
Notes: * means significance at 10% level, ** at 5% level and *** at 1% level. Panel Autocorrelation is the mean of the AC(1) coefficient for the 30countries in the database. Panel UR tests are the Pesaran (2007) panel unit root test which the null is that the series are I(1). Variables: L.
Mismatch=Level Mismatch; Undered=Undereducated; Overed=Overeducated; F. Mismatch= Field Mismatch; St. Under= Strongly undereducatedand St.Over=Strongly overeducated.
strongly overeducated. Additionally, 30% of the european workers work on a job for which
they do not have the average field of study. The averages for the variables are particularly
close to the median, meaning that the data is quite evenly distributed around the mean.
Those variables are relatively persistent with autocorrelation coefficients around 0.4. Most
countries present high autocorrelation coefficients in particular for the level mismatch, field
mismatch, undereducation and overeducation variables. Moreover, when the non-significant
results are excluded, the average autocorrelation coefficient rises. For example, for the level
mismatch variable, autocorrelation rises to 0.50 when countries with non-significant coefficients
are excluded and for the field mismatch, the coefficient rises to 0.61, in the same conditions.
The Pesaran (2007) test for unit roots indicate that the null of no-cointegration is globally
rejected, with just one exception, the test without trend for the strong overeducated mea-
sure. Although the power of this test is low for moderate time-series dimension panels, this
constitutes an indication for our estimation strategy.
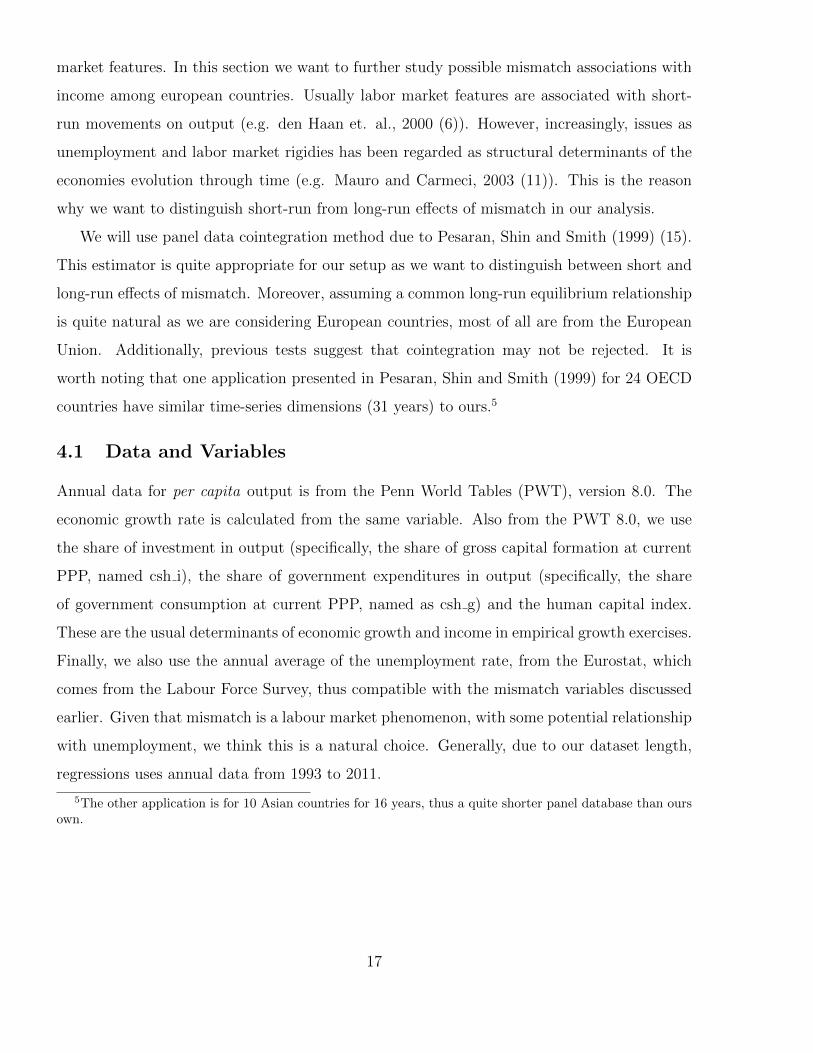
In what follows, we will relate our measures of mismatch with unemployment (from the
Eurostat). Correlations are presented in Table 3. Interestingly, there are strong correlations
between our country measures of mismatch, meaning that we should regard mismatch as a
phenomenon that characterizes labor market as a whole, as we should expect high level mis-
match when field mismatch is present and the reverse also. Moreover, undereducation and field
mismatch are also positively and significantly correlated, while overeducation is not correlated
with field mismatch. This is an indication that field mismatch and undereducation are phenom-
ena that occur simultaneously in labor markets, which does not happen with overeducation.
15
Table 3: Correlations between mismatch measures
Variable L. Mismatch Undered. Overed. Field Mismatch St.Under St. Over Unemp.
Unemp. -0.139** -0.176*** 0.011 -0.003 0.099 0.199*** 1Notes: * means significance at 10% level, ** at 5% level and *** at 1% level. Variables: L. Mismatch=Level Mismatch; Undered=Undereducated;
Overed=Overeducated; F. Mismatch= Field Mismatch; St. Under= Strongly undereducated; St.Over=Strongly overeducated andUnemp=Unemployment.
The measures of strong under- and overeducation are negatively correlated with mismatch and
strong overeducation are highly and negatively correlated with undereducation. This means
that severe overeducation may not happen simultaneously with undereducation. The same is
true for the relationship between strong undereducation and overeducation. Correlations with
unemployment are also interesting. Unemployment and mismatch are negatively correlated,
meaning that low mismatch may occur simultaneously with high unemployment and high mis-
match may occur simultaneously with low unemployment. This may indicate that mismatch
can be regarded as a result of more labor market flexibility. However, unemployment is pos-
itively correlated with strong overeducation, indicating that unemployment and severe cases
of overeducation may occur simultaneously. Notwithstanding significant correlations between
our measures of mismatch and unemployment, it should be said that in absolute terms those
correlations are low (below 0.2). This makes our measures of mismatch interesting comple-
ments to characterize labor market, giving additional information to analysts and politicians
concerned with labor market features and distortions.
4 The Influence of Mismatch in Output per capita
Until now, we presented new measures of mismatch in the level of education and field of
education and the associated data for european countries. We characterized these data overall
and between countries and we concluded for a highly diverse picture among european countries
concerning measures of mismatch. We have also seen that measures of mismatch cannot be
completely associated with unemployment, which make them useful to characterize labour
16
market features. In this section we want to further study possible mismatch associations with
income among european countries. Usually labor market features are associated with short-
run movements on output (e.g. den Haan et. al., 2000 (6)). However, increasingly, issues as
unemployment and labor market rigidies has been regarded as structural determinants of the
economies evolution through time (e.g. Mauro and Carmeci, 2003 (11)). This is the reason
why we want to distinguish short-run from long-run effects of mismatch in our analysis.
We will use panel data cointegration method due to Pesaran, Shin and Smith (1999) (15).
This estimator is quite appropriate for our setup as we want to distinguish between short and
long-run effects of mismatch. Moreover, assuming a common long-run equilibrium relationship
is quite natural as we are considering European countries, most of all are from the European
Union. Additionally, previous tests suggest that cointegration may not be rejected. It is
worth noting that one application presented in Pesaran, Shin and Smith (1999) for 24 OECD
countries have similar time-series dimensions (31 years) to ours.5
4.1 Data and Variables
Annual data for per capita output is from the Penn World Tables (PWT), version 8.0. The
economic growth rate is calculated from the same variable. Also from the PWT 8.0, we use
the share of investment in output (specifically, the share of gross capital formation at current
PPP, named csh i), the share of government expenditures in output (specifically, the share
of government consumption at current PPP, named as csh g) and the human capital index.
These are the usual determinants of economic growth and income in empirical growth exercises.
Finally, we also use the annual average of the unemployment rate, from the Eurostat, which
comes from the Labour Force Survey, thus compatible with the mismatch variables discussed
earlier. Given that mismatch is a labour market phenomenon, with some potential relationship
with unemployment, we think this is a natural choice. Generally, due to our dataset length,
regressions uses annual data from 1993 to 2011.
5The other application is for 10 Asian countries for 16 years, thus a quite shorter panel database than oursown.
17
4.2 Results
We divide the results in two main sets. One in which each type of mismatch is entered (as
a one lagged level) as the only variable in regressions for the differences in the log of per
capita output (regression results shown in Table 4). From the 30 countries outlined before,
only Malta do not have sufficient time-series data to enter in regressions. Another, in which
there are other regressors than mismatch explaining economic growth (or the difference in the
log of per capita output), which regression results are shown in Table 5. In this case, besides
Malta, also Switzerland is excluded due to missing unemployment data. In this analysis, we
exclude the field mismatch from the set of mismatch measures entering the regressions due
to its quite lower time-series dimension, which would greatly decrease the degrees of freedom.
One common result is the strong and negative sign for the error correction term which confirms
the existence of a long-run cointegrating relationship between the variables in each regressions,
which also validates our approach.
As can be observed from the results in Table 4, there is a significant and negative effect
of level mismatch on the business cycle (i.e. in the evolution of per capita output in the
short-run) and a positive effect of field mismatch on economic growth. An increase in the
proportion of level mismatched workers in 1 percentage point (e.g. from 20% to 21%) would
decrease economic growth in 0.427 percentage points, a quantitative meaningful effect. On the
contrary a similar increase in field mismatch would increase growth in am almost similar 0.431
percentage points. On what other measures of mismatch are concerned, there is only noted
a significantly negative effect of undereducation. There is also only one significant results of
mismatch on the long-run relationship, which is a negative effect of strong undereducation.
Results on Table 5, which include a set of another variables usually regarded as determi-
nants of the evolution of per capita GDP (both in the short and in the long-run), the negative
and robust effect of mismatch in the short-run is confirmed. However there is a difference in the
origin of this negative effect when other regressors are considered (when compared with results
in Table 4). In fact, only overeducation and strong overeducation are now significantly related
to the short run evolution of output (with a negative sign) and undereducation appeared with a
non-significant sign. Quantitatively the effect of overall mismatch decreases. Now, an increase
in 1 percentage point in the proportion of mismatched workers imply a decrease in only 0.29
18
percentage points in the growth of per capita output. However, when dissected to analyse the
effect of overeducation the effect is now much greater. An increase in overeducated workers in 1
percentage point would decrease growth in 0.82 and a similar increase in strongly overeducated
workers would decrease growth in more than 2 percentage points. We may now analyse the
effects of other variables in the regression. Long-run effects are detected only due to human
capital, confirming the positive effect of this variable also found in several empirical research
until now. In fact this variable have sizeable effects in long-run growth in most specifications.
In what short-run effects are concerned and besides the already analysed effect of mismatch,
we found significantly positive effects of human capital, significantly negative effects of gov-
ernment consumption. The effect of human capital in the short-run, although somewhat lower
than the effect of this same variable on the long-run, is interesting, as human capital is usuallu
regarded as a long-run determinant of growth. The negative effect of government consump-
tion is quite well founded in macroeconomic theory, both in the short and in the long-run.
There are two unexpected results on our empirical application. The significant positive effect
of unemployment in the short-run and the non-significant effect of the investment share both
in the short and in the long-run. Interestingly, the exclusion of the government share from the
regressions would yield positive and significant results for the investment share, suggesting a
crowding-out effect of government consumption. It should also be noted that the fact that our
sample only includes developed countries may also imply a small effect of investment even in
the long-run. The positive effect of unemployment, much stronger in the short than in the
long-run, may be linked with a positive effect of more flexible labor markets on the economy, a
hypothesis that deserves further testing. More important than this is the fact that the several
changes to this specification (excluding government share, excluding unemployment) does not
change the significant and negative signs of the mismatch and overeducation coefficients.
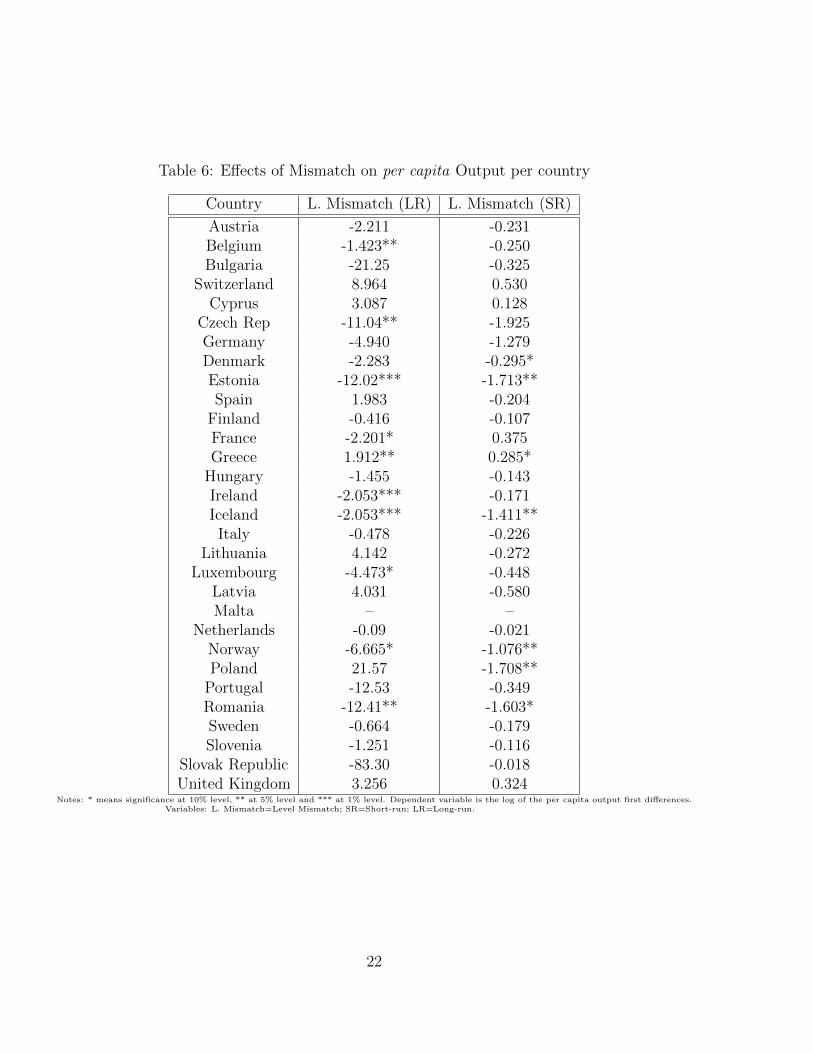
4.3 Country Effects
One advantage of using heterogeneous panel data estimators, such as the mean group estimator
we used, is that we can study the effects in each country and compare them. Table 6 shows the
results, based on full results from the simpler regressions presented in Table 4, with the global
measure of mismatch. Results obtained using other measures of mismatched are discussed in
the text. It is possible to present results by country recurring to the regressions presented in
19
Table 4: Pooled Mean Group Estimator
Mismatch Variable L. Mismatch Undered. Overed. F. Mismatch St. Under St. Over
Notes: * means significance at 10% level, ** at 5% level and *** at 1% level. Dependent variable is the log of the per capita output first differences.Variables: L. Mismatch=Level Mismatch; Undered=Undereducated; Overed=Overeducated; F. Mismatch= Field Mismatch; St. Under= Strongly
undereducated and St.Over=Strongly overeducated.
Table 5. However, the aim here is to maximize the time series available by country and the
number of countries with available data.6 As expected, negative signs indicating a negative
effect of mismatch on output per capita are abundant. Significant long-run results appear
on Belgium, Czech Republic, Estonia, France, Ireland, Iceland, Luxembourg, Norway and
Notes: * means significance at 10% level, ** at 5% level and *** at 1% level. Dependent variable is the log of the per capita output first differences.Variables: L. Mismatch=Level Mismatch; Undered=Undereducated; Overed=Overeducated; F. Mismatch= Field Mismatch; St. Under= Strongly
undereducated and St.Over=Strongly overeducated.
21
Table 6: Effects of Mismatch on per capita Output per country
Country L. Mismatch (LR) L. Mismatch (SR)
Austria -2.211 -0.231Belgium -1.423** -0.250Bulgaria -21.25 -0.325
Notes: * means significance at 10% level, ** at 5% level and *** at 1% level. Dependent variable is the log of the per capita output first differences.Variables: L. Mismatch=Level Mismatch; SR=Short-run; LR=Long-run.
22
approximately 20 years, between 1993 and 2011. We also provide a measure of field mismatch
for the same 30 countries for a period of 8 years. Finally, we relate the constructed measures
with the evolution of output per capita both in the short and in the long-run.
From 15% to near 35% of European workers have a job for which they have more (or less)
qualifications than the usual level, depending on the country. From 25% to nearly 50% work
in a job for which they do not have the usual field qualification. There is a great difference
in mismatch among European labour markets. Undereducation affects more workers than
overeducation in most European countries. Among sectors of activity, Agriculture, forestry
and fishery and Household production are the ones in which there is the highest proportion of
mismatch. Among occupations, there is also among Agricultural, forestry and fishery workers
that mismatch is higher. However, this also differs a lot among European countries. Correla-
tions between the newly created mismatch measures between them and with unemployment
suggest that those mismatch measures give additional and relevant information about labour
market in European countries.
We study the influence of the different measures of mismatch on the evolution of per capita
output both in the short and the long-run. Notwithstanding with very different mismatch
features in different European labour markets, we have found a robust negative effect of mis-
match on the short-run evolution of per capita output in Europe, an effect that is robust to
the introduction of usual predictors of business cycles and growth.
The presentation of new and comparable mismatch measures for European countries opens
a wide avenue of empirical research on the features of European labor markets while the data
presented here highlights the low integration of labour markets in Europe and a significant
workers who are mismatched in what level and field of education are concerned. Furthermore,
the negative effects of mismatch we found on the short-run evolution of the economy may call
the attention of politicians to the importance building an incentive scheme to adequate the
supply of human capital to its demand.
23
References
[1] Biagetti, M. and Scicchitano, S (2011) Education and Wage Inequality in Europe. Eco-
nomics Bulletin, Vol. 31(3): 2620-2628.
[2] Bond, S. and Eberhardt, M. (2009) Cross-section dependence in nonstationary panel mod-
els: a novel estimator. Paper prepared for the Nordic Econometrics Meeting in Lund, Swe-
den, 29–31 October.
[3] Budrıa, S. and Moro-Egido, A. (2008) Education, educational mismatch, and wage inequal-
ity: Evidence for Spain. Economics of Education Review, 27: 332-341.
tests for cointegrated panels. Manchester School, 76(5): 504–527.
[5] Coelho, H.M., Soares, L.M., and Feliz, M.I.B. (1982) Os Nıveis de Qualificacao na Con-
tratacao Colectiva, Sua Aplicacao a Algumas Empresas Publicas do Sector dos Transportes
e Comunicacoes, Ministerio do Trabalho
[6] den Haan, W., Ramey, G. and Watson, J. (2000). Job Destruction and Propagation of
Shocks,American Economic Review, 90(3): 482-98.
[7] Glocker, D. and Steiner, V. (2011). Returns to Education Across Europe. CEPR Discussion
Paper Series No.8568
[8] Hartog, J. (2000) Over-education and earnings: where are we, where should we go? Eco-
nomics of Education Review, 19: 131-147.
[9] Kiker, B.F., Santos, M.C (1991) Human capital and earnings in Portugal. Economics of
Education Review, 10(3): 187-203.
[10] Kiker, B.F., Santos, M.C., and Mendes de Oliveira, M. (1997) Overeducation and Under-
education: Evidence for Portugal. Economics of Education Review, 16 (2): 111-125.
[11] Mauro, L. and Carmeci, G. (2003). Long run growth and investment in education: Does
unemployment matter?, Journal of Macroeconomics, 25(1): 123-137.
24
[12] Mendes de Oliveira, M., Santos, M.C., and Kiker, B.F. (2000) The role of human capital
and technological change in overeducation. Economics of Education Review, 19: 199-206.
[13] Ordine, P. and Rose, G. (2011) Educational Mismatch and Wait Unemployment. Alma
Laurea Working Papers 19.
[14] Pesaran, M.H. (2007) A simple panel unit root test in the presence of cross-section de-
pendence. Journal of Applied Econometrics, 22(2): 265–312.
[15] Pesaran, M.H., Shin, Y. and Smith, R. (2009) Pooled mean group estimation of dynamic
heterogeneous panels. Journal of the American Statistical Association, 94(446): 621-634.
[16] Sloane, P. (2002) Much ado about nothing? What does the over-education literature
really tell us? Keynote address, International Conference on Over-education in Europe.
25
A Appendix
HATLEVEL Definition Years of Schooling0 No formal education or below ISCED 1 010 ISCED 0-1 (pre-primary education) 111 ISCED 1 (primary education or first stage of basic education) 521 ISCED 2 (Lower secondary education or first stage of basic education) 822 ISCED 3 (upper secondary education; access to labour market)-shorter than 2 years 1031 ISCED 3c (2 years and more) 1332 ISCED 3a,b (upper secondary education providing access to level 5) 1330 ISCED 3 (without distinction a,b, or c possible, 2 years +) 1333 ISCED 3c (3 years or longer) or ISCED 4c 1334 ISCED 3b or ISCED 4b 1335 ISCED 3a or ISCED 4a 1336 ISCED 3 or 4 (without distinction a, b or c possible) 1341 ISCED 4a, b (post secondary, non-tertiary education giving access to level 5) 1442 ISCED 4c 1443 ISCED 4 (without distinction a, b or c possible) 1451 ISCED 5b (first stage of tertiary education; provides access to an occupation) 1752 ISCED 5b (first stage of tertiary education theorectically based; provides access to research programmes) 1760 ISCED 6 (second stage of tertiary education, leading to advanced research qualification) 19
HATFIELD Definition0 General Programmes
100 Teacher training and education science
200 Humanities, languages and arts
222 Foreign Languages
300 Social sciences, businesses and law
400 Science, mathematics and computing
420 Life sciences (including biology and environmental science)
440 Physical science (including Physics, Chemistry and earth science)