MEASURING LOCAL CRYSTALLIZATION FOULING IN A DOUBLE-PIPE HEAT EXCHANGER F. Schlüter 1 , L. Schnöing 1 , H. Zettler 2 , W. Augustin 1 and S. Scholl 1 1 Technische Universität Braunschweig, Institute for Chemical and Thermal Process Engineering, Langer Kamp 7, 38106 Braunschweig, Germany E-mail: [email protected]2 Heat Transfer Research, Inc. (HTRI), 150 Venture Drive, College Station, TX 77845 ABSTRACT Although fouling is a problem varying in space and time, sizing and assessment of a process apparatus is almost always based on one single integral fouling resistance value. Furthermore, the integral fluid dynamic behavior, e.g. the development of time-dependent pressure drop in a heat exchanger, can be influenced by local constrictions. While it is generally possible to determine the time dependency of the integral fouling behavior, local differences are not taken into consideration at present. Therefore, this paper introduces a metrological, an incremental and a segmental approach to study the local development of crystallization fouling by CaSO4 in a countercurrent double-pipe heat exchanger. The consecutive approaches allow for thermal, volumetric, gravimetric and optical fouling investigations, aiming to examine the axial distribution of deposit as well as local differences in the deposit morphology. All methods provided congruent results and local fouling could be described properly. An almost clean surface at the colder end of the heat exchanger and an exponential increase of deposit thickness was observed towards the hot end. Hence, the section near to the hot water inlet turned out to be a key area with regards to increasing fouling mass and structural changes of the layer. INTRODUCTION Fouling describes unwanted deposits formed on heat transfer surfaces and is a major challenge for industry. Therefore, fouling has been a subject to scientific investigations for decades (Müller-Steinhagen, 2011). The literature provides many works on the investigation of time- dependent integral behavior of crystallization fouling with respect to various scientific issues (Bohnet and Augustin, 1993; Krause, 1993; Augustin and Bohnet, 1995; Helalizadeh et al., 2000; Müller-Steinhagen et al., 2000; Zettler et al., 2005; Al-Janabi et al., 2009; Pääkkönen et al., 2012), but only a few have been published on the local distribution of fouling. Fahiminia et al. (2007) equipped an electrically heated tube section length of 770 mm with ten thermocouples to investigate local initial fouling rates of CaSO4. The tube was subsequently cut into segments 20 mm long to allow for optical investigation and examining the deposit coverage by means of mass, layer thickness and morphology. An increasing amount of non-homogeneous fouling deposit was found as the wall temperatures increased. Local crystallization fouling of CaSO4 was investigated in double-pipe heat exchangers of 2000 mm length heated by water in countercurrent flow (Albert et al., 2011). A borescope was used for visual examination of deposits at several axial positions along the inner heat exchanger tubes. This revealed an increasing surface area covered with deposit towards the hot heat exchanger end. Following a fouling experiment, photographs of tube inlet and outlet were analyzed resulting in the assumption of an idealized linear increase of the fouling distribution between those axial positions. Furthermore, a volumetric method by means of a water displacement test was applied to identify the flow cross section constricted by deposit at the tube outlet. Goedecke et al. (2016) equipped the heat exchanger test sections of the same test rig with five thermocouples at different axial positions, evenly spaced along the tube length. The local fouling curves obtained confirmed the increase in the amount of deposit in the direction of hot wall temperatures, see Fig. 1. Fig. 1 Local fouling resistances over time for a stainless steel heat exchanger tube of 2000 mm length (adapted from Goedecke et al., 2016); x is the distance from inlet. Building on these promising insights, the present work continues the investigations of local fouling behavior. Therefore, methods already applied in the past are combined and partly extended by precise local examinations. Heat Exchanger Fouling and Cleaning – 2017 ISBN: 978-0-9984188-0-3; Published online www.heatexchanger-fouling.com 75
Transcript
MEASURING LOCAL CRYSTALLIZATION FOULING
IN A DOUBLE-PIPE HEAT EXCHANGER
F. Schlüter1, L. Schnöing1, H. Zettler2, W. Augustin1 and S. Scholl1
1 Technische Universität Braunschweig, Institute for Chemical and Thermal Process Engineering,
Langer Kamp 7, 38106 Braunschweig, Germany
E-mail: [email protected] 2 Heat Transfer Research, Inc. (HTRI), 150 Venture Drive, College Station, TX 77845
ABSTRACT
Although fouling is a problem varying in space and time,
sizing and assessment of a process apparatus is almost always
based on one single integral fouling resistance value.
Furthermore, the integral fluid dynamic behavior, e.g. the
development of time-dependent pressure drop in a heat
exchanger, can be influenced by local constrictions. While it
is generally possible to determine the time dependency of the
integral fouling behavior, local differences are not taken into
consideration at present. Therefore, this paper introduces a
metrological, an incremental and a segmental approach to
study the local development of crystallization fouling by
CaSO4 in a countercurrent double-pipe heat exchanger. The
consecutive approaches allow for thermal, volumetric,
gravimetric and optical fouling investigations, aiming to
examine the axial distribution of deposit as well as local
differences in the deposit morphology. All methods provided
congruent results and local fouling could be described
properly. An almost clean surface at the colder end of the heat
exchanger and an exponential increase of deposit thickness
was observed towards the hot end. Hence, the section near to
the hot water inlet turned out to be a key area with regards to
increasing fouling mass and structural changes of the layer.
INTRODUCTION
Fouling describes unwanted deposits formed on heat
transfer surfaces and is a major challenge for industry.
Therefore, fouling has been a subject to scientific
investigations for decades (Müller-Steinhagen, 2011). The
literature provides many works on the investigation of time-
dependent integral behavior of crystallization fouling with
respect to various scientific issues (Bohnet and Augustin,
1993; Krause, 1993; Augustin and Bohnet, 1995;
Helalizadeh et al., 2000; Müller-Steinhagen et al., 2000;
Zettler et al., 2005; Al-Janabi et al., 2009; Pääkkönen et al.,
2012), but only a few have been published on the local
distribution of fouling.
Fahiminia et al. (2007) equipped an electrically heated
tube section length of 770 mm with ten thermocouples to
investigate local initial fouling rates of CaSO4. The tube was
subsequently cut into segments 20 mm long to allow for
optical investigation and examining the deposit coverage by
means of mass, layer thickness and morphology. An
increasing amount of non-homogeneous fouling deposit was
found as the wall temperatures increased.
Local crystallization fouling of CaSO4 was investigated
in double-pipe heat exchangers of 2000 mm length heated by
water in countercurrent flow (Albert et al., 2011). A
borescope was used for visual examination of deposits at
several axial positions along the inner heat exchanger tubes.
This revealed an increasing surface area covered with deposit
towards the hot heat exchanger end. Following a fouling
experiment, photographs of tube inlet and outlet were
analyzed resulting in the assumption of an idealized linear
increase of the fouling distribution between those axial
positions. Furthermore, a volumetric method by means of a
water displacement test was applied to identify the flow cross
section constricted by deposit at the tube outlet.
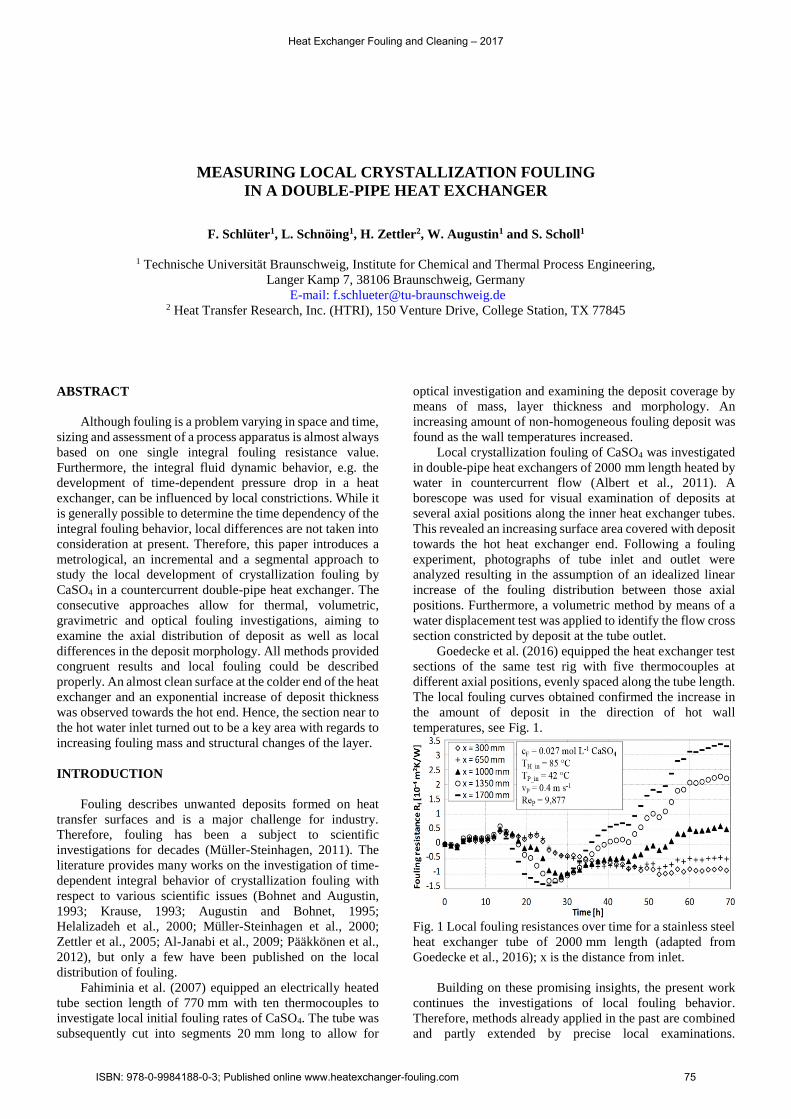
Goedecke et al. (2016) equipped the heat exchanger test
sections of the same test rig with five thermocouples at
different axial positions, evenly spaced along the tube length.
The local fouling curves obtained confirmed the increase in
the amount of deposit in the direction of hot wall
temperatures, see Fig. 1.
Fig. 1 Local fouling resistances over time for a stainless steel
heat exchanger tube of 2000 mm length (adapted from
Goedecke et al., 2016); x is the distance from inlet.
Building on these promising insights, the present work
continues the investigations of local fouling behavior.
Therefore, methods already applied in the past are combined
and partly extended by precise local examinations.
Heat Exchanger Fouling and Cleaning – 2017
ISBN: 978-0-9984188-0-3; Published online www.heatexchanger-fouling.com 75
Furthermore, the applicability of a novel approach, using a
fiber optic system for estimating local thermal fouling
resistances is demonstrated. This comprehensive approach
aspires to gain knowledge about the axial distribution of
fouling layers developing in a countercurrent heat exchanger
as well as the effects on the overall heat transfer.
EXPERIMENTAL PROCEDURE
Fouling experiments
Experiments with an aqueous CaSO4 solution were
carried out in the fouling test rig shown in Fig. 2.
Fig. 2 Fouling test rig equipped with two double-pipe heat
exchangers, a heating circuit and a product circuit.
The core components of the experimental setup are two
stainless steel double-pipe heat exchangers (HX2, HX3) of
identical design. Two fluid streams pass through the test
sections in counterflow with hot water on shell side and the
product solution (deionized water with 0.027 mol L-1 CaSO4)
on the tube side. The product is provided in tank T1 with a
volume of 50 L and separated in two mass flows
downstream. Centrifugal pumps P1 and P2 (KSB, Movitec
VF 2/6 and VF 2/4) pump the solution with a constant inlet
temperature of 42 °C through the inner pipes
(20 x 2 x 2000 mm) of the heat exchangers. The two flows
join and are cooled by plate frame heat exchanger HX1 (GEA
Ecoflex, Ecoflex VT04) to 42 °C using water from an on-site
cooling water circle before the flow enters tank T1. Flow is
measured with inductive flow meters (Krohne, OPTIFLUX
1100 C) and controlled by throttle valves and additional
bypasses. Fouling experiments were conducted with flow
velocities of 1.0 and 1.5 m s-1 (ReP = 25,500 and 38,200).
Temperatures were measured with type K thermocouples at
the inlets and outlets of both test sections and at several local
measuring points along the wall of the inner tube. The
pressure drop over heat exchanger length was measured by
differential pressure sensors (Honeywell, FDW2JG). All
materials in contact with the product fluid are made of glass
or stainless steel.
Tank T2 is equipped with two electrical heaters (ISA
Heinrich Industrietechnik, IST/9 and IST/4) with a total
controllable heating power of 13 kW and provides 150 L of
hot water at 80 °C. The centrifugal pump P3 (KSB, Movitec
VF 2/6) circulates the water with vs = 0.25 m s-1
(Res = 20,700) through the test rig.
The plant was cleaned prior to every fouling test with
deionized water at different flow velocities, followed by a
cleaning solution with 2 wt% acetic acid for at least 12 hours.
Several consecutive water cleaning treatments were
performed until the water’s electrical conductivity matched
the conductivity of pure deionized water.
Metrological approach
Integral and local fouling resistances were extracted as
indicators for the fouling situation. The integral thermal
fouling resistance of both heat exchangers is based on
temperature measurements of the in- and outlet streams and
quantifies the change in the overall heat transfer resistance at
soiled (1
𝑘𝑓) and clean (
1
𝑘0) state according to Eq. (1).
𝑅𝑓,𝑖𝑛𝑡 =1
𝑘𝑓(𝑡)−
1
𝑘0 (1)
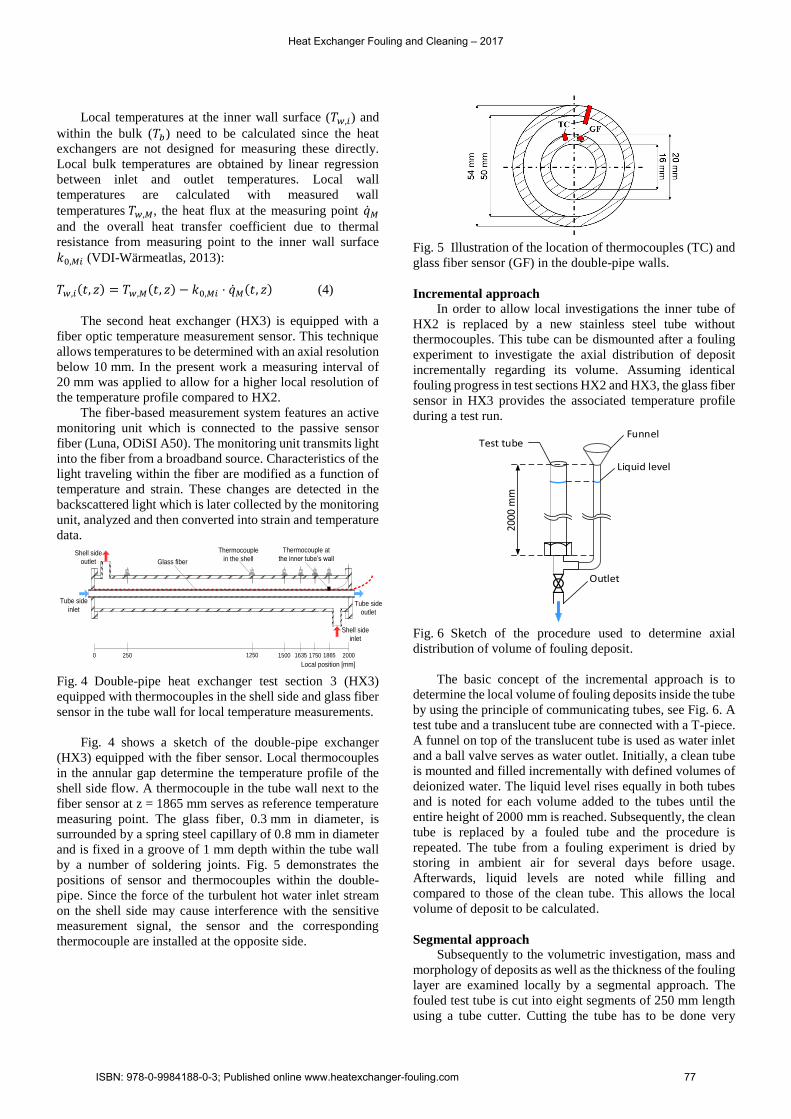
In order to investigate the fouling situation locally by
determining local fouling resistances, two different
techniques are applied in the present work. One of the test
sections (HX2) is equipped with seven thermocouples
located along the annular clearance between the inner and
outer tube to measure shell side temperatures, see Fig. 3.
Furthermore, six thermocouples are located in bores of 1 mm
depth in the inner tube wall and fixed by soldering joints to
measure wall temperatures. The nonuniform distribution of
thermocouples was selected to give better resolution of
temperatures in the downstream section of the tube where the
highest amount of fouling deposit is expected due to the
countercurrent flow arrangement of the heat exchanger.
Fig. 3 Double-pipe heat exchanger test section 2 (HX2)
equipped with thermocouples at several axial positions on the
shell side and in the tube wall for local temperature
measurements.
For quantifying thermal fouling resistances locally,
Eq. (1) is written as:
𝑅𝑓,𝑙𝑜𝑐 =1
𝑘𝑓(𝑡,𝑧)−
1
𝑘0(𝑧) (2)
The local overall heat transfer coefficients are calculated
based on the temperature difference between the inner wall
surface of the test tube and the bulk of the product stream.
Furthermore, the heat flux at the inner wall surface is used:
𝑘𝑓(𝑡, 𝑧) = �̇�𝑖(𝑡,𝑧)
𝑇𝑤,𝑖(𝑡,𝑧)−𝑇𝑏(𝑡,𝑧) (3)
HX3
P1
M
T2
HX2
T1
P3
P2
HX1
TIR
FIR FIR
TIC
FIRC
FIRC
PDIR
PDIR
LLZ
TIRTIR
TIR TIR TIR TIR TIR TIR
TIR TIR
TIR TIRTIR TIR TIR TIR TIR
TIRTIRTIRTIRTIRTIR
TIRTIR
TIR
TIR
TIR
F
F
250 750 1250 15000 2000Local position [mm]
Tube side inlet
Tube side outlet
Shell side outlet
Shell side inlet
1635 1750
Thermocouple in the shell
Thermocouple at the inner tube’s wall
1865
Heat Exchanger Fouling and Cleaning – 2017
ISBN: 978-0-9984188-0-3; Published online www.heatexchanger-fouling.com 76
Local temperatures at the inner wall surface (𝑇𝑤,𝑖) and
within the bulk (𝑇𝑏) need to be calculated since the heat
exchangers are not designed for measuring these directly.
Local bulk temperatures are obtained by linear regression
between inlet and outlet temperatures. Local wall
temperatures are calculated with measured wall
temperatures 𝑇𝑤,𝑀, the heat flux at the measuring point �̇�𝑀
and the overall heat transfer coefficient due to thermal
resistance from measuring point to the inner wall surface
𝑘0,𝑀𝑖 (VDI-Wärmeatlas, 2013):
𝑇𝑤,𝑖(𝑡, 𝑧) = 𝑇𝑤,𝑀(𝑡, 𝑧) − 𝑘0,𝑀𝑖 ⋅ �̇�𝑀(𝑡, 𝑧) (4)
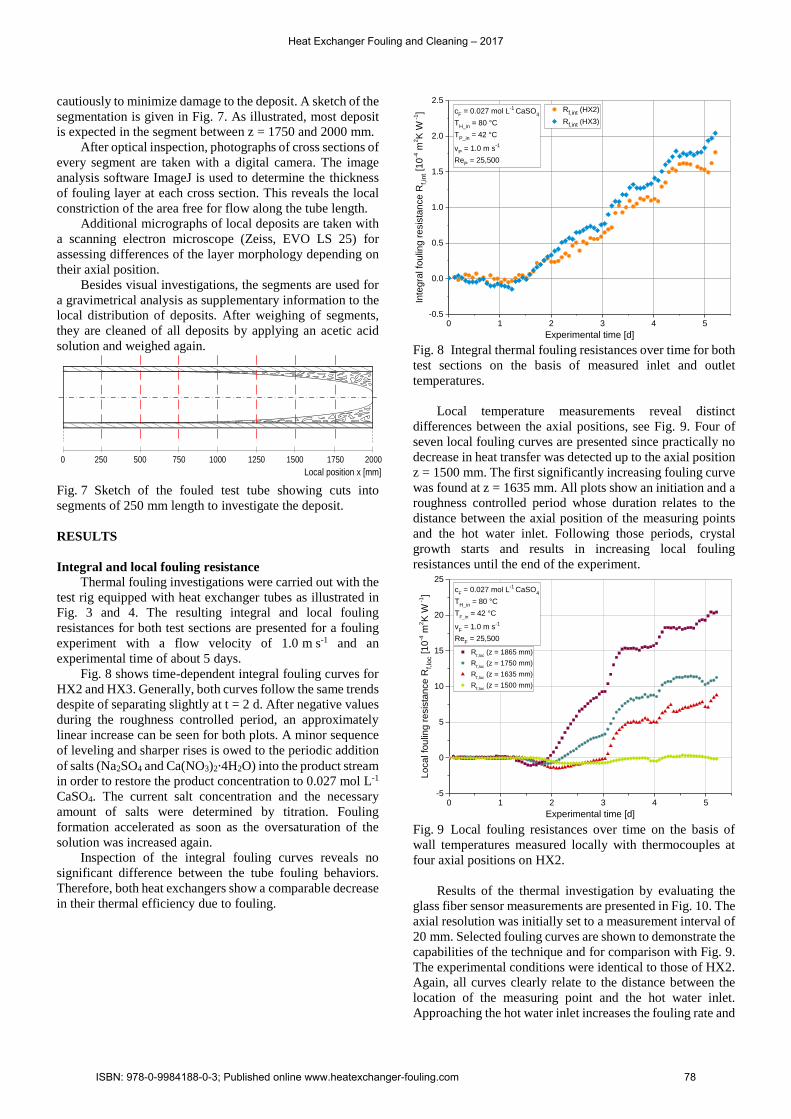
The second heat exchanger (HX3) is equipped with a
fiber optic temperature measurement sensor. This technique
allows temperatures to be determined with an axial resolution
below 10 mm. In the present work a measuring interval of
20 mm was applied to allow for a higher local resolution of
the temperature profile compared to HX2.
The fiber-based measurement system features an active
monitoring unit which is connected to the passive sensor
fiber (Luna, ODiSI A50). The monitoring unit transmits light
into the fiber from a broadband source. Characteristics of the
light traveling within the fiber are modified as a function of
temperature and strain. These changes are detected in the
backscattered light which is later collected by the monitoring
unit, analyzed and then converted into strain and temperature
data.
Fig. 4 Double-pipe heat exchanger test section 3 (HX3)
equipped with thermocouples in the shell side and glass fiber
sensor in the tube wall for local temperature measurements.
Fig. 4 shows a sketch of the double-pipe exchanger
(HX3) equipped with the fiber sensor. Local thermocouples
in the annular gap determine the temperature profile of the
shell side flow. A thermocouple in the tube wall next to the
fiber sensor at z = 1865 mm serves as reference temperature
measuring point. The glass fiber, 0.3 mm in diameter, is
surrounded by a spring steel capillary of 0.8 mm in diameter
and is fixed in a groove of 1 mm depth within the tube wall
by a number of soldering joints. Fig. 5 demonstrates the
positions of sensor and thermocouples within the double-
pipe. Since the force of the turbulent hot water inlet stream
on the shell side may cause interference with the sensitive
measurement signal, the sensor and the corresponding
thermocouple are installed at the opposite side.
Fig. 5 Illustration of the location of thermocouples (TC) and
glass fiber sensor (GF) in the double-pipe walls.
Incremental approach
In order to allow local investigations the inner tube of
HX2 is replaced by a new stainless steel tube without
thermocouples. This tube can be dismounted after a fouling
experiment to investigate the axial distribution of deposit
incrementally regarding its volume. Assuming identical
fouling progress in test sections HX2 and HX3, the glass fiber
sensor in HX3 provides the associated temperature profile
during a test run.
Fig. 6 Sketch of the procedure used to determine axial
distribution of volume of fouling deposit.
The basic concept of the incremental approach is to
determine the local volume of fouling deposits inside the tube
by using the principle of communicating tubes, see Fig. 6. A
test tube and a translucent tube are connected with a T-piece.
A funnel on top of the translucent tube is used as water inlet
and a ball valve serves as water outlet. Initially, a clean tube
is mounted and filled incrementally with defined volumes of
deionized water. The liquid level rises equally in both tubes
and is noted for each volume added to the tubes until the
entire height of 2000 mm is reached. Subsequently, the clean
tube is replaced by a fouled tube and the procedure is
repeated. The tube from a fouling experiment is dried by
storing in ambient air for several days before usage.
Afterwards, liquid levels are noted while filling and
compared to those of the clean tube. This allows the local
volume of deposit to be calculated.
Segmental approach
Subsequently to the volumetric investigation, mass and
morphology of deposits as well as the thickness of the fouling
layer are examined locally by a segmental approach. The
fouled test tube is cut into eight segments of 250 mm length
using a tube cutter. Cutting the tube has to be done very
250 1250 15000 2000Local position [mm]
1635 1750 1865
Glass fiberShell side
outlet
Tube side inlet
Tube side outlet
Shell side inlet
Thermocouple at the inner tube’s wall
Thermocouple in the shell
2000
mm
Test tubeFunnel
Liquid level
Outlet
Heat Exchanger Fouling and Cleaning – 2017
ISBN: 978-0-9984188-0-3; Published online www.heatexchanger-fouling.com 77
cautiously to minimize damage to the deposit. A sketch of the
segmentation is given in Fig. 7. As illustrated, most deposit
is expected in the segment between z = 1750 and 2000 mm.
After optical inspection, photographs of cross sections of
every segment are taken with a digital camera. The image
analysis software ImageJ is used to determine the thickness
of fouling layer at each cross section. This reveals the local
constriction of the area free for flow along the tube length.
Additional micrographs of local deposits are taken with
a scanning electron microscope (Zeiss, EVO LS 25) for
assessing differences of the layer morphology depending on
their axial position.
Besides visual investigations, the segments are used for
a gravimetrical analysis as supplementary information to the
local distribution of deposits. After weighing of segments,
they are cleaned of all deposits by applying an acetic acid
solution and weighed again.
Fig. 7 Sketch of the fouled test tube showing cuts into
segments of 250 mm length to investigate the deposit.
RESULTS
Integral and local fouling resistance
Thermal fouling investigations were carried out with the
test rig equipped with heat exchanger tubes as illustrated in
Fig. 3 and 4. The resulting integral and local fouling
resistances for both test sections are presented for a fouling
experiment with a flow velocity of 1.0 m s-1 and an
experimental time of about 5 days.
Fig. 8 shows time-dependent integral fouling curves for
HX2 and HX3. Generally, both curves follow the same trends
despite of separating slightly at t = 2 d. After negative values
during the roughness controlled period, an approximately
linear increase can be seen for both plots. A minor sequence
of leveling and sharper rises is owed to the periodic addition
of salts (Na2SO4 and Ca(NO3)2∙4H2O) into the product stream
in order to restore the product concentration to 0.027 mol L-1
CaSO4. The current salt concentration and the necessary
amount of salts were determined by titration. Fouling
formation accelerated as soon as the oversaturation of the
solution was increased again.
Inspection of the integral fouling curves reveals no
significant difference between the tube fouling behaviors.
Therefore, both heat exchangers show a comparable decrease
in their thermal efficiency due to fouling.
Fig. 8 Integral thermal fouling resistances over time for both
test sections on the basis of measured inlet and outlet
temperatures.
Local temperature measurements reveal distinct
differences between the axial positions, see Fig. 9. Four of
seven local fouling curves are presented since practically no
decrease in heat transfer was detected up to the axial position
z = 1500 mm. The first significantly increasing fouling curve
was found at z = 1635 mm. All plots show an initiation and a
roughness controlled period whose duration relates to the
distance between the axial position of the measuring points
and the hot water inlet. Following those periods, crystal
growth starts and results in increasing local fouling
resistances until the end of the experiment.
Fig. 9 Local fouling resistances over time on the basis of
wall temperatures measured locally with thermocouples at
four axial positions on HX2.
Results of the thermal investigation by evaluating the
glass fiber sensor measurements are presented in Fig. 10. The
axial resolution was initially set to a measurement interval of
20 mm. Selected fouling curves are shown to demonstrate the
capabilities of the technique and for comparison with Fig. 9.
The experimental conditions were identical to those of HX2.
Again, all curves clearly relate to the distance between the
location of the measuring point and the hot water inlet.
Approaching the hot water inlet increases the fouling rate and
0 250 500 750 1000 1250 1500 1750 2000 Local position x [mm]
0 1 2 3 4 5-0.5
0.0
0.5
1.0
1.5
2.0
2.5
Inte
gral
foul
ing
resi
stan
ce R
f,int
[10-4
m2 K
W -1
]
Experimental time [d]
Rf,int (HX2)Rf,int (HX3)
cF = 0.027 mol L-1 CaSO4
TH_in = 80 °CTP_in = 42 °C
vP = 1.0 m s-1
ReP = 25,500
0 1 2 3 4 5-5
0
5
10
15
20
25
Rf,loc (z = 1865 mm)Rf,loc (z = 1750 mm)Rf,loc (z = 1635 mm)Rf,loc (z = 1500 mm)
Loca
l fou
ling
resi
stan
ce R
f,loc
[10-4
m2 K
W -1
]
Experimental time [d]
cF = 0.027 mol L-1 CaSO4
TH_in = 80 °CTF_in = 42 °C
vF = 1.0 m s-1
ReF = 25,500
Heat Exchanger Fouling and Cleaning – 2017
ISBN: 978-0-9984188-0-3; Published online www.heatexchanger-fouling.com 78
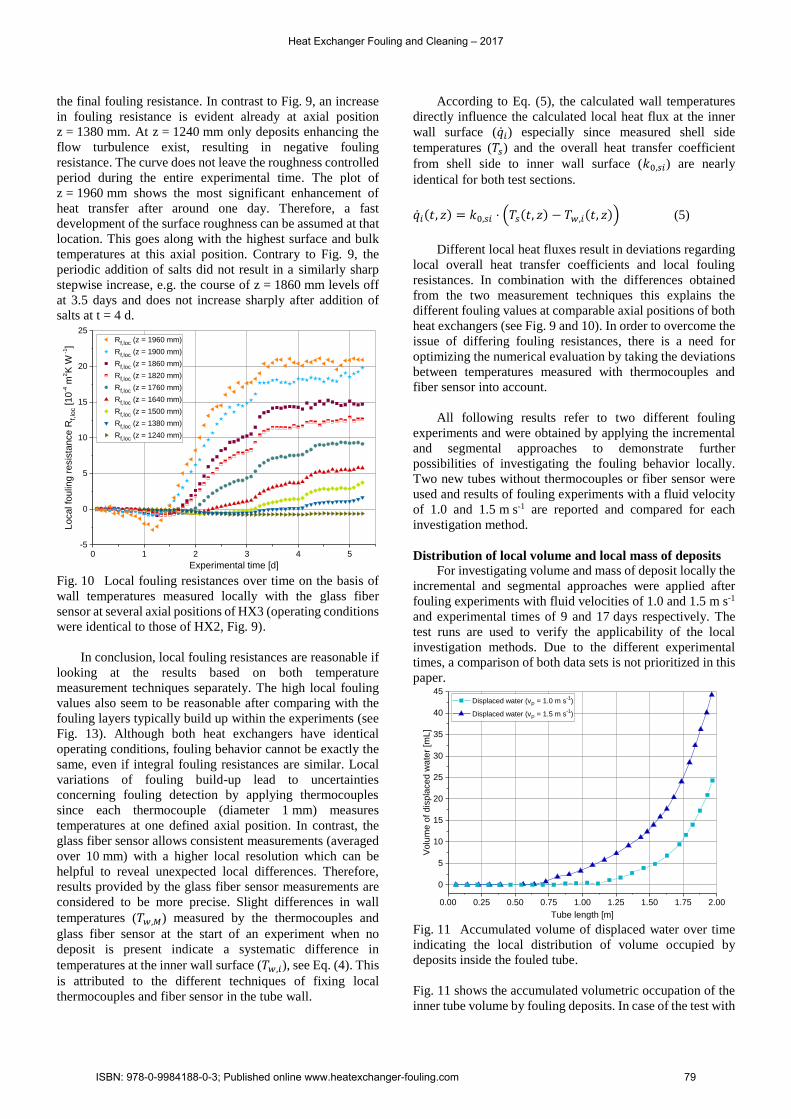
the final fouling resistance. In contrast to Fig. 9, an increase
in fouling resistance is evident already at axial position
z = 1380 mm. At z = 1240 mm only deposits enhancing the
flow turbulence exist, resulting in negative fouling
resistance. The curve does not leave the roughness controlled
period during the entire experimental time. The plot of
z = 1960 mm shows the most significant enhancement of
heat transfer after around one day. Therefore, a fast
development of the surface roughness can be assumed at that
location. This goes along with the highest surface and bulk
temperatures at this axial position. Contrary to Fig. 9, the
periodic addition of salts did not result in a similarly sharp
stepwise increase, e.g. the course of z = 1860 mm levels off
at 3.5 days and does not increase sharply after addition of
salts at t = 4 d.
Fig. 10 Local fouling resistances over time on the basis of
wall temperatures measured locally with the glass fiber
sensor at several axial positions of HX3 (operating conditions
were identical to those of HX2, Fig. 9).
In conclusion, local fouling resistances are reasonable if
looking at the results based on both temperature
measurement techniques separately. The high local fouling
values also seem to be reasonable after comparing with the
fouling layers typically build up within the experiments (see
Fig. 13). Although both heat exchangers have identical
operating conditions, fouling behavior cannot be exactly the
same, even if integral fouling resistances are similar. Local
variations of fouling build-up lead to uncertainties
concerning fouling detection by applying thermocouples
since each thermocouple (diameter 1 mm) measures
temperatures at one defined axial position. In contrast, the
over 10 mm) with a higher local resolution which can be
helpful to reveal unexpected local differences. Therefore,
results provided by the glass fiber sensor measurements are
considered to be more precise. Slight differences in wall
temperatures (𝑇𝑤,𝑀) measured by the thermocouples and
glass fiber sensor at the start of an experiment when no
deposit is present indicate a systematic difference in
temperatures at the inner wall surface (𝑇𝑤,𝑖), see Eq. (4). This
is attributed to the different techniques of fixing local
thermocouples and fiber sensor in the tube wall.
According to Eq. (5), the calculated wall temperatures
directly influence the calculated local heat flux at the inner
wall surface (�̇�𝑖) especially since measured shell side
temperatures (𝑇𝑠) and the overall heat transfer coefficient
from shell side to inner wall surface (𝑘0,𝑠𝑖) are nearly
identical for both test sections.
�̇�𝑖(𝑡, 𝑧) = 𝑘0,𝑠𝑖 ⋅ (𝑇𝑠(𝑡, 𝑧) − 𝑇𝑤,𝑖(𝑡, 𝑧)) (5)
Different local heat fluxes result in deviations regarding
local overall heat transfer coefficients and local fouling
resistances. In combination with the differences obtained
from the two measurement techniques this explains the
different fouling values at comparable axial positions of both
heat exchangers (see Fig. 9 and 10). In order to overcome the
issue of differing fouling resistances, there is a need for
optimizing the numerical evaluation by taking the deviations
between temperatures measured with thermocouples and
fiber sensor into account.
All following results refer to two different fouling
experiments and were obtained by applying the incremental
and segmental approaches to demonstrate further
possibilities of investigating the fouling behavior locally.
Two new tubes without thermocouples or fiber sensor were
used and results of fouling experiments with a fluid velocity
of 1.0 and 1.5 m s-1 are reported and compared for each
investigation method.
Distribution of local volume and local mass of deposits
For investigating volume and mass of deposit locally the
incremental and segmental approaches were applied after
fouling experiments with fluid velocities of 1.0 and 1.5 m s-1
and experimental times of 9 and 17 days respectively. The
test runs are used to verify the applicability of the local
investigation methods. Due to the different experimental
times, a comparison of both data sets is not prioritized in this
paper.
Fig. 11 Accumulated volume of displaced water over time
indicating the local distribution of volume occupied by
deposits inside the fouled tube.
Fig. 11 shows the accumulated volumetric occupation of the
inner tube volume by fouling deposits. In case of the test with
0 1 2 3 4 5-5
0
5
10
15
20
25Rf,loc (z = 1960 mm)Rf,loc (z = 1900 mm)Rf,loc (z = 1860 mm)Rf,loc (z = 1820 mm)Rf,loc (z = 1760 mm)Rf,loc (z = 1640 mm)Rf,loc (z = 1500 mm)Rf,loc (z = 1380 mm)Rf,loc (z = 1240 mm)
Loca
l fou
ling
resi
stan
ce R
f,loc
[10-4
m2 K
W -1
]
Experimental time [d]
0.00 0.25 0.50 0.75 1.00 1.25 1.50 1.75 2.00
0
5
10
15
20
25
30
35
40
45
Volu
me
of d
ispl
aced
wat
er [m
L]
Tube length [m]
Displaced water (vP = 1.0 m s-1)
Displaced water (vP = 1.5 m s-1)
Heat Exchanger Fouling and Cleaning – 2017
ISBN: 978-0-9984188-0-3; Published online www.heatexchanger-fouling.com 79
vP = 1.0 m s-1 no displaced water is detected up to a tube
length of 1000 mm. Subsequently, the curve starts to rise
very slightly and then increases exponentially until the full
length of 2000 mm is reached with an accumulated volume
of 25 mL.
The experiment with a flow velocity of 1.5 m s-1 shows
a similar length-dependent curve. However, there are distinct
differences regarding the amount of displaced water. The
course of the curve starts to rise exponentially at around
600 mm and ends with a maximum volume of displaced
water of almost 45 mL, which is nearly twice the volume of
the experiment with 1.0 m s-1.
In conclusion, both plots indicate an exponential
increase of deposit volume towards the heat exchanger hot
end. Though, a larger water volume is displaced by fouling
at vP = 1.5 m s-1. Most likely this finding is caused by three
factors: (i) a thicker layer was formed at various axial
positions causing less free cross sectional area, (ii) fouling is
formed along a longer section of the tube (iii) a more compact
fouling layer with less cavity for water. The first two aspects
are related to the longer experimental time of the test run, the
third to the higher flow velocity. For a direct comparability
test runs of different flow velocities have to be carried out
with identical experimental time. In that case a higher flow
velocity would result in less deposits.
The determination of local fouling mass by using the
heat exchanger tubes of both test runs was performed as a
part of the segmental approach. Figure 12 shows increasing
mass of deposits along the tube length, with the major
increment from segment 7 to 8. A total mass of 62 g was
obtained for the experiment with v = 1.0 m s-1. Most of the
deposit (26 g) was found in segment 8. Only marginal
amounts of deposit (below 1 g) were detected in the first two
segments. For the longer experiment, at vP = 1.5 m s-1, a
significantly higher amount of deposit accumulated in total
(99 g) and the local mass in segment 8 (around 43.5 g) was
noticeably larger.
Fig. 12 Distribution (accumulated and segmental) of local
mass of deposits obtained by weighing tube segments of
250 mm length.
These results are consistent with the volumetric analysis.
The trend of increasing fouling build-up in direction of the
hot water inlet and therefore with increasing tube length is
confirmed. Furthermore, the consistently higher fouling mass
also approves that the experiment with higher flow velocity
and experimental time results in a more compact and/or a
thicker fouling layer inside the tube. In addition, the
accumulated masses of the first three to four tube segments
expose the volumetric analysis as a not sufficiently sensitive
measurement technique for detecting the first 5 g of deposits,
since no displaced water volume was detected at these
positions (cp. Fig. 11).
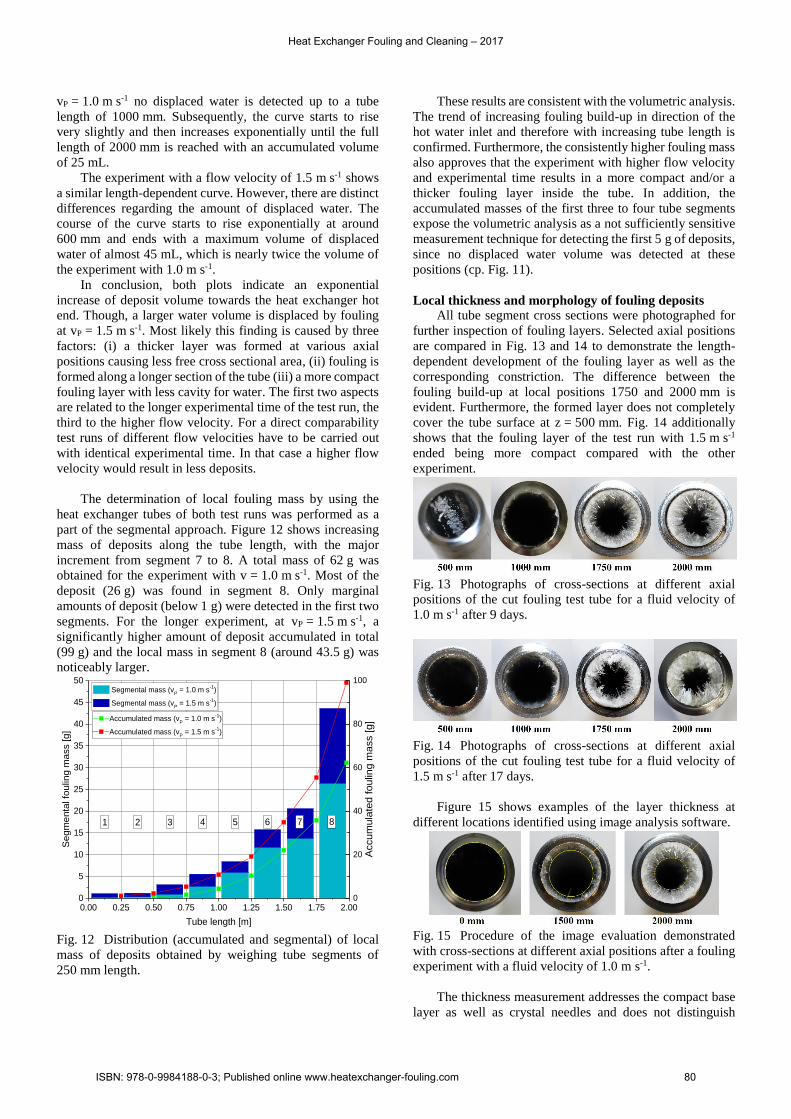
Local thickness and morphology of fouling deposits
All tube segment cross sections were photographed for
further inspection of fouling layers. Selected axial positions
are compared in Fig. 13 and 14 to demonstrate the length-
dependent development of the fouling layer as well as the
corresponding constriction. The difference between the
fouling build-up at local positions 1750 and 2000 mm is
evident. Furthermore, the formed layer does not completely
cover the tube surface at z = 500 mm. Fig. 14 additionally
shows that the fouling layer of the test run with 1.5 m s-1
ended being more compact compared with the other
experiment.
Fig. 13 Photographs of cross-sections at different axial
positions of the cut fouling test tube for a fluid velocity of
1.0 m s-1 after 9 days.
Fig. 14 Photographs of cross-sections at different axial
positions of the cut fouling test tube for a fluid velocity of
1.5 m s-1 after 17 days.
Figure 15 shows examples of the layer thickness at
different locations identified using image analysis software.
Fig. 15 Procedure of the image evaluation demonstrated
with cross-sections at different axial positions after a fouling
experiment with a fluid velocity of 1.0 m s-1.
The thickness measurement addresses the compact base
layer as well as crystal needles and does not distinguish
0.00 0.25 0.50 0.75 1.00 1.25 1.50 1.75 2.000
5
10
15
20
25
30
35
40
45
50
Seg
men
tal f
oulin
g m
ass
[g]
Tube length [m]
Segmental mass (vP = 1.0 m s-1)
Segmental mass (vP = 1.5 m s-1)
0
20
40
60
80
100
8721 5 63 4
Accumulated mass (vP = 1.0 m s-1)
Accumulated mass (vP = 1.5 m s-1)
Acc
umul
ated
foul
ing
mas
s [g
]
Heat Exchanger Fouling and Cleaning – 2017
ISBN: 978-0-9984188-0-3; Published online www.heatexchanger-fouling.com 80
between these two structures. According to Eq. (6), the layer
thickness 𝑥𝑓,𝑝𝑖𝑐𝑡𝑢𝑟𝑒 is calculated as the difference between
diameter of flow cross-section without (𝑑0) and with fouling
(𝑑𝑓,𝑝𝑖𝑐𝑡𝑢𝑟𝑒).
𝑥𝑓,𝑝𝑖𝑐𝑡𝑢𝑟𝑒(𝑧) =𝑑0−𝑑𝑓,𝑝𝑖𝑐𝑡𝑢𝑟𝑒(𝑧)
2 (6)
The evaluation works best in case of flow cross sections
uniformly constricted by deposit as they are in Fig. 15. A
near-circular geometry of the cross section without fouling is
applied and its equivalent tube diameter 𝑑𝑓,𝑝𝑖𝑐𝑡𝑢𝑟𝑒 is
estimated.
Results of cross-sections at axial positions 1000, 1250,
1500, 1750 and 2000 mm from both fouling experiments are
compared in Fig. 16. No fouling was found below
z = 1000 mm and 750 mm respectively. Layer thicknesses
obtained from the test run with vP = 1.5 m s-1 are consistently
higher than those of the experiment with lower flow velocity,
which agrees with the other methods. The major increase of
fouling layer thickness was found between cross sections at
1500 to 1750 mm in both experiments. Subsequently, high
local flow velocities based on local constrictions are present.
The effective wall shear stress will be larger and is expected
to suppress layer growth to some extent. Thus, the proportion
of compact base layer increases which accounts for the larger
amount of deposit (cp. Fig. 11, 12, 13 and 14).
Fig. 16 Local thickness of fouling layers as result of the
image analysis of cross sections after cutting the test tubes
into segments.
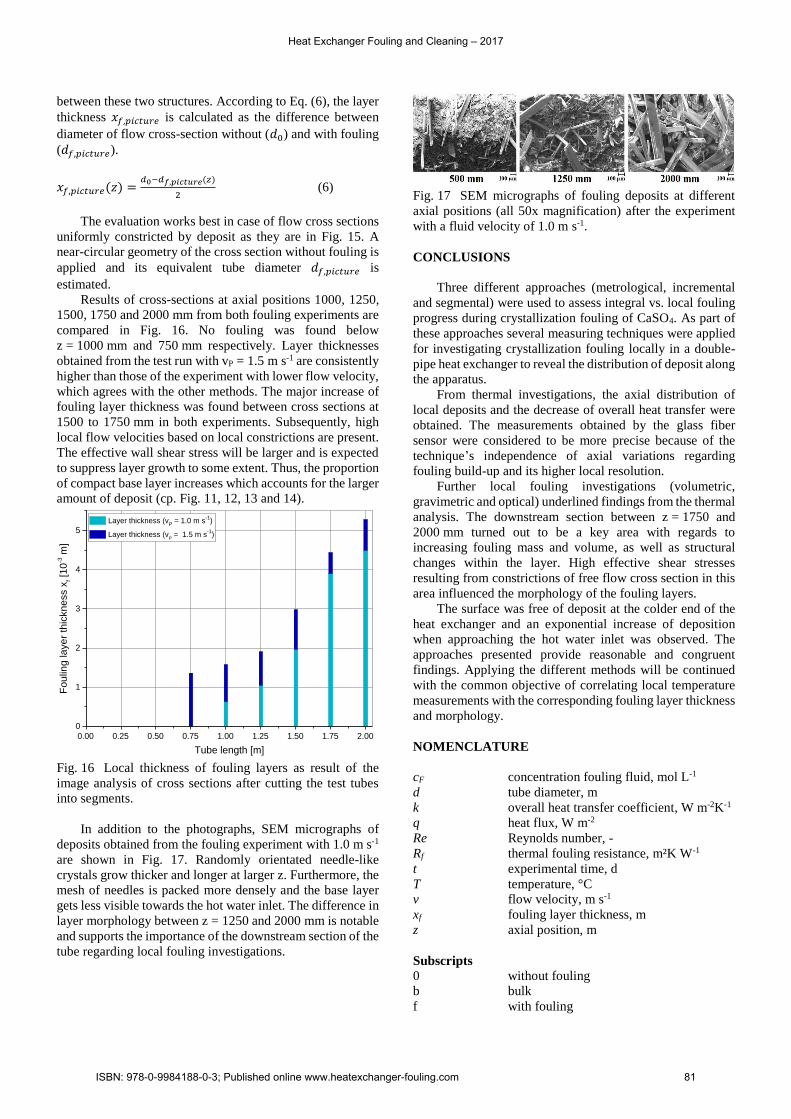
In addition to the photographs, SEM micrographs of
deposits obtained from the fouling experiment with 1.0 m s-1
are shown in Fig. 17. Randomly orientated needle-like
crystals grow thicker and longer at larger z. Furthermore, the
mesh of needles is packed more densely and the base layer
gets less visible towards the hot water inlet. The difference in
layer morphology between z = 1250 and 2000 mm is notable
and supports the importance of the downstream section of the
tube regarding local fouling investigations.
Fig. 17 SEM micrographs of fouling deposits at different
axial positions (all 50x magnification) after the experiment
with a fluid velocity of 1.0 m s-1.
CONCLUSIONS
Three different approaches (metrological, incremental
and segmental) were used to assess integral vs. local fouling
progress during crystallization fouling of CaSO4. As part of
these approaches several measuring techniques were applied
for investigating crystallization fouling locally in a double-
pipe heat exchanger to reveal the distribution of deposit along
the apparatus.
From thermal investigations, the axial distribution of
local deposits and the decrease of overall heat transfer were
obtained. The measurements obtained by the glass fiber
sensor were considered to be more precise because of the
technique’s independence of axial variations regarding
fouling build-up and its higher local resolution.
Further local fouling investigations (volumetric,
gravimetric and optical) underlined findings from the thermal
analysis. The downstream section between z = 1750 and
2000 mm turned out to be a key area with regards to
increasing fouling mass and volume, as well as structural
changes within the layer. High effective shear stresses
resulting from constrictions of free flow cross section in this
area influenced the morphology of the fouling layers.
The surface was free of deposit at the colder end of the
heat exchanger and an exponential increase of deposition
when approaching the hot water inlet was observed. The
approaches presented provide reasonable and congruent
findings. Applying the different methods will be continued
with the common objective of correlating local temperature
measurements with the corresponding fouling layer thickness
and morphology.
NOMENCLATURE
cF concentration fouling fluid, mol L-1
d tube diameter, m
k overall heat transfer coefficient, W m-2K-1
q heat flux, W m-2
Re Reynolds number, -
Rf thermal fouling resistance, m²K W-1
t experimental time, d
T temperature, °C
v flow velocity, m s-1
xf fouling layer thickness, m
z axial position, m
Subscripts
0 without fouling
b bulk
f with fouling
0.00 0.25 0.50 0.75 1.00 1.25 1.50 1.75 2.000
1
2
3
4
5
Foul
ing
laye
r thi
ckne
ss x
f [10
-3 m
]
Tube length [m]
Layer thickness (vP = 1.0 m s-1)
Layer thickness (vP = 1.5 m s-1)
Heat Exchanger Fouling and Cleaning – 2017
ISBN: 978-0-9984188-0-3; Published online www.heatexchanger-fouling.com 81
H_in hot water inlet
i inner
int integral
loc local
M measuring point
Mi from measuring point to inner wall surface
P product stream
P_in product stream inlet
picture based on photograph
s shell side
si from shell side to inner wall surface
w wall
Acronyms
Ca(NO3)2∙4H2O calcium nitrate tetrahydrate
CaSO4 calcium sulphate
GF glass fiber sensor
HX2 double-pipe heat exchanger test section 2
HX3 double-pipe heat exchanger test section 3
Na2SO4 sodium sulphate
SEM Scanning Electron Microscope
TC thermocouple
ACKNOWLEDGMENT
Special thanks go to the technicians of the Institute for
Chemical and Thermal Process Engineering, namely Karl
Karrenführer, Jörg Leppelt, Sven Lorenzen and Nils
Bergmann, for the construction of the heat exchanger test
sections and the great support in case of any issue regarding
the test rig.
REFERENCES
Albert, F., Augustin, W., and Scholl, S., 2011,
Roughness and constriction effects in crystallization fouling,
Chem. Eng. Sci., Vol. 66 (3), pp. 499-509.
Al-Janabi, A, Malayeri, M.R., and Müller-Steinhagen,
H, 2009, Experimental investigation of crystallization
fouling on grooved stainless steel surfaces during convective
heat transfer, Heat Transfer Eng., Vol 30 (10-11), pp. 832-
839.
Augustin, W., and Bohnet, M, 1995, Influence of the
ratio of free hydrogen ions on crystallization fouling, Chem.
Eng. Process., Vol. 34 (2), pp. 79-85.
Bohnet, M., and Augustin, W, 1993, Effect of surface
structure and pH-value on fouling behaviour of heat
exchangers, in J. S. Lee et al.: Transport Phenomena in
Thermal Engineering, Begell House, New York, pp. 884-
889.
Fahiminia, F., Watkinson, A.P., and Epstein, N., 2007,
Early events in the precipitation fouling of calcium sulphate
dihydrate under sensible heating conditions, Can. J. Chem.
Eng., Vol. 85 (5), pp. 679–691.
Goedecke, R., Drögemüller, P., Augustin, W., and
Scholl, S., 2016, Experiments on integral and local
crystallization fouling resistances in a double-pipe heat
exchanger with wire matrix inserts, Heat Transfer Eng., Vol.
37 (1), pp. 24-31.
Helalizadeh, H., Müller-Steinhagen, H., and
Jamialahmadi, M., 2000, Mixed salt crystallization fouling,
Chem. Eng. Process, Vol. 39 (1), pp. 29-43.
Krause, S., 1993, Fouling of heat transfer surfaces by
crystallization and sedimentation, Int. Chem. Eng., Vol. 33
(3), pp. 335-401.
Müller-Steinhagen, H., 2011, Heat Transfer Fouling: 50
years after the Kern and Seaton model, Heat Transfer Eng.,
Vol 32 (1), pp. 1-13.
Müller-Steinhagen, H., Zhao, Q., Helali-Zadeh, A., and
Ren, X.-G., 2000, The effect of surface properties on CaSO4
scale formation during convective heat transfer and
subcooled flow boiling, Can. J. Chem. Eng., Vol. 78 (1), pp.
12-20.
Pääkkönen, T.M., Riihimäki, M., Simonson, C.J.,
Muurinen, E., and Keiski, R.L., 2012, Crystallization fouling
of CaCO3 – Analysis of experimental thermal resistance and
its uncertainty, Int. J. Heat Mass Transfer, Vol. 55 (23-24),
pp. 6927-6937.
VDI-Wärmeatlas, 2013, Springer Verlag Berlin
Heidelberg, Chapter B2.
Zettler, H.U., Weiss, M., Zhao, Q., and Müller-
Steinhagen, H., 2005, Influence of surface properties and
characteristics on fouling in plate heat exchangers, Heat
Transfer Eng., Vol. 26 (2), pp. 3-17.
Heat Exchanger Fouling and Cleaning – 2017
ISBN: 978-0-9984188-0-3; Published online www.heatexchanger-fouling.com 82