Application Note Environmental, food, cosmetics, materials Authors Michiko Yamanaka, Takayuki Itagaki Agilent Technologies, Japan Steve Wilbur Agilent Technologies, USA Introduction Single Particle ICP-MS (spICP-MS) is a powerful tool used to characterize nanoparticles (NP) dispersed or suspended in liquid samples. Although it is a relatively new technique, spICP-MS is increasingly being applied to the analysis of NPs in manufactured goods, as well as environmental and biological samples. With appropriate sample preparation and dilution, spICP-MS enables the NPs to be detected from the elemental signals generated from individual particles as they pass through the plasma. Uniquely, this allows the simultaneous determination of the particle number and size distribution, along with the concentrations of both the particles and the dissolved content of the element of interest. spICP-MS is proving very valuable for determinations where the NP composition is known in advance, allowing selection of the element to be measured. However, there is also interest in analyzing natural samples that contain mixtures of NPs of unknown or variable composition. Furthermore, some NPs contain more than one metal, for example in the case of core-shell particles with a core of one metal surrounded by a shell of a different metal. These multi-element and bimetallic- particle measurements introduce new analytical challenges for all conventional Measuring Multiple Elements in Nanoparticles using spICP-MS Acquire NP data for up to 16 elements in Rapid Multi-Element Nanoparticle Analysis Mode
Transcript
Application Note
Environmental, food, cosmetics, materials
AuthorsMichiko Yamanaka, Takayuki Itagaki Agilent Technologies, Japan
Steve Wilbur Agilent Technologies, USA
IntroductionSingle Particle ICP-MS (spICP-MS) is a powerful tool used to characterize nanoparticles (NP) dispersed or suspended in liquid samples. Although it is a relatively new technique, spICP-MS is increasingly being applied to the analysis of NPs in manufactured goods, as well as environmental and biological samples. With appropriate sample preparation and dilution, spICP-MS enables the NPs to be detected from the elemental signals generated from individual particles as they pass through the plasma. Uniquely, this allows the simultaneous determination of the particle number and size distribution, along with the concentrations of both the particles and the dissolved content of the element of interest.
spICP-MS is proving very valuable for determinations where the NP composition is known in advance, allowing selection of the element to be measured. However, there is also interest in analyzing natural samples that contain mixtures of NPs of unknown or variable composition. Furthermore, some NPs contain more than one metal, for example in the case of core-shell particles with a core of one metal surrounded by a shell of a different metal. These multi-element and bimetallic-particle measurements introduce new analytical challenges for all conventional
Measuring Multiple Elements in Nanoparticles using spICP-MS
Acquire NP data for up to 16 elements in Rapid Multi-Element Nanoparticle Analysis Mode
2
ICP-MS instruments, which perform sequential measurements using a single detector.
The signal duration of the plume of ions from a single NP depends on the particle size and composition but is typically of the order of 500 µs (0.5 ms). Dwell (or integration) times for single particle measurement by ICP-MS are in the range of tens to hundreds of μs, with around 100 μs being the optimum balance between sampling rate and signal precision. It is essential that the dwell time is long enough to ensure good signal precision, to allow accurate quantification of the signal “noise”. This is necessary to allow small particles to be distinguished from the background. From the signal duration and optimum dwell time, it is apparent that several sequential measurements (dwell times) can be taken during the signal plume from a particle, provided there is no delay time between measurements. This means that the entire signal pulse for the selected mass can be collected for each particle, allowing accurate characterization of the counts and therefore size of each individual particle.
When more than one mass is measured in each particle, however, the spectrometer must be switched repeatedly between the two masses as the ion plume passes through the instrument. After each quadrupole mass jump, a settling time is required, to allow the signal for the new mass to stabilize. The settling time is in the region of tens to hundreds of µs or more, depending on the size of the mass jump. So, if two masses are measured during the signal plume from a single particle, much of the signal is missed, as neither mass is measured during the settling time. Two elements can, in principle, be measured in a single particle. For example, if a dwell time of 80 µs and a settling time of 100 µs is used, one to two sweeps across the two masses could be acquired during the 500 µs signal plume from one particle. In practice, however, more than half the counts are missed during the settling time, so the data would be highly variable and qualitative at best. Reducing the dwell time to increase the sampling rate would further degrade the data quality, as the settling time is fixed for any given mass jump, while the signal counts decrease with reduced integration time. Reliable analysis of more than one element in a particle population therefore requires that the sample is run twice, once for each of the target element masses (1). Alternatively, the particles can first be separated into size fractions by a technique such as field flow fractionation, prior to multi-element analysis of the separated fractions by ICP-MS (2).
To enable accurate, direct, multi-element NP analysis without compromising data quality, Agilent has developed a Rapid Multi-Element Nanoparticle Analysis function for ICP-MS. The multi-element mode is included in the Single Nanoparticle
Application Module which is an option for the main ICP-MS MassHunter suite. This multi-element NP approach can collect data sequentially for up to 16 elements in a single sample analysis, using optimum conditions for the measurement of each individual element.
Using the software module, multi-element data is collected and combined into a table in ICP-MS MassHunter’s Data Analysis pane. The table provides comprehensive information about NPs that contain each of the measured elements. Compared to conventional, single-element spICP-MS analysis, the ICP-MS MassHunter multi-element NP approach saves time and reduces the risk of sample contamination, as the multi-element analysis requires only one visit to the sample vial. Data quality is improved, and element associations can be inferred from comparison of the multi-element size distribution data.
TiO2 and ZnO are two of the most widely used NPs in commercial products. It has been reported that the content (by weight) of TiO2 or ZnO NPs is 10–25% in sunscreen, 1–15% in toothpaste, 0.5–20% in cosmetics, and up to 1% in foods (3). With increasing production and use, the potential impact of NP exposure on biological systems and the environment has raised concerns among regulators and the public.
Huang et al reported that the impact of ZnO NPs on the ecological health of the rhizosphere (near-root) layer of soil is greater than the effects from TiO2 NPs (4). ZnO dissolves and releases Zn2+ into the rhizosphere, which damages the Rhizobia nitrogen-fixing bacteria and the host plant. TiO2, which is less soluble than ZnO, affects the rhizosphere mainly by physical attachment.
Under stable conditions, TiO2 NPs have been reported to be less toxic than Ag or ZnO NPs. However, a few studies have shown an increased potential risk when samples that contain a high level of TiO2 NPs are exposed to UV radiation (5). A recent study (6) to estimate the occurrence of TiO2 NPs in a children’s outdoor pool reported that a considerable number of NPs can be released into the water from sunscreen.
There is clearly a need for a rapid, accurate, and sensitive technique to characterize NPs of multiple types and compositions from a single analysis.
In this study, sunscreen NP ingredients, Al(OH)3, TiO2, and ZnO, were measured using an Agilent 7900 ICP-MS in multi-element spICP-MS mode. The Rapid Multi-Element Nanoparticle Analysis capability of ICP-MS MassHunter was used for method setup, acquisition, and data processing. The same method was also applied to the measurement of TiO2 and ZnO NPs in various swimming pool water samples.
3
Experimental Reference materials and samples The TiO2 standard reference material (SRM) NIST 1898 Titanium Dioxide (National Institute of Standards and Technology, Gaithersburg, MD, US) was used to confirm the accuracy of the method. NIST 1898 contains crystal or primary sized particles <50 nm, but the size of particles dispersed in the aqueous phase range from 71 to 112 nm due to nanoscale aggregation (7). The SRM was diluted with de-ionized water to a particle concentration that was calculated to give 500 – 2000 particle counts per minute. The solution was sonicated to ensure sample homogeneity.
NIST 8013 Gold Nanoparticles RM with a nominal particle size of 60 nm was used to measure the nebulization efficiency. The nebulization efficiency is the ratio of the number of particles detected divided by the number of particles known to be present in the reference solution. This value is required to allow calculation of both the particle number concentration (number of particles per mL), and to convert the measured particle signals to NP mass and therefore size (8).
A mixed multi-element standard containing all analytes of interest (SPEX CertiPrep, Metuchen, NJ, US) was diluted to 10 μg/L in 1 % HNO3 and used to measure the elemental response factor for Al, Ti, and Zn. The elemental response factor is another parameter required in the equations used to convert the raw NP signal to particle size.
Three kinds of sunscreen products were bought from a local store in Tokyo, Japan. The listed ingredients in each sample are given in Table 1. The sunscreen samples were diluted 50x with 1% Triton™ X-100 in de-ionized water and sonicated for 30 min. Final solutions for analysis were prepared by further diluting the samples 100,000x with 0.01 % Triton™ X-100 and sonicating for 30 min.
Table 1. Listed ingredients in the three sunscreen products.
Sunscreen Al Ti Zn
A Al(OH)3 TiO2 -
B - - -
C Al(OH)3 TiO2 ZnO
To allow the results for Al, Ti, and Zn NPs to be compared to the total elemental concentrations, digests of the three sunscreen samples were also prepared. Approximately 0.2 g of each sunscreen sample was microwave digested in 10 mL of HNO3. The digest solutions were further diluted 1000x with 1% HNO3 for analysis.
Swimming pool water samples were collected from swimming pools in the Tokyo area.
InstrumentationAn Agilent 7900 ICP-MS was used for all measurements. The instrument was equipped with the standard glass concentric nebulizer and quartz spray chamber, a quartz torch with a small internal diameter (1.0 mm) injector, and standard nickel cones. Samples were introduced directly into the ICP-MS with the standard peristaltic pump and tubing (i.d. 1.02 mm). The 7900 ICP-MS has a fast Time Resolved Analysis (TRA) mode that allows single element acquisition at a sampling rate of 100 μs (10,000 measurements per second). No settling time is needed between measurements.
Rapid Multi-Element Nanoparticle Analysis: a multi-element acquisition program for spICP-MSAnalyses were performed using the Rapid Multi-Element Nanoparticle Analysis mode of the Single Nanoparticle Application Module of Agilent ICP-MS MassHunter software. ICP-MS MassHunter includes a Method Wizard, which guides the user through the entire setup process and automatically provides or calculates the required method parameters.
Figure 1 shows a schematic representation of conventional (one element at a time) and rapid multi-element single NP acquisitions.
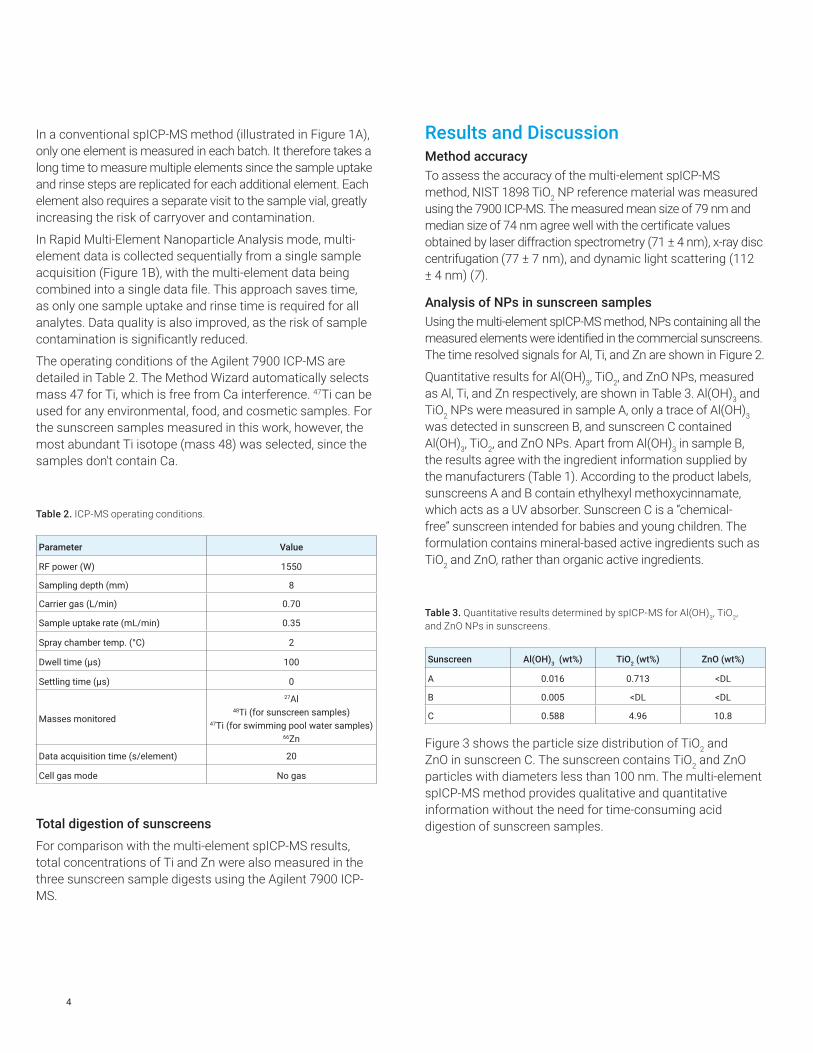
Results and Discussion Method accuracy To assess the accuracy of the multi-element spICP-MS method, NIST 1898 TiO2 NP reference material was measured using the 7900 ICP-MS. The measured mean size of 79 nm and median size of 74 nm agree well with the certificate values obtained by laser diffraction spectrometry (71 ± 4 nm), x-ray disc centrifugation (77 ± 7 nm), and dynamic light scattering (112 ± 4 nm) (7).
Analysis of NPs in sunscreen samples Using the multi-element spICP-MS method, NPs containing all the measured elements were identified in the commercial sunscreens. The time resolved signals for Al, Ti, and Zn are shown in Figure 2.
Quantitative results for Al(OH)3, TiO2, and ZnO NPs, measured as Al, Ti, and Zn respectively, are shown in Table 3. Al(OH)3 and TiO2 NPs were measured in sample A, only a trace of Al(OH)3 was detected in sunscreen B, and sunscreen C contained Al(OH)3, TiO2, and ZnO NPs. Apart from Al(OH)3 in sample B, the results agree with the ingredient information supplied by the manufacturers (Table 1). According to the product labels, sunscreens A and B contain ethylhexyl methoxycinnamate, which acts as a UV absorber. Sunscreen C is a “chemical-free” sunscreen intended for babies and young children. The formulation contains mineral-based active ingredients such as TiO2 and ZnO, rather than organic active ingredients.
Table 3. Quantitative results determined by spICP-MS for Al(OH)3, TiO2, and ZnO NPs in sunscreens.
Sunscreen Al(OH)3 (wt%) TiO2 (wt%) ZnO (wt%)
A 0.016 0.713 <DL
B 0.005 <DL <DL
C 0.588 4.96 10.8
Figure 3 shows the particle size distribution of TiO2 and ZnO in sunscreen C. The sunscreen contains TiO2 and ZnO particles with diameters less than 100 nm. The multi-element spICP-MS method provides qualitative and quantitative information without the need for time-consuming acid digestion of sunscreen samples.
In a conventional spICP-MS method (illustrated in Figure 1A), only one element is measured in each batch. It therefore takes a long time to measure multiple elements since the sample uptake and rinse steps are replicated for each additional element. Each element also requires a separate visit to the sample vial, greatly increasing the risk of carryover and contamination.
In Rapid Multi-Element Nanoparticle Analysis mode, multi-element data is collected sequentially from a single sample acquisition (Figure 1B), with the multi-element data being combined into a single data file. This approach saves time, as only one sample uptake and rinse time is required for all analytes. Data quality is also improved, as the risk of sample contamination is significantly reduced.
The operating conditions of the Agilent 7900 ICP-MS are detailed in Table 2. The Method Wizard automatically selects mass 47 for Ti, which is free from Ca interference. 47Ti can be used for any environmental, food, and cosmetic samples. For the sunscreen samples measured in this work, however, the most abundant Ti isotope (mass 48) was selected, since the samples don't contain Ca.
Table 2. ICP-MS operating conditions.
Parameter Value
RF power (W) 1550
Sampling depth (mm) 8
Carrier gas (L/min) 0.70
Sample uptake rate (mL/min) 0.35
Spray chamber temp. (°C) 2
Dwell time (µs) 100
Settling time (µs) 0
Masses monitored
27Al 48Ti (for sunscreen samples)
47Ti (for swimming pool water samples)66Zn
Data acquisition time (s/element) 20
Cell gas mode No gas
Total digestion of sunscreensFor comparison with the multi-element spICP-MS results, total concentrations of Ti and Zn were also measured in the three sunscreen sample digests using the Agilent 7900 ICP-MS.
5
Table 4. Comparison of concentrations of Al-, Ti-, and Zn-containing NPs (by spICP-MS) and total elemental concentrations (after digestion) in sunscreen C.
Al(OH)3 TiO2 ZnO
Concentration(wt %)
RSD (%)n=6
Concentration(wt %)
RSD (%)n=6
Concentration(wt %)
RSD (%)n=6
spICP-MS 0.588 22.9 4.96 19.8 10.8 16.3
Sample digest
0.714 6.3 5.49 2.5 14.6 2.9
Ratio of NPs/total
82% 90% 74%
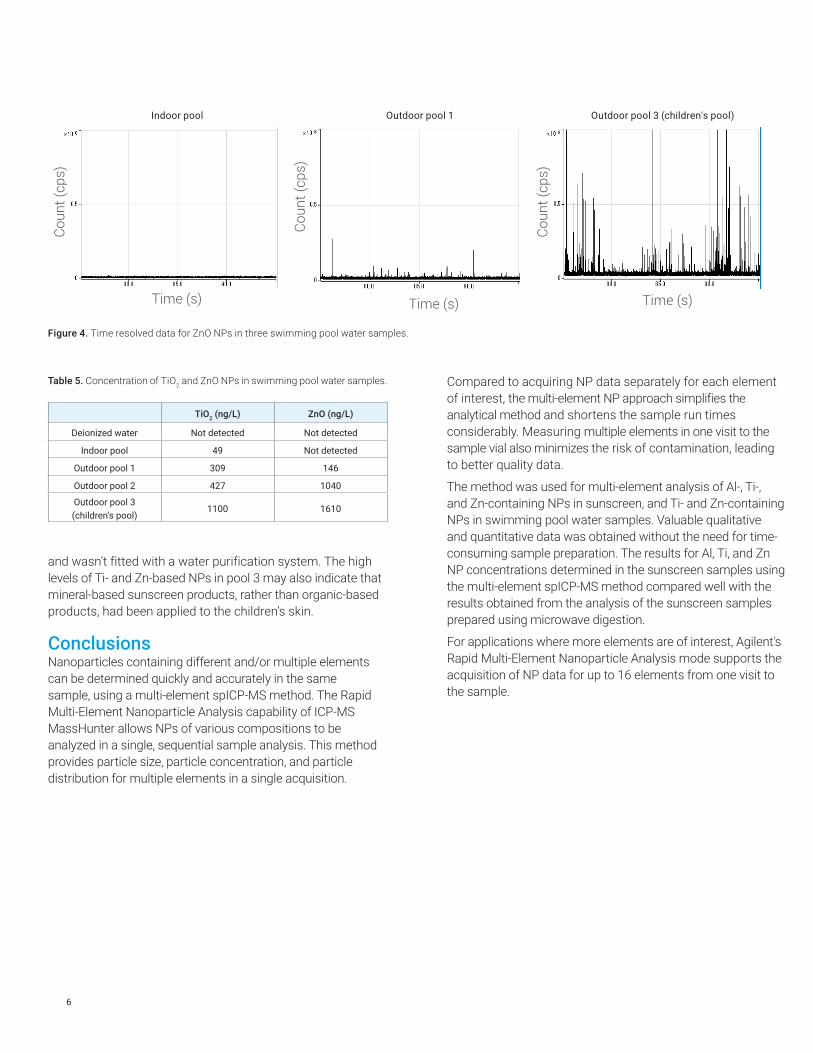
Nanoparticles in swimming pool water The NP content of four swimming pool water samples was measured using the multi-element spICP-MS method. Figure 4 shows the time resolved data for Zn-containing NPs in three of the pool waters. The results shown in Table 5 indicate that higher concentrations of TiO2 and ZnO NPs were found in the water from the three outdoor pools compared to the indoor pool. The results confirm the expectation that outdoor pools would be affected more by contamination from sunscreen. The concentration of NPs was the highest in the children’s pool (outdoor pool 3), which was much smaller than the other pools
Figure 3 : Particle size distribution of TiO2 NPs (left) and ZnO NPs (right)
Agilent Restricted LSAG April 2015
Particle size (nm)
Nor
mal
ized
freq
uenc
y
Nor
mal
ized
freq
uenc
y
Particle size (nm)
Figure 2. Time resolved data for Al-, Ti-, and Zn-containing NPs in three commercial sunscreens.
Figure 3. Particle size distribution of TiO2 NPs (left) and ZnO NPs (right) in sunscreen C.
Comparison of results The concentrations of Al, Ti, and Zn NPs in sunscreen C determined by spICP-MS analysis were compared with the total metal concentrations in the sample prepared by microwave digestion (Table 4). There was reasonable agreement between the two sets of concentration results for all three elements.
Table 4 also shows the RSDs of the quantitative results. The larger RSDs from the multi-element spICP-MS method are likely due to the inhomogeneity of the dispersed sunscreen samples. Precision might be improved by further optimizing the dispersion technique.
6
Compared to acquiring NP data separately for each element of interest, the multi-element NP approach simplifies the analytical method and shortens the sample run times considerably. Measuring multiple elements in one visit to the sample vial also minimizes the risk of contamination, leading to better quality data.
The method was used for multi-element analysis of Al-, Ti-, and Zn-containing NPs in sunscreen, and Ti- and Zn-containing NPs in swimming pool water samples. Valuable qualitative and quantitative data was obtained without the need for time-consuming sample preparation. The results for Al, Ti, and Zn NP concentrations determined in the sunscreen samples using the multi-element spICP-MS method compared well with the results obtained from the analysis of the sunscreen samples prepared using microwave digestion.
For applications where more elements are of interest, Agilent's Rapid Multi-Element Nanoparticle Analysis mode supports the acquisition of NP data for up to 16 elements from one visit to the sample.
Figure 4 : Time resolved data for ZnO NPs in three swimming pool water samples
Agilent Restricted LSAG April 2015
Left : Indoor pool, middle : outdoor pool 1, right : Outdoor pool 3 (for children)
Co
un
t (c
ps
)
Time (s)C
ou
nt
(cp
s)
Time (s)
Co
un
t (c
ps
)
Time (s)
Figure 4. Time resolved data for ZnO NPs in three swimming pool water samples.
Table 5. Concentration of TiO2 and ZnO NPs in swimming pool water samples.
TiO2 (ng/L) ZnO (ng/L)
Deionized water Not detected Not detected
Indoor pool 49 Not detected
Outdoor pool 1 309 146
Outdoor pool 2 427 1040
Outdoor pool 3 (children’s pool)
1100 1610
and wasn’t fitted with a water purification system. The high levels of Ti- and Zn-based NPs in pool 3 may also indicate that mineral-based sunscreen products, rather than organic-based products, had been applied to the children’s skin.
Conclusions Nanoparticles containing different and/or multiple elements can be determined quickly and accurately in the same sample, using a multi-element spICP-MS method. The Rapid Multi-Element Nanoparticle Analysis capability of ICP-MS MassHunter allows NPs of various compositions to be analyzed in a single, sequential sample analysis. This method provides particle size, particle concentration, and particle distribution for multiple elements in a single acquisition.
Indoor pool Outdoor pool 1 Outdoor pool 3 (children's pool)
www.agilent.com/chem
DE44185.5600231482
This information is subject to change without notice.
References 1. R. C. Merrifield, C. Stephan, J. Lead, Determining the
Concentration Dependent Transformations of Ag Nanoparticles in Complex Media: Using SP-ICP-MS and Au@Ag Core−Shell Nanoparticles as Tracers, Environ. Sci. Technol. 2017, 51, 3206−3213
2. F. von der Kammer, S. Legros, E. H. Larsen, K. Loeschner, T. Hofmann, Separation and characterization of nanoparticles in complex food and environmental samples by field-flow fractionation, Trends in Analytical Chemistry, Vol. 30, No. 3, 2011
3. S. Choi, M. Johnston, G.Wang, C. P. Huang, A seasonal observation on the distribution of engineered nanoparticles in municipal wastewater treatment systems exemplified by TiO2 and ZnO, Science of the Total Environment, 2018, 625, 1321–1329
4. Y. C. Huang, R. Fan, M. A. Grusak, J. D. Sherrier, C. P. Huang, Effects of nano-ZnO on the agronomically relevant Rhizobium–legume symbiosis, Science of Total Environment, 2014, 497–498, 78–90
5. S. K. Jeon, E. J. Kim, J. Lee, S. Lee, Potential risks of TiO2 and ZnO nanoparticles released from sunscreens into outdoor swimming pools, Journal of Hazardous Materials, 2016, 317, 312–318
6. R. D. Holbrook, D. Motabar, O. Quiñones, B. Stanford, B. Vanderford, D. Moss, Titanium distribution in swimming pool water is dominated by dissolved species, Environmental Pollution, 2013, 181, 68–74
7. NIST Standard Reference Material 1898 (Titanium Dioxide Nanomaterial) Certificate of Analysis, 2012
8. H. Pace, N. J. Rogers, C. Jarolimek, V. A. Coleman, C. P. Higgins, J. F. Ranville, Determining Transport Efficiency for the Purpose of Counting and Sizing Nanoparticles via Single Particle Inductively Coupled Plasma Mass Spectrometry. Anal. Chem. 2011, 83, 9361–9369