Page 1
MEASURING NEIGHBOURHOOD
SUSTAINABILITY: A
COMPARATIVE ANALYSIS OF
RESIDENTIAL TYPES IN MALAYSIA
SUHARTO TERIMAN
BA (Hons) Town and Regional Planning
MSc GIS and Remote Sensing
Submitted in fulfilment of the requirements for the degree of
Doctor of Philosophy
School of Civil Engineering and the Built Environment
Faculty of Science and Engineering
Queensland University of Technology
August 2012
Page 3
Measuring neighbourhood sustainability: A comparative analysis of residential types in Malaysia i
Keywords
Assessment framework, Delphi technique, key indicators, master-planned
development, piecemeal development, neighbourhood layout, residential
development, sub-division development, sustainable development,
sustainability assessment, sustainability levels
Page 4
ii Measuring neighbourhood sustainability: A comparative analysis of residential types in Malaysia
Abstract
The expansion of city-regions, the increase in the standard of living and changing
lifestyles have collectively led to an increase in housing demand. New residential
areas are encroaching onto the city fringes including suburban and green field areas.
Large and small developers are actively building houses ranging from a few blocks to
master-planned style projects. These residential developments, particularly in major
urban areas, represent a large portion of urban land use in Malaysia, and, thus, have
become a major contributor to overall urban sustainability. There are three main types
that comprise the mainstream, and form integral parts to contemporary urban
residential developments, namely, subdivision developments, piecemeal
developments, and master-planned developments. Many new master-planned
developments market themselves as environmentally friendly, and provide layouts that
encompass sustainable design and development. To date, however, there have been
limited studies conducted to examine such claims or to ascertain which of these three
residential development layouts is more sustainable. To fill this gap, this research was
undertaken to develop a framework for assessing the level of sustainability of
residential developments, focusing on their layouts at the neighbourhood level.
The development of this framework adopted a mixed method research strategy and
embedded research design to achieve the study aim and objectives. Data were
collected from two main sources, where quantitative data were gathered from a three-
round Delphi survey and spatial data from a layout plan. Sample respondents for
surveys were selected from among experts in the field of the built environment, both
from Malaysia and internationally. As for spatial data, three case studies – master-
planned, piecemeal and subdivision developments representing different types of
neighbourhood developments in Malaysia have been selected. Prior to application on
the case studies, the appropriate framework was subjected to validation to ascertain its
robustness for application in Malaysia.
Following the application of the framework on the three case studies the results
revealed that master-planned development scored a better level of sustainability
compared to piecemeal and subdivision developments. The results generated from this
Page 5
Measuring neighbourhood sustainability: A comparative analysis of residential types in Malaysia iii
framework are expected to provide evidence to the policy makers and development
agencies as well as provide an awareness of the level of sustainability and the
necessary collective efforts required for developing sustainable neighbourhoods.
Continuous assessment can facilitate a comparison of sustainability over time for
neighbourhoods as a means to monitor changes in the level of sustainability. In
addition, the framework is able to identify any particular indicator (issue) that causes a
significant impact on sustainability.
Page 6
iv Measuring neighbourhood sustainability: A comparative analysis of residential types in Malaysia
Table of Contents
KEYWORDS .......................................................................................................................................... I ABSTRACT ........................................................................................................................................... II TABLE OF CONTENTS ......................................................................................................................... IV LIST OF FIGURES .............................................................................................................................. VIII LIST OF TABLES ................................................................................................................................. XI STATEMENT OF ORIGINAL AUTHORSHIP ............................................................................................ XIV ACKNOWLEDGEMENTS ...................................................................................................................... XV PUBLICATIONS ................................................................................................................................. XVI
CHAPTER 1: INTRODUCTION ................................................................................................ 1
1.1 BACKGROUND............................................................................................................................ 1 1.2 RESEARCH PROBLEMS AND QUESTIONS ...................................................................................... 2 1.3 RESEARCH AIM AND OBJECTIVES ............................................................................................... 4 1.4 RESEARCH METHODOLOGY ........................................................................................................ 5 1.5 RESEARCH SIGNIFICANCE........................................................................................................... 5 1.6 DELIMITATION OF THE RESEARCH .............................................................................................. 6 1.7 OUTLINE OF THESIS .................................................................................................................... 6
CHAPTER 2: LITERATURE REVIEW .................................................................................... 9
2.1 INTRODUCTION .......................................................................................................................... 9 2.2 Sustainable urban planning and development approaches .......................................... 9
2.2.1 Rational Planning approach ...................................................................................... 10
2.2.2 Event-based Development approach ......................................................................... 13
2.2.3 Ecosystem approach .................................................................................................. 15
2.3 SUSTAINABLE URBAN PLANNING AND DEVELOPMENT PROCESS ............................................... 18 2.4 SUSTAINABILITY AT PLANNING STAGE ..................................................................................... 22 2.5 LAND USE PLANNING AND DEVELOPMENT CONTROL PRACTICE IN MALAYSIA ......................... 24 2.6 PLANNING AND REGULATIONS GOVERNING RESIDENTIAL DEVELOPMENTS IN
MALAYSIA ............................................................................................................................... 26 2.7 RESIDENTIAL NEIGHBOURHOOD DEVELOPMENT ..................................................................... 27
2.7.1 Definition and characteristics of neighbourhood ...................................................... 28
2.7.2 Neighbourhood types ................................................................................................ 29
2.8 SUSTAINABLE DEVELOPMENT ASSESSMENT IN MALAYSIA ....................................................... 37 2.8.1 Malaysia Quality of Life Index ................................................................................. 38
2.8.2 Malaysian Urban Indicator Network ......................................................................... 38
2.8.3 Green Building Index ................................................................................................ 39 2.9 SUSTAINABILITY ISSUES AMONG DIFFERENT TYPES OF RESIDENTIAL DEVELOPMENT
IN MALAYSIA ........................................................................................................................... 40 2.10 KEY FINDINGS AND RESEARCH GAPS ........................................................................................ 43 2.11 A FRAMEWORK FOR NEIGHBOURHOOD SUSTAINABILITY ASSESSMENT ..................................... 44
2.11.1 Basis for framework development ............................................................................ 44
2.11.2 Triple bottom line and assessment of sustainability .................................................. 46
2.11.3 Multi-attribute evaluation of plans ............................................................................ 48
2.12 PERFORMANCE MEASUREMENT ................................................................................................ 49 2.13 INDICATORS AND SUSTAINABILITY MEASUREMENTS ................................................................ 51
2.13.1 Definitions of indicators ............................................................................................ 51
2.13.2 Development of indicators ........................................................................................ 52
2.13.3 Indicators in physical planning ................................................................................. 53
Page 7
Measuring neighbourhood sustainability: A comparative analysis of residential types in Malaysia v
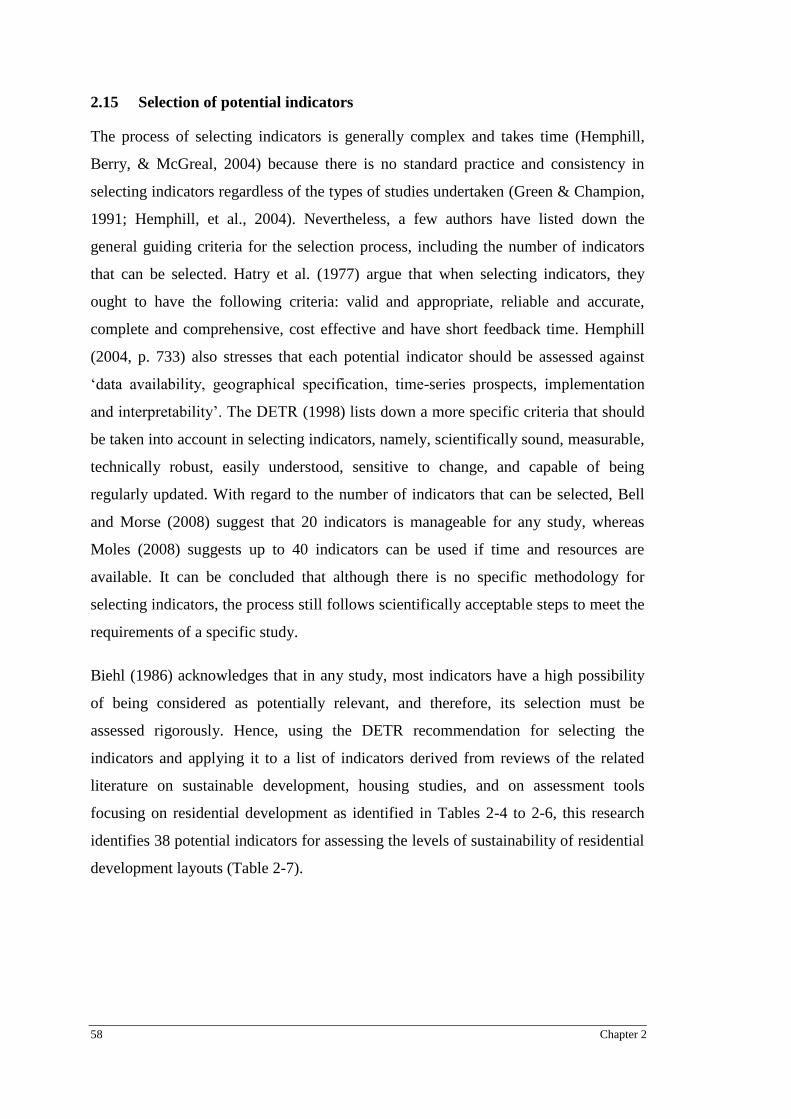
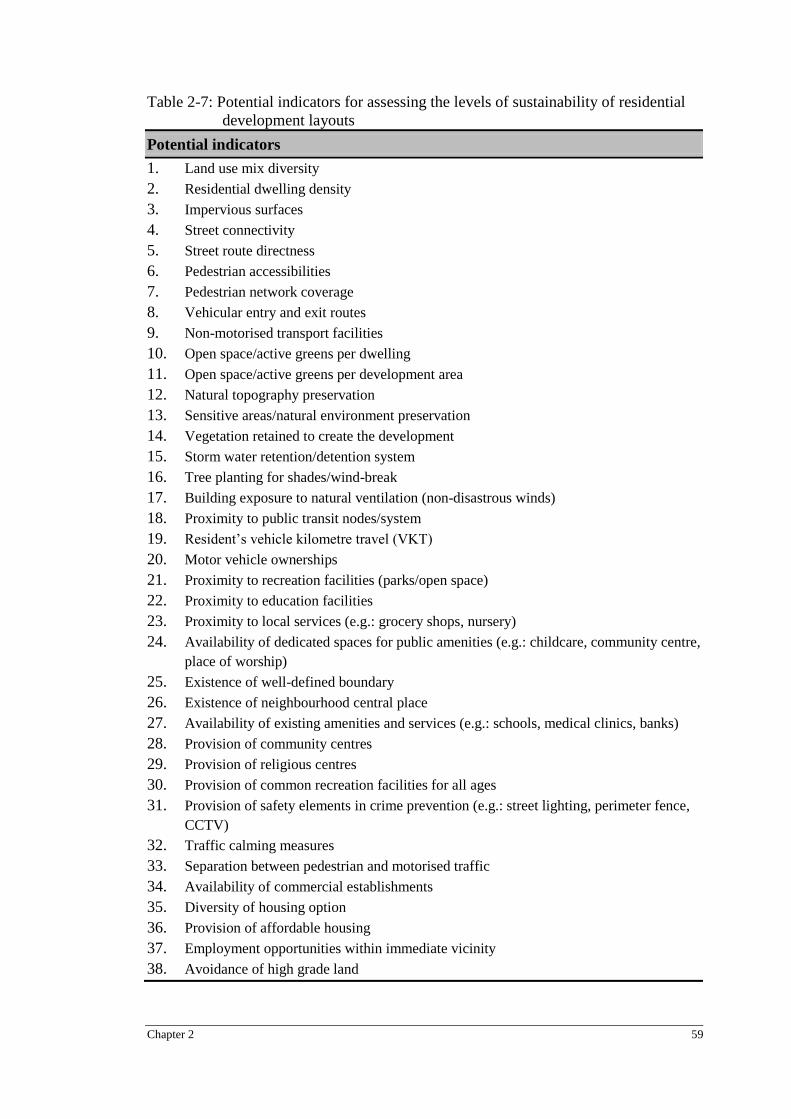
2.14 INDICATORS FOR MEASURING RESIDENTIAL SUSTAINABILITY ..................................................54 2.15 SELECTION OF POTENTIAL INDICATORS ....................................................................................58
2.15.1 Environmental sustainability .....................................................................................60
2.15.2 Social sustainability ..................................................................................................62
2.15.3 Economic sustainability ............................................................................................63
2.16 CONCEPTUAL FRAMEWORK ......................................................................................................64
CHAPTER 3: RESEARCH METHODOLOGY ...................................................................... 69
3.1 INTRODUCTION ........................................................................................................................69 3.2 RESEARCH STRATEGY ..............................................................................................................69 3.3 OVERVIEW OF RESEARCH DESIGN OF THE STUDY .....................................................................71 3.4 COLLECTION OF DATA FOR DELPHI SURVEY .............................................................................73
3.4.1 Questionnaire design .................................................................................................75
3.4.2 Pilot test.....................................................................................................................77
3.4.3 Sample selection of Delphi respondents ...................................................................77
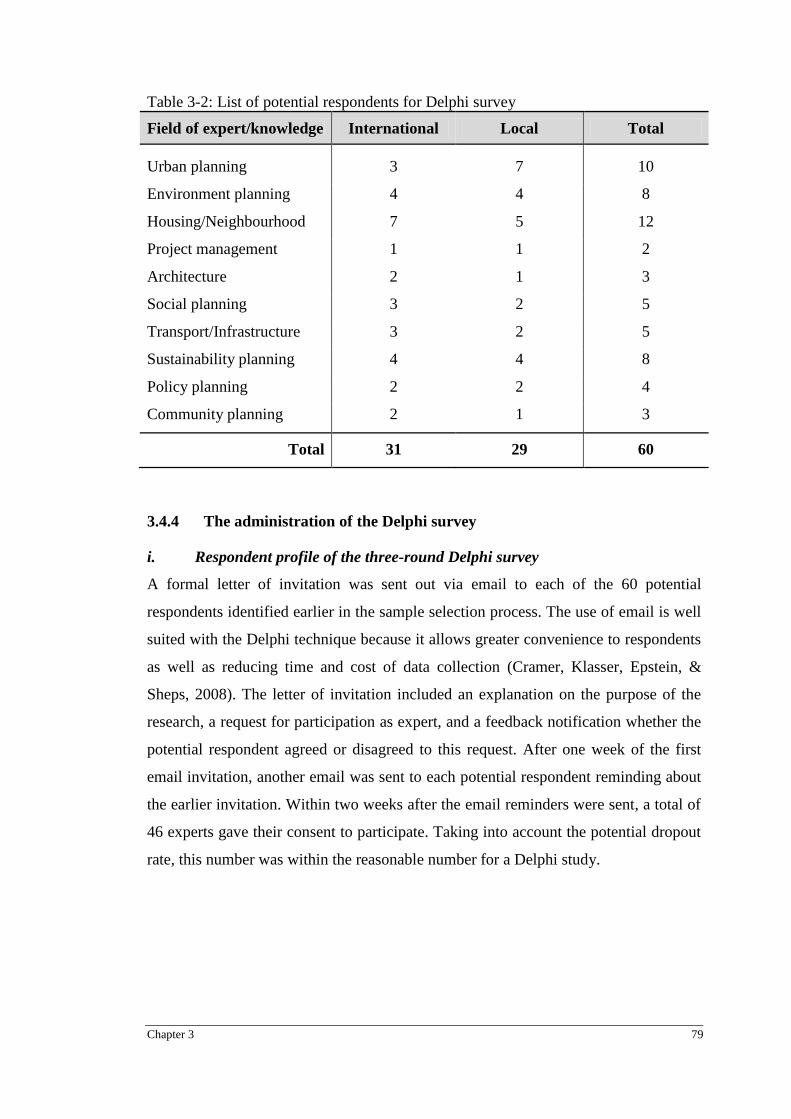
3.4.4 The administration of the Delphi survey ...................................................................79
3.5 COLLECTION OF SPATIAL DATA ................................................................................................85 3.5.1 Case study selection ..................................................................................................85
3.5.2 Case study profile ......................................................................................................87
3.6 ANALYSIS OF DELPHI SURVEY AND SPATIAL DATA ..................................................................92 3.6.1 Analysis to identify relevant indicators to measure sustainability ............................92 3.6.2 Analysis to identify key indicators in contributing to the level of
sustainability .............................................................................................................93
3.6.3 Analysis for normalisation of indicators ...................................................................94 3.6.4 Analysis for assigning indicator weighting and category aggregate for
measuring sustainability ............................................................................................95 3.6.5 Analysis to validate the development of the framework for measuring the
level of sustainability of the neighbourhood .............................................................96 3.6.6 Analysis for comparing the sustainability composite index among the three
types of residential development ...............................................................................97
3.7 SUMMARY ................................................................................................................................98
CHAPTER 4: ANALYSIS TO IDENTIFY KEY INDICATORS FOR
MEASURING SUSTAINABILITY .............................................................................................. 99
4.1 INTRODUCTION ........................................................................................................................99 4.2 IDENTIFICATION OF RELEVANT INDICATORS AND THEIR RELATIVE CATEGORIES
FOR MEASURING THE SUSTAINABILITY OF RESIDENTIAL NEIGHBOURHOOD
DEVELOPMENT .........................................................................................................................99 4.3 IDENTIFICATION OF KEY INDICATORS FOR MEASURING SUSTAINABILITY .............................. 107 4.4 FINAL LIST OF KEY INDICATORS ............................................................................................ 110 4.5 SUMMARY ............................................................................................................................. 111
CHAPTER 5: ANALYSIS OF INDICATOR MEASUREMENT SCORES .......................... 113
5.1 INTRODUCTION ..................................................................................................................... 113 5.2 MEASUREMENT EQUATIONS OF KEY INDICATOR SET ............................................................. 113 5.3 CALCULATION OF MEASUREMENT OUTPUT OF KEY INDICATOR SET ....................................... 117
5.3.1 Land use mix .......................................................................................................... 117
5.3.2 Residential dwelling density .................................................................................. 118
5.3.3 Impervious surfaces ............................................................................................... 119
5.3.4 Internal connectivity ............................................................................................... 119
5.3. 5 External connectivity ............................................................................................. 122
5.3.6 Open space provision ............................................................................................. 124
Page 8
vi Measuring neighbourhood sustainability: A comparative analysis of residential types in Malaysia
5.3.7 Non-motorised transport ......................................................................................... 126
5.3.8 Access to public transport facilities ........................................................................ 127
5.3.9 Access to education facilities .................................................................................. 131
5.3.10 Access to local services ........................................................................................... 135
5.3.11 Access to recreation parks ....................................................................................... 138
5.3.12 Access to community centre ................................................................................... 142
5.3.13 Access to emergency services ................................................................................ 146
5.3.14 Crime prevention and safety .................................................................................. 148
5.3.15 Traffic calming ....................................................................................................... 149
5.3.16 Commercial establishments .................................................................................... 149
5.3.17 Affordable housing ................................................................................................. 150
5.3.18 Housing option diversity ......................................................................................... 151
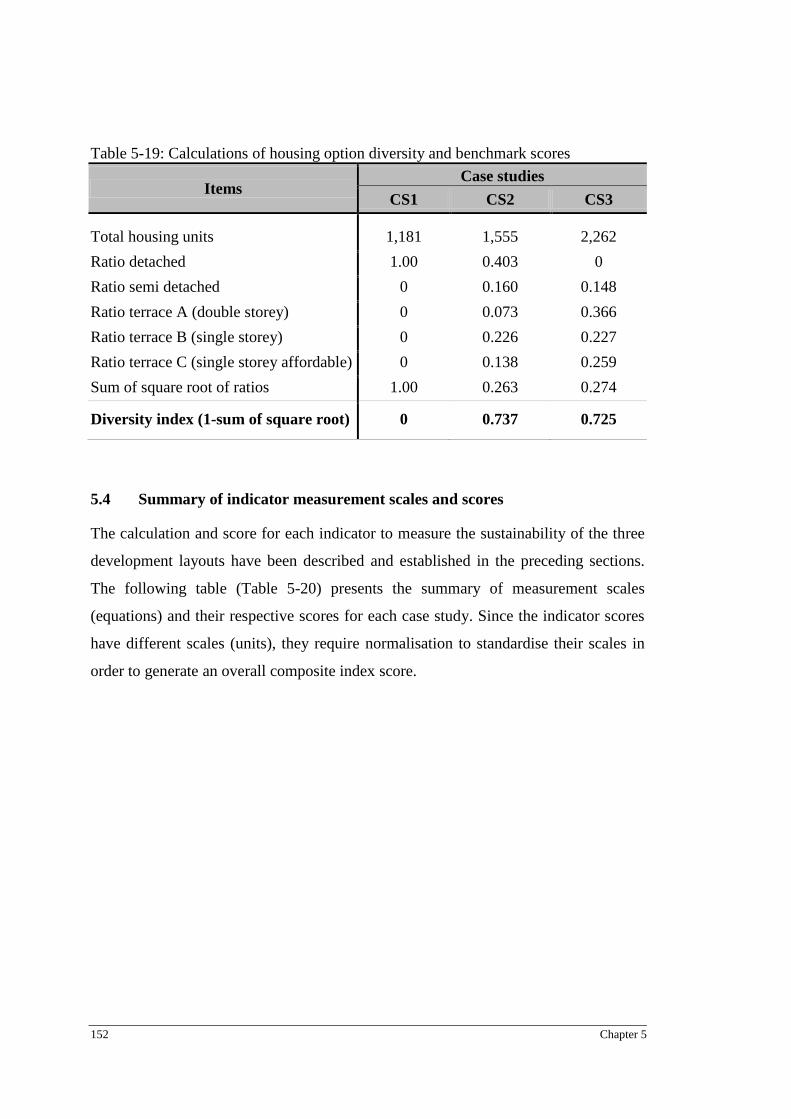
5.4 SUMMARY OF INDICATOR MEASUREMENT SCALES AND SCORES ............................................ 152 5.5 SUMMARY .............................................................................................................................. 154
CHAPTER 6: ANALYSIS OF NORMALISATION, WEIGHTING,
AGGREGATION AND SENSITIVITY ..................................................................................... 155
6.1 INTRODUCTION ...................................................................................................................... 155 6.2 NORMALISATION TECHNIQUES FOR ALL INDICATORS ............................................................. 155
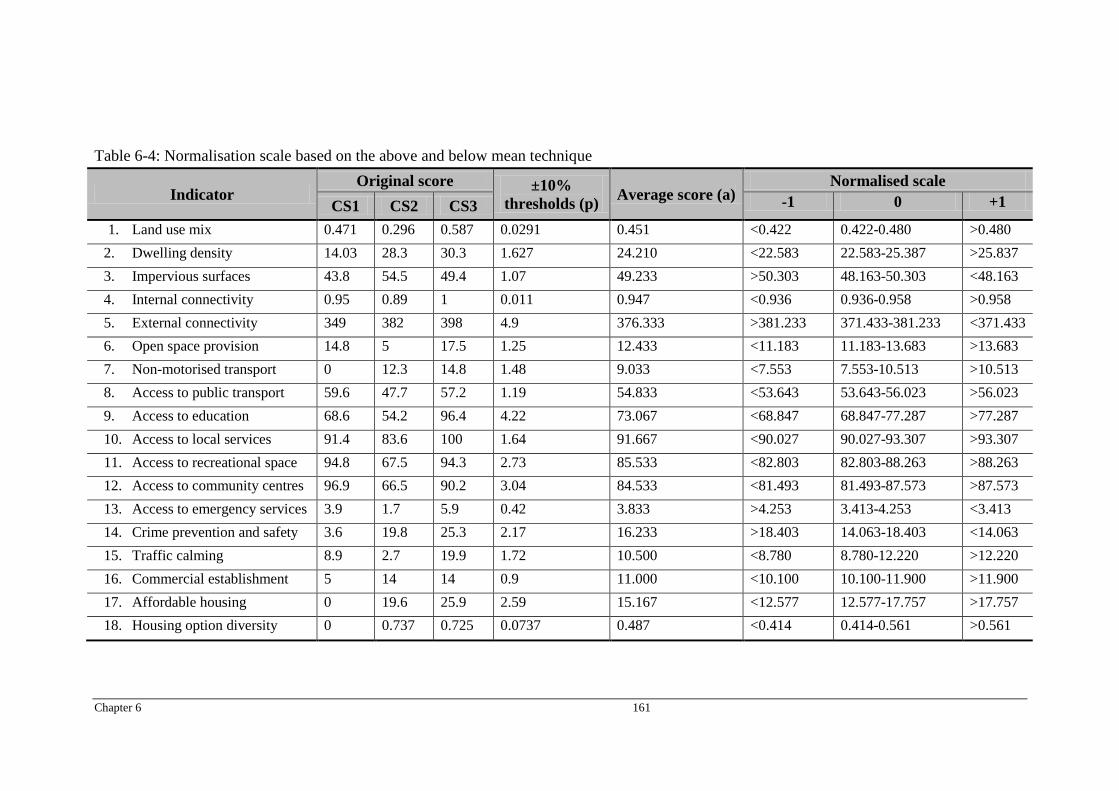
6.2.1 Normalisation procedure based on the categorical scale technique ........................ 156 6.2.2 Normalisation procedure and score based on the above and below mean
technique ................................................................................................................. 160
6.3 INDICATOR WEIGHTING AND CATEGORY AGGREGATE ............................................................ 162 6.3.1 Assignment of indicator weighting ......................................................................... 164
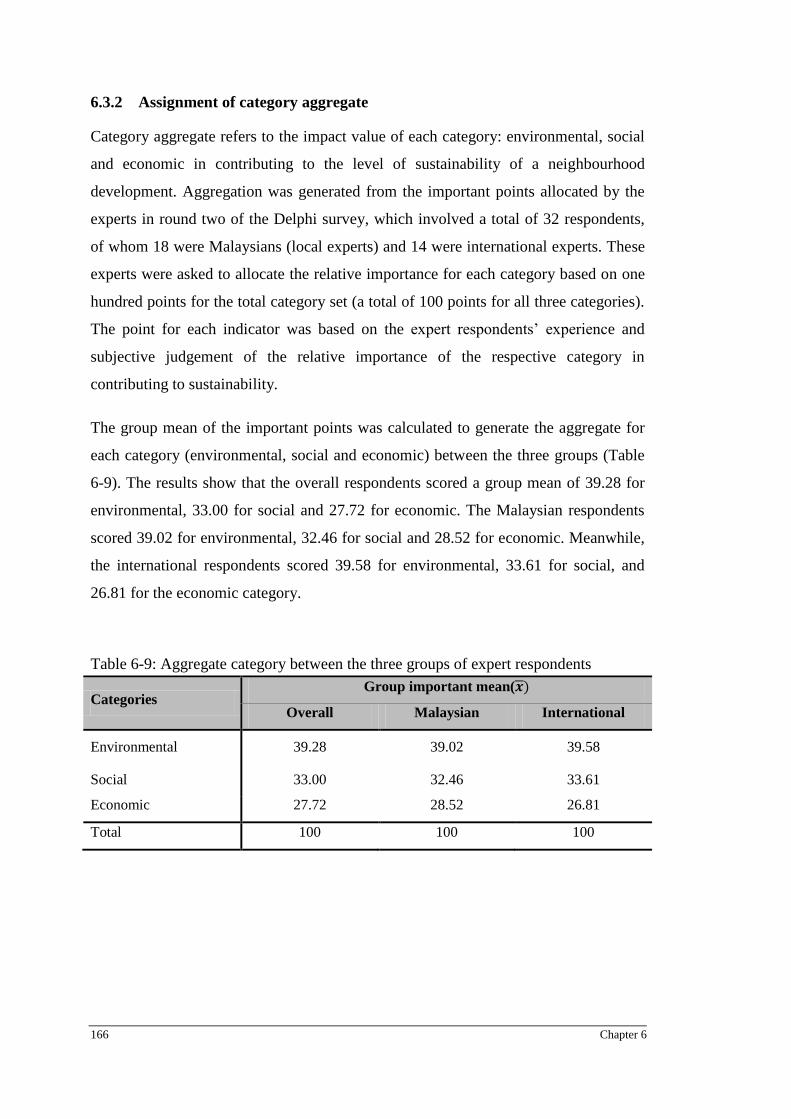
6.3.2 Assignment of category aggregate .......................................................................... 166
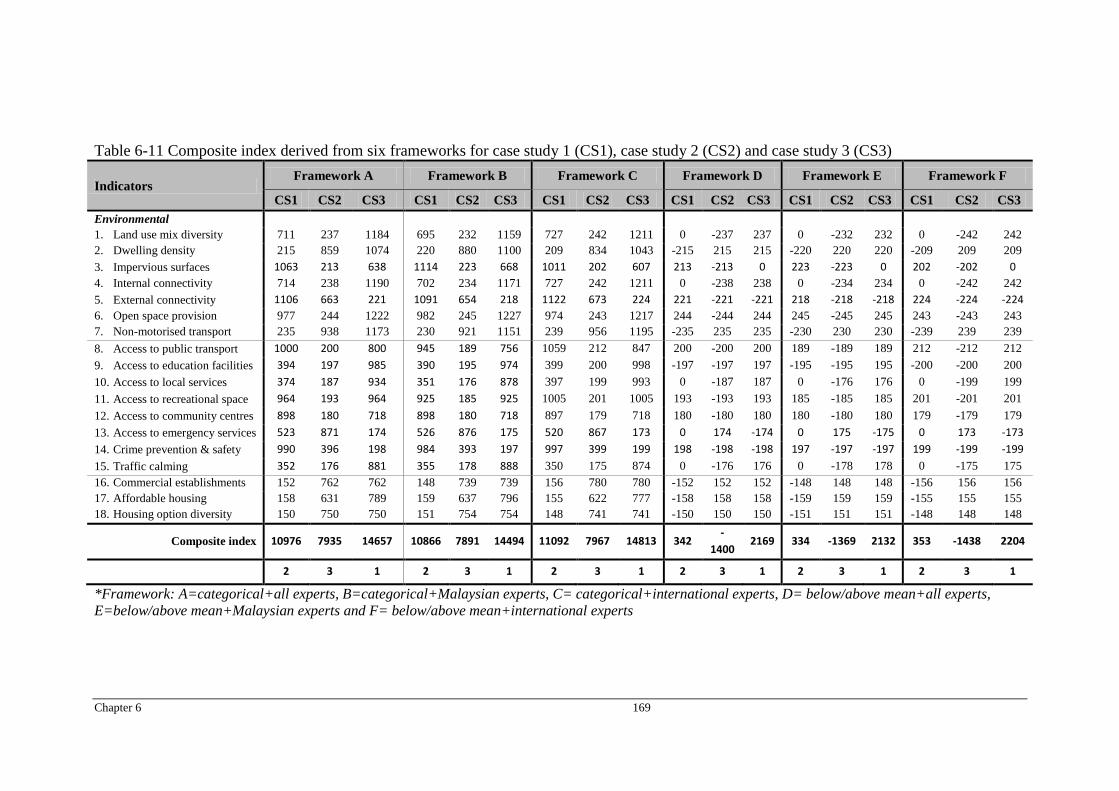
6.3.3 Formulation of sustainability composite index calculation ..................................... 167 6.4 OVERVIEW OF DIFFERENT FRAMEWORKS DEVELOPED BASED ON DIFFERENT
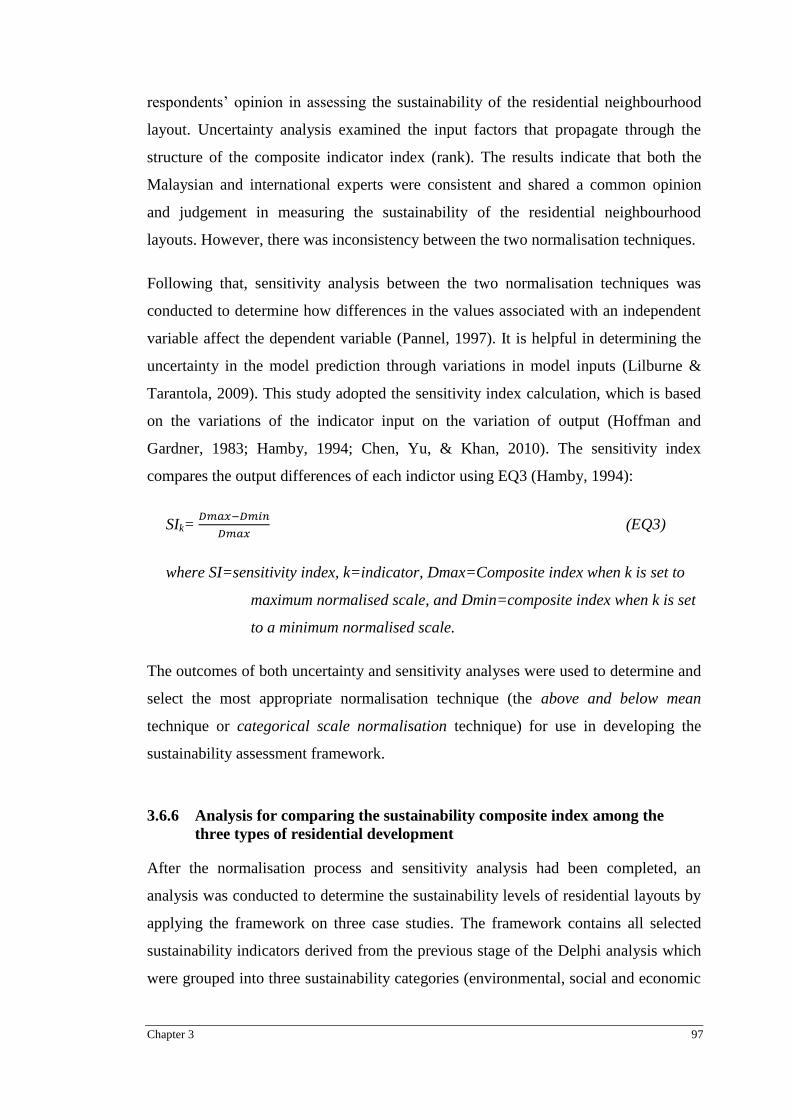
TECHNIQUES........................................................................................................................... 168 6.5 UNCERTAINTY AND SENSITIVITY ANALYSIS........................................................................... 170
6.5.1 Uncertainty analysis between different groups of experts ...................................... 170
6.5.2 Sensitivity analysis between two normalisation techniques .................................... 174
6.6 SUMMARY .............................................................................................................................. 176
CHAPTER 7: DISCUSSION, IMPLICATIONS AND CONCLUSION ................................ 177
7.1 INTRODUCTION ...................................................................................................................... 177 7.2 DISCUSSION OF FINDINGS IN RELATION TO THE RESEARCH OBJECTIVES ................................. 177
7.2.1 Identification of the environmental, social and economic indicators which
can be used to evaluate the level of sustainability of neighbourhood layouts ......... 178 7.2.2 Development of a valid assessment framework based on the indicators
identified for measuring the level of sustainability of neighbourhood
layouts ..................................................................................................................... 181 7.2.3 Application of the assessment framework to different types of
neighbourhood developments in order to determine their level of
sustainability ........................................................................................................... 186 7.3 APPLICATION OF ASSESSMENT FRAMEWORK WITHIN THE MALAYSIAN PLANNING
SYSTEM .................................................................................................................................. 192 7.3.1 The need for assessment framework ....................................................................... 192
7.3.2 Application at planning approval stage ................................................................... 193
7.3.3 Application at post occupation stage ....................................................................... 194
7. 4 SUMMARY OF FINDINGS ......................................................................................................... 195 7.4.1 Case study findings ................................................................................................. 195
7.4.2 Overall findings ...................................................................................................... 196
Page 9
Measuring neighbourhood sustainability: A comparative analysis of residential types in Malaysia vii
7.5 IMPLICATIONS OF THE RESEARCH .......................................................................................... 197 7.6 LIMITATIONS AND RECOMMENDATIONS FOR FUTURE RESEARCH .......................................... 198 7.7 CONCLUSION ......................................................................................................................... 199 BIBLIOGRAPHY ............................................................................................................................... 201 APPENDICES ................................................................................................................................... 221
Appendix A .......................................................................................................................... 221
Appendix B .......................................................................................................................... 222
Delphi round one survey questionnaire ................................................................................ 222
Appendix C .......................................................................................................................... 226
Delphi round two survey questionnaire ................................................................................ 226
Appendix D .......................................................................................................................... 230
Delphi round three survey questionnaire .............................................................................. 230
Page 10
viii Measuring neighbourhood sustainability: A comparative analysis of residential types in Malaysia
List of Figures
Figure 2-1: Traditional rational planning process ......................................................... 12
Figure 2-2: A pipeline, event-based model of development process ............................ 14
Figure 2-3: Tansley‘s ecosystem view .......................................................................... 16
Figure 2-4: Interdependent components of ecosystem approach .................................. 18
Figure 2-5: Relationship among planning, development and ecosystem ...................... 19
Figure 2-6: Sustainable urban planning and development process ............................... 20
Figure 2-7: Administration of land use planning system in Malaysia .......................... 25
Figure 2-8: Linkage between residential development and the three sustainability
elements ................................................................................................... 27
Figure 2-9: Typical traditional village houses in Malaysia ........................................... 30
Figure 2-10: An example of residential neighbourhood developed in piecemeal
fashion ...................................................................................................... 31
Figure 2-11: Examples of detached houses built by lot owners on subdivided lot
parcels ...................................................................................................... 33
Figure 2-12: A typical master-planned residential development in Malaysia .............. 37
Figure 2-13: Six different typological frameworks for sustainability development ..... 45
Figure 2-14: The three pillars of sustainability model .................................................. 47
Figure 2-15: The circle of strategic planning and performance measurement .............. 50
Figure 2-16: Domain-based framework utilising environmental, social and
economic sustainability ............................................................................ 65
Figure 2-17: Conceptual framework of the study developed based on the triple
bottom line sustainability ......................................................................... 66
Figure 2-18: Potential indicators within the conceptual framework of the
research .................................................................................................... 67
Figure 3-1: Research design for the study ..................................................................... 72
Figure 3-2: Case study locations within the city council area ....................................... 87
Figure 3-3: Land use classification of subdivision development case study ................ 89
Figure 3-4: Land use classification of piecemeal development case study ................... 90
Figure 3-5: Land use classification of master-planned development case study .......... 91
Figure 4-1: The structure of Chapter Four .................................................................. 100
Page 11
Measuring neighbourhood sustainability: A comparative analysis of residential types in Malaysia ix
Figure 5-1: The structure of chapter five .................................................................... 114
Figure 5-2: Internal connectivity of CS1 (subdivision development) ......................... 120
Figure 5-3: Internal connectivity of CS2 (piecemeal development) ........................... 121
Figure 5-4: Internal connectivity of CS3 (master-planned development) .................. 121
Figure 5-5: External connectivity of CS1 (subdivision development) ....................... 122
Figure 5-6: External connectivity of CS2 (piecemeal development) .......................... 123
Figure 5-7: External connectivity of CS3 (master-planned development) ................. 123
Figure 5-8: Public open spaces in CS1 (subdivision development) ............................ 125
Figure 5-9: Public open spaces in CS2 (piecemeal development) .............................. 125
Figure 5-10: Public open spaces in CS3 (master-planned development) ................... 126
Figure 5-11: Output of Origin-Destination Matrix analysis showing residential
parcel distance to nearest transit stop in CS3 (subdivision
development) ......................................................................................... 128
Figure 5-12: Output of Origin-Destination Matrix analysis showing residential
parcel distance to nearest transit stop in CS2 (piecemeal
development) ......................................................................................... 129
Figure 5-13: Output of Origin-Destination Matrix analysis showing residential
parcel distance to nearest transit stop in CS3 (master-planned
development) ......................................................................................... 130
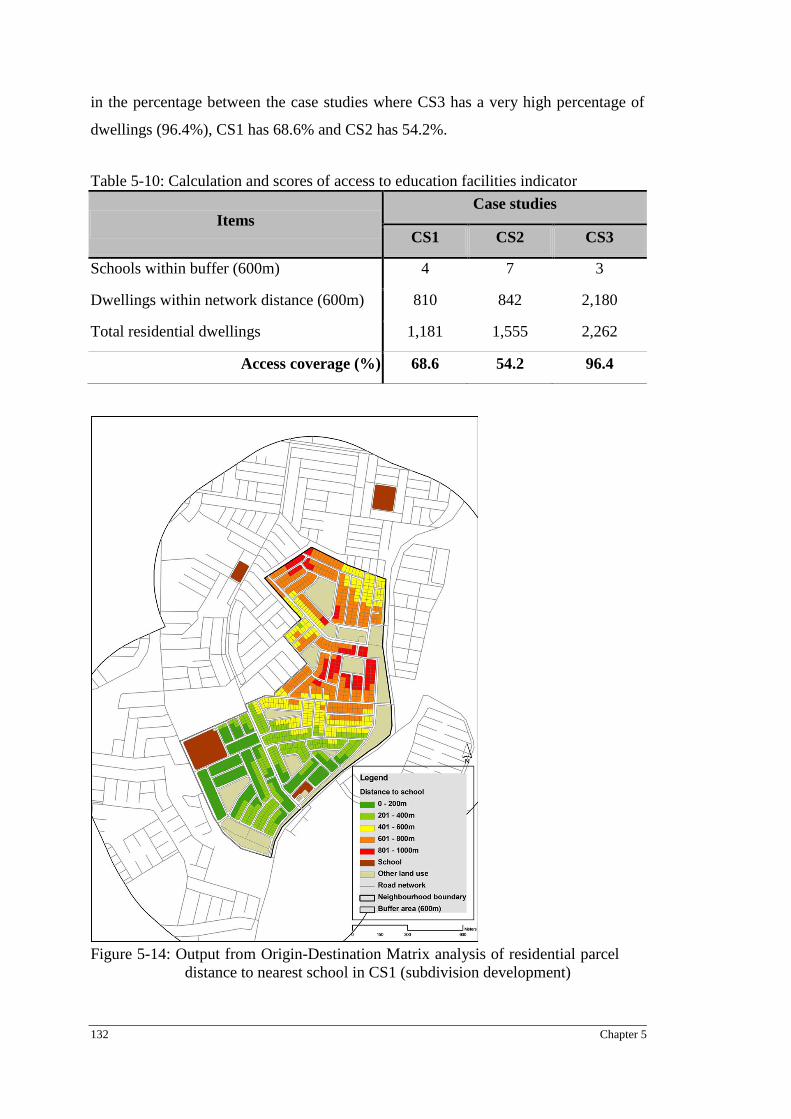
Figure 5-14: Output from Origin-Destination Matrix analysis of residential
parcel distance to nearest school in CS1 (subdivision development) .... 132
Figure 5-15: Output from Origin-Destination Matrix analysis of residential
parcel distance to nearest school in CS2 (piecemeal development) ...... 133
Figure 5-16: Output from Origin-Destination Matrix analysis of residential
parcel distance to nearest school in CS3 (master-planned
development) ......................................................................................... 134
Figure 5-17: Output from Origin-Destination Matrix analysis of residential
parcel distance to local services in CS1 (subdivision development) ..... 136
Figure 5-18: Output from Origin-Destination Matrix analysis of residential
parcel distance to local services in CS2 (piecemeal development) ....... 137
Figure 5-19: Output from Origin-Destination Matrix analysis of residential
parcel distance to local services in CS3 (master-planned
development) ......................................................................................... 138
Page 12
x Measuring neighbourhood sustainability: A comparative analysis of residential types in Malaysia
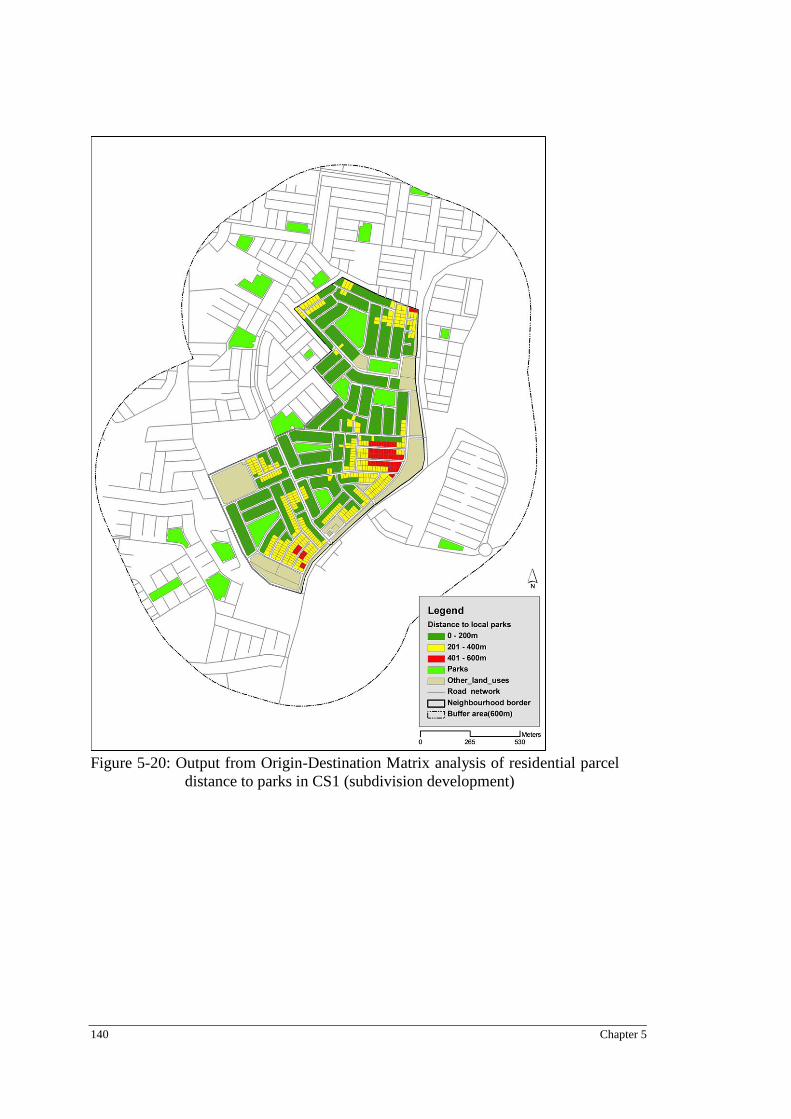
Figure 5-20: Output from Origin-Destination Matrix analysis of residential
parcel distance to parks in CS1 (subdivision development) .................. 140
Figure 5-21: Output from Origin-Destination Matrix analysis of residential
parcel distance to recreation parks in CS2 (piecemeal development) ... 141
Figure 5-22: Output from Origin-Destination Matrix analysis of residential
parcel distance to recreational parks in CS3 (master-planned
development) .......................................................................................... 142
Figure 5-23: Output from Origin-Destination Matrix analysis of residential
parcel access to community centres in CS1 (subdivision
development) .......................................................................................... 144
Figure 5-24: Output from Origin-Destination Matrix analysis of residential
parcel access to community centres in CS2 (piecemeal
development) .......................................................................................... 145
Figure 5-25: Output from Origin-Destination Matrix analysis of residential
parcel access to community centres in CS3 (master-planned
development) .......................................................................................... 146
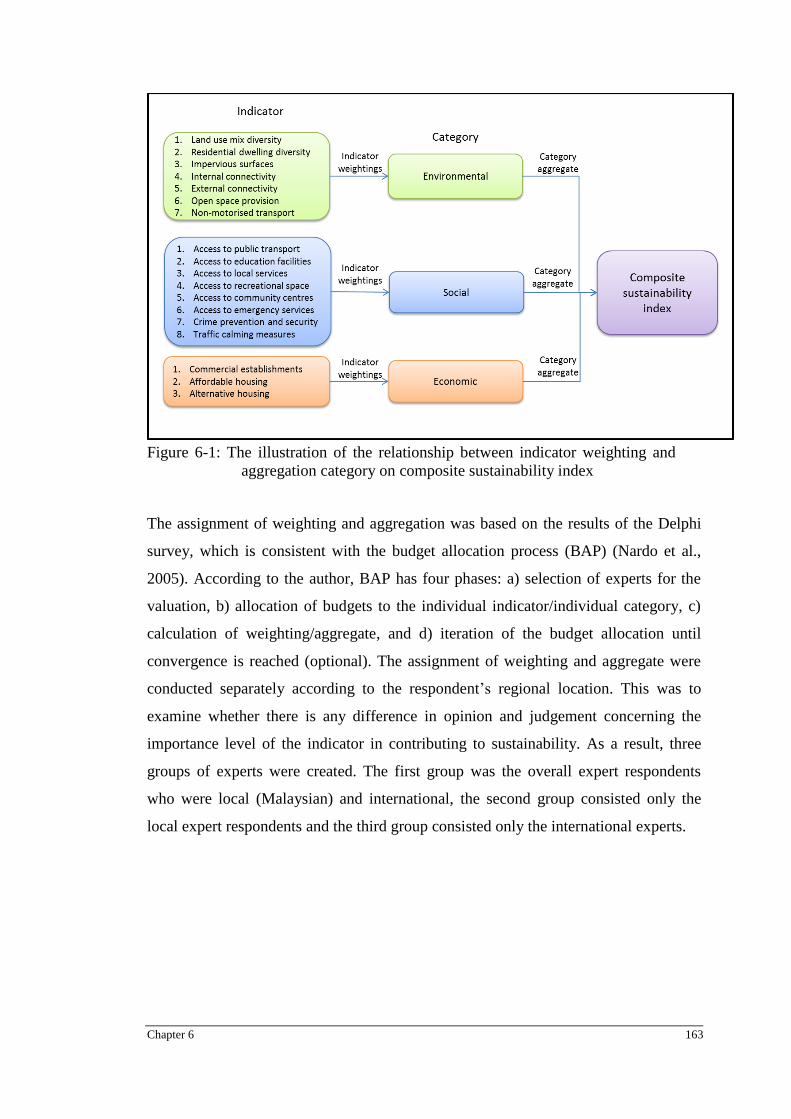
Figure 6-1: The illustration of the relationship between indicator weighting and
aggregation category on composite sustainability index ....................... 163
Figure 7-1: Final list of sustainability indicators according to category ..................... 180
Figure 7-2: Sensitivity index of two normalisation techniques .................................. 184
Figure 7-3: The neighbourhood layout sustainability assessment (NLSA)
framework developed in this study ........................................................ 185
Figure 7-4: Implementation of NSLA at planning approval stage .............................. 193
Figure 7-5: Implementation of NSLA at post completion / occupation stage ............ 194
Page 13
Measuring neighbourhood sustainability: A comparative analysis of residential types in Malaysia xi
List of Tables
Table 2-1: Typologies of master-planned communities ............................................... 36
Table 2-2: Population growth in Malaysia 1980 -2010 ................................................ 40
Table 2-3: Characteristics of the three different types of residential development
in Malaysia ................................................................................................. 41
Table 2-4: Compilation of 80 environmental indicators related to residential
development ............................................................................................... 56
Table 2-5: Compilation of 37 social indicators related to residential development ..... 57
Table 2-6: Compilation of 11 economic indicators related to residential
development ............................................................................................... 57
Table 2-7: Potential indicators for assessing the levels of sustainability of
residential development layouts ................................................................. 59
Table 3-1: Strengths and weaknesses of Delphi technique ........................................... 74
Table 3-2: List of potential respondents for Delphi survey .......................................... 79
Table 3-3: Delphi experts‘ profile for round one .......................................................... 80
Table 3-4: Profile of expert participants in round two of the Delphi survey ................ 80
Table 3-5: Expert participants in round three of the Delphi survey .............................. 81
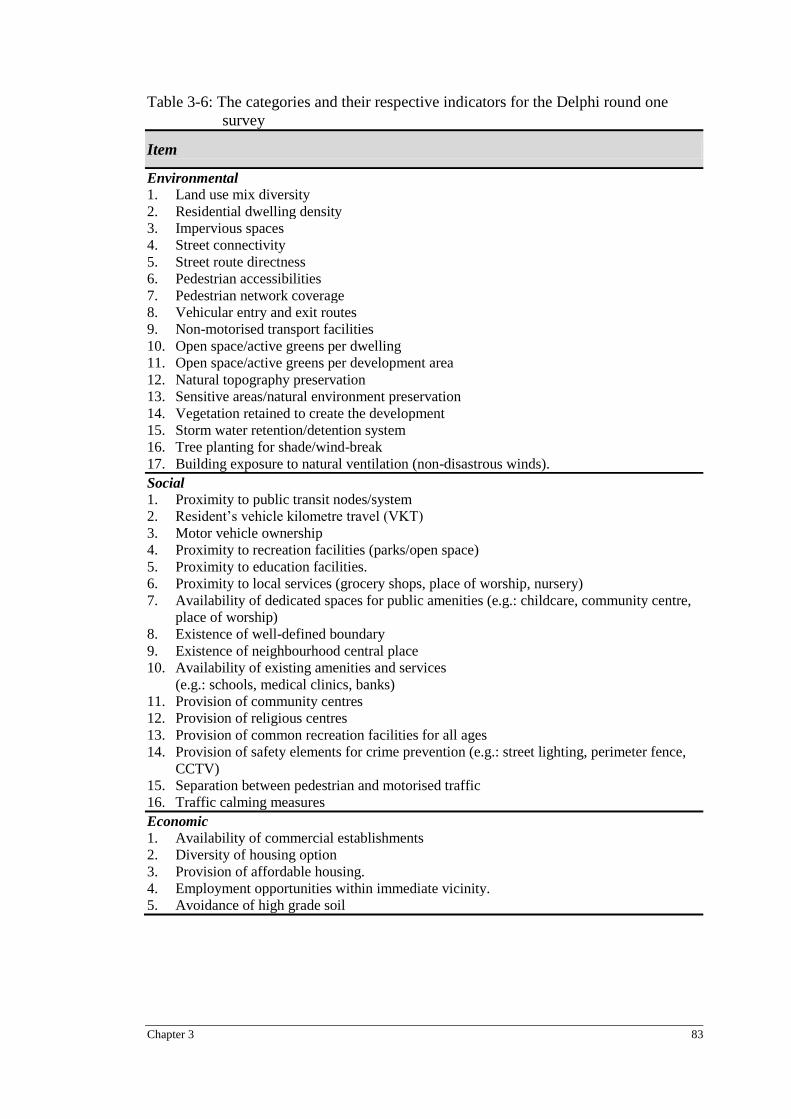
Table 3-6: The categories and their respective indicators for the Delphi round
one survey .................................................................................................. 83
Table 3-7: General description of case study areas ....................................................... 88
Table 4-1: Delphi round one result ............................................................................. 101
Table 4-2: Combining and rephrasing existing indicators .......................................... 104
Table 4-3: Rephrasing existing indicators .................................................................. 105
Table 4-4: Additional new indicators suggested by experts ....................................... 105
Table 4-5: Final indicators derived from the Delphi round one survey ...................... 106
Table 4-6: Delphi round two results ........................................................................... 108
Table 4-7: Final indicators for iteration into Delphi round three ................................ 109
Table 4-8: Delphi round three results ......................................................................... 109
Table 4-9: Final list of sustainable neighbourhood assessment indicators ................. 111
Table 5-1: Description, measurement equation and units of indicator set .................. 115
Table 5-2: Average LUM index for the three case studies ......................................... 118
Page 14
xii Measuring neighbourhood sustainability: A comparative analysis of residential types in Malaysia
Table 5-3: Residential density calculation of the case studies .................................... 118
Table 5-4: Impervious surface calculation .................................................................. 119
Table 5-5: Internal connectivity calculations .............................................................. 120
Table 5-6: Calculation of external connectivity and sustainability benchmark
score.......................................................................................................... 124
Table 5-7: Calculation of open space provision and sustainability score ................... 124
Table 5-8: Non-motorised transport facilities indicator and sustainability score ....... 127
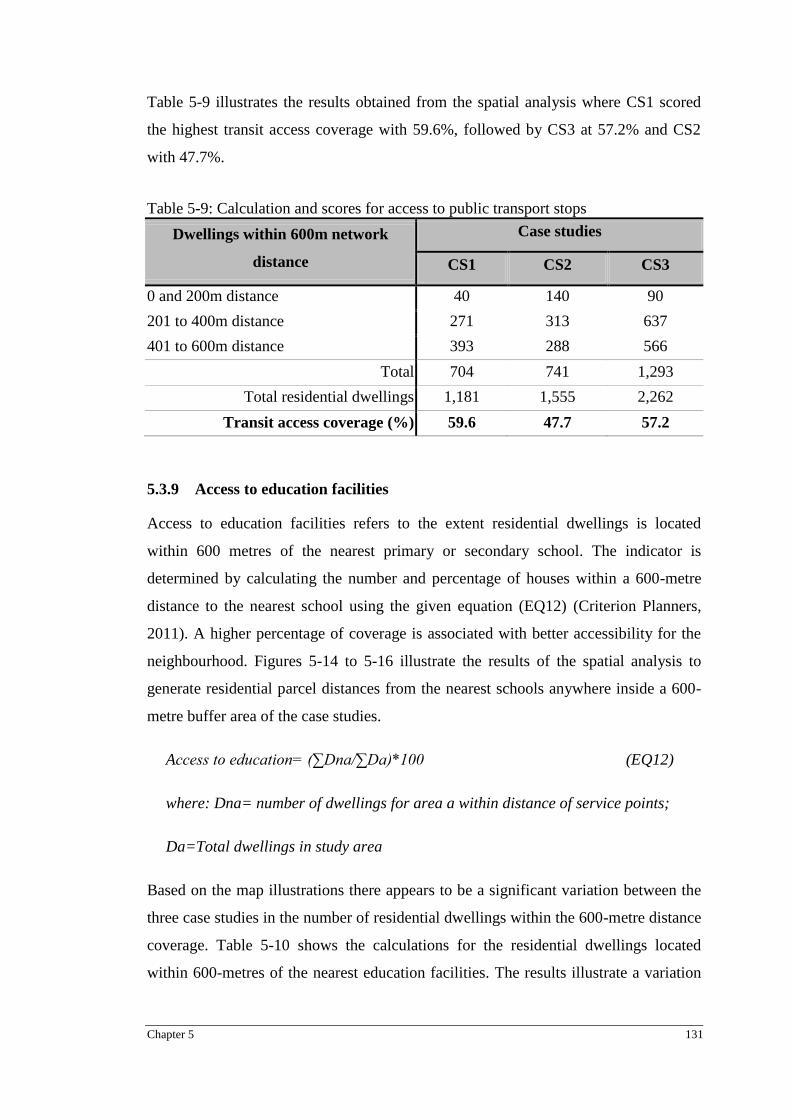
Table 5-9: Calculation and scores for access to public transport stops ....................... 131
Table 5-10: Calculation and scores of access to education facilities indicator ........... 132
Table 5-11: Access to local services within 600m network coverage ........................ 135
Table 5-12: Calculation and scores of access to parks indicator ................................. 139
Table 5-13: Calculation and scores of access to community centre indicator ............ 143
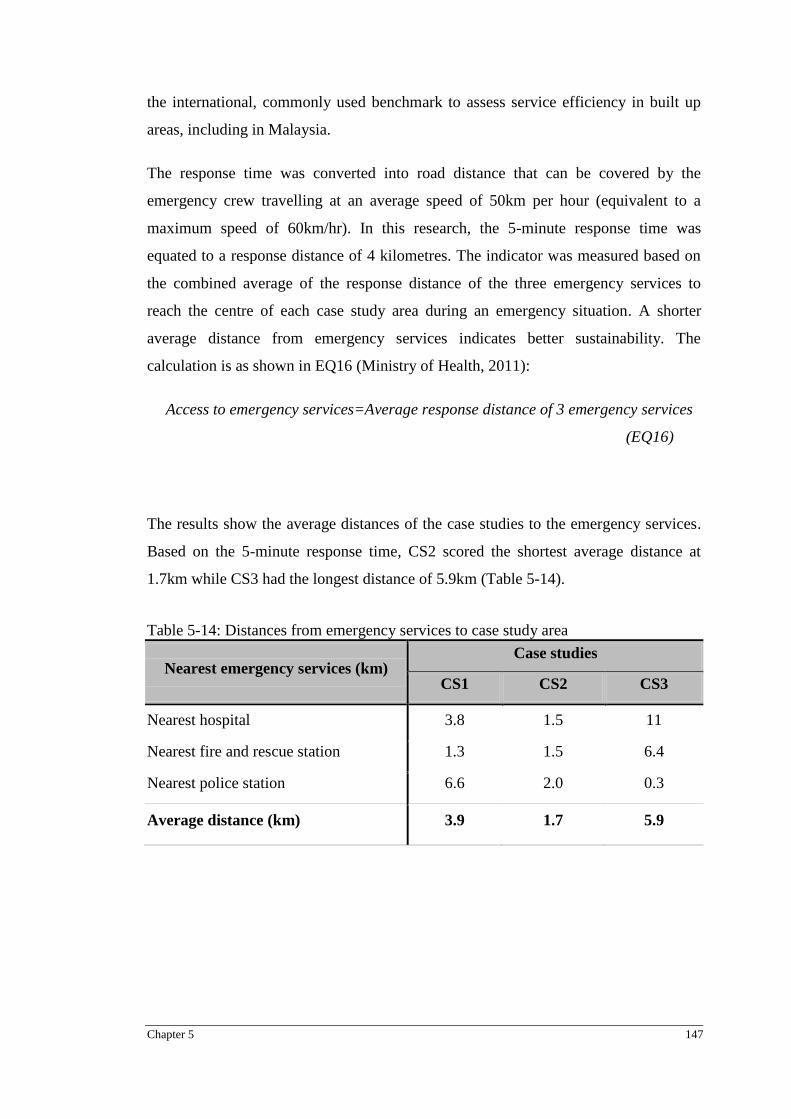
Table 5-14: Distances from emergency services to case study area ........................... 147
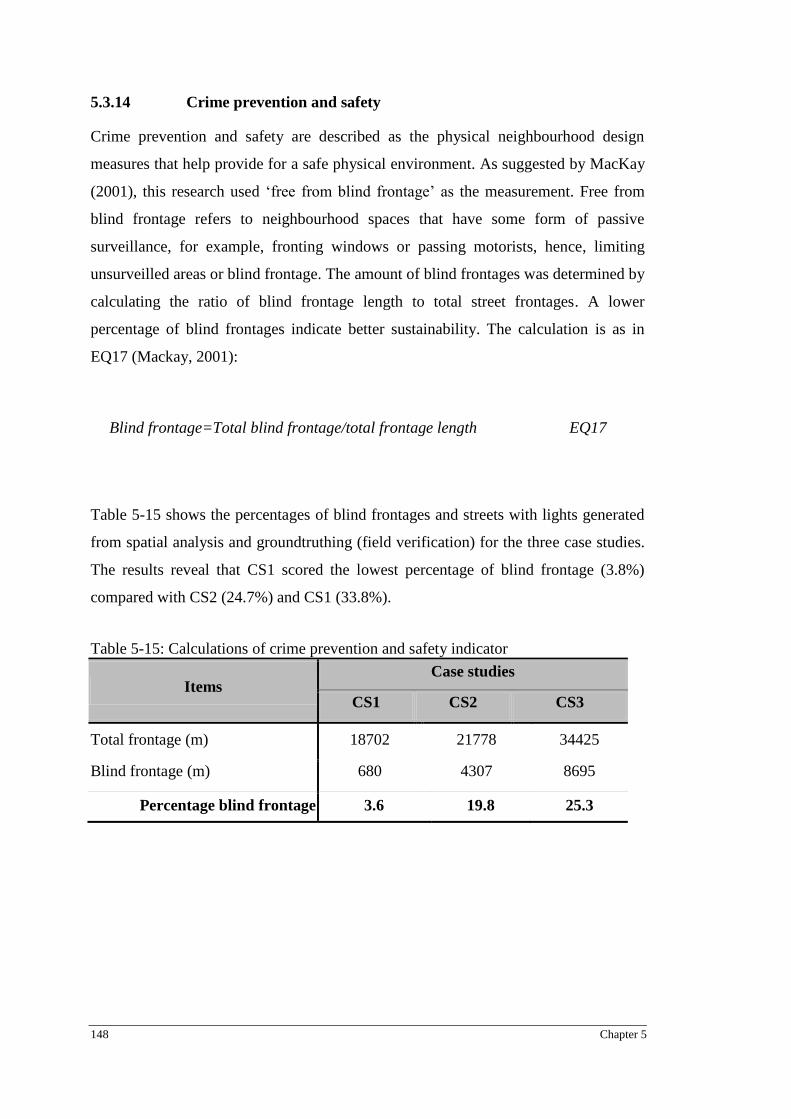
Table 5-15: Calculations of crime prevention and safety indicator ............................ 148
Table 5-16: Traffic calming indicator of residential streets ........................................ 149
Table 5-17: Diversity of commercial establishment types .......................................... 150
Table 5-18: Calculations of affordable housing indicator and sustainability levels ... 151
Table 5-19: Calculations of housing option diversity and benchmark scores............. 152
Table 5-20: Summary of measurement scales and scores of indicators ...................... 153
Table 6-1: The indicator original score and its respective normalised scale .............. 157
Table 6-2: Normalisation scale based on the categorical scale technique .................. 158
Table 6-3: Normalised score based on categorical scale technique ............................ 159
Table 6-4: Normalisation scale based on the above and below mean technique ........ 161
Table 6-5: Normalised score based on above and below technique ........................... 162
Table 6-6: Regional profile of expert respondents in Delphi round two .................... 164
Table 6-7: Regional profile of expert respondents in Delphi round three .................. 164
Table 6-8: Indicator weightings for the three groups of expert respondents .............. 165
Table 6-9: Aggregate category between the three groups of expert respondents ....... 166
Table 6-10: Six frameworks derived from different combinations of
development techniques ........................................................................... 168
Table 6-11 Composite index derived from six frameworks for case study 1
(CS1), case study 2 (CS2) and case study 3 (CS3) .................................. 169
Page 15
Measuring neighbourhood sustainability: A comparative analysis of residential types in Malaysia xiii
Table 6-12 Differences in ranking between three groups of experts based on
categorical scale normalisation ................................................................ 171
Table 6-13 Differences in ranking between three groups of experts based on
above and below normalisation ................................................................ 172
Table 6-14 Differences in ranking between categorical normalisation and above
and below mean normalisation technique based on all experts ............... 173
Table 6-15: Sensitivity index of two normalisation techniques .................................. 175
Table 7-1: Normalised indicator scores derived from category scale and above
and below normalisation techniques ........................................................ 182
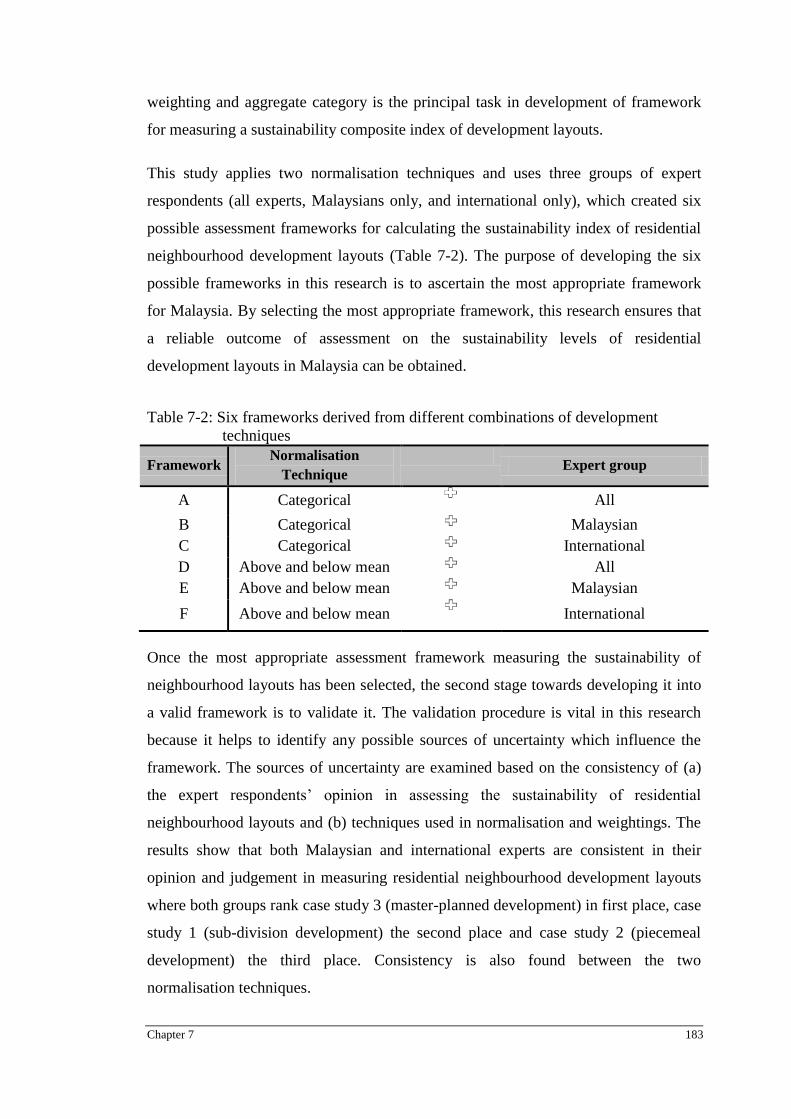
Table 7-2: Six frameworks derived from different combinations of development
techniques ................................................................................................. 183
Table 7-3: Sustainability composite index and rank between different types of
residential neighbourhood development .................................................. 187
Table 7-4: Sustainability level of different indicators of the Master-planned
development ............................................................................................. 188
Table 7-5: Sustainability level of different indicators of the subdivision
development ............................................................................................. 190
Table 7-6: Sustainability level of different indicators of the piecemeal
development ............................................................................................. 191
Page 16
xiv Measuring neighbourhood sustainability: A comparative analysis of residential types in Malaysia
Statement of original authorship
___________________________
SUHARTO TERIMAN
Date: ____/____/_____
The work contained in this thesis has not been previously submitted to
meet requirements for an award at this or any other higher education
institution. To the best of my knowledge and belief, the thesis contains
no material previously published or written by another person except
where due reference is made.
Page 17
Measuring neighbourhood sustainability: A comparative analysis of residential types in Malaysia xv
Acknowledgements
I would like to express my deep appreciation and sincere gratitude to my principal
supervisor, Associate Professor Dr Tan Yigitcanlar, and associate supervisor, Dr
Severine Mayere. Their vast experience in this field of research has proved invaluable,
and their constructive advice and guidance has enabled my PhD research to come to
fruition. I will always remember their kindness and encouragement, which keep me
going strong right till the end of this PhD journey.
I am very blessed to be surrounded by individuals who have provided me with a
supportive atmosphere during my PhD journey. I would like to thank my beloved
wife, Wan Rabiah Wan Omar, for her patience, unending encouragement and for
believing in me; my wonderful children – Auni Batrisyia and Ahmad Asma‘an – for
always being there for me. Their love, care and patience provided me with the strength
to remain focused in my study. Special thanks to my mother and my late father (whose
presence I will always miss), and my parents in law, whose words of inspiration
provided me with the courage to keep my spirit going. My sincere gratitude also
extends to my fellow research students, especially Fatih Dur, who taught me a lot
during the analysis stage of my study.
I am also indebted to my employer in Malaysia, Universiti Teknologi MARA, and the
Ministry of Higher Education, Malaysia, for providing me with invaluable financial
support to pursue my PhD here in Australia. Studying in a foreign environment has
provided me with a great opportunity to learn from other perspectives and experiences
and has taught me to become a more independent and resilient person.
Page 18
xvi Measuring neighbourhood sustainability: A comparative analysis of residential types in Malaysia
Publications
Journal papers:
Teriman, S., Yigitcanlar, T., & Mayere, S. (2009). Urban sustainability and growth
management in South-East Asian city-regions: A comparative policy analysis of
Kuala Lumpur and Hong Kong. Journal of the Malaysian Institute of Planners, Vol 7,
47-68
Teriman, S., & Yigitcanlar, T., (2011). Social infrastructure planning and sustainable
communities: Experience from South East Queensland, Australia. World Journal of
Social Sciences, Vol 1, No 4, 23-32
Book chapters:
Teriman, S., Yigitcanlar, T., & Mayere, S. (2010). Sustainable urban infrastructure
development in South East Asia: Evidence from Hong Kong, Kuala Lumpur and
Singapore. In T. Yigitcanlar (Eds.), Sustainable urban and regional infrastructure:
Technology, planning and management. New York: IGI Global.
Teriman, S., Yigitcanlar, T., & Mayere, S. (2011). Sustainable urban development: An
integrated framework for urban planning and development In T. Yigitcanlar (Eds.),
Rethinking sustainable development: Urban management, engineering, and design.
New York: IGI Global.
Refereed conference papers:
Teriman, S., Yigitcanlar, T., & Mayere, S. (2008). Promoting sustainable urban
development in fast growing city-regions: Practices from Kuala Lumpur and Hong
Kong. Paper presented and accepted into Conference Proceedings: International
Subtropical Cities Conference, 3-6 September 2008, Brisbane, Australia.
Teriman, S., Yigitcanlar, T., & Mayere, S. (2009). Sustainable urban development: A
quadruple bottom line assessment framework. Paper presented and accepted into
Conference Proceedings: Postgraduate Infrastructure Conference, 26 March 2009,
Queensland University of Technology, Brisbane, Australia.
Teriman, S., Yigitcanlar, T., & Mayere, S. (2009). Urban growth management for
sustainable urbanisation: Examples from Asia-Pacific city-regions. Paper accepted
into Conference Proceedings: International Postgraduate Conference, 5-6 June 2009,
Hong Kong Polytechnic University, Hong Kong.
Teriman, S., Yigitcanlar, T., & Mayere, S. (2010). Sustainable urban development:
Formulation of indicator-based residential sustainability assessment framework for
local level. Paper presented and accepted into Conference Proceedings: Knowledge
Cities World Summit, 16-18 November 2010, Melbourne, Australia.
Page 19
Measuring neighbourhood sustainability: A comparative analysis of residential types in Malaysia xvii
Teriman, S., & Yigitcanlar, T., & Severine Mayere (2011). Social infrastructure
planning and sustainable communities: Experience from South East Queensland,
Australia. Paper presented and accepted into Conference Proceedings: Business and
Social Science Research Conference, 3-4 January 2011, Dubai, UAE
Page 21
Chapter 1 1
Chapter 1: Introduction
1.1 Background
Land uses contribute to the sustainability of urban development and their collective
contribution towards achieving urban sustainability has attracted the attention of
scholars to investigate the links between urban development and sustainability (Berg
& Nycander, 1997; Brandon & Lombardi, 2005; Blumenthal & Martin, 2007;
Choguill, 2008; Winston & Eastaway, 2008; Winston, 2010). Whilst urbanisation is
inevitable, growing concern about its undesirable impact has led to an increased
awareness that the development of urban land use should be carefully managed in
order to be sustainable (Bebbington & Gray, 2001; Teriman, Yigitcanlar, & Mayere,
2009). Such impacts arise because of the continued urbanisation and population
growth that increasingly depleting the natural resources and threaten the continued
existence of our balanced ecosystems (Marcotullio, 2004; Becker, 2005; Frame &
Vale, 2006; Jabareen, 2006; Karol & Brunner, 2009).
The sustainability level of urban living spaces has become a major contributor to the
overall sustainable urban development (Choguill, 2008). At the local level, the
concept of sustainability is increasingly influencing the planning of residential
developments. In this respect, residential developments should be a cause of concern
because they constitute a major component of urban land use (Muoghalu, 1990).
There are three main types that comprise the mainstream, and form integral parts of
contemporary residential neighbourhood developments in Malaysia, namely,
subdivision, piecemeal, and master-planned developments. A piecemeal residential
development is characterised by a small scale, normally mixed type housing scheme,
each constructed by different, smaller scale developer in the absence of an overall
blueprint plan for the residential zone. Over time, the whole residential zone will be
fully occupied with various residential projects, each developed independently of the
other, and hence, termed as ‗piecemeal development‘.
Another type of residential is the traditional subdivision developments, which is also
devoid of an overall blueprint plan. This type of development has, over many decades,
been synonymous with the provision of single family housing in suburban areas. The
Page 22
2 Chapter 1
developer or owner subdivided the land into small parcels (for detached dwellings)
and upon approval from the land department, the developer/owner sells the parcels
and the buyers are free to build the house at any time and with their own designs but
subject to planning approvals. The appeal of subdivision developments belongs to
their low-density arrangements that offer attractive, rural-style living and added
privacy. Meanwhile, since the mid-1990s, mega developers in the country have been
developing master-planned housing estates, which consist of large scale mixed types
of housing development on green field agricultural land. The mix of land use in
master-planned developments not only supports and enhances each element within the
development, but also gives residents a rich and diverse environment in which to live,
work, shop, play and learn (ULI, 2003).
Given the impact of residential development on sustainability is important and
together with the rapid progress of residential development, this study is inspired to
investigate the level of sustainability of the three different types of residential
development. Such investigation in Malaysia is new and the finding of this study can
provide fundamental information for planning and developing future residential
neighbourhoods that are more sustainable.
1.2 Research problems and questions
In most Asian countries, the rapid progress of urbanisation, fuelled by migration from
rural areas, has altered traditional land use components (Teriman et al., 2009).
Residential land use is increasingly impacting on sustainability, along with
commercial and industrial uses. Since residential neighbourhoods constitute an
important element of urban sustainability, development decisions during the early
phase of development, especially at layout planning, will have a far reaching effect on
the level of sustainability of neighbourhoods (Friedman, 2005). These decisions range
from, among other things, deciding on the internal circulation and external
accessibility of the neighbourhood, placing of infrastructure and amenities and types
and orientation of residential dwellings in respect of the site characteristics. In this
regard, this research has identified literature gaps in two aspects. First, despite the
importance of neighbourhood layouts on the level of sustainability, limited measures
are available to assess the level of sustainability of residential developments, and
empirical studies to assess the sustainability performance of residential developments
Page 23
Chapter 1 3
are few and far between (Blair et al., 2003). Secondly, of the existing sustainability
assessment frameworks, most of them focus on measuring sustainability at the
regional, national and international levels (Winston & Eastaway, 2008; Winston,
2010).
Given the impact of residential development on sustainability is important and
together with the rapid progress of residential development, this study is inspired to
investigate the level of sustainability of the three different types of residential
development that comprise the mainstream, and form integral parts of contemporary
residential neighbourhood developments in Malaysia (subdivision, piecemeal, and
master-planned developments). Due to these variations, it is unknown which types of
development offer more sustainability value.
As for Malaysia, such investigation is new because no definitive measures have
evolved to gauge the sustainability of layouts at the neighbourhood level. This
deficiency creates a gap that this research attempts to bridge, that there is no way to
measure the sustainability performance of neighbourhood development layouts, which
could provide a basis for comparative analysis between subdivision developments,
piecemeal developments and master-planned developments. The finding of this study
can provide fundamental information for planning and developing future residential
neighbourhoods that are more sustainable. Given the enormous contribution that
residential developments make to urban sustainability (Choguill, 2008), especially in
developing countries such as Malaysia, which record high levels of urbanisation
(Government of Malaysia, 2007; Teriman et al., 2009), it is surprising that such
consideration has taken so long to occur. In light of this scenario, this research
investigates three inherent problems.
First, the findings from the literature suggest that despite relatively advanced
sustainable development policies referring to the importance of residential
developments, indicator sets focusing on residential sustainability are surprisingly
limited, and research into this area is still underdeveloped (Winston & Eastaway,
2008; Winston, 2010). Of those few indicators that could be considered for measuring
residential neighbourhood sustainability, limited knowledge is available concerning
which indicators are most relevant and most important to use in the measurement. The
Page 24
4 Chapter 1
literature findings prompted this research to use the Delphi survey technique to
identify important indicators to measure the level of sustainability of neighbourhoods.
Second, most existing sustainability assessment frameworks focus on measuring
sustainability at the regional, national and international levels. These frameworks use
indicators and benchmark levels as a means to measure progress towards achieving
development sustainability for dimensions, such as economic, environment and social.
Even though it is best to face sustainability issues from a local perspective (Garde,
Saphores, Matthew, & Day, 2010), where most sustainability issues originate from,
limited frameworks, are, however, available to assess the level of sustainability of
residential developments in the subdivision, piecemeal and master-planned
developments.
Lastly, many new master-planned developments market themselves as
environmentally friendly, and provide layouts that encompass sustainable design and
development. However without any form of assessment on its development, it still
remains unknown whether in terms of physical layout design, they are in fact more
sustainable compared to other forms of residential developments.
1.3 Research aim and objectives
The broad research question related to the three aforementioned issues is how to
measure the level of sustainability of different types of neighbourhood developments
in Malaysia? In order to answer this question, a broad aim and specific research
objectives are developed for this research. The broad aim of this research is to develop
a framework for measuring the level of sustainability of neighbourhood developments
and apply it to the three types of residential developments in Malaysia. The specific
objectives of the research are:
i. to identify environmental, social and economic indicators which can be used to
evaluate the level of sustainability of neighbourhood layouts;
ii. to develop a valid assessment framework based on the indicators identified for
measuring the level of sustainability of neighbourhood layouts;
iii. to apply the assessment framework to different types of neighbourhood
developments in order to determine their level of sustainability.
Page 25
Chapter 1 5
1.4 Research methodology
This research employed a mixed-method research strategy and applied an embedded
research design. The use of a mixed method research strategy enables the application
of quantitative and geospatial data to generate important output for analysis.
Embedded research design involves embedding one dataset within the other (in this
case embedding quantitative data into geospatial analysis) so that one type of data
provides a supportive role for the other dataset (Creswell & Plano Clark, 2007). These
sequential stages begin with generating a list of indicators suitable for measuring the
sustainability of residential development layout, and include these indicators in a
sustainability assessment framework. The second stage involves testing the framework
for measuring the sustainability levels of three selected residential neighbourhood
layouts in Malaysia.
1.5 Research significance
This research is seen to be significant and important in respect to its theoretical and
practical contributions. This research contributes to the body of literature by extending
the triple bottom line (environmental, social and economic) sustainability approach in
terms of identifying the set of indicators for the sustainability of residential
neighbourhood development layout in Malaysia. It also expands the literature
concerning the level of sustainability of subdivision, piecemeal and master-planned
developments, as well as the usage of these indicators to the assessment.
This research contributes practically by developing an assessment framework
comprising the environmental, social, and economic indicators specifically to measure
the sustainability of neighbourhood layouts. The framework provides fundamental
information and guidance to policy makers and development agencies when
evaluating and quantifying the level of sustainability of neighbourhood developments.
The framework can also facilitate sustainability comparisons over time in respect of
the neighbourhoods as a means to monitor changes in the level of sustainability. The
sustainability composite index generated from this framework provides evidence to
the policy makers and development agencies as well as raising awareness concerning
the need to develop and maintain a sustainable neighbourhood.
Page 26
6 Chapter 1
1.6 Delimitation of the research
The research was delimited to three selected case studies of different types of
residential developments which are subdivision, piecemeal and master-planned
neighbourhood developments. The proposed assessment framework was
operationalised to determine the levels of sustainability of these residential
developments in terms of their layout design. In identifying the most suitable
indicators for measuring residential layout sustainability, this research also sought
assistance from selected international and local Malaysian experts with professional
knowledge and expertise in sustainability planning within the built environment field.
Although the results are based on the level of sustainability within the three case
studies, these results could only be generalised to the study area municipality. Any
generalisation to other similar neighbourhood developments in other areas in Malaysia
should take into account differences in development guidelines applicable to the
particular areas.
1.7 Outline of thesis
This thesis is organised into seven chapters, which includes an introduction, literature
review, methodology, results from the Delphi survey, results from spatial analysis,
and, finally, a discussion of the results and implications, followed by a conclusion.
Chapter one provides an introduction and overview for this study. Included in this
chapter is a discussion of the background to the research, research problem, aim and
objectives of the research, overview of the methodology used, the significance of the
study, as well as the scope of the study.
This chapter presents a review of related literature. It begins with a discussion of the
literature on sustainable urban development and sustainability considerations in
residential developments. The next section discusses sustainability assessment and the
methods currently in use. The following section reviews sustainability indicators and
lists potential indicators for assessing the level of sustainability of neighbourhoods.
The chapter concludes with a brief summary.
Chapter three provides a detailed description of the research methodology and
discusses how the research was developed and conducted. A description of the
methodology used to address the study objectives is also provided. The choice of an
Page 27
Chapter 1 7
embedded mixed methods approach (Delphi survey and spatial data from layout
analysis) is explained, and each of the method phases is described.
Chapter four identifies the important indicators for measuring sustainability of
residential development layout, and followed by normalisation procedures for the use
in the assignment of indicator weightings. Chapter five presents the analysis carried
out to assign indicator weightings and category aggregate and followed by uncertainty
and sensitivity analyses to ascertain the robustness of the assessment framework in
Chapter six.
Chapter seven presents a discussion of the results and conclusions of the findings. The
findings are discussed according to the research objectives presented in Chapter 1.
The implications of the research include the study‘s contribution to the body of
knowledge and practice. The limitations of the study and recommendations for future
research are also outlined. The chapter finally concludes with an overall comment on
this study.
Page 29
Chapter 2 9
Chapter 2: Literature Review
2.1 Introduction
This chapter reviews the literature relevant to this research, and is organised into
fourteen sections. Following the introduction, the second and third sections highlight
the concept of sustainable urban development and its relationships to urban planning
and its development process. Sections four to six provide an overview of land use
planning and development control regulations in Malaysia. Section seven describes
residential neighbourhood developments and descriptions of the main neighbourhood
types, namely, traditional village development, subdivision development, piecemeal
development, and master-planned development. Section eight describes sustainability
issues among the different types of residential developments in Malaysia. Section nine
highlights the key findings and gaps arising from the literature search, followed by a
description of the framework development in section ten. Sections eleven and twelve
discuss about indicators, their use as a performance measure in sustainability
assessment and potential indicators for assessing the level of sustainability of
neighbourhood developments. Sections thirteen and fourteen discuss indicators for
measuring sustainability levels of residential developments identified from the
literature and the selection of potential indicators this research. Section fifteen
describes the conceptual framework used for this research, while the last section
concludes the chapter with a summary of the main literature.
2.2 Sustainable urban planning and development approaches
Urban land use comprises three main components, commercial, residential and
industrial. As urbanisation grows, competition for urban land use has driven
residential and industrial use away from city centres into the suburbs. Whilst it is
crucial to the process of development and creating a modern state (McGhee, 2008), it
is argued that urban growth, especially residential sprawl, is at the forefront of
environmental damage through the depletion of natural resources to accommodate
development (Karol & Brunner, 2009). In light of these issues, and the fact that
residential use will continue to play an important role in land use planning and
Page 30
10 Chapter 2
distribution, coordination is increasingly viewed as essential to ensure that the
negative impacts of residential sprawl can be minimised and that urbanisation can take
place in a sustainable manner without having to sacrifice the quality of life.
It is acknowledged that urban planning can play this coordination role, because it is
designed to regulate land use activities and ensure adequate provision of necessary
infrastructure and amenities to support the population. It guides these activities
through spatial planning, which has been viewed by experts in the built environment,
especially planners as a key to achieve sustainability at the local level (WHO, 1999;
Ministry of Environment, 2001). This way, planners are in the ideal position to
address development needs and improve the social, ecological, spatial and economical
components towards sustainable future planning.
Since the evolution of urban planning, a number of planning approaches have been
advocated to guide urban planning activities, from top-down rational planning to
participatory and collaborative planning. The evolution of these different planning
approaches through time occurred due to the awareness that ultimately urban planning
needs to make ‗the best decision possible with the resources available‘ (UN-Habitat,
2010, p. 7) including working towards achieving sustainable development. The
following section explains three main approaches/theories that are commonly applied
in the urban planning and development processes in relation (but not limited) to
spatial planning: rational planning theory, the event based development concept, and
the ecosystem approach.
2.2.1 Rational Planning approach
The public authority-oriented urban planning of the 1950s is based on rational
planning, one of the major traditions in planning theory. It refers to a set of planning
processes for selecting and implementing the best possible plan from a number of
alternatives. This concept, which was pioneered by Edward Benfield (1955), sets out a
formal planning process in plan making denoted by a number of steps or courses of
action. According to Schonwandt (2008), Benfield‘s model constitutes four essential
steps: (a) analysing the situation, (b) establishing goals, (c) formulating possible
courses of actions, and (d) comparing and evaluating the consequences of the actions.
The rational model represents what planners believe is rational or to plan with reason.
Page 31
Chapter 2 11
According to Hoch (2007), rationality refers to how we use reasons to guide choices.
Furthermore he argued that people would not support plans lacking reason, because
such reason justifies the content of the plans, and offers rational advice about what to
do for the future.
Lawrence (2000) argued that the rational planning concept has been central to the
evolution of modern urban planning; and its application has resulted in the
development of master planning or comprehensive planning. This concept offers a
systematic forward progression from goal setting to forecasting the impact of
alternatives; and from the selection of alternatives that best achieve public goals to
implementation; and then back again through a feedback loop (Lawrence, 2000;
Berke, Godschalk, & Kaiser, 2006). Using the same basic principles, various authors
have designated these steps in different ways, some refining them more acutely
(Schonwandt, 2008). Berke et al. (2006) for example, discussed the model as an eight-
step process involving: issues identification, goals formulation, alternative
considerations, objectives determination, plan evaluations, plan selection, plan
implementation and finally outcome monitoring (Figure 2-1).
Since its inception in the 1950s, the rational planning model has been a dominant
planning paradigm and received widespread support and application (Lawrence, 2000;
Schonwandt, 2008). The authors also claimed that over time the application of the
model was not limited to physical planning but could be extended to include social
and economic, as well as public policy, politics and corporate planning. It provides
systematic and consistent connection and relationships between each step of the
process, utilising logic and evidence in analysing planning issues and proposals, as
well as providing a common sense way of anticipating the future through its
continuous review along the process (Lawrence, 2000; Berke, et al., 2006).
Proponents of rational planning also point out other characteristics of this model,
including systematic applications of reasoning, bringing forth unitary public interests,
providing a controllable environment and enabling the implementation of the final
plan making process. One characteristic that stands out, especially among
practitioners, is that the role of planners as expert advisors is well defined (Lawrence,
2000). Owing to these practicalities, rationalism is currently being applied in most
Page 32
12 Chapter 2
Figure 2-1: Traditional rational planning process (adapted from Benfield, 1955 and
Berke et al., 2006)
general and sectoral plans, where it takes into account the descriptive courses of action
that ought to be taken during the process and allows for the inclusion of various
facilities and land requirements to accommodate changes or forecast variables
including population, economy, natural resource conditions and housing needs (Berke,
et al., 2006).
Opponents of the rational planning model, however, have listed a number of criticisms
of the model. Wachs (2001), for example, argued that in considering alternative plans,
the use of assumptions and logic based on expert opinions, and when not being
disclosed to the public, will have a tendency to invite public opposition as these plans
may not be compatible with public concerns and values. Furthermore, Lawrence
(2000) purports that rationalism is weakened when implemented because it neglects
the central role of dialogue in planning and fails to integrate substantive issues, such
as social and environmental needs in the design process. He adds that the model tends
to overestimate the ability to predict and control the environment, as it relies on the
Page 33
Chapter 2 13
consequences of trends and emerging conditions to give numerical projections of
future accounts, and not the more meaningful, mental picture or inspirational view of
what the future is going to be (Lawrence, 2000; Berke, et al., 2006).
Despite these criticisms, rational planning concepts still prevail, especially in planning
practice. One explanation for the renewed interests in the concept is attributed to the
fact that psychologically, it provides reassurances to planners and practitioners as part
of the decision-making process. In consideration of the advantages and shortcomings
of the model, it is understood that some form of stakeholder input should be
embedded into the model to create a publicly acceptable form of urban development
process. Berke et al. (2006, p. 48) contended that the criticisms directed at rationalism
―could not be justified if the rational planning model were to incorporate various
aspects of consensus building and the participatory design models of planning‖. These
arguments have led to the following discussion on the relationship between planning
and implementation.
2.2.2 Event-based Development approach
Clarke (1995) argued that the traditional, comprehensive master-planning approach to
urban planning and implementation has often been ineffective because too much
emphasis has been put on plan-making, whilst on the implementation (or development
side), the emphasis has been comparatively less. In attempting to highlight the
importance of the implementation issue, Healey (2008) identified four different types
of model to represent the general development process. These included the
equilibrium model of neo-classical economies, the event-sequence model from an
estate management perspective, the agency model from an institutional perspective
and the structure model which is grounded in urban political economy. However,
when considering the land development process, these models lack specific focus on
planning related implementation. Gore and Nicholson (1991) intimated that the nature
of the land development process is very complex and no single model can entirely
represent such a process. Notwithstanding, one interesting model that depicts the
relationship between the planning and development process, and focuses on the
sequence of events of this process, is the event-based development model (Adams,
1994).
Page 34
14 Chapter 2
Barrett et al. (1978) developed an event-based approach to the development process
that can be divided into four distinct phases: evaluation, preparation, implementation
and disposal. According to Adams (1994), one of the best event-based models is the
development pipeline concept (Figure 2-2). This model reduces the multiplicity of the
development process into three broad events, starting with development pressures,
subsequently, development feasibility, and finally implementation, which includes
construction and transfer of completed development. In practice, the model operates
as a spiral, producing a fresh pattern of land use at the end of each cycle, therefore,
highlighting the dynamic nature of the development process.
Figure 2-2 shows that the initial development pressures and prospects all constitute
part of the planning stage. In fact, the implementation process starts towards the end
of the development feasibility section, involving evaluation of physical and market
conditions, and proceeds with legal and administrative procedures prior to
construction on the ground. In the case of residential developments, the construction
may be undertaken by the developers themselves; however, commercial developers
Figure 2-2: A pipeline, event-based model of development process (adapted from
Barrett, 1978 and Adams, 1994).
Page 35
Chapter 2 15
more commonly reassign the jobs to building contractors, under the supervision of a
professional team comprising among others, architects, engineers and quantity
surveyors (Adams, 1994).
Upon completion of the construction phase, the project moves into the final stages of
delivery and onto purchasers for occupation. This completes the full cycle of the
implementation process. With sustainability concerns currently in advanced stages,
especially, in developed countries, sustainable urban development has become a major
influence in the physical planning of the built environment and should be looked at
more closely. This will be elaborated upon in the following section.
2.2.3 Ecosystem approach
Spatial planning was traditionally carried out to achieve economic and social
objectives. It has long been observed that the promotion of a sustainable urban future
was not often incorporated into the process. As a result, it is argued that the planning
process did not provide a satisfactory means of protecting the environment, especially
from the negative cumulative environmental effects of development and expansion of
urban areas (Neufeld, Cockfield, Fox, & Whitelaw, 1994). Attempts to include
planning with ecological principles and green design have been around for four
decades and were obvious in the work of Ian McHarg‘s (1969) Design with Nature
and Frederick Steiner‘s The Living Landscape (1991). Additionally, Arendt (2004)
also introduced the basic principles of green neighbourhood design into local planning
and ordinances. However, as Berke et al. (2006, p. 393) argued, these ideals of green
communities of the early twentieth-century did not take root in contemporary planning
practice. The author also contended that even though the increasing consensus pointed
to the positive effects of the green dimension towards sustainable urban form, efforts
to integrate the dimension into the building of human settlements is far from effective.
Notwithstanding, the drive towards a sustainable urban future must also take account
of our ecosystem, upon which we ultimately depend. The importance of a functioning
ecosystem including for human life is well recognised within the concept of
sustainability and ecological integrity (Rainham, McDowel, & Krewski, 2008).
However, there is always the tendency that attempts to improve human well-being
will threaten this integrity. As highlighted by McGranahan et al. (2001), the urban
Page 36
16 Chapter 2
environmental transition theory suggests that urban development expansion leads to a
series of environmental challenges, which are often localised, immediate and health-
threatening. However, as cities expand and increase in affluence, these challenges
become global, long-term and ecosystem threatening, and may jeopardise the future
sustainability or healthy existence of the world ecosystem (McGranahan, et al., 2001).
The transition of ecological planning, from nature to community, was first recognised
by Arthur Tansley, who, in 1935, proposed the ecosystem concept, which incorporates
components from all plant communities, the biotic environment and the physical
environment (Vasishth, 2008; Pickett & Grove, 2009) (Figure 2-3). In other words,
Tansley expounded that it is the relationships between organisms and their
environment that provides the perspective for ecology (Yang & Lay, 2004).
Figure 2-3: Tansley‘s ecosystem view (adapted from Vasishth, 2008)
Odum (1989) enhanced the ecosystem concept to the whole environment, including
urban system, and argued that the human man-made environment received energy and
material flows at a faster rate than the natural environment. Lyle (1985) made Odum‘s
concept more operational in a planning sense by introducing the ‗human ecosystem‘ in
Page 37
Chapter 2 17
which he maintained that human advancement has compromised nature, and is
continuously replacing the efficient ecosystem with an inefficient system that
threatens our source of sustenance. He introduced what he called regenerative
technology (Lyle, 1994), which replaces and alters the materials and energy that
humans use, and integrates art and science to optimise nature‘s ability to regenerate.
An ecosystem approach to land-use planning processes provides systematic guidance
on the interrelationship between human activities and ecosystem health. This approach
places an importance on the ecological context in decision-making and the evaluation
of the human-natural relationship. In other words, it treats ecological goals equally to
and simultaneously with economic and social goals, and, further, acknowledges that
there are limits to the degree of stress ecosystems can accommodate before they are
irreversibly degraded or destroyed (Neufeld, et al., 1994). An important aspect of this
approach is the ‗adaptive management‘ strategy: rule and management criteria flexible
enough to handle changing biophysical and human-related events, and shifting goals
(Marcotullio, 2004).
Neufeld et al. (1994) said that the ecosystem approach, as illustrated in Figure 2-4,
includes five major, interdependent components: (a) boundaries for planning purposes
(use of biophysical boundaries within which human-nature interaction is assessed), (b)
environmental objectives and targets (focusing on protection and natural regeneration
of ecosystem), (c) evaluation of cumulative environmental effects, (d) information
collection and management, and (e) monitoring (objective achievements and
effectiveness of planning decisions). The ecosystem approach provides a promising
technique: it uses ecosystems as the regional units for planning, and integrates
biophysical issues with social and economic issues. Moreover, a more efficient
development review process (evaluation) can be realised through the ecosystem
planning approach because it delivers better up-front guidance on the location, type,
and timing of development.
Page 38
18 Chapter 2
Figure 2-4: Interdependent components of ecosystem approach (adapted from
Neufeld, et al., 1994)
Neufeld et al. (1994) believe that the integration of ecosystem considerations into
planning will promote urban sustainability initiatives because it will prevent
development decisions from jeopardising the future ecosystem and human health.
Therefore, where the ecosystem and human health remain intact, potential costly and
difficult remedial actions can be avoided. Neufeld‘s argument is also supported by
Niemela (1999) who emphasised that ecological information needs to be seriously
considered in urban planning to ensure the sustainable development of urban areas.
2.3 Sustainable urban planning and development process
Based on reviews of these three approaches, it can be seen that the rational planning
(Figure 2-1) and the event-based development approaches (Figure 2-2) fundamentally
involve two distinct but interrelated cycles. The ecosystem approach (Figure 2-4), on
the other hand, reflects the growing concern for the sustainability of the urban
development process. Proponents of ecosystem theory believe that the development
process should take place within the limit of what the ecosystem can withstand. In
other words, urban planning and development processes should operate within the
limits of the ecosystem boundary in order to achieve sustainability in the long run.
Therefore, it is possible to integrate these three important components–planning,
implementation and ecosystem sustainability–into urban planning and development
Page 39
Chapter 2 19
process to create a sustainable-oriented urban planning and development culture
(Figure 2-5). In this regard, planners (who historically see themselves as defenders of
socio-economic equality) will see their roles further enhanced–as reconciling agents in
promoting economic growth; in ensuring physically balanced growth distributions;
and, at the same time, in ensuring the protection of the ecosystem (Campbell, 2003).
However, this is challenging as planners need some form of sustainability assessment
mechanism integrated into the planning process. The purpose of such assessment is to
determine whether the activities undertaken within each stage in the development
process contribute to the targeted sustainability goals.
Figure 2-5: Relationship among planning, development and ecosystem
Collectively, the components illustrated in Figure 2-5 contribute to the outcome of the
final concept of sustainable-oriented development process which involves planning,
implementation, and sustainability evaluation to achieve a desired future settlement
(Figure 2-6).
Each component in the process includes a list of criteria or variables, some of which
may require particular evaluation techniques. This integrated planning and
implementation process begins with defining the planning issues and goals, which
may involve any one or all three aspects (environmental, social and economic). Once
identified, the goals and objectives are refined in step 2, taking into account the
priority ones. In step 3, alternatives are generated, and based on the achievement of
selected goals and intended objectives. In step 4, these alternatives are thoroughly
assessed, subsequent to a collaborative understanding between experts and the
stakeholders. Sustainability is among the criteria of the assessment.
Page 40
20 Chapter 2
Figure 2-6: Sustainable urban planning and development process
Page 41
Chapter 2 21
Once the best alternative is selected, it goes through the first round of sustainability
evaluation, with the purpose of ensuring that it meets the sustainability criteria or
levels being set. In the case that it falls short of this assessment, the selected
alternative/plan will be returned to the stage(s) where the shortfall occurs. If however,
it meets the evaluation requirement, the alternative/plan will go to the beginning of the
implementation process (step 5), involving a feasibility evaluation of the proposed
development. It will then proceed to the construction stage (step 6), where various
administrative procedures and funding arrangements will have to be met and
organised. Construction progress is regularly monitored to ensure compliance with the
development plans and financial resources. In step 7, the construction project will
have been completed and upon finalisation of paperwork and administrative
procedures, it is delivered to the buyers or stakeholders. Finally, in step 8, a fixed
period is set for monitoring the just delivered/commissioned project to ensure any
defects/deficiencies arising from the construction of the project are remedied.
The second round of sustainability assessment takes place after this stage, but not until
the project has been occupied or is in operation for a certain acceptable period, where
the owners/occupiers have been well adapted to the development and environment
around them. Compliance with sustainability evaluation characteristics means such
projects are contributing towards a sustainable urban future whilst non-compliant
projects will be subject to a re-evaluative process, for future project improvement. For
existing projects, the re-evaluation may require retrofitting be undertaken where
applicable.
It should be noted, however, that in consideration of the differing views on planning
and development processes put forward by the various researchers, the addition of
consensus building and participatory design efforts is necessary to rectify the
shortfalls of the rationalist philosophy. Indeed, consensus building has become the
reigning paradigm in planning theory since the 1990s as it brings together major
stakeholders to address controversial issues and to reach an agreement on these issues.
Furthermore, this approach supports a shift in the role of planners, from one of merely
providing expert opinion and technical leadership, to another important role of
mediating between and communicating with stakeholders (Innes & Booher, 1999;
Healey, 2006). Planners listen, provide information, and foster convergence among
Page 42
22 Chapter 2
the different interests and ensure no parties are disadvantaged during the process
(Healey, 2006).
In the era of increasing concern for sustainability in the built environment, an
integrated framework that incorporates both rationalised planning and development
processes, executed within the limitations of the ecosystem, can be seen as one way of
continuing the urbanisation process in a sustainable manner. In addition, by having
some form of sustainability assessment throughout the process, people would be able
to know whether sustainability elements exist in the planning and implementation
stages and, if so, whether they, have really been achieved and implemented, and
appreciated by the end user. Furthermore, such an integrated framework would enable
the community to create, implement and adapt plans that progressively guide change
in ways that balance the multiple goals of sustainable urban development (Berke, et
al., 2006). Any shortcomings identified in the assessment stage can be rectified by re-
evaluating the specific stage of the development process where the shortcomings
emerge.
This research focuses only on both sustainability assessment aspects of the
development process shown in Figure 2-6, on residential development layouts because
of its great impact on sustainability. Not only does it occupy an increasing percentage
of urban land uses, its location and design also bring about environmental, social and
economic implications (Choguill, 1996; Ekins, 2000).
2.4 Sustainability at planning stage
Urban planning originated as a response to the appalling living conditions that were
widespread throughout the cities of the nineteenth-century (Adams, 1994; Barton,
2009). From this public health-oriented beginning, planning began to shift towards
promoting a more efficient use of land for human settlement and activities. In serving
the improvement of a state of affairs, planners proposed certain actions or measures to
achieve a desired outcome (Schonwandt, 2008). Intentional intervention by planners
in the development process is undertaken using a variety of mechanisms involving
regulations, collective choice, and stakeholder participation (Hopkins, 2001). In
spatial planning, examples of the techniques used by planners during the early
planning stage include such things as the traditional general plans and the zoning of
Page 43
Chapter 2 23
land use. During the implementation and development stages, development standard
and guidelines are used to facilitate and guide the development process.
Increasingly, sustainable development concept has become an important element in
the field of urban development planning within developed nations in particular, where
sustainability issues and awareness are quickly gaining recognition (Choguill, 2008)
and is promoted at various levels of the administration system. Based on the iconic
definition ‗development that meets the needs of the present without compromising the
ability of future generations to meet their own needs‘ (WCED, 1987, p8), Dresner
(2008, p 70) considers sustainable development as ‗a meeting point for
environmentalists and developers‘. Bell and Morse (2003) on the other hand sum up
the definition as comprising two elements, namely making settlement better
(development) and maintaining such development (sustainability), which was
classically being portrayed as encompassing environmental, economic and social
interfaces. According to Dresner (2008), the concept of sustainable development was
initialised to incorporate environmental considerations into development policy,
which has always been an economic-led affair. Apart from that, the author also added
that sustainable development should also encompass the concept of equity, that is a
moral obligation to ensure future generations enjoys the opportunities and privileges
of consuming the world‘s resources.
Even though the concept of sustainability planning has been rigorously promoted
within almost all levels of government machinery, a few authors argue that the
implementation progress of sustainable development is less than impressive (Lafferty
& Eckerberg, 1998; Mog, 2004; Wallbaum, Krank, & Teloh, 2011). Among the
reasons lie in the complexity of its meaning and difficulty to operationalise due to its
highly dynamic and contested nature, as well as it is difficult to obtain and integrate
the views and priorities of the different actors and stakeholders into a single solution
(Mog, 2004; Pope, Annandale, & Morrison-Saunders, 2004; Carmona & Sieh, 2005,
2008; Wallbaum, et al., 2011). The most obvious difficulty, if not impossible to
address in sustainability at the planning stage, is the need to balance the three
competing nature of economic growth, environmental protection, and social justice
(Campbell, 2003; Bell & Morse, 2008; Mori & Christodoulou, 2012).
Page 44
24 Chapter 2
While interest in urban sustainability was mainly generated from global and national
perspectives, the locality theorem (Camagni, 1998) suggests that it is better to face
these issues from local perspectives (Garde, et al., 2010) from which most
sustainability issues originate. As a result, spatial planning and development process
increasingly require the inclusion of statement justification on how proposed
developments will contribute or enhance sustainability within the local context.
2.5 Land use Planning and development control practice in Malaysia
Modern town planning in Malaysia has its roots from the United Kingdom planning
system (Taib & Ho, 2008), which consists of development plans and development
control procedures for matters related to planning considerations (Lee, 1996; Bruton,
2007). Town planning legislation in the country has its beginning as early as 1923
with the Town Planning Bill (Lee Lik, 1991; Taib & Ho, 2008). It underwent various
reviews and royal commission inquiries and upgrades from ordinance to a planning
bill, before it was finally enacted as the Town and Country Planning Act, 1976. Since
its inception, the act has undergone two revisions (1995 and 2001) and becomes the
main legal reference for the spatial planning and development management in the
country (DTCP, 2010a).
The administration of land use planning system in Malaysia consists of a three-tier
system of federal, state and local planning (Figure 2-7). At the federal level, the
National Physical Plans (NPP) are prepared to govern a five year spatial planning of
the country (DTCP, 2005). These plans are interpreted at the state level in the form of
Structure Plans, which translate the national policies into individual states‘ priorities
(Zakaria, 2007) and provide a framework for development planning at the local level.
Here, local plans and special area plans are produced to guide the spatial development
in these local areas. The hierarchy of plans shows that there is a coordinated and
guided approach to urban planning and developments in Malaysia (Goh, 1988).
Page 45
Chapter 2 25
Figure 2-7: Administration of land use planning system in Malaysia (adapted from
DTCP, 2005)
The legal foundation for the NPP and all other statutory plans mentioned above is the
Town and Country Planning Act 1976 (Act 172) (revised in 2001) (DTCP, 2010a).
The Federal Department of Town and Country Planning (DTCP) is responsible for
drafting all these plans. However since all matters pertaining to land are governed by
individual states, the DTCP can only advise state authorities to implement structural
and local plans. There are cases in which due to local needs and requirements, the
state may not act in tandem with federal advice as spelt out in the development plans.
Such planning issues are resolved through consultations between the two parties in
order to avoid delays in the development process (Mohamed, 2002).
Development control practice in Malaysia involves the regulation and control
mechanism prior to the commencement of development projects. With regard to land
use planning, development plans act as important control mechanisms for the
development and management of land. Apart from environmental management, these
plans also assist in translating socio-economic objectives into spatial and physical
developments (Pereira, Tiong, & Komoo, 2010). At the state levels, the state, through
its state planning committee can endorse local plans and special area plans, after
which the respective local authorities must implement these plans. Development
Page 46
26 Chapter 2
guidelines and standards are also produced at the state levels and add to these control
mechanisms to further detail out and guide development planning applications and
approval processes. Throughout these processes, local authorities will consult relevant
technical departments before granting planning permission for the commencement of
development projects or conversion of land for development.
2.6 Planning and regulations governing residential developments in
Malaysia
The Ministry of Housing and Local Government (MHLG) oversees the nation‘s
housing development, in line with the national housing policy initiated since the
1960s, which is to provide access for all Malaysians to adequate and affordable
shelter. The majority of residential properties in Malaysia is constructed by housing
developers. They are licensed developers and their activities are regulated by the
MHLG through the Housing Developers and Control Act 1966. This Act defines
housing developers as:
Businesses developing or providing monies for developing, or purchasing or of
partly developing and partly providing monies for purchasing, more than 4
units of housing accommodation which will be or are erected by such
development (Government of Malaysia, 1966).
In terms of the legal process of residential development in Malaysia, it is governed by
a number of provisions, including the Town and Country Planning Act (1976), Street,
Drainage and Building Act (1974) and Local Government Act (1976). In terms of
technical details, all types of residential development must adhere to the DTCP‘s
Planning Standard and Guidelines, as well as other guidelines enforced by individual
states through their local planning authorities. In this regard, developers are free to
develop any housing scheme of any size, subject to adherence to the development
plans and planning guidelines.
Besides the general Planning Standard and Guidelines, the federal government,
through the DTCP also produces specific planning guidelines for housing
developments such as guidelines for the development of affordable housing schemes
(DTCP, 2006), gated community and guarded neighbourhoods (DTCP, 2010b), and
Page 47
Chapter 2 27
guidelines for the optimum layout of housing developments ((DTCP, 2003). Other
residential development types such as master-planned developments and subdivisions
follow these general planning standards and guidelines wherever applicable and any
other specific guidelines of the respective state and local authorities.
2.7 Residential Neighbourhood Development
Choguill (2008, p. 42) acknowledged that Howard‘s garden cities had transformed
"urban planning from public health exercise to one which considered the detailed
spatial arrangement of urban activities... for the first time, the neighbourhood became
an integral part of urban planning activity." The author also argues that cities and
regions cannot be considered sustainable if their component parts, such as
neighbourhoods, do not meet the sustainability criteria. Edwards (2000, p. 12)
considered residential development as being the central element linking together the
triple bottom line of economic development, environment and social welfare and that
it is ―the agent that cements communities‖ in the sense that it acts to these elements to
create a sustainable community (Figure 2-8). The sustainability is about a compromise
between environmental, economic and social objectives, and stands for a better quality
of life for everyone, now and for generations to come within the limits of permissible
environmental impact (Pike, Tomaney, & Rodrigues, 2006).
Figure 2-7: Linkage between residential development and the three sustainability
elements (Edwards, 2000)
Page 48
28 Chapter 2
2.7.1 Definition and characteristics of neighbourhood
The United States Green Building Council‘s LEED-2009 defines a neighbourhood as
‗an area of dwellings, employment, retail, and civic places and their immediate
environment that residents and/or employees identify with in terms of social and
economic attitudes, lifestyles, and institutions‘ (USGBC, 2009, p. xvi). In addition, the
Charter of New Urbanism (CNU) characterises a neighbourhood as a compact,
pedestrian friendly and mixed-use area (CNU, 1996). Meanwhile, Jenks and Dempsey
(2008) describe a neighbourhood as comprising both the physical and social elements:
a district, representing an area where people live, and a community, representing the
people themselves, who live in that particular area. On the other hand, Girling and
Kellet, (2005) describe a good neighbourhood is a place that offers good homes,
availability of nearby shops, local services, amenities and infrastructure, education
facilities, job opportunities as well as being safe from crime and traffic. In order to
develop a good neighbourhood that most people want to live in, the size of
neighbourhood is crucial to ensure that it is capable of accommodating all the
necessary elements for it to be considered sustainable (Girling & Kellett, 2005; Jenks
& Dempsey, 2007).
The typical way of making a rough estimation of a good neighbourhood size is based
on a comfortable distance for walking from the centre of the neighbourhood to its
edge. Clarence Perry, for example, outlined a neighbourhood as a centre surrounded
by civic uses, parks, residential uses, a school, and retail at the edge, all within one-
quarter mile (400 metres) from the centre, or about a 5-minute walk. This amounts to
an area or pedestrian ‗shed‘ of 125 acres, or, if the land area is a square, 160 acres
(USGBC, 2009). In terms of population, most industry standards in the USA propose
a minimum of 1,500 households (3,000–3,500 people) to support a neighbourhood‘s
commercial establishments (Girling & Kellett, 2005).
Additionally, the completeness of a neighbourhood refers to the extent to which daily
and weekly needs are close to homes. Examples include grocery stores, banks,
medical facilities, coffee shops, restaurants, hair salons, day-care centres, schools and
parks. Compatible civic uses (schools and places of worship) should also be located
nearby. For local stores and services to thrive, potential customers must be close
Page 49
Chapter 2 29
enough to sustain them economically. The term close should mean it is easily
accessible from home, within a 5 to 10 minute walking distance.
2.7.2 Neighbourhood types
Currently, there are four main types of residential neighbourhood development in
Malaysia namely the traditional village, piecemeal, subdivision and master-planned
developments. Given this scenario, it is believed to be necessary to evaluate which of
these development types are more sustainable. This evaluation helps to provide
fundamental information in improving sustainability of housing supply. The following
section describes the characteristics of these different types of residential
development.
2.7.2.1 Traditional village development
The traditional village is among the oldest forms of settlement in modern human
history. Although called by different names in different countries from hamlet in UK
to tsuen in China, traditional villages comprise of clusters of human settlements of up
to 1,000 people. Such figure however varies among countries. In most cases the
houses are located close to each other and surrounded by subsistence agriculture.
In the Malaysian case, a village is called kampong, located outside built up areas and
generally have around 100 houses. In some cases, a kampong can have as few as 10
houses. These houses, which are normally made of hard timber and wooden planks,
and sit on timber or concrete stilts, are located close to each other (Figure 2-9). In
some other cases however, the houses are scattered and interspersed with paddy fields,
rubber smallholdings or palm oil plantations. In terms of planning and development
control, these houses are generally located on agricultural land and hence do not
require planning permission.
Page 50
30 Chapter 2
Figure 2-8: Typical traditional village or kampong houses in Malaysia
2.7.2.2 Piecemeal development
Development that occurs in a piecemeal way normally exists in parts which add to the
existing bigger development (Oxford Dictionary). In residential development
planning, this refers to houses which are developed in a piecemeal way and adds to the
existing clusters of neighbourhood development. In the Canadian experience, such
piecemeal development fits the description of small scale residential construction on a
vacant lot or a series of lots adjacent to existing residential development (IBI Group,
2011). Such development can take the form of duplex, triplex or quadruplex on a
single lot or single family houses or townhouses on a number of lots. These provide
potential buyers with a variety of options, vitality, viability and access to existing
facilities such as schools, parks and emergency services. In the USA experience, such
piecemeal developments also fall within the suburban infill development category,
which refers to the development of land within existing suburban areas which was left
vacant during the development of the suburb (Farris, 2001).
With regard to the Malaysian circumstance, piecemeal residential developments take
the form of blocks or clusters of houses that are developed in stages on a vacant lot or
a series of vacant lots, by different developers at different times (Figure 2-10). Each
stage of the development takes place with proper planning approval and conditions set
by the local planning authority. In terms of locations, piecemeal developments take
place within the city fringe or suburbs. The main reasons are the ready market for the
developments and the opportunity to utilise existing facilities and amenities available
within the existing adjacent or nearby neighbourhoods.
Page 51
Chapter 2 31
Figure 2-9: An example of residential neighbourhood developed in piecemeal fashion
which consists of up to four different housing types developed at
different times by different developers (older terrace houses on the
foreground, stretches of detached houses next to it, and newer terrace
housing on the background)
A significant amount of vacant land exists within urban residential zones in Malaysia.
Under the country‘s National Land Code (Government of Malaysia, 2007) local
authorities cannot force landowners to develop such land, unless the landowner wishes
to do so. The majority of the land is owned either individually or by developer
companies. Such land is retained for various reasons including for business
speculation, as land banks for future development when the time comes, or to be
developed in a piecemeal way avoid providing amenities (such as open space) should
the land be developed as a whole (Zulkarnain, personal communication, April 4,
2011). When all or the majority of the land has been fully developed for residential
use, the local authority is required to allocate spaces for the provision of amenities.
The difference between piecemeal developments with the general concept of infill
development is that it does not have the formal objectives of infill development, which
give attention to creating a complete, well-functioning neighbourhood, and with
attention to the essential design element that fits the existing context, in order to gain
neighbourhood acceptance (Listokin & Walker, 2007). Piecemeal development is not
seen as desirable because it is considered as lacking the overall planning of the
neighbourhood. For example, by developing in a piecemeal way, the entire
Page 52
32 Chapter 2
neighbourhood is devoid of the optimum provision of amenities. However, it is argued
that with a proper planning, piecemeal development can still become a well-
functioning residential development and provide opportunities for residents to live
close to existing amenities and workplace as well as providing better support for local
commercial establishments (IBI Group, 2011).
2.7.2.3 Subdivision development
Most local ordinances define subdivision as the division of land into two or more
parcels, whether for immediate or future use (Shellharbour City Council, 2004;
McDermott, 2008). In the case of residential subdivisions, it refers to the division of
two or more residential lots, permitting the construction of buildings as stipulated in
the building codes. Residential subdivisions take a number of different forms, ranging
from large lot subdivisions (more than 0.4 ha), standard minimum lot subdivision
(0.27ha) (Austin, 2004), or small lot subdivisions (smaller than 450 square metres)
(Shellharbour City Council, 2004). People may purchase the residential lots from
developers who sub-divide unimproved parcels of land into building lots, and provide
within-subdivision infrastructure (Thorsnes, 2000), including streets, sewers and water
lines (McDermott, 2008).
Typical lot sizes for subdivision developments, however, vary between countries; they
range between a minimum one-eighth of an acre for a standard subdivision in
Malaysia to half acre lots in Australia and the USA (DTCP, 1995; Arendt, 2004). In
terms of lot layout, standard subdivisions usually involve sub-dividing a site with the
primary goal of maximising the number of lots of the minimum size according to local
regulations (Pelchar et al., 2007). However, it is often argued that such arrangements
often disregard the site‘s original natural features (Pelchar et al., 2007). In the USA,
another form of subdivision, although not very common, involves clustering homes on
certain parts of the subdivision land while setting aside the remaining land for use as
protected communal natural areas and green spaces (Austin, 2004; Bowman et al.,
2009). It is argued that such an arrangement, which is called open space or
conservation subdivision (Arendt, 2004) is appealing to modern subdivision as it
incorporates elements of environmental sustainability into its design at the preliminary
stage (Bowman et al., 2009).
Page 53
Chapter 2 33
In the case of Malaysia, subdivision developments are generally located within
suburban areas. In contrast to the western definition of subdivision which generally
refers to lot parcels with buildings, residential subdivision in Malaysia typically
consists of vacant lot parcels with basic infrastructure such as road, sewerage,
drainage, water and electricity supply. Individual parcel owners or buyers are
responsible to build their dream houses according to their own designs (Figure 2-11).
They are also responsible to get all necessary documentations and approvals prior to
building the houses. A standard form of subdivision is represented by a small lot
measuring 20 metres by 30 metres or slightly smaller in areas of high development
pressures or of higher land prices. The major providers of subdivision lots are the
local authorities and individual landowners who subdivide their land into small
residential parcels and sell them individually.
Figure 2-10: Examples of detached houses built by lot owners on subdivided lot
parcels
The appeal of subdivision developments belongs to its low-density arrangements that
offer attractive, rural-style living and added privacy. In terms of general building
regulations, subdivision developments have a standard on the developable area that
ensures adequate spacing between neighbouring structures and access. A number of
general regulations are regarded as similar between countries, such as flexible house
designs and compliance with the standard building and safety regulations. This form
of development must also comply with other general regulations including lot size and
layout, open space and infrastructure, and utility provision. For example, subdivisions
in Australia and the USA offer large private front or backyards for the family, while
the smaller subdivisions in Malaysia limit such private areas to outside the house.
Page 54
34 Chapter 2
2.7.2.4 Master-planned development
Master-planned developments (MPDs) are increasingly becoming an integral part of
residential developments (McGuirk & Dowling, 2009). Drawing from the North
American perspective, MPDs are defined as large scale integrated housing
developments on large tracts of undeveloped, suburban greenfield land, with mixed
housing types, landscape and recreational, commercial and service facilities (ULI,
1998). It is developed based on ‗a mechanism of planning control over an entire
project site, underpinned by a particular vision for the completed development‘
(Gwyther, 2005, p. 58). Located on the growth frontier of city fringe, they sometimes
occur on renewal or infill sites, whose essential features include a definable boundary
and fairly uniform character, and with the provision of physical and social
infrastructure (Minnery & Bajracharya, 1999; Gwyther, 2005; Goodman & Douglas,
2008).
In their study on selected Australian MPDs, Yigitcanlar et al. (2007) differentiated
MPDs with other developments based on the size of the population it contains.
According to Ewing (2009), a MPD should be larger than 800 hectares, which
distinguishes MPDs from other developments, whilst Minnery and Bajracharya (1999)
identified MPDs as having a total area of over 1000 hectares. Apart from a large area,
Minnery and Bajracharya (1999) asserted that common features of MPDs include a
balanced mix of uses controlled by a master developer; and are master-planned early
in the development process. The development of MPDs not only combines a
complementary mix of land use but is also held together by a unifying set of design
elements gives residents a rich and diverse environment in which to live, work, shop,
play and learn (ULI, 1998, 2003). These design elements include the natural
environment, landscape, streetscape, site layout, built form and heritage
considerations (AMCORD, 1997) that also emphasise sustainable development
characteristics and appeal to a particular market segment (Goodman & Douglas,
2008). These distinct characteristics are valued by residents of the MPD because they
inculcate a sense of place within MPD.
For its beginning in the USA in the 1960s, the MPD concept has been gaining
popularity among developers from many countries including Australia (Goodman,
Page 55
Chapter 2 35
2008). In Australia, MPDs, better known as master-planned communities (MPCs),
have been gaining popularity, particularly on the urban fringe (Costley, 2006;
Goodman & Douglas, 2008). Their definition of MPCs takes a broader perspective, in
the form of a large-scale, integrated housing development by a single development
entity. According to Blair et al. (2003), MPCs have become the dominant form of
urban expansion, whether on greenfield sites or brownfield development, and have
won a large segment of house buyers over from traditional subdivision developments.
It is observed that this trend represents comprehensive place making, a particularly
obvious shift from traditional house building (Goodman & Douglas, 2008). However,
according to McGuirk and Dowling (2009), many emerging MPCs, especially in
Sydney, fall within Blakely and Snyder‘s (1997) broad category of lifestyle preference
and/or life-cycle stage, and are considered as permeable development, with the
absence of gating, other than decorative entrances, at most of these MPCs. There is
also an increasing recognition among developers of MPCs, albeit weakly expressed, to
promote self-containment in newly developed MPCs (Yigitcanlar, et al., 2007). This
refers to people working and living in the same locally-defined area, such as within an
MPC, hence, reducing the need for long distance travel to work and promoting
environmental sustainability. However, a recent study by Yigitcanlar et al. (2007)
shows that the idea of self-containment is still yet to trickle down to the ground, and
MPCs in Australia are not as self-contained as many would have claimed.
MPDs have many additional elements considered as part of the design process
including solar access, community facilities, landscaping, pedestrian and vehicular
traffic, and building form. These elements and issues are normally tackled in a
comprehensive manner during the planning and design stage of MPD (Blair, et al.,
2003). Schmitz (1998) concluded that MPDs offer bargained packages with benefits
ranging from lifestyle, security and sense of community. Schmitz‘s assertion is
supported by McGuirk and Dowling (2009) who identified and differentiated these
various characteristics of MPD development based on the descriptive typology drawn
by Blakely and Snyder (1997). Using this well-established typology, McGuirk and
Dowling (2009) categorise the MPD developments into three types: lifestyle
communities, prestige communities and security zone communities (Table 2-1).
Page 56
36 Chapter 2
Table 2-1: Typologies of master-planned communities (McGuirk & Dowling, 2009)
Types Features Characteristics
Lifestyle
Emphasis on common amenities for a
leisure class of common interests;
maybe reminiscent of small town,
urban village or luxury village.
Master-planned project with
suite of amenities and facilities.
Shared access to amenities for
an active lifestyle
Prestige
Reflect the desire for image, privacy
and control; focus on exclusivity over
community; a few shared facilities
and amenities.
Restricted access; usually
without guards.
Secured and guarded privacy
Attractive locations.
Security Zone
Reflect fear of crime; involve
retrofitting fences and gates on public
streets; controlling access.
Restricted access to limit crime
or traffic.
Closed access to some streets to
limit through traffic.
Lifestyle oriented MPDs draw residents by the use of common amenities and facilities
supporting healthy and active living. Developments focusing on prestige are
characterised by their perceived status or reputation, where developers create MPDs
with a certain image that appeals to certain segments of the population (Grant, 2004).
MPDs with limiting access characteristics belong to the security conscious type,
probably for fear of crimes originating from outside of the community. This type of
development, however, is more reminiscent of the gated-style communities.
In Malaysia, the development of master-planned developments did not begin until the
late 1990s, following rapid urbanisation and a surge in demand for housing. Such
development is also called a new township development. It is usually built by a master
developer on greenfield areas, including on ex-oil palm plantations. The master
developer advances the MPD in stages, based on pre-drawn master plans of the
respective local authorities. The overall size of MPDs in Malaysia, between 100
hectares and 500 hectares, is smaller in comparison to those in Australia or the USA
but the components are generally similar. Figure 2-12 shows an example of a typical
MPD in Malaysia, with terrace houses normally comprise a majority of its
development.
Page 57
Chapter 2 37
Figure 2-11: A typical master-planned residential development in Malaysia
Planners have long held that such comprehensive development of MPD by a single
developer has the advantages of providing greater design flexibility, better
neighbourhood environments, exclusive open spaces, and community facilities for the
residents (Suen & Tang, 2002).
2.8 Sustainable development assessment in Malaysia
Malaysia has undergone rapid environmental, economic and social transformations for
the last five decades, which have been accompanied by an unprecedented rate of
change in the natural environment (Hezri, 2004; Hezri and Hasan, 2006).
Consequently, as with many other developing countries, it faces a continuous conflict
between economic growth and conservation of its environment (Saadatian et al.,
2012). Following calls for the promotion of sustainable development concept by the
World Commission on Environment and Development through its publication of Our
Common Future (WCED, 1987), Malaysia has recognised the concept as central to its
national development (Hezri and Hasan, 2006). As a result, the country has included
the principles of Agenda 21 as an important part in drafting policies and plans for its
physical development (Bakhtiar and Ibrahim, 2007). However, in terms of local
sustainability monitoring, it has unfortunately faced an uphill task, not only by the
absence of a comprehensive framework of sustainable development but also the lack
of explicit and sufficient sustainable development strategy and indicators
(Papargyropoulou et al., 2012; Saadatian et al., 2012).
Having said that however, the ministry responsible for environmental management
does have a National Policy on the Environment that incorporates eight necessary
Page 58
38 Chapter 2
principles to balance economic development with environmental conservation and
sustainable resource use (MOSTE, 2002). In addition, the ministry also developed the
country‘s green strategies for six areas including integrated development planning and
pollution prevention (Papargyropoulou et al., 2012). In terms of the assessment
framework focusing on sustainable development, Malaysian scholars and agencies did
manage to devise a number of assessment framework focusing on sustainable
development in general. The following is selected assessment developed by agencies
and scholars in response to the sustainable development agenda initiated earlier by the
government.
2.8.1 Malaysia Quality of Life Index
The Malaysian Quality of Life Index (MQLI) was developed by the Economic
Planning Unit in 1999 (EPU, 1999). The purpose of this national level evaluation is to
provide an aggregate measure of quality of life of the general population based 14
criteria (air quality, deforestation, clean water, income, working life, transport and
communication, health, education, housing, environment, family life, social
participation, public safety and culture and leisure) (EPU, 1999; Saadatian et al.,
2012). In 2002, the Economic Planning Unit again developed the Malaysian Urban
Quality of Life (MUQL), with a similar purpose as the MQLI but narrowing its target
to include only the population in major Malaysian cities (EPU, 2002). This time the
MUQL incorporates 19 indicators under 14 criteria (income, working life,
transportation and communication, health, education, housing, environment, family
life, community participation, public safety, culture and leisure, urban service, river
quality, and solid waste per capita) (EPU, 2002; Saadatian et al., 2012). Even though
these assessments represent a huge effort by the government towards sustainable
development, only about one third of the criteria used represents the sustainability of
biophysical, the rest are more towards socioeconomic well-being (Hezri, 2004).
2.8.2 Malaysian Urban Indicator Network
The Malaysian Urban Indicator network (MURNINet) is a computer network
designed to assess the sustainability levels of Malaysian cities and towns based on
selected performance-indicators developed by the Federal Department of Town and
Country Planning (DTCP). The development of these indicators started in 1998,
Page 59
Chapter 2 39
following the endorsement of urban indicator programmes by the HABITAT Agenda
two years earlier. Initially a total of 56 performance-based urban indicators were
selected for the MURNINet project. These performance indicators are categorised into
11 components (demography, housing, economy, utility and infrastructure, public
facility, environment, social impact, land use, tourism, accessibility and
transportation, and management and finance), with data obtained from existing
sources of relevant government agencies and local authorities (Hezri, 2004). The
outcome from MURNINet is a ranking of participating cities and towns based on the
aggregated sustainability score of all 11 components with cities achieving more than
80% score are deemed as sustainable, while those achieving below 50% score are
considered as unsustainable.
It is envisaged that the use of MURNINet will benefit all levels of the government. At
the Federal level, MURNINet contributes towards achieving sustainable urban
development objectives of the Malaysian government. At the state level, it helps the
state identifying cities and towns with low sustainability levels and providing financial
assistance to improve the levels. This is important so that they can enhance their
services to the public. For the local authorities, from which the majority of
MURNINet indicators is generated, they can use the indicators to identify issues
associated with urban quality and public services, hence providing opportunities to
rectify these issues and improve service levels to the public.
2.8.3 Green Building Index
The Green Building Index (GBI) represents an effort by Malaysian experts to develop
a local level assessment of the sustainability of buildings. This effort came in light of
the increasing demand for green-rated buildings that would minimise destruction of
the environment (PAM, 2009). GBI Malaysia was introduced in January 2009 with the
main purpose to reduce building impact on human health and the environment through
environmental friendly design and construction (Tan Loke Mun, 2009). GBI rating is
awarded to buildings designed and constructed in an environmentally friendly way
based on six criteria (energy efficiency, indoor environmental quality, sustainable site
planning and management, materials and resources, water efficiency and innovation)
(PAM, 2009; Saadatian et al., 2012). The ratings are based on the number of points
awarded for incorporating specific aspects related to these six criteria, with the rating
Page 60
40 Chapter 2
ranging from standard (lowest) to platinum (highest) certification in the GBI category
(Malaysia Productivity Corporation, 2010).
2.9 Sustainability issues among different types of residential
development in Malaysia
Urban population in Malaysia has increased tremendously in the last four decades,
from slightly over five million (38.8% of total population) in 1980 to nearly twenty
million (72.2% of total population) in 2010 (Department of Statistics, 2000; 2010)
(Table 2-2). During this period, population growth in urban areas had taken place at a
much faster rate than that of rural population. This was largely due to the availability
of vast employment opportunities which fuelled in-migration of people from rural
areas in search of better quality of life (Jamaliah, 2004).
Table 2-2: Population growth in Malaysia 1980 -2010 (Department of Statistics, 2000;
2010)
Population (million) 1980 1990 2000 2010
Urban population 5.10 8.89 13.72 19.90
Rural population 8.04 8.67 8.48 7.66
Total population 13.14 17.56 22.20 27.56
Percentage of urban
population 38.80 50.62 61.80 72.20
Population in-migration has become one of the contributing factors to the rapid
progress of urbanisation, in the form of rapid development of residential
neighbourhoods to accommodate the increasing urban dwellers. In addition, the
expansion of city-regions, the increase in the standard of living, and changing
lifestyles have collectively led to an increase in housing demand. New residential
areas are encroaching onto city fringes towards suburban and green field areas
constructed on vacant land, which is owned by individuals, developer companies or
the government. Such land is retained for various reasons including for business
speculation or as land banks for future development. Local authorities have no right to
force landowners to develop such land, unless the landowner wishes to do so.
Page 61
Chapter 2 41
Large and small-time developers are actively building houses ranging from a few
blocks to master-planned style projects. These residential developments, particularly
in major urban areas, represent a large portion of urban land use in Malaysia, and,
thus, have become a major contributor to overall urban sustainability. There are three
main types that comprise the mainstream, and form integral parts to contemporary
urban residential developments, namely, piecemeal developments, subdivision
developments and master-planned developments (Table 2-3).
Table 2-3: Characteristics of the three different types of residential development in
Malaysia
Item Development types
Subdivision Piecemeal Master-planned
Location Suburban area City fringes Greenfields
Development
size Minimum 1 acre Minimum 1 acre 100 to 500 hectares
Layout plans
Local planning
authorities and private
developers
Private developers Private master
developers
Sale type Vacant lot for single
dwelling
Lot and building
(completed house unit)
Lot and building
(completed house unit)
Type of
houses Detached dwelling
Mixed dwelling
(detached, semi-
detached, terrace)
Mixed dwelling
(detached, semi-
detached, terrace)
Provision of
amenities
Not required if less
than 30
Not required if less than
30
Provision according to
planning guidelines
House design
and
construction
Buyers Developers Developers
Planning
control
General development
guidelines
General development
guidelines
General and additional,
specific guidelines
Both piecemeal and subdivision residential developments occur in an ad-hoc manner
in the absence of an overall blueprint plan for the residential zone with a minimum
development size of one acre. Master-planned developments on the other hand are
based on pre-drawn overall master plan/blueprint plans, typically with a minimum
development size of 100 hectares (250 acres). The small-scale residential development
of piecemeal and subdivision has created disadvantages to residents because
developers can get away from providing basic amenities (such as open spaces and
community centre), should the number of dwellings fall under 30 units (DTCP, 1995).
Page 62
42 Chapter 2
In contrast, master-planned developments, which involve a larger scale, have to
provide the necessary amenities as required by the planning standards. In addition,
because master-planned developments comprise a large number of houses, for the
purpose of marketing, developers are willing to provide additional facilities to attract
buyers. Indirectly, this creates a better quality of life for the residents. Many new
master-planned developments market themselves as environmentally friendly, and
provide layouts that encompass sustainable design and development.
Although master-planned developments provide better amenities that support
sustainability compared to piecemeal and subdivision developments, there are buyers
who do not opt to buy houses under the master-planned concept for other reasons.
Although the increased density is compensated for by the physical infrastructure and
amenity (Gwyther, 2005), it has invited criticism relating to loss of privacy and
private space. Even though living in a closed community can create strong bonding
between residents and increase support for each other, it can also create social
exclusion with people outside their boundaries (Costley, 2006). In terms of
socioeconomic characteristics, Ross et al. (2002, p. 118) pointed out that, ―residential
segregation by income can promote distrust between groups and decline in overall
social connection within metropolitan communities‖. Such segregation, no matter how
subtle, has the tendency to undermine social cohesion as well as increase social
exclusion (Ross, Houle, Dunn, & Aye, 2004) and is therefore detrimental to achieving
a socially sustainable society.
These issues have been found to be limited in subdivision developments where the
distribution of dwellings is more dispersed and less compact compared to master-
planned, which leads to increased privacy. The appeal of subdivision developments
belongs to its low-density arrangements that offer attractive, rural-style living and
added privacy. However, this has huge implications on the infrastructure and servicing
costs, which are increased due to the longer streets. The infrastructure and associated
public facilities that need to coincide with the entire neighbourhood pattern cause
inefficiency in the provision. For example, subdivisions that are built further into the
countryside not only diminish the rural character of the entire neighbourhood, but also
increase automobile related travel activities and its associated monetary and
environmental costs. It seems that MPDs do not face sustainability issues in a physical
Page 63
Chapter 2 43
context as much as subdivision developments, but rather in respect of social and
economic issues.
2.10 Key findings and research gaps
Despite the importance of residential development in human settlement, studies
determining the level of sustainability have been limited. There are three reasons
attributed to this: first, although occupying an increasing percentage of urban land use,
only recently has sustainability been actively considered in residential developments
(Choguill, 1996, 2008). This comes following evidence that expansion of the urban
housing stock is rapidly depleting natural resources, especially urban land (Frame &
Vale, 2006). Second, even though the local housing developments are at the forefront
of sustainability efforts, the inadequate attention to conceptualising its sustainable
nature (Priemus, 2005) and lack of commitment to gauging its progress towards
sustainability (Winston, 2009), further exacerbates this already difficult effort. Third,
in most cases, professionals and academics are only embracing some aspects of
residential development issues. Even less take into consideration all the components
of residential sustainability in a holistic manner (Turcotte, 2006).
It is envisaged that piecemeal, subdivision and master-planned developments will
continue to contribute to the new housing stock in Malaysia because different buyers
have different preferences and limitations. As Malaysia is a democratic country where
residential developments are influenced by market demand, it means that as long as
there is a demand, developers who are business opportunists will try to fulfil that
demand. In respect of local authorities that are responsible managers of urban land
use, they need to play their role to encourage the provision of sustainable houses for
better quality of life. To date however, no studies have been conducted in Malaysia to
examine or to ascertain which of these three residential development layouts is more
sustainable.
To fill this gap, this research is being undertaken to develop a framework for assessing
the level of sustainability of these different types of mainstream residential
developments in Malaysia, focusing on their layouts at the neighbourhood level. The
results generated from this framework are expected to provide evidence to the policy
makers and development agencies as well as provide an awareness of the level of
Page 64
44 Chapter 2
sustainability, and the necessary collective efforts required for developing sustainable
neighbourhoods. It will also guide policy makers and environment agencies in their
decision making process as well as provide continuous monitoring and assessment
which can facilitate a comparison of sustainability over time for neighbourhoods as a
means to monitor changes in the level of sustainability. In addition, the framework is
able to identify a particular indicator (issue) that has a significant impact on
sustainability.
2.11 A framework for neighbourhood sustainability assessment
Sustainability assessment is being viewed as an important impact assessment tool to
aid the move towards sustainability, or sustainable development (Pope, et al., 2004;
Ness, Urbel-Piirsalu, Anderberg, & Olsson, 2007). Pope et al. (2004) describe
sustainability assessment as a process by which evaluations are conducted on the
implication of planning initiatives on sustainability. According to Ness et al. (2007),
such assessment allows goals, objectives or dimensions to be assessed as part of the
transition to sustainability. The sustainability assessment mechanism adopted in this
research follows a framework-based approach, which involves the use of indicators
for measuring sustainability (Maclaren, 1996; Pope, et al., 2004; Mori &
Christodoulou, 2012).
While a framework in itself can assist in the indicator selection process, it cannot
decide what should or should not be selected as an indicator (Hardi, Barg, Hodge, &
Pinter, 1997). Instead, it is the structured evaluation method within the framework that
influences the indicator selection and reliability of the framework (Becker, 2005). The
function of a framework helps increase this reliability by only selecting those
indicators that fall within the framework‘s boundaries and interpretations. Such a
framework, according to Olalla-Tarraga (2006, p. 4), ‗helps to structure indicator sets
in a coherent manner, promotes interpretation and integration, reveals data gaps and
guides the overall data collection effort‘.
2.11.1 Basis for framework development
Bell and Morse (2003) argue that indicator-based assessment has been the most
widely used approach to measure development sustainability. However, since
Page 65
Chapter 2 45
sustainable development should encompass the three dimensions of environmental,
social and economic, the authors suggest that the normal approach in measuring
development sustainability is to develop a framework of indicators that covers these
three dimensions, and interpret all three with an index value. This value can then be
presented in visual forms using geographical information technology. Values of other
indicators within the three dimensions can then make up a scenario of overlaid GIS
maps of individual indicators, which is very useful in scenario planning. Maclaren
(1996) develops six general typological frameworks as a basis for developing
indicator-based sustainability evaluations. These frameworks are the domain-based
frameworks, goal-based frameworks, issue-based frameworks, causal frameworks,
sectoral frameworks and combination frameworks (Figure 2-13).
Figure 2-12: Six different typological frameworks for sustainability development
(adapted from Maclaren, 1996)
According to the author, a domain-based framework contains three main categories of
sustainability (environment, economy and society) and identifies indicators for each.
This domain-based framework is also consistent with the triple-bottom line
sustainability concept. A goal-based framework identifies sustainability goals and then
creates one or more indicators for each goal or combination of goals. A sectoral
framework considers different sectors of economics or land use, including its indicator
Page 66
46 Chapter 2
selection. A causal framework introduces the notion of cause and effect, similar to the
pressure-state-response framework, with indicators classified into cause and effect. An
issue-based framework works by identifying and listing key sustainability issues that
the community faces and uses the issue, or a combination of issues, as indicators. A
combination framework encompasses other frameworks and can help to create a
conceptual assessment model by bringing together two or more of the other general
sustainability frameworks. Another approach to assess sustainability is the Triple
bottom line (TBL), which is presented in the following section.
2.11.2 Triple bottom line and assessment of sustainability
The triple bottom line (TBL) sustainability, known as the TBL accounting and
reporting frameworks, has a dominant popularity in the corporate world and is used by
business owners and managers to reflect their corporate reporting beyond the financial
bottom line to include environmental impact and social contribution (Elkington, 1998;
Christchurch City Council, 2003; Pope, et al., 2004; Coffman & Umemoto, 2010).
This is a huge shift from conventional, economic focused business bottom line
sustainability, which limits the assessment to only finance and profitability (Blair, et
al., 2003). The TBL ultimately assumes that there are environmental, economic and
social ‗bottom-lines‘ which should be incorporated into any business and financial
reporting (Coffman & Umemoto, 2010).
In urban planning discourse, the TBL is also based on the three pillars comprising
environmental, social and economic sustainability (Pope, et al., 2004; Mori &
Christodoulou, 2012). The Johannesburg Declaration on Sustainable Development
(United Nations, 2002) for example explains that the TBL sustainability has three
mutually reinforcing pillars of sustainable development, namely, economic
development, social development and environmental protection. At this juncture,
sustainability is perceived as the position where these three pillars interact and create a
common platform (Figure 2-14) from which sustainable development can be attained
or exercised to achieve common benefits for all (ICLEI, 1996; Pope, et al., 2004).
Increasingly, the TBL is used as an assessment to direct planning and decision-making
towards sustainable development goals (Pope, et al., 2004; Hacking & Guthrie, 2008).
TBL evaluation has been applied to the sustainability assessment of human
Page 67
Chapter 2 47
settlements, and this study has been extended to the assessment of residential
development layouts. Blair et al. (2003), for example, uses the TBL framework,
employing a number of TBL indicators to assess the affordability and sustainability
outcomes of master-planned communities. Zakaria and Yang (2004) have also applied
the principles reminiscent of sustainable TBL to identify strategies for smart and
sustainable housing developments in industrial areas. According to Kavaliauskas
(2008), TBL sustainability interest, which includes environmental, economic and
social categories, can be designed through the coordination of the land use
management and spatial planning.
Figure 2-13: The three pillars of sustainability model derived from ICLEI, (1996)
From the spatial planning point of view, the TBL assessment, along with assessment
approaches by other names such as integrated assessment, sustainability assessment
and extended impact assessment refers to evaluation techniques which incorporate,
combine or extend the different types of categories or impacts (Hacking & Guthrie,
2008). Even though the delineation between each assessment approach is not clear, the
TBL and other assessment approaches have the same aim of promoting, evaluating or
directing planning and decision making towards achieving sustainable development
(Pope, et al., 2004; Hacking & Guthrie, 2008).
Page 68
48 Chapter 2
However, according to Hacking and Guthrie (2008) the use of TBL assessment
terminology is inconsistent and, sometimes, confusing because of the variety of
acronyms and terms in use and the meaning can differ not only between countries but
also between assessment levels. Pope et al, (2004) also argue that even if theoretically
TBL may sound feasible, in practice it should be applied with caution because if the
interrelations between the three pillars are not adequately understood, sustainability
would be reduced to three separate factors rather than the whole. Despite these
criticisms, the TBL inclusion in sustainability agenda is fundamental because it forms
one of the two main elements of sustainability and assessment including at the local
level, the other one being ‗over time preservation or intergenerational equity‘ (Mori &
Christodoulou, 2012, p. 96). The following section describes sustainability indicators
and their use in measuring sustainability.
2.11.3 Multi-attribute evaluation of plans
Many evaluation studies, including plan evaluation adopt performance assessment
methods across multiple indicators of differing measurement units. When used to
make comparisons among alternative projects, it is helpful to summarise the indicator
scores in a single aggregate value or index to allow meaningful comparison among
these alternatives. Such complex evaluation studies can be made simple using multi-
attribute evaluation or multi-attribute utility technique (MAUT). It is a decision
analysis technique that offers a structured way to weight, evaluate and make a
selection from a range of options or alternatives using a quantifiable method
(Edwards, 1982; Dawes et al., 2003; Frowein et al., 2004). In other words, it measures
how well attributes of a given alternative fare against a predefined set of evaluation
criteria.
MAUT utilises the importance value or weight assigned to each criterion on a given
alternative, and transforms these measures to a common scale (Frowein et al., 2004).
The score from all relevant criteria for each alternative are summed up to a single
aggregate value. Normally an alternative with the highest score will be selected as the
best or the winning alternative (Dawes et al., 2003). Generally, a MAUT process takes
six stages to complete (Hajkowicz, 2005), namely;
Page 69
Chapter 2 49
a) Identifying the indicators which will form a part of the evaluation framework.
b) Identifying the set of actions, projects or programs being evaluated.
c) Weighting the importance of each indicator.
d) Converting the scores of indicators initially measured in different units into a
common scale.
e) Combining the converted scores and weights using an aggregation technique in
order to measure the outcome of each alternative.
f) Performing sensitivity analysis on the weights, indicator scores, conversion
methods and aggregation techniques.
One advantage of this evaluation technique lies in the evaluation of alternatives. Since
the criteria selection normally involves a consensus-based approach and rigorously
assessed prior to being selected, it reflects a structured and solid evaluation against
these alternatives (Dawes et al., 2003). Another advantage of MAUT is on the
practical side where the evaluation can be transformed into a standardised, logical
numerical score. This facility enables an analyst ‗to safely add apples and oranges‘
(Hajkowicz, 2005, p 59), hence can minimise what would have been a complex
comparison between alternatives. However some authors argue that MAUT tend to
invite conflicts and contention particularly in the discussion of attribute specifications,
making it hard to reach a consensus (Dawes et al., 2003). This has resulted in others
considering MAUT as time consuming and at times, it is almost impossible for all
parties to come to an agreement that satisfies everyone involved, especially those
involving controversial studies.
2.12 Performance measurement
Traditionally, performance measurement has been limited to finance, manufacturing
and organisational systems (Pawar and Driva, 1999). Following sustainability concern
about the environment, growing public pressure has seen organisations increasingly
assessing the performance of development, particularly involving physical and land
use developments (Lundberg et al., 2009). According to Becker (2005), such
measurement evaluates the human influence on the environment by comparing a
descriptive indicator with a reference value or target to determine progress towards
Page 70
50 Chapter 2
sustainability. The author argues that the ability to measure progress is crucial because
it operationalises and raises sustainable development concepts to another level.
Hopkins (2012) argues that in assessing plans, planners should not only look into the
performance of plans, but also the conformance of the plans as well. According to
Dusenbury (2000), performance measurement provides or reports feedback on results
of strategic planning or activities, as shown in Figure 2-15. The feedback is then
utilised to adjust and strengthen the strategic plans to be on track towards achieving
desired goals, for example sustainable development.
Figure 2-14: The circle of strategic planning and performance measurement
(Dunesbury, 2000)
Despite the increasing importance of measuring performance in spatial planning, little
has been written in this area, especially to address emerging issues of
operationalisation (Planning Officer‘s Society, 2000; Carmona and Sieh, 2005; 2008).
Morrison and Pearce (2000) argue that many planning objectives are often difficult to
describe with measurable connotation because their processes reflect some kind of
intervention in the free market that would continue to operate even if such
intervention does not occur. In their study of performance measurement innovation in
English planning authorities, Carmona and Sieh (2005) highlight the difficulties but
promising initiatives in developing a holistic performance measurement. Part of these
difficulties stem from the complex nature of planning as both regulatory and
visionary, politically inclined and legally defined, long term and short term, and
having to mediate between the environmental, social, and economic outcomes of
development (Carmona and Sieh, 2008).
Page 71
Chapter 2 51
Despite these difficulties, their subsequent study revealed that there is a strong belief
in the importance of performance measurements, especially within local authority
level. They strongly believe it is highly legitimate to measure performance in
planning, and the ultimate goal in their planning activities is to achieve sustainable
development, which they consider as a measurement of success (Carmona and Sieh,
2008). In addition, while the best way to understand any indicator is by expressing it
in its absolute value (Jasch, 2009), using indicators in performance measurements
requires a comparison of its value in relation to denominators also used by other
indicators. This will provide an initial common platform for performance
measurement to take place.
From its absolute value, an indicator can be expressed in relative figures, percentages,
aggregate and finally weighted value (Jasch, 2009, p. 56), and it is this final
expression that makes performance evaluation possible. In the case of this research on
residential developments sustainability, such evaluation would help gauge the level of
sustainability being achieved by residential neighbourhoods. In this research, a set of
indicator list will be derived from a review of existing research, and verified by local
experts from the development field, before being included in a proposed assessment
framework.
2.13 Indicators and sustainability measurements
2.13.1 Definitions of indicators
Almost all assessment methods whether single or integrated, or using qualitative or
quantitative data, adopt some form of indicators to assist in measuring output (Becker,
2005; Olalla-Tárraga, 2006). Of the many definitions of indicators which have been
put forward in various literature and studies (Maclaren, 1996; UNDP, 2001; World
Bank, 2002; Winston & Eastaway, 2008; Mori & Christodoulou, 2012), the best
working definition of an indicator is perhaps by OECD (2001, p. 8), which states that,
‗An indicator can be defined as a parameter, or a value derived from parameters which
provides information about a phenomenon‘. It is a tool or instrument that
‗communicate[s] information…[and] transcend[s] the direct meaning of data‘ (Olalla-
Tárraga, 2006, p. 3) or is a ‗representation of a measure…to indicate a condition‘
(Becker, 2005, p. 205). They are widely used for their capability in transforming
Page 72
52 Chapter 2
meaningless data into information (Hak, Moldan, & Dahl, 2007), as well as complex
systems of information into ordinary simplified expressions. In the field of urban
development, Sustainable Seattle (1993, p. 4) defined urban sustainability indicators
as ‗reflect[ing] something basic and fundamental to the long term economic, social or
environmental health of a community over generations‘.
Maclaren (1996) cautioned, however, that indicators are mostly simplified versions of
complex phenomena; hence, should only be treated as something that gives an
indication of a situation. Additionally, it should be noted that there is no such thing as
a ‗one-size-fits-all‘ indicator. Unfortunately, while much has already been written
about the sustainability concept of human settlements, a shortage of research
contributions exists on the reflective experience of sustainability indicator use, as well
as lessons pertaining to its experience (Bell & Morse, 2008, Choguill, 2008).
2.13.2 Development of indicators
Since the early 1980s, and in particular after the launch of Agenda 21, the importance
of indicators in the development of human settlements at the national and international
levels has been well defined. For example, the United Nations Development
Programme (UNDP) produced the Human Development Report, which used social
and economic indicators to measure human development and health between countries
called the human development index (UNDP, 2001). However, it does not measure
the sustainability of human settlements. The World Bank produced the World
Development Indicators comprising 600 indicators under six themes (world view,
people, environment, economy, state and markets and global links) (World Bank,
2002). However, only environmental has a general classification related to land use.
The United Nations Commissions on Sustainable Development (UNCSD) was the
first organisation to develop an indicator set in 1996 (UNCSD, 1996). This indicator
set, which was revised in 2001, comprised 58 core indicators pertaining to
environmental, economic, social and institutional. However, it has limited indicators
in relation to residential development and only includes five general housing related
indicators. Nonetheless, it has become a starting point for many countries to start their
national indicator programmes (Haas, Brunvoll, & Hoie, 2002). Although the
European Common Indicators (ECI) project has released general environmental,
Page 73
Chapter 2 53
economic and social indicators, it also has very limited indicators on housing that
include availability, affordability and access to council housing (Winston & Eastaway,
2008). The European System of Social Indicators (EUSI) produced an indicator set
that includes housing as one of a number of life domain indicators. These indicators
include, among others, availability and size of dwellings, amenities and facilities,
tenure, housing conditions, safety of residential area and energy consumption
(Winston & Eastaway, 2008). It can be concluded that even though indicator
development for sustainability has been around for a long time, they are mostly
developed and used at international level. Indicators applicable at national level are
limited, let alone those focusing at local level.
2.13.3 Indicators in physical planning
The strength of indicators lies in their usefulness in specifying measures, such as in
terms of desired outcomes, and based on an agreed policy. Maclaren (1996) outlined
four key characteristics that urban sustainability indicators should possess: ability to
be integrated, forward-looking, distributional and multi-stakeholder input. The author
stated that integrating indicators should work to provide good linkages among the
dimensions of sustainability. Forward-looking indicators should indirectly inform on
the potential future sustainability of a development path through the use of indicator
targets and thresholds. Distributional indicators should be able to account for the
distributive effects of domain conditions across a geographical context. Additionally,
they should also differentiate between local and non-local sources of environmental
effects. The final key characteristic that all sustainability indicators must have, and the
one that identifies it from other types of indicators, is the stakeholders‘ input in
developing the indicators (Maclaren, 1996). The basic nature of indicators is that most
are value-laden, and obtaining involvement from stakeholders is the best way of
soliciting the most reliable and valid indicators.
In physical planning, indicators are crucial as they help decision-makers transform
broad sustainability concepts into specific measures from which development progress
can be evaluated. Indicators serve three main purposes, namely, to (a) link objectives
to policy and improve decision-making, (b) provide report of an assessment, and, (c)
generate a consensus. The key purpose of indicators in physical planning is for
reporting the measurement of environmental, social and economic trends or
Page 74
54 Chapter 2
phenomenon (Maclaren, 1996). In this respect, there are three related purposes for the
reporting the measurement of sustainability indicators: planning tools for policy
process, communication tools for policy assessment and performance and assessment
tools for evaluating development progress (Hardi, et al., 1997; Hezri, 2004; Carmona
& Sieh, 2005, 2008; Winston & Eastaway, 2008; Winston, 2009). Among these three,
performance measurement or indicators have been widely used in planning
applications because it provides a sound basis for measuring the success of planning
projects or actions.
2.14 Indicators for measuring residential sustainability
At the national level, the United States Green Building Council produced the LEED
for the Neighbourhood Development Rating System, which is a national standard for
assessing and rewarding environmentally superior neighbourhood development
practices by placing emphasis on site selection, design and construction (USGBC,
2009). It comprises 31 indicators under three themes (smart location and linkages,
neighbourhood pattern and design and green infrastructure. The rating system works
by awarding credit weightings on projects or neighbourhoods that perform well in
terms of smart growth, urbanism and green building (USGBC, 2009). These are
elements that contribute to sustainability. Another assessment criterion called the
green building index was developed for residential new construction (PAM, 2009).
The rating system, divided into six themes (energy efficiency, indoor environmental
quality, sustainable site planning and management, material resources, water
efficiency, and innovation), was mainly created for defining a standard of
measurement for green buildings. However, some of the indicators used in this rating
system also apply to general residential development. The Hunter New England
Population Health (HNEPH) developed a liveability index, which comprises 17
liveability indicators categorised under 4 themes (accessibility, connectivity,
sustainability and flexibility) (HNEPH, 2011). Most of these indicators are related to
access to neighbourhood facilities.
Aurbach (2005) developed the Design Rating Standards, which consist of 9 indicators
for the neighbourhood evaluation system. The standards mainly comprise
environmental and social indicators that focus on general layout design evaluation.
Page 75
Chapter 2 55
Hart (2006) compiled a comprehensive list of sustainable community indicators,
which encompass economic, social and environmental aspects, and are intended as a
guide to measure progress towards becoming more sustainable. Other indicator studies
include those by Fahy and Ó Cinnéide (2007) on quality of life, which include
transport, community and environment; Halme et al. (2006), which include indicators
on environmental, social and economic aspects of household services; and Blair et al.
(2003), which has a number of highly relevant indicators concerning residential
sustainability, which his team used in an interesting study on housing affordability and
sustainability of master-planned communities in Australia.
Tables 2-4 to 2-6 show compilation of indicators generated from the literature search
from various reports, empirical and theoretical studies which are related to residential
developments. These include established general residential assessment tools such as
the LEEDS for neighbourhood development (USGBC, 2009), TND ratings (Aurbach,
2005), and the Smart Growth INDEX (USEPA, 2002). These indicators are divided
into three categories (environmental, social, and economic) to reflect the three
sustainability domains adopted for the proposed sustainability assessment framework.
Page 76
56 Chapter 2
Table 2-4: Compilation of 80 environmental indicators related to residential
development (adapted from USEPA, 2002; Aurbach, 2005; Halme et
al., 2006; Hart, 2006; HNEPH, 2011; PAM, 2009; USGBC, 2009)
Preferred locations Population density
Brownfields redevelopment Use mix
Bicycle network and storage Average parcel size
Steep slope protection Developed acres per capita
Site design for habitat or wetland Conforming dwelling density
Restoration of habitat or wetland Non-conforming dwelling density
Conservation management for habitat or wetland Single-family housing share
Walkable streets Mobile home housing share
Compact development Multi-family 2-4 housing share
Reduce parking footprint Multi-family 5+ units housing share
Street network Group quarters housing share
Tree-lined and shaded streets Residential water consumption
Certified green building Residential energy consumption
Building energy efficiency Population density
Building water efficiency Use mix
Water efficient landscaping Average parcel size
Resource preservation and adaptive reuse Developed acres per capita
Stormwater management Conforming dwelling density
Heat island reduction Non-conforming dwelling density
Solar orientation Single-family housing share
On-site renewable energy sources Mobile home housing share
Infrastructure energy efficiency Multi-family 2-4 housing share
Recycle content in infrastructure Multi-family 5+ units housing share
Light pollution reduction Group quarters housing share
Energy efficiency (EE) Residential energy consumption
Renewable energy Imperviousness
Minimum air quality performance Stormwater runoff
Daylighting Total suspended solids
Site selection Open space
Public transport access Park space availability
Open spaces, landscaping and heat island effect Residential wastewater production
Stormwater management Street centerline distance
Avoiding environmentally sensitive areas Sidewalk completeness
Access to quality physical activity promoting
environment Pedestrian route directness
Connectivity through neighbourhood design Street network density
Sustainability of the physical environment Street connectivity
Flexibility of public spaces Bicycle network
Mixed use Residential water consumption
Connectivity Non-residential wastewater production
External connections Brownfields redevelopment
Location
Page 77
Chapter 2 57
Table 2-5: Compilation of 37 social indicators related to residential development
(adapted from USEPA, 2002; Aurbach, 2005; Halme et al., 2006; Hart,
2006; HNEPH, 2011; PAM, 2009; USGBC, 2009)
Mixed-use neighbourhood centres Connectivity through feeling of safety
Mixed-income diverse communities Sustainability of transport
Transit facilities Proximity (school/parks/transit)
Access to civic and public space Housing proximity to transit
Access to recreation facilities Housing proximity to recreation
Neighbourhood schools Housing proximity to education
Existing building reuse Housing proximity to key amenities
District heating and cooling Dwellings within 1/8 miles of 3+ modes
Wastewater management Transit stop coverage
Solid waste management infrastructure Regional accessibility
Sustainable maintenance Home-based vehicle trips
Community services and connectivity Non home-based vehicle trips
Access to education Home-based vehicle miles travelled
Access to childcare/services Non home-based vehicle miles travelled
Access to health services Parking demand
Access to communication Parking supply
Access to quality community facilities Transit service density
Connectivity through public transport Rail transit boarding
Connectivity through place/social cohesion
Table 2-6: Compilation of 11 economic indicators related to residential development
(adapted from USEPA, 2002; Aurbach, 2005; Halme et al., 2006; Hart,
2006; HNEPH, 2011; PAM, 2009; USGBC, 2009)
Housing jobs proximity Jobs/houses- workers balance
Local food production Conforming employment density
Affordable housing Non-conforming employment density
Housing Choice Employment proximity to transit
Housing proximity to employment centre Locations with reduced automobile dependence
Employment opportunity
The tables however may consist of similar indicators which are used in different
studies or projects. The table shows that environmental category has the most
indicators (80), followed by social (37), and economical (11). These give a total of
128 indicators to be considered for further selection.
Page 78
58 Chapter 2
2.15 Selection of potential indicators
The process of selecting indicators is generally complex and takes time (Hemphill,
Berry, & McGreal, 2004) because there is no standard practice and consistency in
selecting indicators regardless of the types of studies undertaken (Green & Champion,
1991; Hemphill, et al., 2004). Nevertheless, a few authors have listed down the
general guiding criteria for the selection process, including the number of indicators
that can be selected. Hatry et al. (1977) argue that when selecting indicators, they
ought to have the following criteria: valid and appropriate, reliable and accurate,
complete and comprehensive, cost effective and have short feedback time. Hemphill
(2004, p. 733) also stresses that each potential indicator should be assessed against
‗data availability, geographical specification, time-series prospects, implementation
and interpretability‘. The DETR (1998) lists down a more specific criteria that should
be taken into account in selecting indicators, namely, scientifically sound, measurable,
technically robust, easily understood, sensitive to change, and capable of being
regularly updated. With regard to the number of indicators that can be selected, Bell
and Morse (2008) suggest that 20 indicators is manageable for any study, whereas
Moles (2008) suggests up to 40 indicators can be used if time and resources are
available. It can be concluded that although there is no specific methodology for
selecting indicators, the process still follows scientifically acceptable steps to meet the
requirements of a specific study.
Biehl (1986) acknowledges that in any study, most indicators have a high possibility
of being considered as potentially relevant, and therefore, its selection must be
assessed rigorously. Hence, using the DETR recommendation for selecting the
indicators and applying it to a list of indicators derived from reviews of the related
literature on sustainable development, housing studies, and on assessment tools
focusing on residential development as identified in Tables 2-4 to 2-6, this research
identifies 38 potential indicators for assessing the levels of sustainability of residential
development layouts (Table 2-7).
Page 79
Chapter 2 59
Table 2-7: Potential indicators for assessing the levels of sustainability of residential
development layouts
Potential indicators
1. Land use mix diversity
2. Residential dwelling density
3. Impervious surfaces
4. Street connectivity
5. Street route directness
6. Pedestrian accessibilities
7. Pedestrian network coverage
8. Vehicular entry and exit routes
9. Non-motorised transport facilities
10. Open space/active greens per dwelling
11. Open space/active greens per development area
12. Natural topography preservation
13. Sensitive areas/natural environment preservation
14. Vegetation retained to create the development
15. Storm water retention/detention system
16. Tree planting for shades/wind-break
17. Building exposure to natural ventilation (non-disastrous winds)
18. Proximity to public transit nodes/system
19. Resident‘s vehicle kilometre travel (VKT)
20. Motor vehicle ownerships
21. Proximity to recreation facilities (parks/open space)
22. Proximity to education facilities
23. Proximity to local services (e.g.: grocery shops, nursery)
24. Availability of dedicated spaces for public amenities (e.g.: childcare, community centre,
place of worship)
25. Existence of well-defined boundary
26. Existence of neighbourhood central place
27. Availability of existing amenities and services (e.g.: schools, medical clinics, banks)
28. Provision of community centres
29. Provision of religious centres
30. Provision of common recreation facilities for all ages
31. Provision of safety elements in crime prevention (e.g.: street lighting, perimeter fence,
CCTV)
32. Traffic calming measures
33. Separation between pedestrian and motorised traffic
34. Availability of commercial establishments
35. Diversity of housing option
36. Provision of affordable housing
37. Employment opportunities within immediate vicinity
38. Avoidance of high grade land
Page 80
60 Chapter 2
These indicators are derived either wholly or from a group of indicators which has
similar purposes. The following section describes this potential indicator set according
to three categories (environmental, social and economic) for further consideration in
this research to develop a framework for measuring the level of sustainability of
neighbourhood layout in Malaysia.
2.15.1 Environmental sustainability
Dale (2001) argues that sustainable development can be seen as the reconciliation of
three imperatives — environmental, social, and economic — so that the natural
environment can thrive while human needs are met while promoting social equity.
Issues of environmental sustainability relate to how the development process affects
utilisation of natural resources and biodiversity of habitats (Deakin, Curwell, &
Lombardi, 2002). This research defines environmental sustainability as the quality
arrangement of physical attributes and neighbourhood design which are capable of
providing for and supporting the existence of a healthy neighbourhood environment
for the residents and surrounding habitat. Reviews of the literature identify a total of
17 potential indicators which can be grouped under the environmental category. These
indicators are as follows:
A land use mix indicator describes the mixing or distribution of different land uses
within a neighbourhood (Frank, Andresen, & Schmid, 2004; Aurbach, 2005). These
include residential, commercial, recreation, education and public amenities. The
incorporation of non-residential (retail, business and community facilities) within
residential development can reduce reliance on private vehicles, provide for local
working opportunities and enhance the interaction between residents. This further
enhances the livability and sustainability of the neighbourhood and its surroundings.
A dwelling density indicator describes the average density of dwelling units (in this
case residential units). This includes internal public streets plus half the width of
adjoining access roads of a designated residential area (AMCORD, 1997). Higher
densities are generally preferred because it minimises cost of providing infrastructure
and allow for utilisation of amenities in a given neighbourhood (Fleissig & Jacobsen,
2002).
Page 81
Chapter 2 61
An impervious surface indicator describes the imperviousness or surfaces covered by
impermeable materials such as roads, buildings, car parks, sidewalks and drainage
(Brabec, Schulte, & Richards, 2002; Stone, 2003; Brabec, 2009). An area with low
impervious levels can absorb more surface water and minimise the risk of flash floods
in a neighbourhood development.
Street connectivity describes street design that affects the overall neighbourhood
layout, and determines the densities that can be accommodated within a given layout
design (Dill, 2004). Street route directness, on the other hand, indicates the efficiency
of travel or directness of a route within a neighbourhood road network (Mackay, 2001;
Boer, Zheng, Overton, Ridgeway, & Cohen, 2007). External connectivity describes
the ease of connection between the neighbourhood and its surrounding developments.
This indicator which reflects the ease of movement in and out of the neighbourhood is
determined by the number of entry and exit points of the neighbourhood (Aurbach,
2005). Pedestrian accessibility indicator describes the ease of walking between points
of interests within the neighbourhood, and is important in determining whether a
neighbourhood has high accessibility or otherwise (Jones, 2001). While pedestrian
accessibility measures ease of walking, pedestrian network coverage indicates how
much developed land or how many dwellings in the neighbourhood are actually within
walking distance from the neighbourhood centre (Handy & Clifton, 2001; Mackay,
2001). Typical walking distances range between 400m (Giles-Corti et al., 2006;
Pikora et al., 2006) and 1000 metres (Frank, 2004; Hoehner, Brennan Ramirez, Elliott,
Handy, & Brownson, 2005). Non-motorised transport facilities indicator refers to
length of sidewalks and cycleway in the neighbourhood (PAM, 2009). This indicator
reflects the extent to which a neighbourhood is provided with facilities that encourage
sustainable form of transport.
Eight indicators are identified to represent natural and built form. These are open
space/active greens per dwelling, which refers to provision of green space for each
residential dwelling, and open space per development area, which refers to the
provision of total green space for each residential development (DTCP, 2003). Natural
topography preservation describes the retention of the original topography alongside
residential development (DTCP, 1995), while sensitive area preservation refers to
neighbourhood location that are away from any sensitive areas such as river banks,
Page 82
62 Chapter 2
catchment or floodplain (Houlahan & Findlay, 2004; PAM, 2009; USGBC, 2009).
Two indicators relate to vegetation, the first is the amount of original vegetation
retained in the completed development and provision of tree planting for shades or
protection from excessive wind (Redwood, 1994). The last potential indicator is
proportion of solar oriented lot, which refers to the exposure of building façade with
good solar orientation. Proper orientation with the sun exposure will generate
maximum use of natural forms of lightings (Clark, 2001; Saville-Smith, Lietz, Bijoux,
& Howell, 2005).
2.15.2 Social sustainability
The word ‗‗sustainability‘‘ has begun to move from an environmental focus away to
embrace economic viability and social equity (Coffman & Umemoto, 2010; Teriman
& Yigitcanlar, 2011). The objective of achieving sustainable community is enhancing
its human, economic, social and environmental quality. According to Deakin (2002),
social issues in human settlements concern among other things about access to
services, safety and security, and overall human health. Therefore, social sustainability
is defined in this research as the quality of being in a place (neighbourhood) that is
capable of providing and maintaining quality of life (equity of access to key services),
safety, and community cohesion. Reviews of literature identify 16 potential indicators
that can be grouped under the social category. These indicators are as follows:
Layout design that incorporates good proximity to amenities and services will benefit
residents because they do not need to travel to great distances to get the service
(Soltani, Primerano, Allan, & Somenahalli, 2006). This research uses five potential
proximity indicators: proximity to public transit node/system (Aurbach, 2005;
Friedman, 2005), proximity to recreation facilities (Cohen et al., 2007; Brown et al.,
2009; Cutts, Darby, Boone, & Brewis, 2009), proximity to education facilities
(Aurbach, 2005; Bigotte & Antunes, 2007); proximity to local services (Pikora, et al.,
2006) and proximity to neighbourhood central place (Mackay, 2001).
The provision of amenities in a neighbourhood is an important contribution towards
creating a socially sustainable neighbourhood because it offers quality of life to
residents. Indicators for three types of amenities are included under this social
Page 83
Chapter 2 63
sustainability: provision of community centres (Mackay, 2001), provision of religious
centres (DTCP, 2003), provision of sports and recreation facilities (Mackay, 2001;
DTCP, 2003; Government of Malaysia, 2007).
A socially sustainable neighbourhood includes elements of safety and security among
its residents. Three indicators related to this issue are identified: provision of safety
elements in crime prevention (Mackay, 2001; Foster, Giles-Corti, & Knuiman, 2010),
traffic calming measures (DTCP, 2003), the separation between pedestrian and
motorised traffic (DTCP, 2003).
2.15.3 Economic sustainability
Economic sustainability in urban planning relates to issues about the financing of the
infrastructures, transport and utilities required for the built environment to
accommodate the urban development process and employment of resources associated
with this (Deakin, et al., 2002). In neighbourhood planning, it is about utilising the
available resources as efficient as possible and providing options for people with
diverse economic background. In this regard, economic sustainability is defined in this
research as the quality of being in a place (neighbourhood) where resources are
efficiently used, economic capital is provided and maintained, and human capital is
utilised.
Reviews of literature identify five potential indicators under the economic category.
Although not directly related to the neighbourhood layout, the existence of these
indicators contributes to enhancing the sustainability of neighbourhood. First is the
availability of diverse range of commercial establishments. This refers to the different
types of business activities in the neighbourhood such as convenience store, laundry,
restaurants etc. (USGBC, 2009). Second is the diversity of housing option, which
refers to residential developments that offer variety of housing choice that people from
different economic background can choose from (Aurbach, 2005). Third is the
provision of affordable housing, which refers to the availability of housing types that
can be afforded by people within the low income group (DTCP, 1995; KLCH, 2003).
The fourth potential indicator refers to the availability of employment opportunities
within immediate vicinity (Mackay, 2001). The last indicator is avoidance of high
Page 84
64 Chapter 2
grade soil, which refers to avoiding as much as possible from constructing
development on land of high grade due to its potential for agricultural activities.
Development on lower grade soil is preferred over higher grade that is most beneficial
for agricultural purpose.
2.16 Conceptual framework
This research aims to develop a comprehensive set of indicators and put forward a
new evaluation framework for assessing the sustainability levels of residential
development layouts. This is because although the significance of residential
development in contributing towards sustainability is enormous (Friedman, 2005;
Choguill, 2008; Winston, 2010), there have been limited indicators and assessment
methods for determining the sustainability levels of residential development focusing
on neighbourhood layouts. Despite the need to also look into the conformance part as
well as its performance when evaluating plans (Hopkins, 2012), this research focuses
only on the performance-based indicators, to measure the performance of plans in
terms of its sustainability levels. This is because of the increasing importance of
performance measurements, especially within a local authority level, where it is
considered as highly legitimate to measure performance in planning, and to achieve
sustainable development (Carmona and Sieh, 2008).
Cauwenbergh et al. (2007) highlight that many of the existing indicator sets and
frameworks suffer from a common drawback of only partially covering sustainability
issues. Hurley et al. (2008) add that another limitation of assessment frameworks also
includes its inadequacies in describing their context clearly, thus losing their essential
functional properties. In order to avoid these deficiencies, this research therefore
follows the Triple bottom line (TBL) approach as described earlier because the TBL
incorporates the three main sustainability pillars (environmental, social and economic)
for selecting indicators (ICLEI, 1996; Pope, et al., 2004; Coffman & Umemoto, 2010;
Mori & Christodoulou, 2012). By incorporating and describing these three pillars
clearly, issues of partial coverage and ambiguities in selecting potential indicators can
be largely avoided.
Page 85
Chapter 2 65
In terms of formulating the assessment framework, this research adopts the suggestion
by Bell and Morse (2003) on the advantage of having a framework of indicators to
measure development sustainability. This research also uses Maclaren‘s (1996)
guidelines for developing the sustainability assessment mechanism, and adopts her
domain-based framework which also utilises three categories – environmental, social
and economic – to evaluate the level of sustainability of residential development
layouts (Figure 2-16).
Figure 2-15: Domain-based framework utilising environmental, social and economic
sustainability
The research selects the domain-based framework because it is closer to the TBL
approach, in terms of putting great importance on the use of domains or pillars for
specifying sustainability efforts. It is also in line with current trends in sustainability
planning and operationalization including in physical planning which incorporates the
three main pillars of sustainability.
From the combination of the domain-based framework and the triple bottom line
sustainability, this research generates a conceptual framework for measuring the
sustainability levels of residential development layouts (Figure 2-17). In this
conceptual framework, the determination of indicators is based on the three categories
of environmental, social and economic, which are independent of each other. Each of
these categories will have its own indicators that will be used in the assessment
Page 86
66 Chapter 2
process to determine its score. The combined scores of the indicators will be used in
the calculation of overall sustainability levels of the residential development layouts.
As shown in Figure 2-17, the link between the indicators (indicator scores & indicator
weighting) and category aggregate will be utilised to generate the sustainability
composite index (SCI) for the case studies (Nardo, Saisana, Saltelli, & Tarantola,
2005).
Figure 2-16: Conceptual framework of the study developed based on the triple bottom
line sustainability
Because there are currently no assessment tools for measuring the sustainability of
residential layouts in Malaysia, this study develops the initial indicator set from
existing literature on sustainability assessment, including assessment tools which are
applicable to the general assessment of residential development. The reviews of
literature generate 38 potential indicators for measuring the levels of sustainability of
neighbourhood layouts. Figure 2-18 presents the scenario when these potential
indicators are absorbed onto the conceptual framework.
Page 87
Chapter 2 67
Figure 2-17: Potential indicators within the conceptual framework of the research
2.17 Summary
While current residential development is increasingly promoting the master-planned
based development concept as superior to other forms of residential development,
there is little evidence that their physical layouts are better than conventional
residential development layouts. This research focuses on residential development
Page 88
68 Chapter 2
because of its great impact on sustainability. Not only does it occupy an increasing
percentage of urban land use, its location and design have environmental, social and
economic implications.
The literature search on potential sustainability indicators represents a significant step
forward towards realising a useful way to assess the sustainability levels of residential
developments and to fill this research gap. Based on the research aims and objectives,
and the gaps identified in this research, the reviews of literature generate 38 potential
indicators for measuring the levels of sustainability of neighbourhood layouts.
Following the reviews, a conceptual framework is developed to show the relationships
between the potential indicators and the triple bottom line sustainability approach to
be used as a basis for undertaking this research.
The conceptual framework also guides the formulation of the assessment method for
determining the sustainability levels of residential development layouts. By having
some form of sustainability assessment, planners and stakeholders would be able to
determine whether sustainability elements exist at the planning stages of residential
development or whether certain types of existing residential developments are
sustainable, or more sustainable than the others. The applicability of this framework
will be tested in case studies involving residential neighbourhood developments.
Details of the associated methodological approach used in this research are discussed
in the following chapter.
Page 89
Chapter 3 69
Chapter 3: Research Methodology
3.1 Introduction
This chapter justifies the methodology adopted in this research in order to achieve the
research aim and objectives. This study aims to develop a framework for measuring
the level of sustainability of neighbourhood development layouts and test it to the
three types of residential developments in Malaysia. The specific objectives are to
investigate indicators for the development of the framework to measure the level of
sustainability of the neighbourhoods, to establish measurement and scale, as well as
weighting of indicators and aggregation of categories for the development of the
framework, to validate the development of the framework for measuring
neighbourhood sustainability, and, finally, to test the framework to the three types of
residential development to determine their level of sustainability.
This chapter is organised into seven main sections. Following introduction, the second
section discussed the research strategy, and justifications for adopting the selected
research strategy for this study. The third section explains the research design for the
study to answer these research objectives, which includes research instrument design,
sampling selection procedures. The fourth and fifth sections describe the collection of
data for Delphi survey and the digital spatial data respectively. The sixth section
outlines the procedure for analysing the data to answer each research objectives, and
the development of the framework for measuring the level of sustainability of
neighbourhood developments. The final section concludes with a summary of the
chapter.
3.2 Research strategy
The purpose of the research strategy is to provide a direction to guide this study. This
research aims to develop a framework for measuring the level of sustainability of
neighbourhood developments and later to apply it to the three types of residential
development in Malaysia. Several approaches provide the necessary steps in
answering the research objectives, such as the quantitative method, qualitative
method, and mixed method. The quantitative research strategy places emphasis on
Page 90
70 Chapter 3
quantification of data and its analysis (Bryman, 2006) and uses experiments, surveys,
or an explanatory study to answer the research questions (Babbie, 2005, 2008) .
In contrast, the qualitative research strategy utilises the power of words rather than
figures in data collection and analysis (Bryman, 2006). The data collection format
includes documentation of real events, records of what people say, or the study and
interpretation of written documents or visual images (Baker, 1999; Neuman, 2006b).
In recent years, there has been increased interest in the mixed methods approach,
which uses a combination of quantitative and qualitative research strategies (Bryman,
2004; Halcomb, Andrew, & Brannen, 2009; Kroll & Neri, 2009; Teddlie &
Tashakkori, 2009; Creswell & Plano Clark, 2011). These different research strategies
have different strengths. Creswell et al. (2007) suggested that several aspects need to
be considered: the skills that are possessed by the researcher (quantitative and
qualitative), the availability of resources (time, and funding), the expectations of the
audience for the study, and the selected research design should match the research
questions. Importantly, Creswell (2009) pointed out that the researcher should choose
the research strategy that best suits the needs and purpose of the research in order to
obtain research outcomes that have real world practice value.
Taking into account these considerations, a mixed methods research strategy through
the use of embedded research design was considered to be the best choice to answer
the four research objectives for this study. Embedded research design involves
embedding one dataset within the other so that one type of data provides a supportive
role for the other dataset (Creswell & Plano Clark, 2007). This sequential approach
benefits this study as this study needs quantitative data to develop the framework and
requires spatial data to validate the framework before its application. In respect of the
application of the framework, further quantitative data extracted from spatial analysis
needs to be inserted into the framework to determine the level of sustainability of the
case studies. The next section elaborates upon the research design that has been
chosen for this study.
Page 91
Chapter 3 71
3.3 Overview of research design of the study
Following identification of the research strategy and prior to the commencement of
data collection or analysis, a research design (or research plan or structure) needs to be
constructed (Blaike, 2000; Vaus, 2001). The research design is typically a procedure
or process to answer the research questions with the most appropriate and feasible
methods (Sproull, 1995), and as unambiguously as possible (Blaike, 2000). Having a
research design serves to clarify the logic of the research and avoid any discrepancy
between the empirical evidence and the initial research questions. This is achieved by
specifying the way data in a research study is collected, analysed, interpreted and
reported (Creswell & Plano Clark, 2007). Therefore, setting a sound research design
that will hold together all of the elements in a research project is a very important step
in order to achieve the best outcomes for the research project. Figure 3-1 shows the
overall research design adopted in this study.
The overview of the research design for the study covers a breakdown of the research
process, showing the aim and objectives, the methods and sources of data collection,
the types of analysis involved and the interpretation of findings. The main aim of this
study is to measure the level of sustainability of the residential neighbourhood
development layout, which requires an investigation to identify relevant and important
indicators for use in this measurement, developing the assessment framework and
applying the indicator based framework to case studies of different neighbourhood
developments. In order to achieve the research aim and objectives, this study adopted
an embedded research design, and employed two types of data collection procedures –
quantitative Delphi survey and spatial data.
In this study, the first type of data collection involves the use of a three-round
modified Delphi technique to elicit consensus opinion from a selected group of
experts. The second type of data collection is the digital spatial data of three selected
cases of different types of neighbourhood development. The following two sections
present detailed procedures of the data collection and analysis adopted in this study.
Page 92
72 Chapter 3
Figure 3-1: Research design for the study
Page 93
Chapter 3 73
3.4 Collection of data for Delphi survey
A Delphi survey approach is used for data collection to investigate relevant indicators,
and to establish the indicator weighting and aggregate category for the development of
the framework to measure the level of sustainability of neighbourhood development
layout. A Delphi survey is one of the judgment techniques that have been found
appropriate for developing rank evaluation criteria or indicators. This survey
technique involves an iterative process of collecting and modifying judgments from
experts via a series of questionnaires and controlled feedback (Powell, 2003; Hung,
Altschuld, & Lee, 2008; Grisham, 2009; Landeta & Barrutia, 2011). Much has been
said about the usefulness of the Delphi technique as a data collection instrument
(Dalkey, 1972; Mitchell, 1991; Rowe, Wright, & Bolger, 1991; Adler & Ziglio, 1996;
Rowe & Wright, 1999; Powell, 2003; Skulmoski, Hartman, & Krahn, 2007; Grisham,
2009; Landeta, Barrutia, & Lertxundi, 2011). Reviews by Mitchell (1991) and Powell
(2003) on the methodological approaches and a range of Delphi studies revealed that
Delphi is an established technique for harnessing the opinions of diverse groups of
experts on practice-related problems. It has the flexibility of being a judgement and
decision-aiding tool in cases where a consensus decision is difficult to obtain or where
a clear-cut decision is difficult to achieve (Rowe & Wright, 1999).
One powerful advantage is its ability to provide hindsight and garner consensus where
the knowledge or evidence about the issue of interest is lacking or even unknown
(Adler & Ziglio, 1996; Murphy et al., 1998). Other advantages include, but are not
limited to, the Delphi‘s superior accuracy (Dalkey, 1972; Riggs, 1983; Mitchell,
1991), preserving anonymity of respondents (Vidal, Marle, & Bocquet, 2011) and
reducing time and cost constraints, especially when the experts are geographically
dispersed (Mitchell, 1991; L. Green & Kreuter, 1999). Due to these advantages, the
Delphi technique has been used in numerous fields including health, business,
engineering and project management (Vidal, et al., 2011). Nevertheless, the technique
has also attracted its fair amount of criticism including poor results due to poor choice
of experts (Gupta & Clarke, 1996), the subjective definition of expertise and expert
selection bias (Mitchell, 1991), and the fact that it cannot produce ‗clinical-type
accuracy‘ of results (Grisham, 2009, p. 125). Hung et al. (2008) made a useful
summary of the typical strengths and weaknesses of the Delphi technique, as
Page 94
74 Chapter 3
highlighted in Table 3-1. Despite these criticisms, Delphi‘s powerful flexibility and its
ability to shed light on issues, where knowledge in neighbourhood sustainability
assessment is less than clear, warrant the use of this technique more than other
consensus seeking techniques for the first stage of this study.
Table 3-1: Strengths and weaknesses of Delphi technique (Hung et. al., 2008, p. 63)
Strengths Weaknesses
Consensus-building
Future forecasting
Bring geographically dispersed panel
experts together
Anonymity and confidentiality of responses
Limited time required for respondents to
complete surveys
Quiet, thoughtful consideration
Avoids direct confrontation of experts with
one another (encourage honest opinion, free
from group pressure)
Structured/organised group communication
process
Decreasing somewhat a tendency to follow
the leader
Focussed, avoids unnecessary side-tracking
of panellists
Ties together the collective wisdom of
participants
Possibly motivational and educational for
participants
Cost effective and flexible/adaptable
Validity, as the content is driven by
panellists
Fairly simple to use
Beneficial for long-range educational
planning and short-term decision making
Applicable where there is uncertainly or
imperfect knowledge, providing data where
little exists before
Best used as establishing the basis for future
studies
Accommodates a moderately large group
Group pressure for consensus – may not
be true consensus
Feedback mechanism may lead to
conformity rather than consensus
No accepted guidelines for determining
consensus, sample size and sampling
technique
Outcomes are perceptual at best
Requires time/participant commitment
Possible problems in developing initial
questionnaires to start the process
May lead to hasty, ill-considered
judgement
Requires skill in written communication
Potential danger of bias – surveys are
open to manipulation by researcher
Selection criteria for panel composition
Time delays between rounds in data
collection process
May force a middle-of-round consensus
Concerns about the reliability of the
techniques
Drop-outs, low response rate
Page 95
Chapter 3 75
3.4.1 Questionnaire design
The questionnaire for this study was designed primarily to guide data collection from
expert respondents. The input from experts from the three Delphi rounds helped to
identify relevant indicators that influence neighbourhood sustainability, and to
generate the weighting for each indicator. The questionnaire was designed to be
consistent with Neuman‘s (2006a) suggestion that they include introductory remarks
on instructions for clarification, and questions to measure each variable. The
questionnaire for all three Delphi rounds was listed in Appendix B, C and D. The
questionnaire used the English language because all the expert respondents
(Malaysian and international) were expected to fully understand English.
The Delphi survey questionnaire was designed individually for each round because
the different rounds served a different purpose. The round one questionnaire was to
examine relevant indicators for measuring the sustainability of residential
neighbourhood layouts and to ascertain the content validity of indicators according to
their category based on expert perceptions (Pikora, et al., 2006). The round two
questionnaire aimed to identify only the key indicators from a list of indicators
identified in the round one of the survey. Meanwhile, the round three questionnaire
was to finalise the respondent‘s selection on any remaining indicators which were yet
to achieve a group consensus, whether it is important or otherwise. With regard to the
measurement scale, the researcher used a five-point Likert scale for the round one
survey. However the researcher realised that a more detailed rating scale was required
for the rounds two and three because the rating would be used to generate the
indicator weightings. Therefore a seven-point Likert scale of measurement was used
in rounds two and three of the survey.
In the first Delphi round, the questionnaire was to identify relevant indicators among
the three categories (environmental, social and economic) for measuring the
sustainability of residential neighbourhood layouts. In this round, the questionnaires
contained a list of 38 potential indicators from three categories (environmental, social
and economic), which was used as a basis for the experts to select relevant indicators.
Page 96
76 Chapter 3
The question was ―Please rate the level of relevance of the following indicators for use
in measuring the sustainability levels of residential neighbourhood layouts‖. The five-
point Likert scale used in this round of questionnaire ranged from 1 (very low
relevance) to 5 (very high relevance).
This second Delphi round was to obtain consensus on the level of importance of each
category and their indicators for measuring sustainability of residential development
layouts (Veal, 2006). The questions in this round asked expert respondents to rate the
level of importance of each indicator that contributes to the level of sustainability of
residential neighbourhood development layouts. The question was ―Please rate the
level of importance (7-point scale from very low to very high) of the following
indicators that contribute to the sustainability assessment of residential neighbourhood
layouts‖. Results from the importance levels assigned by the experts were used to
measure the relative weighting of each indicator. In addition, a question was also
designed to ask respondents to allocate a relative importance score for each
sustainable category based on a total of 100 points. The question was ―Please allocate
based on a combined total of 100 points the relative importance of each sustainability
category‖. This second question was to measure the relative weighting of each
category to help develop the framework.
In round three of the Delphi survey, the purpose was to reconsider those indicators
which were rated as important but did not achieve consensus in the previous Delphi
round (round two). In other words, the remaining indicator(s) were unable to generate
the required 75% agreement of relevance. The question asked was ―Based on the
group mean result from the Delphi round two, would you like to reconsider your
previous answer on the following indicators and follow the average group score? If so,
please rate the level of importance of the following remaining indicators which
contribute to the sustainability assessment of residential neighbourhood layouts‖. The
rating used for this round was similar to the previous round (round two using 7-point
scale from very low to very high).
Page 97
Chapter 3 77
3.4.2 Pilot test
The first and second rounds of the Delphi draft questionnaire were subjected to the
pilot survey because there were differences in the questions and measurement used.
This pilot testing of the questionnaire was mainly to check possible ambiguities that
might affect the intended meaning (Jairath & Weinstein, 1994; Wyatt, 2000; Bryman
& Cramer, 2001). Thus, the questionnaire was tested in a pilot study to ascertain the
reliability before use with a larger sample of respondents. The sample respondents for
this pilot survey were obtained from a number of PhD postgraduates in Australia and
planners from local academic institutions. The researcher was present on most
occasions when the questionnaire was answered by the pilot survey respondents.
These pilot respondents were asked to provide feedback on questions that might have
used poor wording and created confusion in respondents, as they might have not
understood the questions asked (deVaus, 2001). The feedback obtained from the pilot
survey was utilised to make the necessary amendments and modifications to the
questionnaire design. The most frequent feedback obtained from the respondents was
some of the indicators used technical terminology and required explanation to clarify
its meaning and intention. Based on this feedback, a statement was added to each
indicator using simple English to describe its meaning and purpose in this study.
3.4.3 Sample selection of Delphi respondents
The procedures of selecting potential expert respondents are important in a Delphi
exercise in order to ascertain the potential respondents belong to the groups of experts
that are related to the study and the number is sufficient to represent the study. In this
study, snowball and convenience sampling methods were used to identify potential
respondents and followed by criterion sampling to select the Delphi panel of experts.
Patton (1990) stated that the logic of using this type of sampling is down to the fact
that participants should hold some predetermined criterion of importance. The
selection of experts was based on their knowledge and expertise in the built
environment and sustainability field.
Page 98
78 Chapter 3
As sustainable development and assessment involves many disciplines, experts for
this study were drawn from planning, urban design, environmental and the general
built environment fields both locally (Malaysia) and internationally with at least 5
years of experience in at least one of these fields. Local experts were to provide
avenues for these experts to not only identify indicators but also to suggest any
suitable indicators for the local context that are not highlighted in the survey.
Meanwhile, the main purpose of including international experts was because they
have extensive knowledge and awareness concerning sustainability at the international
level. Their expert knowledge and vast contributions in academic or professional
fields are important requirements.
Specifically, all potential respondents must meet at least one of the following criteria:
(1) established academics who have either published their work in international
journals or have lectured in the fields of sustainable settlements or neighbourhood
planning; (2) established practitioners from the built environment field who have
extensive experience in residential planning or management or community
infrastructure planning; (3) officers from state and local government who have been
involved in decision making or in promoting sustainable living or in charge of
development applications of residential developments; and (4) learned public from
non-governmental organisations who have been involved in community development
or promoting sustainable living.
Using these sampling techniques, a total of 60 potential respondents comprising 29
local (Malaysia) and 31 international experts were identified for the survey (Table 3-
2). A majority of researchers use Delphi sample size ranging between 10 and 60
(Dalkey, 1972; Reid, 1988; Hasson, Keeney, & McKenna, 2000; Czinkota &
Ronkainen, 2005; Jeste, Ardelt, Blazer, & Meeks, 2010). In addition, the number of
respondents can vary according to the scope of the issues being researched and the
resources available (Hasson, et al., 2000; Powell, 2003). Thus taking into account the
likelihood that a few would be unwilling to participate, 60 respondents were
considered reasonable for this survey and fulfilled a Delphi survey criterion (Jeste et
al., 2010).
Page 99
Chapter 3 79
Table 3-2: List of potential respondents for Delphi survey
Field of expert/knowledge International Local Total
Urban planning 3 7 10
Environment planning 4 4 8
Housing/Neighbourhood 7 5 12
Project management 1 1 2
Architecture 2 1 3
Social planning 3 2 5
Transport/Infrastructure 3 2 5
Sustainability planning 4 4 8
Policy planning 2 2 4
Community planning 2 1 3
Total 31 29 60
3.4.4 The administration of the Delphi survey
i. Respondent profile of the three-round Delphi survey
A formal letter of invitation was sent out via email to each of the 60 potential
respondents identified earlier in the sample selection process. The use of email is well
suited with the Delphi technique because it allows greater convenience to respondents
as well as reducing time and cost of data collection (Cramer, Klasser, Epstein, &
Sheps, 2008). The letter of invitation included an explanation on the purpose of the
research, a request for participation as expert, and a feedback notification whether the
potential respondent agreed or disagreed to this request. After one week of the first
email invitation, another email was sent to each potential respondent reminding about
the earlier invitation. Within two weeks after the email reminders were sent, a total of
46 experts gave their consent to participate. Taking into account the potential dropout
rate, this number was within the reasonable number for a Delphi study.
Page 100
80 Chapter 3
The round one survey questionnaire was sent to the 46 experts who have agreed to
participate. This round of survey received a total of 40 responses, giving a response
rate of 86.9%. The respondents consisted of 52.5% (21) academicians, 27.5% (11)
practitioners and the remaining 20% (8) were state and local government agencies
(Table 3-3). Of the total experts, 47.5% (19) were at the international level while
52.5% (21) others were recruited from local, Malaysian experts.
Table 3-3: Delphi experts‘ profile for round one
Division International Local Total %
Academics 13 8 21 52.5
Practitioners 3 8 11 27.5
Government 3 5 8 20.0
Total 19 21 40 100
Table 3-4 described the background and experience of the experts who participated in
this round of the survey. The majority of experts (28 or 67.5%) have their background
in urban and land use planning, 5 (12.5%) in transportation planning, 4 (10%) in
environmental management, 2 in architecture and the rest were from the project
management field. In terms of expert experience, the majority (23 or 57.5%) have
been involved in the fields of sustainability or sustainable development for more than
20 years, as either academics or professionals. Another 9 experts (22.5%) have
between 15 and 20 years, while the rest have between 5 and 14 years experience. This
implies that the majority of experts have wide experience in their fields.
Table 3-4: Profile of expert participants in round two of the Delphi survey
Division >20yrs 15-20yrs 5-14yrs %
Urban and land use planning 15 6 6 67.5
Transportation planning 3 1 1 12.5
Environmental management 3 1 0 10.0
Architecture 1 1 0 5.0
Project management 1 0 1 5.0
Total 23 9 8 100
Page 101
Chapter 3 81
The final (third) round of survey questionnaire was sent to all 32 experts who have
previously participated in the Delphi round two survey. In return, a total of 29
completed responses were received from these experts, of which 24 (75.7%) responses
were received at the end of the 3-week period whilst the remainder were received at
the end of a 2-week extension period that was given to boost returns of the survey
forms (Table 3-5). In this third Delphi round, 44.8% (13) of respondents were
academics, 31% (9) were professional practitioners and 24.2% (7) were professionals
from state and local government agencies. When looking at the regional level, 58.6%
(17) of respondents were local Malaysian experts whilst the remaining 41.4% (12)
were international experts. The following section describes the techniques used to
determine consensus agreement among experts on the relevant indicators.
Table 3-5: Expert participants in round three of the Delphi survey
Division International Local Total %
Academics 8 5 13 44.8
Practitioners 2 7 9 31.0
Government 2 5 7 24.2
Total 12 17 29 100
ii. Determining consensus of agreement
In respect of the Delphi survey approach, the selection of indicators (items) was based
on consensus among the experts. There are several techniques for determining
consensus namely based on (a) cut-off points either at 66.7%, 75%, 80% and 100%
agreement (Dobbins, 1999; Boyd, 2003; Tigelaar, Dolmans, Wolfhagen, & Vleuten,
2004; Harrison, 2005; Pulcini, Wilbur, Allan, Hanson, & Uphold, 2006), (b)
interquartile range (Beattie, Hek, Ross, & Galvin, 2004; Nelson, 2006), (c) standard
deviation (Scott, 2002; Seibert, 2004; Brill, Bishop, & Walker, 2006), or (d) group
mean (Brown, Crawford, Carley, & Mackway-Jones, 2006).
Among these techniques, this research uses percentage agreement, specifically a 75%
agreement of relevance as the cut-off point for selecting the indicators to be included
into the subsequent Delphi rounds. Percentage agreement of relevancy refers to the
Page 102
82 Chapter 3
percentage of respondents who rate the indicators as either relevant (score of 4) or
extremely relevant (score of 5) (Tigelaar, et al., 2004; Basinger, 2009). The following
three sections describe the procedures to determine the key indicators for measuring
sustainability.
iii. Delphi survey Round One
In this first Delphi round survey, the questionnaire was administered via email to 46
expert respondents who had agreed to participate. The purpose of this round was to
identify relevant indicators for measuring the sustainability of residential
neighbourhood layouts. The questionnaire contained a selected list of 38 potential
indicators from previous research studies concerning the field of sustainable
development and sustainability assessment within the international and Malaysian
context (Table 3-6).
Based on their perception and experience, the expert respondents were asked to rate
the relevancy of each indicator in terms of its potential use in assessing the level of
sustainability of neighbourhoods. The ratings range on a five-point Likert scale (level
of relevance) from ‗1=Very Low‘, ‗2=Low‘, ‗3=Medium‘, ‗4=High‘ and ‗5=Very
high‘. In order to reduce the error in identifying indicators, participants were
encouraged to modify or delete any indicator that they believed duplicated another
indicator and to suggest new indicators that they believed were important but not
included in the list (Tigelaar, et al., 2004). Such a practice of soliciting comments and
suggestions from respondents would increase the richness of the data (Murphy, et al.,
1998; Hasson, et al., 2000; Giles-Corti, Macintyre, Clarkson, Pikora, & Donovan,
2003; Pikora, Giles-Corti, Bull, Jamrozik, & Donovan, 2003).
Page 103
Chapter 3 83
Table 3-6: The categories and their respective indicators for the Delphi round one
survey
Item
Environmental
1. Land use mix diversity
2. Residential dwelling density
3. Impervious spaces
4. Street connectivity
5. Street route directness
6. Pedestrian accessibilities
7. Pedestrian network coverage
8. Vehicular entry and exit routes
9. Non-motorised transport facilities
10. Open space/active greens per dwelling
11. Open space/active greens per development area
12. Natural topography preservation
13. Sensitive areas/natural environment preservation
14. Vegetation retained to create the development
15. Storm water retention/detention system
16. Tree planting for shade/wind-break
17. Building exposure to natural ventilation (non-disastrous winds).
Social
1. Proximity to public transit nodes/system
2. Resident‘s vehicle kilometre travel (VKT)
3. Motor vehicle ownership
4. Proximity to recreation facilities (parks/open space)
5. Proximity to education facilities.
6. Proximity to local services (grocery shops, place of worship, nursery)
7. Availability of dedicated spaces for public amenities (e.g.: childcare, community centre,
place of worship)
8. Existence of well-defined boundary
9. Existence of neighbourhood central place
10. Availability of existing amenities and services
(e.g.: schools, medical clinics, banks)
11. Provision of community centres
12. Provision of religious centres
13. Provision of common recreation facilities for all ages
14. Provision of safety elements for crime prevention (e.g.: street lighting, perimeter fence,
CCTV)
15. Separation between pedestrian and motorised traffic
16. Traffic calming measures
Economic
1. Availability of commercial establishments
2. Diversity of housing option
3. Provision of affordable housing.
4. Employment opportunities within immediate vicinity.
5. Avoidance of high grade soil
Page 104
84 Chapter 3
Together with the questionnaire, the respondents were also provided with an
information sheet and instructions, and a reminder note asking them to return the
completed questionnaire within a 3-week period. After four weeks of the
questionnaire being sent, 32 completed survey forms were received from respondents.
In order to encourage participation, the researcher sent a friendly reminder to
respondents who were yet to return the survey form and asked them to return the
survey form within two weeks. Following this reminder, at the end of two weeks, the
researcher received another eight completed survey forms, which brought the overall
total to 40 completed questionnaire for this round.
iv. Delphi survey Round Two
After the completion of round one of the Delphi survey and analysis, all indicators
which achieved 75% agreement were included in the round two Delphi survey for
further investigation. The questionnaire was sent via email to all 40 respondents who
had successfully completed the first Delphi round. Each questionnaire contained a list
of the selected indicators and a summary of their respective group mean scores from
the previous round (round one). The respondents were asked to identify based on a
seven point scale of importance, those indicators that they believed to be important for
measuring the sustainability of residential neighbourhood layouts. A notification of a
3-week period for the return of the completed questionnaire was also attached to the
survey form.
A total of 32 completed questionnaire from a possible 40 participants were returned. A
total of 22 questionnaire (68.8%) were received within the initial 3-week period while
another eight (25%) were received after a 2-week extension was given to complete the
questionnaire. Two questionnaire, which were received two days after the extension
deadline, were also accepted into the survey after the researcher was notified
beforehand of the expected delay. These extensions have boosted the response rate in
this Round two to achieve an average of 80%.
Page 105
Chapter 3 85
v. Delphi survey Round Three
Any remaining indicators yet to reach a consensus in the second round of the Delphi
survey of data collection were iterated in the third and final Delphi round. The third
round questionnaire containing these remaining indicators was sent to all 32 experts
who had successfully completed the previous round (round two). The respondents
were also provided with the group mean scores for each of these remaining indicators.
They were asked to consider the group scores and their own score and decide whether
to stand firm or defer and follow the average group score (Cramer, et al., 2008). A
seven point scale of importance similar to round two survey was used in this third and
final Delphi round.
A total of 29 completed responses were received from these experts of which 22
(75.7%) completed forms were received within the original 3-week deadline whilst the
remaining 7 were received at the end of a one week extension period. Attempts to
obtain the remaining three completed questionnaire by giving a three day special
extension however was not successful. Therefore, this gave a final response rate in
this third and final Delphi round to 90.5%, which was considered as a very good
outcome.
3.5 Collection of spatial data
The second type of data used in this research was the digital spatial data of typical
residential neighbourhood layouts generally found in in Malaysia. Through these
layouts, quantitative data can be extracted through spatial analysis and used to validate
the proposed framework. In addition, the layouts were also used as a platform to
investigate the differences in sustainability between the different types of residential
neighbourhood development in Malaysia.
3.5.1 Case study selection
Generally, the selection of case studies for this research was based on three criteria.
First, the case studies represented different types of neighbourhood developments in
Malaysia. Second, each case study has more or less the same size as the others, and
third, the availability of digital spatial data. Taking into account these criteria, this
study selected three different residential types, namely, subdivision development as
Page 106
86 Chapter 3
case study 1, piecemeal development as case study 2 and master-planned development
as case study 3.
Originally, the case studies were to be selected from different local planning authority
(LPA) areas so as to provide rich contextual and administrative variations. A total of
15 potential neighbourhood developments that fulfill the selection criteria were
identified from nine LPAs through a series of discussions with planners from three
states. Formal requests for digital data of the potential case studies were sent to the
offices of these local planning authorities. Follow-up verbal requests through phone
and physical appointments were made to these LPAs. However, technical and
administrative difficulties hampered the initial case study selection of this study.
These difficulties ranged from the local planning authorities still waiting to switch to a
digital database, having no updated data and difficulty in obtaining approvals for the
release of the digital spatial data. Of the nine LPAs involved in this digital data
requisition, only one local authority gave permission to the researcher to use the
digital database of its entire administrative area. Due to time and other technical
constraints, and after discussion with the supervisory committee, all three case studies
were eventually drawn from this single local planning authority, the Ipoh City
Council, located in the state of Perak, Malaysia. Ipoh, which is also the capital of the
Perak state (4º 36' 32" N and 101º 6' 54" E) is approximately 200 kilometres to the
north of Kuala Lumpur, the country‘s capital city (Figure 3-2).
Following identification of the case studies, data were formally requested from the
city council planning department, with detailed specifications for the required
information for each case study and its buffer areas. These included zoning and land
use classifications, road and infrastructure networks, details of parcel-based spatial
and attribute data, building and residential type. Other more general data concerning
the surrounding environment were also requested to facilitate the digital spatial and
network analysis. Following this request, MapInfo based digital land use data of the
city council area was provided to the researcher.
Page 107
Chapter 3 87
Figure 3-2: Case study locations within the city council area (adapted from Ipoh
City Council, 2010)
3.5.2 Case study profile
Table 3-7 shows the general characteristics of the three case studies. The size of each
case study is determined by its administrative boundary, which explains the slight
differences between the cases. The subdivision case study is among the largest of its
kind in the local authority area. It is characterised by larger parcel sizes, with each
parcel typically around 500 square metres (sqm). The master-planned development
has twice the number of residential dwellings than the subdivision case study and sits
on a smaller lot size averaging 130 sqm. The piecemeal development looks to be the
average sitting in the middle of the spectrum in all categories. The following
subsection describes each case study area in detail.
(CASE STUDY 1)
(CASE STUDY 2)
(CASE STUDY 3)
Page 108
88 Chapter 3
Table 3-7: General description of case study areas
Case Study Size (ha) Population Total
Dwellings
Population
density
(/ha)
Dwelling
Density(/ha)
Subdivision development 96.5 4724 1181 49 14.6
Piecemeal development 100.2 6220 1555 62 28.3
Master-planned
development 107.8 9048 2262 84 30.3
3.5.2.1 Subdivision development
The first case study (CS1) is a subdivision development called Kampung Tersusun
Batu 5, located about five kilometres to the north east of the city of Ipoh (refer Figure
3-2) with a geographic coordinates of 4º 37' 34" N and 101º 37' 56" E. This is a 96.5
hectare standard subdivision layout development that sits on a flat area of land
bounded by a local highway and pockets of other residential development (Figure 3-
3). The case study comprises 1181 parcels of single storey detached houses and
associated amenities including pockets of neighbourhood parks, open spaces, shop lots
and places of worship, and a primary school.
The residential parcels were drawn up by the local planning authority in 1998 and
were sold to individuals who then built their own houses, subject to local planning
standards and guidelines. The typical parcel size is a 500 sqm rectangular lot shape
while corner parcels have an additional 10 to 20 per cent extra space. Owing to the
type of dwelling, it has an average density of 14.6 dwellings per hectare (dph). Most
of the houses are owned by the Malay community, the largest of the three main races
in Malaysia.
Page 109
Chapter 3 89
Figure 3-3: Land use classification of subdivision development case study, (Ipoh City
Council, 2010)
3.5.2.2 Piecemeal development
This second case study (CS2) is an early piecemeal development project called Taman
Canning or Canning Garden, located three kilometres to the east of the city (Figure 3-
2) with a geographic coordinates of 4º 35' 15" N and 101º 6' 42" E. Developed during
the mid-1980s, this mixed dwelling type residential area comprises 1555 residential
parcels spread on 100.2-hectare of relatively flat land. A total of 44% of the residential
parcels is occupied by single and double storey terrace houses, 16% is occupied by
semi-detached houses and 40% is occupied by single storey detached houses. Other
land uses include two centralised neighbourhood shop blocks, a wet market, two
Kampung Tersusun
Batu 5
Page 110
90 Chapter 3
primary schools, a huge neighbourhood playfield and pockets of neighbourhood parks
(Figure 3-4).
Figure 3-4: Land use classification of piecemeal development case study (Ipoh City
Council, 2010)
The site is surrounded by piecemeal residential developments to the north, military
land use to the east and a cemetery to the south. A federal highway separates the site
from a large commercial land use to the east of the site. Development of the site took
place in a number of stages by three different developers and spanning over 6 years.
Being a mixed type housing area, the site is occupied by mixed groups of races and
socioeconomic background. The typical parcel size is 500 sqm for a detached house,
240 sqm for a semi-detached house and 185sqm for a terrace house. The high number
of terrace houses contributes to its higher average density of 28.3 dwellings per
hectare.
Taman Canning
Page 111
Chapter 3 91
3.5.2.3 Master-planned development
This third case study (CS3) is called Bandar Seri Botani and it sits on a 107.8-hectare
former oil palm plantation located seven kilometres to the south of Ipoh City with a
geographic coordinates of 4º 31' 48" N and 101º 6' 5" E (refer Figure 3-2). This is a
typical example of a large-scale integrated green field development that also exists in
other states in Malaysia. The case study occupies the first of a 3-phase, 311.6-hectare
large scale, self-sustained residential and light industrial master-planned development
project. A total of 74.6 hectares (69.2%) of the case study site is dedicated to
residential and supporting uses including neighbourhood parks, roads and public
amenities. A commercial precinct, a huge local park and an education precinct present
the next significant percentages of the case study land use (Figure 3-5).
Figure 3-5: Land use classification of master-planned development case study (Ipoh
City Council, 2010)
Bandar Seri Botani
Page 112
92 Chapter 3
With an estimated population of 9048 residing in 2262 residential dwellings (1928
terrace houses and 334 semi-detached houses), it is the biggest of the three case
studies in terms of physical size, population and number of residential dwellings (refer
Table 3-4). Parcel sizes for terraces house range between 100 sqm and 145 sqm, while
for semi-detached houses, the parcel size is 300 sqm. Being developed on a green field
site, the master-planned development is still surrounded by agricultural land use and
secondary forest. Even though the original topography was undulating, the majority of
the residential, commercial and education precincts have been flattened. This is
typical of any housing developments in the country. The purpose of flattening the land
is to optimise time and construction cost, especially the terrace houses dominating the
case study landscape. This case study recorded the highest dwelling density among the
three case studies with an average density of 30.3 dwellings to the hectare. This is not
surprising given that nearly 90% of its development patterns are dominated by terrace
houses.
3.6 Analysis of Delphi survey and spatial data
3.6.1 Analysis to identify relevant indicators to measure sustainability
The identification of relevant indicators to measure sustainability was based on data
collected in the round one of the Delphi survey. Participants were asked to rate a list
of 38 potential indicators concerning the relevancy in assessing neighbourhood
sustainability levels. The ratings ranged on a five-point Likert scale (level of
relevance) from ‗1=Very Low‘, ‗2=Low‘, ‗3=Medium‘, ‗4=High‘ and ‗5=Very high‘.
SPSS 17 statistical software was used to run a descriptive analysis to identify the
relevant indicators. The identification of these indicators (items) was based on
consensus among the experts using percentage agreement of relevance. Consistent
with the various percentage cut-off points for determining agreement of consensus as
suggested in the literature (Dobbins, 1999; Boyd, 2003; Tigelaar, et al., 2004;
Harrison, 2005; Pulcini, et al., 2006), this research used 75% agreement of relevance
as the cut-off point for selecting the indicators. The percentage agreement of
relevancy refers to the percentage of respondents who rated the indicators either
relevant (score of 4) or extremely relevant (score of 5), (Tigelaar, et al., 2004;
Basinger, 2009). Indicators that achieved the 75% cut-off points were included in in
Page 113
Chapter 3 93
round two of the Delphi survey, which was to select only the key indicators for the
proposed assessment framework.
In addition, participants were asked to modify or delete any indicator that they
believed duplicated another indicator. The experts were also encouraged to suggest
new indicators that they believed were important but not included in the list. Twenty-
two experts took the opportunity to modify existing indicators and suggest a number
of new potential indicators that they believe were important to consider but were not
highlighted in the existing indicator list. The results indicate that the suggestion of
modifications from experts ranged from rephrasing the indicators to combining two or
more indicators. In order to ascertain the importance of these suggested indicators in
contributing to the level of sustainability of the residential neighbourhood
development layouts, the indicators were also included in round two of the Delphi
survey, which is described in the following section.
3.6.2 Analysis to identify key indicators in contributing to the level of
sustainability
An analysis to identify key indicators that contribute to sustainability was conducted
based on data from rounds two and three of the Delphi survey. In these Delphi rounds,
participants were asked to rate the importance of each indicator (total indicators=24)
for assessing the level of sustainability of the neighbourhood layouts. A seven-point
Likert scale, ranging from ‗very low‘ to ‗very high‘ levels of importance was used to
rate each of the indicators. A ‗very low‘ rating was given when an indicator gave least
contribution when used to assess the sustainability levels of residential layouts. In
contrast, a ‗very high‘ rating suggests that the indicator makes a crucial contribution to
the sustainability assessment. A 75% agreement of importance (scores of 5 to 7) was
used to determine a consensus for each indicator.
A descriptive analysis was conducted to identify the mean score and percentage of
importance of each indicator in the round two data. Indicators which surpassed 75%
agreement were classified as key indicators. Consistent with Cramer et al (2008),
indicators which achieved adequate consensus were considered no longer requiring
further investigation, and thus omitted from the subsequent Delphi round. However,
those indicators which had not reached a consensus were included in the round three
Page 114
94 Chapter 3
(final) survey. As in round two, similar descriptive analyses were conducted for round
three, and only indicators which achieved a minimum of 75% consensus of agreement
were selected. Other remaining indicator(s) which failed to generate adequate
consensus in this third and final Delphi round (where the respondents considered the
indicator as neither important of not important) were removed from this study.
3.6.3 Analysis for normalisation of indicators
Once the final list of important indicators had been identified from the Delphi process,
the study proceeded with a procedure to normalise the indicators. Three case studies in
Malaysia were used as a basis to generate a normalisation procedure for the selected
indicators prior to indicator weighting. Normalisation is required prior to any indicator
weighting because these indicators have different measurement scales (Nardo, et al.,
2005). Normalisation refers to the procedure undertaken to produce/create the same
normalized value of the indicators irrespective of their original measurement scale.
Nardo et al. (2005) list nine techniques for normalisation – ranking, standardisation,
min-max normalise, distance to a reference, categorical scale, indicator above or
below mean, cyclical indicator, special case of balance of opinion and percentage of
annual differences.
This study applied two techniques for normalisation procedures – the categorical
scale, and the above and below mean technique. The purpose of having two
procedures was to ascertain which one is more robust and suitable for residential
development in Malaysia. The categorical scale can be numerical (1, 2, 3) or
qualitative (partly achieved, achieved, not achieved); this study used the numerical
scale (5 point-unit from 1 to 5). The normalisation procedure based on the above and
below mean refers to transforming the original score unit to a normalised score around
the mean (Nardo, et al., 2005). The scale was set based on the score value around the
mean with a certain threshold (±10%). The original indicator with a score less than the
mean receives -1, the original indicator score around the mean receives 0 and an
indicator score of more than the mean receives +1. Using this normalised scale, the
original score of each indicator was converted to a normalised score.
Page 115
Chapter 3 95
3.6.4 Analysis for assigning indicator weighting and category aggregate for
measuring sustainability
The aim of indicator weightings was to ascertain the impact value of each indicator on
sustainability. Meanwhile, category aggregate was to ascertain the impact value of
each category (environment, social and economic) on sustainability. The assignment
of indicator weighting and category aggregation was based on the results of the Delphi
survey, which is consistent with the budget allocation process (BAP) (Nardo, et al.,
2005). The assignment of indicator weighting and category aggregate was conducted
separately according to the respondent‘s regional location. This was to examine
whether there were any differences in opinion and judgement concerning the level of
importance of the indicator in contributing to sustainability. The first group was the
overall expert respondents who were local (Malaysian) and international, the second
group was formed by local expert respondents only and the third group was the
international experts only.
Indicator weightings were generated from the importance values rated by the experts
in rounds two and three of the Delphi survey. Experts were asked to rank the level of
importance for each indicator category from ‗1=very low‘, ‗2=low‘, ‗3=medium low‘,
‗4=medium‘, ‗5=medium high‘, ‗6=high‘ and ‗7=very high‘ in terms of contribution
to sustainability. Descriptive analysis was conducted to generate group mean value.
Weightings for each indicator were calculated by dividing indicator group mean with
the total indicator group mean as shown below:
Indicator weightings=
Each indicator weighting was multiplied with category aggregate to generate the
composite index of the overall level of sustainability of a neighbourhood
development. The aggregate category was generated from the important points
allocated by the experts in round two of the Delphi survey. The experts were asked to
allocate the relative importance for each category based on one hundred points to the
total category set (a total of 100 points for all three categories). The points for each
category were based on the expert respondents‘ experience and subjective judgement
of the relative importance of the respective category in contributing to sustainability.
Page 116
96 Chapter 3
The group mean of the important points was calculated to generate an aggregate for
each category (environmental, social and economic) between the three groups, using
EQ1:
Aggregate category=
(EQ1)
3.6.5 Analysis to validate the development of the framework for measuring
the level of sustainability of the neighbourhood
The development of the framework is not a straightforward process and requires
validation before applying on site. It is subject to errors due to the indicator values and
assumptions, and sensitivity analysis is important for validating the framework
(Pannel, 1997). The framework to measure sustainability composite index (SCI) of
residential neighbourhood layouts was generated using the normalised scores of the
case studies, indicator weighting, and category aggregate as shown by EQ2 (Nardo, et
al., 2005):
Sustainability composite index (SCI)=
(EQ2)
where k=indicator, t=indicator category, a=indicator normalised score of case study,
b= indicator weighting, and c= category aggregate score
As explained earlier, this study constructs the framework using two normalisation
techniques: the categorical scale techniques and the above and below mean technique
for normalisation; and the budget allocation process derived from expert Malaysian
and international respondents for indicator weighting and category aggregation.
Therefore, possible errors could result in dubious analytic rigour of the framework,
which might be expected to come from the normalisation technique or expert group
respondents (Nardo, et al., 2005). In order to examine these errors, uncertainty and
sensitivity analysis were conducted on the framework.
The purpose of uncertainty and sensitivity analysis was to examine the consistency of
(a) the techniques used in normalisation and weighting, and (b) the expert
𝑎𝑘𝑏𝑘𝑐𝑡 𝑘 = 1,2,… ,18 𝑎𝑛𝑑 𝑡 = 1,2,3
𝑘 ,𝑡
Page 117
Chapter 3 97
respondents‘ opinion in assessing the sustainability of the residential neighbourhood
layout. Uncertainty analysis examined the input factors that propagate through the
structure of the composite indicator index (rank). The results indicate that both the
Malaysian and international experts were consistent and shared a common opinion
and judgement in measuring the sustainability of the residential neighbourhood
layouts. However, there was inconsistency between the two normalisation techniques.
Following that, sensitivity analysis between the two normalisation techniques was
conducted to determine how differences in the values associated with an independent
variable affect the dependent variable (Pannel, 1997). It is helpful in determining the
uncertainty in the model prediction through variations in model inputs (Lilburne &
Tarantola, 2009). This study adopted the sensitivity index calculation, which is based
on the variations of the indicator input on the variation of output (Hoffman and
Gardner, 1983; Hamby, 1994; Chen, Yu, & Khan, 2010). The sensitivity index
compares the output differences of each indictor using EQ3 (Hamby, 1994):
SIk=
(EQ3)
where SI=sensitivity index, k=indicator, Dmax=Composite index when k is set to
maximum normalised scale, and Dmin=composite index when k is set
to a minimum normalised scale.
The outcomes of both uncertainty and sensitivity analyses were used to determine and
select the most appropriate normalisation technique (the above and below mean
technique or categorical scale normalisation technique) for use in developing the
sustainability assessment framework.
3.6.6 Analysis for comparing the sustainability composite index among the
three types of residential development
After the normalisation process and sensitivity analysis had been completed, an
analysis was conducted to determine the sustainability levels of residential layouts by
applying the framework on three case studies. The framework contains all selected
sustainability indicators derived from the previous stage of the Delphi analysis which
were grouped into three sustainability categories (environmental, social and economic
Page 118
98 Chapter 3
sustainability). The framework indicators were applied to the three cases of different
types of neighbourhood development (subdivision, piecemeal and master-planned
developments) located in a city council area in the state of Perak, Malaysia.
The application of this framework aimed to generate a sustainability composite index
(SCI) to determine the ranking order of the case studies, namely master-planned
development, sub-division development and piecemeal development. The generation
of the SCI served three purposes. The first was to identify which among the three
types of development layouts was the most sustainable, second, to determine the
indicators and their respective scores in these different types of residential layouts,
and finally to identify which indicators contributed significantly over the others to
help increase the sustainability levels of these residential developments further.
3.7 Summary
This chapter discusses and justifies the methodological issues and research strategies
adopted in this study. This study determined that a mixed method research strategy
and embedded research design were the most appropriate to achieve the study aim and
objectives. The selected research design required the collection and sequential use of
two types of data: quantitative data gathered from the three-round Delphi survey and
spatial data from the three case study areas. The study revealed that the use of a three
round Delphi survey was the most appropriate to select the most important indicators
for measuring the sustainability levels of neighbourhood layouts.
Since the selected indicators have different measurement units, the normalisation
process was a necessary step before any weighting can be assigned to the indicators.
The validation of the framework was a final step in the framework development and
this was undertaken using the three case studies of residential neighbourhoods. Once
the validation process was completed, the selected framework was used to measure
their sustainability levels of the three case studies and to generate their sustainability
composite index. The results of the analysis are presented in the following Chapters
four, five and six according to the research objectives.
Page 119
Chapter 4 99
Chapter 4: Analysis to identify Key Indicators
for Measuring Sustainability
4.1 Introduction
This chapter presents an analysis of the results to achieve the first research objective,
that is, to identify environmental, social and economic indicators that can be used to
evaluate the level of sustainability of neighbourhood layouts. The analysis was based on
a three-round Delphi survey. The chapter is divided into four main sections. Following
the introduction, the second section provides the analysis of data to identify relevant
indicators and their relative categories for measuring neighbourhood sustainability. In
this stage, only indicators that achieved 75% agreement of relevancy were selected and
further analysed. Following this analysis, section three outlines the analysis of results in
determining the final list of indicators to measure neighbourhood sustainability. Section
four provides the final list of indicators for measuring the sustainability levels of
neighbourhood layouts. Finally, section five provides a summary of the processes and
outcomes of the chapter. An overview of this chapter is presented in Figure 4-1.
4.2 Identification of relevant indicators and their relative categories for
measuring the sustainability of residential neighbourhood
development
The strength and weakness of composite indicators is largely derived from the quality of
the underlying variables and should be selected on the basis of their relevance and
analytical soundness (Nardo, et al., 2005). This study identified relevant indicators for
measuring sustainability, which were identified from the three rounds of the Delphi
survey. The round one survey was to examine relevant indicators and to ascertain the
content validity of the indicators according to their category based on the perceptions of
experts (Pikora, et al., 2003). At this stage, only relevant indicators were selected to be
included in the next stage of the survey, round two. The round two and three surveys
were for selecting only important indicators among the relevant indicators identified in
the round one survey for measuring the sustainability of residential neighbourhood
developments.
Page 120
100 Chapter 4
Figure 4-1: The structure of Chapter Four
Investigation of relevant indicators and validation of indicators according to their
categories (internal validity) were based on the Delphi round one analysis (Pikora, et al.,
2003). A list of 38 potential indicators from four categories was included in round one of
the Delphi survey. Based on perception and experience, expert respondents were asked
to rate the relevancy of each indicator in terms of its potential use in assessing
neighbourhood sustainability levels. The ratings ranged on a five-point Likert scale
(level of relevance) from ‘1=Very Low’, ‘2=Low’, ‘3=Medium’, ‘4=High’ and ‘5=Very
high’. In order to reduce error in identifying indicators, participants were encouraged to
modify or delete any indicator that they believed duplicated another indicator and to
suggest new indicators that they believed were important but not included in the list. It is
claimed that such a practice increases the richness of the data (Murphy, et al., 1998;
Hasson, et al., 2000; Pikora, et al., 2003).
Upon completion of the Delphi round one survey, descriptive analyses were conducted
to identify indicators which the group of experts considered as relevant for measuring
the level of sustainability of residential neighbourhood developments. Table 4-1 shows
Page 121
Chapter 4 101
the results of all 38 potential indicators in the three sustainability categories
(environmental, social and economic) and their respective mean scores, standard
deviation and percentage agreement. The percentage agreement of relevance ranged
from the lowest: 28.5% agreement of relevance (resident’s vehicle kilometre travel:
social category) to the highest, 100% (proximity to public transit nodes: social
category). Based on the cut-off point of 75% agreement of relevance, the results indicate
that out of 38 indicators examined in this survey, 28 (73.7%) indicators achieved
consensus among experts, and, thus, were selected as relevant for measuring the
sustainability of residential neighbourhood developments.
Table 4-1: Delphi round one result
Item (N=45) Mean SD %
agreement
Environmental category (17 indicators)
1. Land use mix diversity 4.62 0.539 97.3
2. Residential dwelling density 4.19 0.594 90.5
3. Impervious surfaces 4.31 0.643 90.5
4. Street connectivity 4.40 0.587 95.2
5. Street route directness 3.81 0.740 71.4
6. Pedestrian accessibilities 4.50 0.595 95.3
7. Pedestrian network coverage 4.36 0.759 88.1
8. Vehicular entry and exit routes 4.00 0.911 79.0
9. Non-motorised transport facilities 4.40 0.831 80.0
10. Open space/active greens per dwelling 3.83 0.961 59.6
11. Open space/active greens per development area 4.52 0.671 90.5
12. Natural topography preservation 4.50 0.595 95.3
13. Sensitive areas/natural environment preservation 4.51 0.457 90.0
14. Vegetation retained to create the development 3.36 0.879 38.1
15. Storm water retention/detention system 2.67 0.954 52.4
16. Tree planting for shades/wind-break 3.74 0.857 57.1
17. Building exposure to natural ventilation (non-disastrous
winds) 2.74 1.149 26.1
Page 122
102 Chapter 4
Table 4-1 (cont‘d)
Item (N=45) Mean SD %
agreement
Social category (16 indicators)
18. Proximity to public transit nodes/system 4.74 0.445 100.0
19. Resident‘s vehicle kilometre travel (VKT) 2.81 1.234 28.5
20. Motor vehicle ownerships 2.92 1.112 34.6
21. Proximity to recreation facilities (parks/open space) 4.67 0.612 92.8
22. Proximity to education facilities 4.40 0.627 92.8
23. Proximity to local services (e.g.: grocery shops, nursery) 4.43 0.630 92.9
24. Availability of dedicated spaces for public amenities (e.g.:
childcare, community centre, place of worship) 4.40 0.627 92.8
25. Existence of well-defined boundary 3.17 0.881 33.3
26. Existence of neighbourhood central place 4.26 0.587 92.8
27. Availability of existing amenities and services (e.g.:
schools, medical clinics, banks) 4.52 0.634 92.8
28. Provision of community centres 4.33 0.721 90.4
29. Provision of religious centres 4.12 0.889 81.0
30. Provision of common recreation facilities for all ages 4.48 0.552 97.6
31. Provision of safety elements for crime prevention (e.g.:
street lighting, perimeter fence, CCTV) 4.26 0.767 80.9
32. Traffic calming measures 4.35 0.820 81.2
33. Separation between pedestrian and motorised traffic 4.60 0.587 95.3
Economical category (5 indicators)
34. Availability of commercial establishments 4.06 0.834 80.2
35. Diversity of housing option 4.05 0.936 78.6
36. Provision of affordable housing 4.17 0.824 83.3
37. Employment opportunities within immediate vicinity 4.07 0.745 76.2
38. Avoidance of high grade land 3.14 0.926 30.9
Page 123
Chapter 4 103
Looking at each of the four indicator categories, the results show that the environmental
category has 11 of its 17 indicators (64.7%) selected as relevant. These selected
indicators have achieved a minimum of 75% agreement of relevance ranging between
the lowest 79.0% (vehicular entry and exit routes) to the top of 97.3% (land use mix
diversity). The social category, however, recorded the highest number of indicators
selected for the second round of the Delphi survey, with 13 of the 16 indicators (81.3%)
surpassing the pre-set cut-off point with agreement of relevance ranging between the
lowest 81.0% for provision of religious centres and a high of 100% for proximity to
public transit nodes.
Although the economical category only has 5 indicators included in the iteration, 4 of
them (80%) were selected, with their percentage agreement above the cut-off points
represented by the lowest agreement of 78.6% (variety of housing option) to the highest
of 83.3% (provision of affordable housing). Overall, analysis of the results shows that 11
indicators in the environmental category, 13 indicators in the social category and 4
indicators in the economic category were relevant to measure sustainability of residential
neighbourhood development layout. The following analyses the new indicators
suggested by the experts that they believed were relevant but were not included in the
survey.
The experts were encouraged to modify or delete any indicator that they believed
duplicated another indicator, and also to suggest new indicators that they believed
important but were not included in the list to increase the richness of the data. Out of 40
respondents, 22 experts took the opportunity to modify the existing indicators and
suggest a number of new potential indicators. The results show that the suggestions for
modification from the experts ranged from rephrasing the indicators to combining two or
more indicators. The experts suggested combining and rephrasing 15 indicators
(environment and social categories) into six indicators (Table 4-2). The main reason for
combining these indicators were due to duplication.
Page 124
104 Chapter 4
Table 4-2: Combining and rephrasing existing indicators
Existing indicators Combined and rephrased
Environmental
1. Internal connectivity
1. Street connectivity
2. Pedestrian accessibilities
3. Pedestrian network coverage
4. Natural topography preservation 2. Preservation of
environmentally
sensitive areas
5. Sensitive areas/natural environment preservation
Social
3. Access to recreation
space
6. Proximity to recreation facilities
7. Proximity to recreation facilities for all ages
8. Proximity to local services
4. Access to local services 9. Availability of dedicated space for public amenities
10. Existence of neighbourhood central place
11. Availability of existing amenities and services
12. Provision of community centres 5. Access to community
centres 13. Provision of religious centres
14. Provision of safety elements for crime prevention 6. Crime prevention and
safety 15. Separation between pedestrian and motorised traffic
The experts also suggested some modifications to the existing indicators (Table 4-3).
They suggested that in the environmental category, the indicators ‘vehicular entry and
exit routes’ and ‘open space/active greens per development area’ should be rephrased to
‘external connectivity’ and ‘open space provision’, respectively. In the social category,
instead of the terms ‘proximity’, the terms ‘access’ should be used for the four
indicators, because, in this instance, ‘access’ actually reflects the ability of residents to
both obtain and utilise a given facility or services, rather than just having one in close
proximity but without access to the said facility or services.
Page 125
Chapter 4 105
Table 4-3: Rephrasing existing indicators
Existing indicators Rephrased
Environmental
1. Vehicular entry and exit routes External connectivity
2. Open space/active greens Open space provision
Social
3. Proximity to public transit nodes/system Access to public transit
nodes/system
4. Proximity to recreation facilities Access to recreation facilities
5. Proximity to education facilities Access to education facilities
6. Proximity to local services Access to local services
Finally, experts took the opportunity to suggest five new potential indicators which they
believe were important to consider but were not included in the existing indicator list.
Table 4-4 shows a shortlist of these new indicators and the respective general
descriptions derived from a pool of suggestions from these experts. The environmental
category has an additional indicator added to the list whilst the social and economic
categories each have two new indicators in addition to the existing list.
Table 4-4: Additional new indicators suggested by experts
New indicators Category
1. Solar-oriented lot parcels Environmental
2. Access to health facilities Social
3. Access to emergency services
4. Skills development centres Economics
5. House price diversity
The analysis from the round one survey was based on criteria including a cut-off point
value of 75% agreement of relevance and also combining existing indicators and adding
new indicators as suggested by experts. These various criteria generated a consensus list
of 24 indicator items (Table 4-5). These indicators were sent out to all 40 expert
participants who had successfully completed the previous round one of the Delphi
Page 126
106 Chapter 4
survey for further analysis. The next section explains the processes and analysis
undertaken in determining important indicators for measuring sustainability.
Table 4-5: Final indicators derived from the Delphi round one survey
Items (N=40)
Environmental
1. Land use mix diversity
2. Residential dwelling density
3. Impervious surfaces
4. Internal connectivity
5. External connectivity
6. Open space provision
7. Preservation of environmentally sensitive areas
8. Non-motorised transport
9. Solar-oriented lot parcels*
Social
10. Access to public transport facilities
11. Access to education facilities
12. Access to health facilities*
13. Access to recreation space
14. Access to local services
15. Access to community services
16. Access to emergency services*
17. Crime prevention and safety
18. Traffic calming measures
Economical
19. Availability of commercial establishments
20. Employment self-containment
21. Housing option diversity
22. Provision of affordable housing
23. Availability of skilled development centres*
24. Diversity of house prices*
* Additional new indicator suggested by experts
Page 127
Chapter 4 107
4.3 Identification of key indicators for measuring sustainability
Following identification of the relevant indicators in round one, this stage aims to
examine these relevant indicators in terms of their importance for measuring the
sustainability of residential neighbourhood development. Analysis of these key
indicators was based on rounds two and three of the Delphi survey. Participants were
asked to rate the importance of each indicator based on a seven-point scale of
importance from ‗1=very low‘, ‘2=low‖, 3=medium low‘, 4=medium‘, 5=medium high‘,
‘6=high‘ and ‘7=very high‘. The selection of indicators was based on a cut-off point of
75% agreement of importance. The percentage agreement refers to the combined top two
scores of either a 6 (relevant) or 7 (extremely relevant) given by the participants to each
item. Therefore, indicators that surpassed a minimum of 75% agreement of importance
were considered as key indicators. These indicators have achieved consensus among
expert respondents for measuring the level of sustainability of residential neighbourhood
developments.
Using SPSS 17, a descriptive analysis was conducted to identify these key indicators.
The analysis results from this second round of the Delphi survey are presented in Table
4-6, showing their respective mean values, standard deviation and percentage of
agreement importance. The results indicate that the agreement of importance ranged
from the highest of 100% (availability of sustainable oriented design guidelines:
environmental category) to the lowest of 37.5% (availability of skills development
centres: economical category). Out of 24 indicators, 17 indicators (68.0%) from all three
categories achieved consensus. Looking at each indicator, the analysis shows that the
environmental category has seven of its nine indicators surpassing the minimum
consensus requirements. Similarly, the social category has seven of its ten and the
economic category has three of its six fulfilling the consensus requirements.
Page 128
108 Chapter 4
Table 4-6: Delphi round two results
Item (N=32) Mean SD % agreement
Environmental
1. Land use mix diversity 6.03 0.999 87.5
2. Dwelling density 5.47 0.983 81.3
3. Impervious surfaces 5.41 0.979 84.4
4. Internal connectivity 6.06 0.914 90.7
5. External connectivity 5.63 0.833 87.6
6. Non-motorised transport facilities 5.97 0.933 90.7
7. Environmentally sensitive areas 5.06 1.480 59.4
8. Open space provision 6.22 0.751 96.9
9. Solar orientation 4.88 1.185 62.5
Social
10. Access to public transport facilities 6.06 0.914 93.8
11. Access to education facilities 5.97 0.967 93.9
12. Access to health facilities 4.78 1.211 53.2
13. Access to local services 5.66 0.827 93.7
14. Access to recreational space 5.84 0.808 97.0
15. Access to community centre 5.44 0.878 87.6
16. Access to emergency services 5.16 1.139 71.9
17. Crime prevention and safety 6.00 0.762 96.9
18. Traffic calming 5.34 0.937 81.2
Economic
19. Commercial establishments 5.50 0.880 93.8
20. Skills development centres 4.19 1.306 37.5
21. Employment self-containment 4.66 1.260 53.2
22. Housing option diversity 5.41 0.946 87.6
23. Housing prices diversity 5.28 1.224 68.8
24. Affordable housing 5.69 0.998 81.3
Table 4-7 below shows all seven indicators from all three categories that failed to reach
consensus in this Delphi round. These indicators were included in the third and final
rounds of the Delphi survey to determine whether a consensus can be achieved.
Page 129
Chapter 4 109
Table 4-7: Final indicators for iteration into Delphi round three
Item (N=32) Mean SD %
agreement
Environmental
1. Environmentally sensitive areas 5.06 1.480 59.4
2. Solar orientation 4.88 1.185 62.5
Social
3. Access to health facilities 4.78 1.211 53.2
4. Access to emergency services 5.16 1.139 71.9
Economic
5. Skills development centres 4.19 1.306 37.5
6. Employment self-containment 4.66 1.260 53.2
7. Housing prices diversity 5.28 1.224 68.8
The results from the descriptive analysis of data from the second Delphi round reveal
that only one of the seven remaining indicators, access to emergency services (social
category) managed to achieve consensus, with a 79.3% agreement of relevance (Table 4-
8).
Table 4-8: Delphi round three results
Item (N=29) Mean SD %
agreement
Environmental
1. Environmentally sensitive areas 5.24 1.215 62.0
2. Solar orientation 4.79 0.902 65.5
Social
3. Access to health facilities 4.83 1.104 51.7
4. Access to emergency services 5.28 0.882 79.3
Economic
5. Skills development centres 4.28 1.099 52.4
6. Employment self-containment 4.17 1.071 64.4
7. Housing prices diversity 5.24 1.154 72.4
Page 130
110 Chapter 4
As for the remaining seven indicators which failed to achieve consensus for this second
time, the results reveal that most of the experts appeared to maintain their previous
decisions, hence, resulting in only slight changes in their importance preferences. The
fact that experts can reflect or recall their previous round preferences through the
supplied feedback also helps them in maintaining their preferences. This is consistent
with previous Delphi studies which showed that the accompanying feedback result from
the previous round tends to lead to a consensus of opinion on each of the remaining
indicators (Jairath & Weinstein, 1994). Such consensus refers to whether to accept or
reject a potential indicator, with lesser dispersion of opinions among the panellists with
increasing rounds (Powell, 2003).
4.4 Final list of key indicators
After performing the analysis of the results from three Delphi rounds involving experts
from the local Malaysian and international scene, the results indicate that 18 indicators
have been identified as the key indicators for assessing the level of sustainability of
neighbourhood development layouts. This indicator set provides primary information
prior to determination of the measurement scale for the development of the framework
(Table 4-9).
Page 131
Chapter 4 111
Table 4-9: Final list of sustainable neighbourhood assessment indicators
Indicators
Environmental
1. Land use mix diversity
2. Residential dwelling density
3. Impervious surfaces
4. Internal connectivity
5. External connectivity
6. Open space provision
7. Non-motorised transport
Social
8. Access to public transport facilities
9. Access to education facilities
10. Access to local services
11. Access to recreational space
12. Access to community services
13. Access to emergency services
14. Crime prevention and security
15. Traffic calming measures
Economic
16. Availability of commercial establishments
17. Housing option diversity
18. Affordable housing
4.5 Summary
The chapter gives an account of the descriptive statistical analysis performed on the data
obtained from the three rounds of Delphi survey. The analysis has revealed a total of 18
key indicators which were considered as the most important for measuring the
sustainability levels of neighbourhood layouts. These key indicators formed the main
component of the assessment framework to be developed in this research. The next stage
of the research is to calculate the measurement output of each key indicator, using
quantitative data derived from the spatial analysis. These processes are described in the
following chapter.Chapter 5: Analysis of Indicator Measurement Scores
Page 133
Chapter 5 113
Chapter 5: Analysis of Indicator Measurement
Scores
5.1 Introduction
Analysis from expert surveys has identified 18 key indicators within three categories
(environmental, social, and economic) for measuring the sustainability of residential
neighbourhood development layouts. This indicator set will be used to help design a
framework to assess neighbourhood development layouts, which is to achieve
research objective 2: to develop a valid assessment framework based on the indicators
identified for measuring the level of sustainability of neighbourhood layouts. The
purpose of this chapter is to calculate the measurement output, a prerequisite to the
normalisation procedures that will be discussed in the next chapter. This chapter is
presented in five sections. Following the introduction, the second section provides a
description of the each measurement, formulae, scale and unit used in this research.
Section three presents the calculation of the measurement output of these 18 indicators
for the three case studies. Section four presents a summary of the measurements, their
formulas and their respective measurement output. Finally, the chapter concludes with
summary remarks. An overview of this chapter is presented in Figure 5-1.
5.2 Measurement equations of key indicator set
Expert respondents have identified 18 key indicators as being important and were
included in the assessment framework for measuring the sustainability of the
development layouts. In order to measure these indicators, it is important to establish a
measurement scale for each indicator. Table 5-1 presents a list of the selected key
indicators, their descriptions, measurements equation and their sources, and their
respective measurement units. The measurements and units were derived from the
relevant literature and studies in the field of built environment and sustainability.
Page 134
114 Chapter 5
Figure 5-1: The structure of chapter five
Page 135
Chapter 5 115
Table 5-1: Description, measurement equation and units of indicator set
Indicator Description Measurement equation Unit
Land use mix (LUM)
Diversity of compatible land use serving local
neighbourhood needs (housing, retail, food,
educational, recreation, offices, services, civic
spaces).
LUM=∑k(pk ln pk)/ln N
where: k=Category of land use; p=proportion of land area
devoted to specific land use; N=# of land categories)
(Frank et al, 2004; Duncan et al 2010 p785)
Index value
Dwelling density (Density) Total dwelling units per designated residential
area
Density=Dwelling units/Residential area (ha)
Where: Residential area include internal public street + half
width adjoining access roads). (Boer et al., 2007)
Dwelling unit per
hectare (dph)]
Impervious surfaces (IS) Surface covered by roads, buildings, parking,
sidewalks, drainage, etc.
IS=(Total impervious area (TIA)/Total neighbourhood
area)*100
Where, TIA=roads, buildings, driveways, sidewalks, drainage,
car parks (Brabec, 2002, 2009, p427)
Percentage
Internal connectivity (IC) Efficiency of travel, expressed in terms of
route directness within the neighbourhood.
IC= Total Intersections/(Total Intersections + Cul-de-sac)
(Criterion Planners, 2011) Index value
External connectivity (EC)
Ease of street connection to surrounding
developments. Expressed in terms of average
distance to next exit point.
EC=Total perimeter length/# entry and exit points
(Aurbach, 2005, p9). Metre
Open space provision (OS) Gross areas designated for open space/active
greens per person OS=Total open space/total residents (DTCP, 1995)
Square
metre/person
Non-motorised transport
(NMT)
Residential area coverage with walkway/cycle
lane
NMT= (Total walkway/cycle length)/total street length
(PAM, 2009) Percentage
Access to public transport Number of houses within 600 m distance of a
transit stop
Transit stop adjacency: (∑Dna/∑Da)*100
Where Dna= # of dwellings for area a within distance of
service points; Da=Total dwellings in study area
(Criterion Planners, 2005)
Percentage
Access to education facilities Number of houses within 600 m distance of a
school
Facilities adjacency= (∑Dna/∑Da)*100
Where Dna=# of dwellings for area a within distance of
facility; Da=Total dwellings in area (Criterion Planners, 2011)
Percentage
Page 136
116 Chapter 5
Table 5-1 (cont‘d)
Indicator Description Measurement equation Unit
Access to recreational space Number of houses within 400 m distance from
recreation space
Space adjacency= (∑Dna/∑Da)*100
Where Dna=# of dwellings for area a within distance of
recreation space; Da=Total dwellings in area
(Criterion Planners, 2011)
Percentage
Access to community centres Number of houses within 600 m distance from
community centre
Centre adjacency= (∑Dna/∑Da)*100
Where Dna=# of dwellings for area a within distance of
community centre; Da=Total dwellings in area
(Criterion Planners, 2011)
Percentage
Access to emergency
services (ES)
Availability of three main ES (police, fire &
rescue, hospital) within 5 minutes response
distance (4km) to centre of neighbourhood
Average response distance of 3 ES
(Ministry of Health, Malaysia, 2011) Kilometre
Crime prevention and safety Design with minimum blind frontage for safe
physical environment Total blind frontage/total frontage length, (Mackay, 2001) Percentage
Traffic calming
Provision of safety features on street or junction
design (speed humps, pedestrian crossings,
traffic lights, target hardening)
Streets segments with traffic safety measures/total street
segments Percentage
Commercial establishment
types
Diverse types of business activities (restaurants,
bank, post office, convenience store, pharmacy,
hardware, hair care, laundry, retail)
Number of diverse types of business activities
(Modified from Boer et al, 2007) Types of activities
Affordable housing Availability of (subsidised) affordable housing
per total residential units
Total affordable houses/Total residential in study area,
(DTCP, 1995) Percentage
Housing option diversity
Availability of diverse dwelling types ranging
from detached, semi-D, terrace to multi-storey
units
Simpson diversity index: 1- ∑(n/N)2
where n=total dwelling is a category, N= total dwellings in
all categories (Aurbach, 2005)
Index
Page 137
Chapter 5 117
5.3 Calculation of measurement output of key indicator set
Following identification of the measurement, units and scale, the measurement output
for each of the 18 key indicators are calculated. These calculations are prerequisite to
the normalisation procedures that will be discussed in the next chapter. In this regard,
three case studies in Malaysia have been selected as a basis to generate the
measurement output for all the selected indicators. These measurement output will be
used to generate a normalisation procedure for the indicator set prior to indicator
weighting. The following subsections present the calculation of the measurement
output of each of the 18 indicators for the three case studies.
5.3.1 Land use mix
Land use mix (LUM) refers to a mix of uses within a neighbourhood that enhances the
liveability and sustainability of the neighbourhood and its surroundings. The
incorporation of various non-residential uses, such as retail, business and community
facilities, within the residential development, can reduce reliance on private vehicles,
provide for local working opportunities and enhance the interaction between residents.
In this study, the land use mix (LUM) indicator describes the distribution of different
land uses in the case study areas, namely, residential, commercial, recreation,
education and public amenities.
LUM for each case study was measured based on an average entropy measure
(evenness of distribution of land-use types) derived from Frank and colleagues (2004),
as shown below:
Average LUM =Total LUM value/Total parcel area
Total LUM value=[∑k(pk ln pk)/ln N] × parcel area] (EQ4)
where: k= land use type; p=percentage of land use type; N=number of land use
types
The calculation for total LUM value was generated by GIS spatial analysis using EQ4
and total parcel area was generated by GIS query instruction. This generates the
average LUM index value from zero to one where a higher LUM index value
Page 138
118 Chapter 5
represents a better sustainability. The results found that CS3 scored an average index
value of 0.587 followed by CS1 with 0.471 and CS2 with 0.296 (Table 5-2).
Table 5-2: Average LUM index for the three case studies
Item CS1 CS2 CS3
Total LUM value (m2) 317171 292517 445400
Total parcel area (m2) 673401 989290 758623
Average LUM index 0.471 0.296 0.587
5.3.2 Residential dwelling density
Residential dwelling density was measured by dividing the number of dwellings in
each case study with their respective total area dedicated to residential zones, which
include internal public streets and amenities. A higher density represents a better
sustainability. The equation is shown below (EQ5) (Boer et al., 2007):
Density =Dwelling units/Residential area (ha) (EQ5)
Table 5-3 presents the density calculation of the three case studies. The table shows
that CS3 recorded an average of 30.3 residential dwellings per hectare (dph), the
highest among the three case studies. Meanwhile CS2 was second with 28.3 average
dph and the subdivision development of CS1 recorded the lowest average density at
14.0 dph.
Table 5-3: Residential density calculation of the case studies
Item Case studies
CS1 CS2 CS3
Total residential dwellings 1,181 1,555 2,262
Total size of residential zones (ha) 84.6 86.3 74.6
Density (dwelling/ha) 14.0 28.3 30.3
Page 139
Chapter 5 119
5.3.3 Impervious surfaces
An impervious surface refers to a surface covered by man-made structures including
roads, buildings, parking, sidewalks, drainage, etc. The measurement was derived by
extracting all the surfaces covered by impermeable elements including roads, building
footprints, car parks and driveways on the land use parcels. The calculations to obtain
the impervious surfaces were conducted by multiplying land use impervious values
generated from spatial analysis and fieldwork measurements, with all land use parcels
in the case study area. A lower percentage of impervious surfaces represent a better
sustainability. The equation is (Brabec, 2002, 2009):
Impervious surfaces= [Total impervious area/Total neighbourhood area]*100
(EQ6)
Table 5-4 shows the impervious surfaces of the case studies. The results indicate that
CS1 has the lowest percentage of imperviousness (43.8%), followed by CS3 (49.4%)
and CS2 (54.5%).
Table 5-4: Impervious surfaces calculation
Land uses Impervious surfaces (ha)
CS1 CS2 CS3
Residential 26.1 24.3 21.4
Commercial 1.0 2.3 1.7
Recreation and green spaces 0.3 10.4 3.4
Public amenities 0.73 0.7 1.7
Education 1.67 0.5 4.8
Roads and infrastructure 12.5 17.4 20.3
Total impervious surfaces (ha) 42.3 55.6 53.3
Study area (ha) 96.5 100.2 107.8
Percentage imperviousness 43.8 54.5 49.4
5.3.4 Internal connectivity
Internal connectivity refers to the efficiency of travel, or route directness between two
points in the neighbourhood. A higher value of internal connectivity represents a
Page 140
120 Chapter 5
better sustainability. The Internal connectivity indicator was calculated using EQ7
(Criterion Planners, 2011):
Internal connectivity= Total Intersections/(Total Intersections+Cul-de-sac) (EQ7)
Spatial analysis was used to extract and count the total 4-way and 3-way road network
intersections and cul-de-sacs (Figure 5-2 to 5-4). Table 5-5 presents the results of the
analysis. It shows that the internal connectivity index for CS3 was 1.0, CS1 was 0.95
and CS2 was 0.89.
Table 5-5: Internal connectivity calculations
Items CS1 CS2 CS3
4-way intersection 6 7 11
3-way intersection 125 103 159
Cul-de-sac 7 13 0
Connectivity index value 0.95 0.89 1.00
Figure 5-2: Internal connectivity of CS1 (subdivision development)
Page 141
Chapter 5 121
Figure 5-3: Internal connectivity of CS2 (piecemeal development)
Figure 5-4: Internal connectivity of CS3 (master-planned development)
Page 142
122 Chapter 5
5.3. 5 External connectivity
External connectivity refers to the ease of street connection between the case study
and surrounding developments. A lower value of external connectivity represents a
better sustainability. This indicator measurement was determined by generating the
average distance between each main entry and exit point around the neighbourhood
perimeter according to the equation below (Aurbach, 2005):
External connectivity=Total perimeter length/ # of entry and exit points (EQ8)
Although the actual distances between entry and exit points are subject to variations in
terms of location and layout design of neighbourhoods, average distances of between
110m to 250m to the next entry/exit point is considered to be acceptable (Aurand,
2010). Figures 5-5 to 5-7 show the spatial distribution of entry and exit points within
the case study perimeters.
Figure 5-5: External connectivity of CS1 (subdivision development)
Page 143
Chapter 5 123
Figure 5-6: External connectivity of CS2 (piecemeal development)
Figure 5-7: External connectivity of CS3 (master-planned development)
Table 5-6 presents the results of the external connectivity for the three case studies.
Overall the results found that CS1 has an average of 349 metres between entry and
exit points, CS3 scored 398 metres while CS2 scored 382 metres.
Page 144
124 Chapter 5
Table 5-6: Calculation of external connectivity and sustainability benchmark score
Items Case studies*
CS1 CS2 CS3
Study area (ha) 96.5 100.2 107.8
Total perimeter (m) 4,891 4,204 5,183
Number of entry/exit points 20 11 13
Average entry/exit distance (m) 349 382 398
5.3.6 Open space provision
An open space provision refers to the availability of open or active green spaces
designated for passive or active recreation, excluding incidental spaces. The indicator
was determined based on the average size of open space provided for each
neighbourhood resident. A higher percentage of open space provision represents a
better sustainability. The equation is as shown below (EQ9) (DTCP, 1995):
Open space provision=Total open space/total residents (EQ9)
Figure 5-8 to 5-10 shows the distribution of open spaces for the three case studies. The
analysis of this indicator was conducted by generating the total open space from the
spatial data and generating the average size of open space per person (Table 5-7). The
results show that CS3 has the largest open space for its residents with 17.5sqm per
person, followed by CS1 with 14.8sqm and CS3 with 5.0sqm per person.
Table 5-7: Calculation of open space provision and sustainability score
Items Case studies
CS1 CS2 CS3
Study area (ha) 96.5 100.2 107.8
Total population 4720 6220 9040
Number of open space 7 7 7
Total open space area (ha) 7.0 3.1 15.9
Open space per person (sqm) 14.8 5.0 17.5
Page 145
Chapter 5 125
Figure 5-8: Public open spaces in CS1 (subdivision development)
Figure 5-9: Public open spaces in CS2 (piecemeal development)
Page 146
126 Chapter 5
Figure 5-10: Public open spaces in CS3 (master-planned development)
5.3.7 Non-motorised transport
Non-motorised transport (NMT) refers to the availability of sidewalks or cycleways in
the study area. Such availability was determined based on the ratio of sidewalks of
cycleways and street networks in which a higher ratio indicates better availability. A
higher non-motorised transport facility value indicates a better sustainability. The
equation for non-motorised facilities is (EQ10) (PAM, 2009):
Non-motorised transport)=[length of sidewalks+cycleways]/total street length
(EQ10)
These facilities were generated from spatial data and groundtruthing, and the
calculation indicates that all three case studies achieved a very poor in non-motorised
transport provision with only12.3% % in CS2, 14.8% in CS3, and none in CS1 (Table
5-8).
Page 147
Chapter 5 127
Table 5-8: Non-motorised transport facilities indicator and sustainability score
Items Case studies
CS1 CS2 CS3
Total street length (m) 17,222 17,216 26,144
Sidewalk length 0 2,120 1,550
Cycleway length 0 0 2,550
Total NMTF length 0 2,120 4,100
Percentage NMT length 0 12.3 14.8
5.3.8 Access to public transport facilities
Access to public transport facilities refers to the availability of public transport
facilities that are within 600-metres of the residents‘ homes. Since buses and taxis are
the only public transport services plying through the case study areas, the only facility
included in the analysis is residents‘ access to bus stops. This is determined based on
the number of houses within a 600-metre distance to the nearest transit (bus) stop. The
600-metre distance was decided as the maximum threshold that residents in the
neighbourhood are willing to walk. The 600m distance threshold was selected after
taking into account the local environment, social context, and the existing facilities
available that support walking. The equation (EQ11) to calculate access to public
transport is shown below (Criterion Planners, 2005):
Access to public transport= (∑Dna/∑Da)*100 (EQ11)
where: Dna= number of dwellings for area a within distance of service points;
Da=Total dwellings in study area
A higher percentage of coverage is associated with better access to the facility.
Figures 5-11 to 5-13 show the GIS network analysis conducted using ArcMap‘s
Origin Destination Cost Matrix (OD Cost Matrix) to identify and calculate residential
parcels within the specified network distance from the nearest transit stop.
Page 148
128 Chapter 5
Figure 5-11: Output of Origin-Destination Matrix analysis showing residential
parcel distance to nearest transit stop in CS3 (subdivision
development)
Page 149
Chapter 5 129
Figure 5-12: Output of Origin-Destination Matrix analysis showing residential
parcel distance to nearest transit stop in CS2 (piecemeal
development)
Page 150
130 Chapter 5
Figure 5-13: Output of Origin-Destination Matrix analysis showing residential
parcel distance to nearest transit stop in CS3 (master-planned
development)
Page 151
Chapter 5 131
Table 5-9 illustrates the results obtained from the spatial analysis where CS1 scored
the highest transit access coverage with 59.6%, followed by CS3 at 57.2% and CS2
with 47.7%.
Table 5-9: Calculation and scores for access to public transport stops
Dwellings within 600m network
distance
Case studies
CS1 CS2 CS3
0 and 200m distance 40 140 90
201 to 400m distance 271 313 637
401 to 600m distance 393 288 566
Total 704 741 1,293
Total residential dwellings 1,181 1,555 2,262
Transit access coverage (%) 59.6 47.7 57.2
5.3.9 Access to education facilities
Access to education facilities refers to the extent residential dwellings is located
within 600 metres of the nearest primary or secondary school. The indicator is
determined by calculating the number and percentage of houses within a 600-metre
distance to the nearest school using the given equation (EQ12) (Criterion Planners,
2011). A higher percentage of coverage is associated with better accessibility for the
neighbourhood. Figures 5-14 to 5-16 illustrate the results of the spatial analysis to
generate residential parcel distances from the nearest schools anywhere inside a 600-
metre buffer area of the case studies.
Access to education= (∑Dna/∑Da)*100 (EQ12)
where: Dna= number of dwellings for area a within distance of service points;
Da=Total dwellings in study area
Based on the map illustrations there appears to be a significant variation between the
three case studies in the number of residential dwellings within the 600-metre distance
coverage. Table 5-10 shows the calculations for the residential dwellings located
within 600-metres of the nearest education facilities. The results illustrate a variation
Page 152
132 Chapter 5
in the percentage between the case studies where CS3 has a very high percentage of
dwellings (96.4%), CS1 has 68.6% and CS2 has 54.2%.
Table 5-10: Calculation and scores of access to education facilities indicator
Items Case studies
CS1 CS2 CS3
Schools within buffer (600m) 4 7 3
Dwellings within network distance (600m) 810 842 2,180
Total residential dwellings 1,181 1,555 2,262
Access coverage (%) 68.6 54.2 96.4
Figure 5-14: Output from Origin-Destination Matrix analysis of residential parcel
distance to nearest school in CS1 (subdivision development)
Page 153
Chapter 5 133
Figure 5-15: Output from Origin-Destination Matrix analysis of residential parcel
distance to nearest school in CS2 (piecemeal development)
Page 154
134 Chapter 5
Figure 5-16: Output from Origin-Destination Matrix analysis of residential parcel
distance to nearest school in CS3 (master-planned development)
A B C D E
5
4
3
2
1
Legend
Distance to schools
0 - 200m
201 - 400m
401 - 600m
601 - 800m
School
Other land uses
Road network
Buffer area (600m)
0 210 420105Meters
¯
Page 155
Chapter 5 135
5.3.10 Access to local services
Access to local services refers to the extent that a residential dwelling is located within
600-metres from these services. Local services are defined as local serving
establishments that residents need to visit almost regularly or on a daily basis. These
include shops, day care centres and health care facilities. Access to these services was
determined based on the percentage of residential parcels located within 600-metres of
these establishments, as shown by EQ13 below (Criterion Planners, 2011):
Access to local services= (∑Dna/∑Da)*100 (EQ13)
where: Dna=number of dwellings for area a within distance of services;
Da=Total dwellings in area
Spatial analysis was conducted to extract the number of residential parcels that are
within 600-metres from any local services inside the case study and its 600-metre
buffer area (Figure 5-17 to 5-19). The result shows that all three case studies scored a
high percentage of coverage of local services with CS3 scoring full coverage (100%),
followed by CS1 with 91.4% coverage and CS2 with 83.6% coverage (Table 5-11).
Table 5-11: Access to local services within 600m network coverage
Items Case studies
CS1 CS2 CS3
Total residential dwellings 1181 1555 2262
Local services within buffer (600m) 30 240 84
Dwellings within network distance
(600m) 1080 1299 2262
Access coverage (%) 91.4 83.6 100
Page 156
136 Chapter 5
Figure 5-17: Output from Origin-Destination Matrix analysis of residential parcel
distance to local services in CS1 (subdivision development)
Page 157
Chapter 5 137
Figure 5-18: Output from Origin-Destination Matrix analysis of residential parcel
distance to local services in CS2 (piecemeal development)
Page 158
138 Chapter 5
Figure 5-19: Output from Origin-Destination Matrix analysis of residential parcel
distance to local services in CS3 (master-planned development)
5.3.11 Access to recreation parks
Access to recreation parks are spaces designated for passive or active recreation, and
may or may not have resting places (e.g., park benches), playgrounds or any form of
exercise facilities. In this study, only parks with a minimum size of 0.4 hectares (1
acre) are included in the analysis. The indicator was determined based on the
percentage of residential parcels located within 400 metres of these parks, with a
Page 159
Chapter 5 139
higher percentage being associated with better access. The 400-metre distance was
used in this analysis because park visitations are normally engaged by children or
adults accompanied by children. Due to their young age, these children need shorter
maximum walking distance thresholds; hence, the 400-metre distance was used for
this calculation. Figures 5-20 to 5-22 show the results of the OD Cost Matrix analysis
of access to these parks located within the case study buffers. The analysis was
conducted by generating the number of residential parcels that are within 400 metres
from the nearest park and calculating the percentage outcomes using EQ14 (Criterion
Planners, 2011):
Access to recreation park= (∑Dna/∑Da)*100 (EQ14)
where: Dna=number of dwellings for area a within distance of recreation space;
Da=Total dwellings in area
Table 5-12 shows the percentage of residential parcels within the 400-metre distance
of the nearest park generated from the GIS analysis. The results reveal that CS1 and
CS3 recorded the highest percentages (94.8% and 94.3%, respectively) while CS2 had
67.5% of residential parcels within the specified park distance.
Table 5-12: Calculation and scores of access to parks indicator
Items Case studies
CS1 CS2 CS3
Local parks within buffer (400m) 22 12 7
Dwellings within network distance
(400m)
1,119 1,049 2,133
Total residential dwellings 1,181 1,555 2,262
Access coverage (%) 94.8 67.5 94.3
Page 160
140 Chapter 5
Figure 5-20: Output from Origin-Destination Matrix analysis of residential parcel
distance to parks in CS1 (subdivision development)
Page 161
Chapter 5 141
Figure 5-21: Output from Origin-Destination Matrix analysis of residential parcel
distance to recreation parks in CS2 (piecemeal development)
Page 162
142 Chapter 5
Figure 5-22: Output from Origin-Destination Matrix analysis of residential parcel
distance to recreational parks in CS3 (master-planned development)
5.3.12 Access to community centre
Access to community centres refers to places that offer residents the opportunity to
congregate, socialise or perform activities that generate mutual or community benefits.
Such places identified in this research are neighbourhood centres and places of
worship. Access to community centres was determined based on the percentage of
Page 163
Chapter 5 143
residential parcels located within a 600-metre network distance from these centres; the
calculation is based on EQ15 (Criterion Planners, 2011):
Access to community centre= (∑Dna/∑Da)*100 (EQ15)
where: Dna=number of dwellings for area a within distance of community centre;
Da=Total dwellings in area a
Figures 5-23 to 5-25 indicate the results of the OD Cost Matrix analysis showing these
network distances. The analysis was conducted by generating the number of
residential parcels within a 600-metre distance from any community centre within the
case study and buffer area and calculating their percentage outcomes. Table 5-13
illustrates the percentage coverage of residential parcels within 600 metres from the
nearest community. It shows that CS1 recorded the highest percentage access
coverage at 96.9%, followed by CS3, also with a very high percentage, of 90.2%
while CS2 scored a modest 66.5% access coverage.
Table 5-13: Calculation and scores of access to community centre indicator
Items Case studies
CS1 CS2 CS3
Community centres within buffer
(600m)
6 8 6
Dwellings within network distance
(600m)
1144 1027 2041
Total residential dwellings 1181 1555 2262
Access coverage (%) 96.9 66.5 90.2
Page 164
144 Chapter 5
Figure 5-23: Output from Origin-Destination Matrix analysis of residential parcel
access to community centres in CS1 (subdivision development)
Legend
Distance to community centres
0 - 200m
201 - 400m
401- 600m
601 - 800m
Community centre
Other land uses
Road network
Case study border
Buffer area (600m)
0 190 38095
Meters
¯
Page 165
Chapter 5 145
Figure 5-24: Output from Origin-Destination Matrix analysis of residential parcel
access to community centres in CS2 (piecemeal development)
Page 166
146 Chapter 5
Figure 5-25: Output from Origin-Destination Matrix analysis of residential parcel
access to community centres in CS3 (master-planned development)
5.3.13 Access to emergency services
Access to emergency services refers to the availability of hospital, fire and rescue, and
security (police) services to the neighbourhood area within a 5-minute response time.
The response time is defined as the elapsed time from the notification to the
emergency crew to the arrival at the scene, with a shorter response time associated
with better access. A 5-minute response time was chosen in this study because this is
Page 167
Chapter 5 147
the international, commonly used benchmark to assess service efficiency in built up
areas, including in Malaysia.
The response time was converted into road distance that can be covered by the
emergency crew travelling at an average speed of 50km per hour (equivalent to a
maximum speed of 60km/hr). In this research, the 5-minute response time was
equated to a response distance of 4 kilometres. The indicator was measured based on
the combined average of the response distance of the three emergency services to
reach the centre of each case study area during an emergency situation. A shorter
average distance from emergency services indicates better sustainability. The
calculation is as shown in EQ16 (Ministry of Health, 2011):
Access to emergency services=Average response distance of 3 emergency services
(EQ16)
The results show the average distances of the case studies to the emergency services.
Based on the 5-minute response time, CS2 scored the shortest average distance at
1.7km while CS3 had the longest distance of 5.9km (Table 5-14).
Table 5-14: Distances from emergency services to case study area
Nearest emergency services (km) Case studies
CS1 CS2 CS3
Nearest hospital 3.8 1.5 11
Nearest fire and rescue station 1.3 1.5 6.4
Nearest police station 6.6 2.0 0.3
Average distance (km) 3.9 1.7 5.9
Page 168
148 Chapter 5
5.3.14 Crime prevention and safety
Crime prevention and safety are described as the physical neighbourhood design
measures that help provide for a safe physical environment. As suggested by MacKay
(2001), this research used ‗free from blind frontage‘ as the measurement. Free from
blind frontage refers to neighbourhood spaces that have some form of passive
surveillance, for example, fronting windows or passing motorists, hence, limiting
unsurveilled areas or blind frontage. The amount of blind frontages was determined by
calculating the ratio of blind frontage length to total street frontages. A lower
percentage of blind frontages indicate better sustainability. The calculation is as in
EQ17 (Mackay, 2001):
Blind frontage=Total blind frontage/total frontage length EQ17
Table 5-15 shows the percentages of blind frontages and streets with lights generated
from spatial analysis and groundtruthing (field verification) for the three case studies.
The results reveal that CS1 scored the lowest percentage of blind frontage (3.8%)
compared with CS2 (24.7%) and CS1 (33.8%).
Table 5-15: Calculations of crime prevention and safety indicator
Items Case studies
CS1 CS2 CS3
Total frontage (m) 18702 21778 34425
Blind frontage (m) 680 4307 8695
Percentage blind frontage 3.6 19.8 25.3
Page 169
Chapter 5 149
5.3.15 Traffic calming
Traffic calming refers to safety features constructed on or along neighbourhood streets
to help reduce motor vehicle speeds and increase pedestrian safety. These include
speed humps, pedestrian crossings, traffic lights and narrow lane design. The traffic
calming indicator was analysed by calculating the ratio of street segments installed
with at least a traffic calming feature, as shown by EQ18 (Mackay, 2001).
Traffic calming=Streets segments with traffic safety measures/total street segments
(EQ18)
Table 5-16 shows traffic calming features as generated from groundtruthing. The
results reveal that all three case studies had a very low provision of traffic calming
features on their streets with CS3 having close to 20% of its street segments with
traffic calming measures installed, while CS1 had close to 9% and CS2 had the least
percentage with less than 3% of its street segments having traffic calming measures.
Table 5-16: Traffic calming indicator of residential streets
Items Case studies
CS1 CS2 CS3
Total residential street segments 203 184 277
Street segments with Length traffic
calming measures
18 5 55
Percentage length traffic calmed 8.9 2.7 19.9
5.3.16 Commercial establishments
Commercial establishment refers to the availability of diverse types of businesses
offering goods or services to the neighbourhood residents. The more establishments
the area has, the better the indicator score. The analysis was conducted by calculating
the establishments from spatial attribute records of the case studies by the EQ19 (Boer
et al., 2007):
Page 170
150 Chapter 5
Commercial establishment types=Number of diverse types of business activities
(EQ19)
Table 5-17 shows the number of diverse establishment types generated from the GIS
attribute data of the case studies. The results show that CS2 and CS3 have the highest
number of diverse establishment types (14 each) while CS1 only has 5 diverse types.
Table 5-17: Diversity of commercial establishment types
Items Case studies
CS1 CS2 CS3
Number of shops 8 30 72
Total establishments=Total diverse
types
5 14 14
5.3.17 Affordable housing
Affordable housing refers to the availability of housing types that can be afforded by
people within the low income group, who were defined as having a monthly
household income of under RM3,000.00 (KLCH, 2007). Affordable houses were
priced between RM50,000.00 and RM60,000.00 (AUD18,300.00 and AUD20,000)
(NAPIC, 2010). The affordable housing indicator was calculated based on the number
of affordable houses that each case study has; and the higher the number the better the
indicator score, as shown by EQ20 (DTCP, 1995):
Affordable housing= Total affordable houses/Total residential in study area
(EQ20)
The analysis was conducted by generating the percentages of affordable housing
category from attribute records of the three case studies. Table 5-18 shows affordable
housing derived from the attributes data of these case studies. The results indicate that
CS3 recorded the highest number of affordable houses built within the neighbourhood
(25.9%) compared with CS2 (19.6%). CS1, however, has none built within its
neighbourhood.
Page 171
Chapter 5 151
Table 5-18: Calculations of affordable housing indicator and sustainability levels
Items Case studies
CS1 CS2 CS3
Total housing units 1,181 1,555 2,262
Affordable housing units 0 305 586
Percentage affordable housing 0 19.6 25.9
5.3.18 Housing option diversity
Housing option diversity refers to residential developments that offer a variety of
housing choice that people from different economic backgrounds can choose from.
These include type (detached, semi-detached, terrace or apartment), price (low,
medium or high) and number of storeys (one or two storeys). This research only uses
housing types in the calculation because it also indirectly reflects price and floor
space. The indicator was calculated based on the number of house types extracted
from attributes of the case studies. Calculation of the indicator or the diversity index
was then conducted using the Simpson diversity index by generating the square roots
ratio of each dwelling type to the total number of dwellings in the case study area, as
shown by EQ21 (Aurbach, 2005):
Housing option diversity=Simpson diversity index: 1- ∑(n/N)2 (EQ21)
where: n=total dwelling in a category, N= total dwellings in all categories
Table 5-19 presents the calculation of the indicator based on analysis of the housing
attributes and Simpson diversity index. The results reveal that both CS2 and CS3
scored a high diversity index of 0.737 and 0.725, respectively, on the Simpson
diversity scale, indicating the existence of diverse housing options in the
neighbourhoods.
Page 172
152 Chapter 5
Table 5-19: Calculations of housing option diversity and benchmark scores
Items Case studies
CS1 CS2 CS3
Total housing units 1,181 1,555 2,262
Ratio detached 1.00 0.403 0
Ratio semi detached 0 0.160 0.148
Ratio terrace A (double storey) 0 0.073 0.366
Ratio terrace B (single storey) 0 0.226 0.227
Ratio terrace C (single storey affordable) 0 0.138 0.259
Sum of square root of ratios 1.00 0.263 0.274
Diversity index (1-sum of square root) 0 0.737 0.725
5.4 Summary of indicator measurement scales and scores
The calculation and score for each indicator to measure the sustainability of the three
development layouts have been described and established in the preceding sections.
The following table (Table 5-20) presents the summary of measurement scales
(equations) and their respective scores for each case study. Since the indicator scores
have different scales (units), they require normalisation to standardise their scales in
order to generate an overall composite index score.
Page 173
Chapter 5 153
Table 5-20: Summary of measurement scales and scores of indicators
Indicator Measurement scale (equation) Measurement score
CS1 CS2 CS3 Unit
Land use mix
Total LUM value/Total parcel area
Where total LUM=∑k(pk ln pk)/ln N, k=Category of land use; p=proportion of land area
devoted to specific land use; N=# of land categories
0.471 0.296 0.587 Index value
Dwelling density Dwelling units/Residential area
Where: Residential area include internal street + half width adjoining access roads) 14.03 28.3 30.3
Dwelling unit/
ha
Impervious surfaces [Total impervious area (TIA)/Total neighbourhood area]*100
Where, TIA=roads, buildings, driveways, sidewalks, drainage, car parks 43.8 54.5 49.4 Percentage
Internal connectivity Total Intersections/(Total Intersections + Cul-de-sac) 0.95 0.89 1.00 Index value
External connectivity Total perimeter length/# entry and exit points 349 382 398 Metre
Open space provision Total open space/total residents 14.8 5.0 17.5 m2/ person
Non-motorised transport [Total walkway + cycle length]/total street length 0 12.3 14.8 Percentage
Access to public transport (∑Dna/∑Da)*100
Where Dna= # of dwellings for area a within distance of service points; Da=Total dwellings 59.6 47.7 57.2 Percentage
Access to education (∑Dna/∑Da)*100
Where Dna=# of dwellings for area a within distance of facility; Da=Total dwellings 68.6 54.2 96.4 Percentage
Access to local services (∑Dna/∑Da)*100
where: Dna=# of dwellings for area a within distance of services; Da=Total dwellings 91.4 83.6 100 Percentage
Access to recreational space (∑Dna/∑Da)*100
Where Dna=# of dwellings for area a within distance of recreation space; Da=Total dwellings 94.8 67.5 94.3 Percentage
Access to community centres (∑Dna/∑Da)*100,
Where Dna=# of dwellings for area a within distance of community centre; Da=Total 96.9 66.5 90.2 Percentage
Access to emergency services
(ES) Average response distance of 3 ES 3.9 1.7 5.9 Km
Crime prevention and safety Total blind frontage/total frontage length, (Mackay, 2001) 3.6 19.8 25.3 Percentage
Traffic calming Streets segments with traffic safety measures/total street segments 8.9 2.7 19.9 Percentage
Commercial establishment
types Number of diverse types of business activities 5 14 14 # of types
Affordable housing Total affordable houses/Total residential in study area 0 19.6 25.9 Percentage
Housing option diversity 1- ∑(n/N)2 ,
where n=total dwelling is a category, N= total dwellings in all categories 0 0.737 0.725 Index value
Page 174
154 Chapter 5
5.5 Summary
The chapter describes the equations used, and the subsequent calculations of the
output of each key indicator with the aid of spatial analysis procedures on data from
the three case studies. Since each key indicator has different measurement units, the
next stage in this framework development process is to standardise the different scores
of the key indicators to a normalised scale, to assign weightings to the individual
indicators and the category aggregate, and to run a sensitivity analysis to identify the
most appropriate framework for this research. These procedures will be discussed in
the following chapter.
Page 175
Chapter 6 155
Chapter 6: Analysis of Normalisation,
Weighting, Aggregation and
Sensitivity
6.1 Introduction
A total of 18 key sustainability indicators within the three categories have been
measured for all the case studies. This information provides basic input in the
assessment framework to generate sustainable composite index. However since the
units of measurement scales of these indicators differ from one another, it requires
normalisation, prior to weighting and aggregation, before finally validating the
framework using sensitivity analysis. This chapter is divided into six main sections.
Following the introduction, the second section describes the normalisation procedure
for all indicators where there are differences in the scales. The third section outlines
the procedures for assigning indicator weighting and aggregate category to form a
sustainability composite index. The fourth section describes the possible assessment
frameworks generated from a combination of the different normalisation techniques.
Following this overview, the fifth section describes the uncertainty and sensitivity
analysis conducted on the frameworks to identify the most appropriate framework for
measuring the sustainability levels of neighbourhood layouts. The final section gives a
brief summary of the chapter.
6.2 Normalisation techniques for all indicators
Indicator scores provide basic input to the assessment framework to generate
sustainable composite index (SCI). However if the measurement unit of the indicators
differed from one another, it requires normalisation prior to the calculation of SCI
(Nardo, et al., 2005). Normalisation refers to the procedure undertaken to standardise
the original measurement score to a normalised scale. Nardo et al. (2005) has listed
nine techniques for normalization – ranking, standardisation, min-max, distance to a
reference, categorical scale, indicator above or below, cyclical indicator, special case
of balance of opinion and percentage of annual differences.
Page 176
156 Chapter 6
Different normalization techniques produce different results for the composite
indicator, and, therefore, the robustness test will be carried out to assess their impact
on outcomes. This study used two techniques, namely, categorical scale and indicator
above or below the mean to normalise all indicators. The following section describes
both techniques and the normalised scales of each indicator for the three case studies.
6.2.1 Normalisation procedure based on the categorical scale technique
The categorical scale technique can be numerical (1, 2, 3) or qualitative (partly
achieve, achieved, not achieved) and this study used the numerical scale ranging from
1 to 5. Indicator original scores of less than 30% received a normalised scale of 1,
indicator original scores between 30% and 50% received a normalised scale of 2,
indicator original scores between 50% and 70% received a normalised scale of 3,
indicator original scores between 70% and 90% received 4 and indicator original
scores of 90% and higher received a scale of 5. In order to apply the normalised scales
in the case studies, the normalised scale was set within the range of the dissemination
(between minimum and maximum score) from original measurement score of each
indicator across the three case studies. The equation used to generate the five
normalised scales for each indicator is:
Categorical scale normalisation (EQ22)
Normalised scale 1, if =k<Dbase × 30%+Dmin
Normalised scale 2, if=Dbase × 30%+Dmin < k< Dbase ×50+Dmin
Normalised scale 3, if=Dbase × 50%+Dmin < k< Dbase × 70+Dmin
Normalised scale 4, if=Dbase ×70%+Dmin < k< Dbase ×90+Dmin
Normalised scale 5, if = k>Dbase × 90%+Dmin
where k= original indicator score, Dmin=original indicator minimum score;
Dmax=original indicator maximum score; Dbase=difference between
Dmin and Dmax;
The equation can also be illustrated in a simple format as shown in Table 6-1, where
higher normalised scale indicates better sustainability.
Page 177
Chapter 6 157
Table 6-1: The indicator original score and its respective normalised scale
Indicator original score Normalised scale
< 30% 1
30% - 50% 2
50% - 70% 3
70% - 90% 4
More than 90% 5
For a majority of indicators, the relationship between original score and sustainability
is positive and thus a higher original score received higher normalised scale. However,
for four indicators namely, impervious surfaces, external connectivity, access to
emergency services and crime prevention and safety, the relationship is negative
(opposite) where a lower original score represents better sustainability and thus lower
original scores received higher normalised scale. Based on the normalised equation
(EQ22), and with consideration of the direction of relationship between original score
and sustainability, the original score of each indicator was converted to a normalised
score, and the result is shown in Table 6-2.
Page 178
158 Chapter 6
Table 6-2: Normalisation scale based on the categorical scale technique
Indicators Original indicator score
Dmin* Dmax* Dbase*
Normalised scale
1 2 3 4 5
CS1 CS2 CS3 <30 30-50 51-70 71-90 >90
Land use mix 0.471 0.296 0.587 0.296 0.587 0.291 <0.383 0.383-0.441 0.442-0.500 0.501-0.558 >0.558
Dwelling density 14.03 28.3 30.3 14.03 30.3 16.27 <18.91 18.91-22.16 22.17-25.42 25.43-28.65 >28.65
Impervious surfaces 43.8 54.5 49.4 43.8 54.5 10.70 >53.45 51.31-53.45 49.16-51.30 47.01-49.15 <47.01
Internal connectivity 0.95 0.89 1.00 0.89 1 0.110 <0.923 0.923-0.945 0.946-0.967 0.968-0.990 >0.990
External connectivity 349 382 398 349 398 49.00 >393.10 383.31-393.10 373.51-383.30 363.70-373.50 <363.70
Open space provision 14.8 5.0 17.5 5 17.5 12.50 <8.75 8.75-11.25 11.26-13.75 13.76-16.25 >16.25
Non-motorised transport 0 12.3 14.8 0 14.8 14.80 <4.44 4.44-7.40 7.41-10.35 10.36-13.30 >13.30
Access to public transport facilities 59.6 47.7 57.2 47.7 59.6 11.90 <51.27 51.27-53.65 53.66-56.00 56.01-58.50 >58.5
Access to education facilities 68.6 54.2 96.4 54.2 96.4 42.20 <66.86 66.86-75.30 75.31-83.75 83.76-92.00 >92.00
Access to local services 91.4 83.6 100 83.6 100 16.40 <88.52 88.52-91.80 91.81-95.00 95.01-98.35 >98.35
Access to recreational space 94.8 67.5 94.3 67.5 94.8 27.30 <75.69 75.69-81.15 81.16-86.60 86.61-92.00 >92.00
Access to community centres 96.9 66.5 90.2 66.5 96.9 30.40 <75.62 75.62-81.70 81.71-87.80 87.81-93.85 >93.85
Access to emergency services 3.9 1.7 5.9 1.7 5.9 4.20 >5.48 4.65-5.48 3.81-4.64 2.96-3.80 <2.96
Crime prevention and safety 3.6 19.8 25.3 3.6 25.3 21.70 >23.10 18.81-23.10 14.46-18.80 10.11-14.45 <10.11
Traffic calming 8.9 2.7 19.9 2.7 19.9 17.20 <7.86 7.86-11.30 11.31-14.74 14.75-18.15 >18.15
Commercial establishments 5 14 14 5 14 9.00 <7.70 7.70-9.50 9.51-11.30 11.31-13.10 >18.15
Affordable housing 0 19.6 25.9 0 25.9 25.90 <7.77 7.77-12.95 12.96-18.13 18.14-23.30 >13.10
Housing option diversity 0 0.737 0.725 0 0.737 0.737 <0.221 0.2211-0.369 0.370-0.516 0.517-0.663 >23.30
*Dmin= minimum original indicator score across three case studies, Dmax= maximum original indicator score across three case studies, Dbase=Dmax–Dmin
Page 179
Chapter 6 159
Table 6-3 shows the results of the differences between the original diverse scoring
scales of the indicators to a normalised score. This normalised score will provide input
to be used together with indicator weighting and category aggregate to generate
sustainability composite index of each case study.
Table 6-3: Normalised score based on categorical scale technique
Indicator Original indicator score
Normalised indicator
score
CS1 CS2 CS3 Unit CS1 CS2 CS3
Land use mix 0.471 0.296 0.587 Index 3 1 5
Dwelling density 14.03 28.3 30.3 Dwelling
unit/ ha 1 4 5
Impervious surfaces 43.8 54.5 49.4 Percentage 5 1 3
Internal
connectivity 0.95 0.89 1.00 Index 3 1 5
External
connectivity 349 382 398 Metre 5 3 1
Open space
provision 14.8 5.0 17.5 m
2/ person 4 1 5
Non-motorised
transport 0 12.3 14.8 Percentage 1 4 5
Access to public
transport 59.6 47.7 57.2 Percentage 5 1 4
Access to education 68.6 54.2 96.4 Percentage 2 1 5
Access to local
services 91.4 83.6 100 Percentage 2 1 5
Access to
recreational space 94.8 67.5 94.3 Percentage 5 1 5
Access to
community centres 96.9 66.5 90.2 Percentage 5 1 4
Access to
emergency services 3.9 1.7 5.9 Km 3 5 1
Crime prevention
and safety 3.6 19.8 25.3 Percentage 5 2 1
Traffic calming 8.9 2.7 19.9 Percentage 2 1 5
Commercial
establishment 5 14 14 # of types 1 5 5
Affordable housing 0 19.6 25.9 Percentage 1 4 5
Housing option
diversity 0 0.737 0.725 Index 1 5 5
Page 180
160 Chapter 6
6.2.2 Normalisation procedure and score based on the above and below
mean technique
The normalisation procedure based on the above and below mean refers to
transforming the original score to a normalised score around the mean (Nardo, et al.,
2005). The scale was set based on the score value around the mean with a certain
threshold (±10%). For a majority of indicators, a higher original indicator score
indicates a better sustainability, but for four indicators (impervious surfaces, external
connectivity, access to emergency services and crime prevention and safety) the
relationship is negative (opposite) where a lower original score represents better
sustainability and thus lower original scores received higher normalised scale. The
original indicator score less than the mean (lower sustainability) receives -1, the
original indicator score around the mean receives 0 and indicator scores that are more
than the mean (higher sustainability) receive +1. The normalisation considers the
indicators that are above and below an arbitrarily defined threshold around the mean.
This transformation technique is simple and not affected by outliers (Nardo, et al.,
2005). The formula for this transformation is explained by EQ23:
Above and below mean normalisation (EQ23)
Scale -1, if k < (a-p)
Scale 0, if (a-p) <k< (a+p)
Scale 1, if k> (a+p)
Where k= original indicator score, p=±10%×average indicator mean across case
studies
The results of transformation create three normalised scores ranging from -1 to 1, as
shown in Table 6-4. The normalised scores are used together with indicator
weightings and category aggregate to calculate the sustainability composite index of
each case study. Table 6-5 shows the results on the conversion from the original
diverse scoring units of the indicator to a normalised score using the below and above
mean technique.
Page 181
Chapter 6 161
Table 6-4: Normalisation scale based on the above and below mean technique
Indicator Original score ±10%
thresholds (p) Average score (a)
Normalised scale
CS1 CS2 CS3 -1 0 +1
1. Land use mix 0.471 0.296 0.587 0.0291 0.451 <0.422 0.422-0.480 >0.480
2. Dwelling density 14.03 28.3 30.3 1.627 24.210 <22.583 22.583-25.387 >25.837
3. Impervious surfaces 43.8 54.5 49.4 1.07 49.233 >50.303 48.163-50.303 <48.163
4. Internal connectivity 0.95 0.89 1 0.011 0.947 <0.936 0.936-0.958 >0.958
5. External connectivity 349 382 398 4.9 376.333 >381.233 371.433-381.233 <371.433
6. Open space provision 14.8 5 17.5 1.25 12.433 <11.183 11.183-13.683 >13.683
7. Non-motorised transport 0 12.3 14.8 1.48 9.033 <7.553 7.553-10.513 >10.513
8. Access to public transport 59.6 47.7 57.2 1.19 54.833 <53.643 53.643-56.023 >56.023
9. Access to education 68.6 54.2 96.4 4.22 73.067 <68.847 68.847-77.287 >77.287
10. Access to local services 91.4 83.6 100 1.64 91.667 <90.027 90.027-93.307 >93.307
11. Access to recreational space 94.8 67.5 94.3 2.73 85.533 <82.803 82.803-88.263 >88.263
12. Access to community centres 96.9 66.5 90.2 3.04 84.533 <81.493 81.493-87.573 >87.573
13. Access to emergency services 3.9 1.7 5.9 0.42 3.833 >4.253 3.413-4.253 <3.413
14. Crime prevention and safety 3.6 19.8 25.3 2.17 16.233 >18.403 14.063-18.403 <14.063
15. Traffic calming 8.9 2.7 19.9 1.72 10.500 <8.780 8.780-12.220 >12.220
16. Commercial establishment 5 14 14 0.9 11.000 <10.100 10.100-11.900 >11.900
17. Affordable housing 0 19.6 25.9 2.59 15.167 <12.577 12.577-17.757 >17.757
18. Housing option diversity 0 0.737 0.725 0.0737 0.487 <0.414 0.414-0.561 >0.561
Page 182
162 Chapter 6
Table 6-5: Normalised score based on above and below technique
Indicator Indicator original score Normalised indicator score
CS1 CS2 CS3 Unit CS1 CS2 CS3
Land use mix 0.471 0.296 0.587 Index 0 -1 1
Dwelling density 14.03 28.3 30.3 Dwelling
unit/ ha -1 1 1
Impervious surfaces 43.8 54.5 49.4 Percentage 1 -1 0
Internal connectivity 0.95 0.89 1 Index 0 -1 1
External connectivity 349 382 398 Metre 1 -1 -1
Open space provision 14.8 5 17.5 m2/ person 1 -1 1
Non-motorised
transport 0 12.3 14.8 Percentage -1 1 1
Access to public
transport 59.6 47.7 57.2 Percentage 1 -1 1
Access to education 68.6 54.2 96.4 Percentage -1 -1 1
Access to local
services 91.4 83.6 100 Percentage 0 -1 1
Access to recreational
space 94.8 67.5 94.3 Percentage 1 -1 1
Access to community
centres 96.9 66.5 90.2 Percentage 1 -1 1
Access to emergency
services 3.9 1.7 5.9 Km 0 1 -1
Crime prevention and
safety 3.6 19.8 25.3 Percentage 1 -1 -1
Traffic calming 8.9 2.7 19.9 Percentage 0 -1 1
Commercial
establishment 5 14 14 # of types -1 1 1
Affordable housing 0 19.6 25.9 Percentage -1 1 1
Housing option
diversity 0 0.737 0.725 Index -1 1 1
6.3 Indicator weighting and category aggregate
Indicator weighting refers to assigning weighting to reflect the relative impact of
indicators in contributing to sustainability level of residential neighbourhood layouts.
Meanwhile, category aggregate refers to assigning aggregate to reflect the relative
impact of each category in sustainability level. Indicator weightings and category
aggregate will be used together with indicators normalised score to form a composite
index for sustainability levels. The relationship between indicator normalised score,
indicator weighting category aggregate, and on sustainability composite index is
shown in Figure 6-1.
Page 183
Chapter 6 163
Figure 6-1: The illustration of the relationship between indicator weighting and
aggregation category on composite sustainability index
The assignment of weighting and aggregation was based on the results of the Delphi
survey, which is consistent with the budget allocation process (BAP) (Nardo et al.,
2005). According to the author, BAP has four phases: a) selection of experts for the
valuation, b) allocation of budgets to the individual indicator/individual category, c)
calculation of weighting/aggregate, and d) iteration of the budget allocation until
convergence is reached (optional). The assignment of weighting and aggregate were
conducted separately according to the respondent‘s regional location. This was to
examine whether there is any difference in opinion and judgement concerning the
importance level of the indicator in contributing to sustainability. As a result, three
groups of experts were created. The first group was the overall expert respondents
who were local (Malaysian) and international, the second group consisted only the
local expert respondents and the third group consisted only the international experts.
Page 184
164 Chapter 6
The expert respondents consisted of diverse backgrounds in the built environment,
academicians, practitioners and state and local government agencies, both from
Malaysia and internationally. Tables 6-6 and 6-7 show the regional location of the
expert respondents of Delphi round two and three. Round two of the Delphi survey
consisted of 18 local (Malaysian) and 14 international expert respondents (Table 6-6),
while round three consisted of 17 local (Malaysian) and 12 international respondents
(Table 6-7).
Table 6-6: Regional profile of expert respondents in Delphi round two
Division International Local Overall %
Academics 9 5 14 43.8
Practitioners 2 8 10 31.2
Government 3 5 8 25.0
Total 14 18 32 100
Table 6-7: Regional profile of expert respondents in Delphi round three
Division International Local Overall %
Academics 8 5 13 44.8
Practitioners 2 7 9 31.0
Government 2 5 7 24.2
Total 12 17 29 100
The following two sections present the procedure underlying the assignment of
weighting and aggregation for the indicator set respectively according to these three
groups of expert respondent.
6.3.1 Assignment of indicator weighting
The assignment of indicator weighting was generated from the importance values
rated by the experts in rounds two and three of the Delphi survey. The experts were
asked to rank the level of importance for each indicator category from ‗1=very low’,
2=low’, ‘3=medium low’, ‘4=medium’, ‘5=medium high’, ‘6=high’ and ‘7=very
high’ in terms of contribution to sustainability. The group importance mean (average)
Page 185
Chapter 6 165
was calculated for each indicator to generate weighting for the indicator according to
the three groups; the overall group of respondents, Malaysian respondents and
international respondents.
The results of the total mean score for all the indicators between the three groups are
displayed in Table 6-8. For overall respondents, the indicator weightings ranged from
the lowest of 5.28 (access to emergency services) to the highest of 6.26 (open space
provision). For the Malaysian experts, the indicator weightings ranged from the lowest
of 5.18 (commercial establishments) to the highest of 6.22 (open space provision).
Meanwhile, for international experts, the indicator weightings ranged from the lowest
of 5.11 (impervious surfaces) to the highest of 6.30 (access to public transport
facilities).
Table 6-8: Indicator weightings for the three groups of expert respondents
Indicators (k) Group important mean(
Overall Malaysian International
Environmental
1. Land use mix diversity 6.03 5.94 6.12
2. Dwelling density 5.47 5.64 5.27
3. Impervious surfaces 5.41 5.71 5.11
4. Internal connectivity 6.06 6.00 6.12
5. External connectivity 5.63 5.59 5.67
6. Open space provision 6.22 6.29 6.15
7. Non-motorised transport facilities 5.97 5.90 6.04
Social
1. Access to public transport facilities 6.06 5.82 6.30
2. Access to education facilities 5.97 6.00 5.94
3. Access to local services 5.66 5.41 5.91
4. Access to recreational space 5.84 5.70 5.98
5. Access to community centres 5.44 5.53 5.34
6. Access to emergency services 5.28 5.40 5.16
7. Crime prevention & safety 6.00 6.06 5.93
8. Traffic calming 5.34 5.47 5.20
Economic
1. Commercial establishments 5.50 5.18 5.82
2. Affordable housing 5.69 5.58 5.80
3. Housing option diversity 5.41 5.29 5.53
Page 186
166 Chapter 6
6.3.2 Assignment of category aggregate
Category aggregate refers to the impact value of each category: environmental, social
and economic in contributing to the level of sustainability of a neighbourhood
development. Aggregation was generated from the important points allocated by the
experts in round two of the Delphi survey, which involved a total of 32 respondents,
of whom 18 were Malaysians (local experts) and 14 were international experts. These
experts were asked to allocate the relative importance for each category based on one
hundred points for the total category set (a total of 100 points for all three categories).
The point for each indicator was based on the expert respondents‘ experience and
subjective judgement of the relative importance of the respective category in
contributing to sustainability.
The group mean of the important points was calculated to generate the aggregate for
each category (environmental, social and economic) between the three groups (Table
6-9). The results show that the overall respondents scored a group mean of 39.28 for
environmental, 33.00 for social and 27.72 for economic. The Malaysian respondents
scored 39.02 for environmental, 32.46 for social and 28.52 for economic. Meanwhile,
the international respondents scored 39.58 for environmental, 33.61 for social, and
26.81 for the economic category.
Table 6-9: Aggregate category between the three groups of expert respondents
Categories Group important mean(
Overall Malaysian International
Environmental 39.28 39.02 39.58
Social 33.00 32.46 33.61
Economic 27.72 28.52 26.81
Total 100 100 100
Page 187
Chapter 6 167
6.3.3 Formulation of sustainability composite index calculation
This study uses two normalisation techniques, the categorical scale (with five
normalised benchmark scales) and the above or below mean (with three normalised
benchmark scales). The purpose of using more than one normalisation technique was
to ascertain the most appropriate one for application in Malaysia. This is because
different techniques have different strengths that affect the composite index (Nardo, et
al., 2005). Following normalisation, the indicator weighting and aggregation category
were conducted by applying the budget allocation process (BAP) in which weighting
and aggregate were based on the mean of the expert respondent group. The group
mean of the indicator and category were calculated to generate the indicator weighting
and aggregate category between the Malaysian and international experts.
Assigning a normalised scale, indicator weighting and aggregate category is the
principal task of formulating a sustainability composite index (SCI). Once these tasks
were completed the sustainability composite index was generated using the following
formula (EQ24):
Sustainability composite index (SCI) =
(EQ24)
where k=indicator, t=indicator category, a=indicator normalised score of case
study,
b= indicator weighting, and c= category aggregate score
The formula has been used to generate the SCI of the different sustainability
frameworks based on the possible combination of normalisation techniques and the
grouping of experts, as described in the following section.
𝑎𝑘𝑏𝑘𝑐𝑡 𝑘 = 1,2,… ,18 𝑎𝑛𝑑 𝑡 = 1,2,3
𝑘 ,𝑡
Page 188
168 Chapter 6
6.4 Overview of different frameworks developed based on different
techniques
This study applied two normalisation techniques and three groups of expert
respondents (all experts, Malaysian only and international only), which created a
possible of six different frameworks for calculating the sustainability index of
residential neighbourhood development layouts. The different combinations of
techniques for the different frameworks are shown in Table 6-10. Each of these
frameworks was then tested on the three case studies to generate a respective
composite index, and the results were as shown in Table 6-11.
Table 6-10: Six frameworks derived from different combinations of development
techniques
Framework Normalisation
Technique
BAP* weighting and aggregation
from different groups of experts
A Categorical All experts
B Categorical Malaysian experts
C Categorical International experts
D Above and below mean All experts
E Above and below mean Malaysian experts
F Above and below mean International experts
*BAP= Budget allocation process technique
By generating these results, this section had provided an avenue to check for possible
sources of uncertainty in the development of the framework. This was done using
uncertainty and sensitivity analyses, in order to identify the sources of uncertainty that
influence the scores of the composite index. These analyses are described in the
following section.
Page 189
Chapter 6 169
Table 6-11 Composite index derived from six frameworks for case study 1 (CS1), case study 2 (CS2) and case study 3 (CS3)
Indicators Framework A Framework B Framework C Framework D Framework E Framework F
CS1 CS2 CS3 CS1 CS2 CS3 CS1 CS2 CS3 CS1 CS2 CS3 CS1 CS2 CS3 CS1 CS2 CS3
Environmental
1. Land use mix diversity 711 237 1184 695 232 1159 727 242 1211 0 -237 237 0 -232 232 0 -242 242
2. Dwelling density 215 859 1074 220 880 1100 209 834 1043 -215 215 215 -220 220 220 -209 209 209
3. Impervious surfaces 1063 213 638 1114 223 668 1011 202 607 213 -213 0 223 -223 0 202 -202 0
4. Internal connectivity 714 238 1190 702 234 1171 727 242 1211 0 -238 238 0 -234 234 0 -242 242
5. External connectivity 1106 663 221 1091 654 218 1122 673 224 221 -221 -221 218 -218 -218 224 -224 -224
6. Open space provision 977 244 1222 982 245 1227 974 243 1217 244 -244 244 245 -245 245 243 -243 243
7. Non-motorised transport 235 938 1173 230 921 1151 239 956 1195 -235 235 235 -230 230 230 -239 239 239
8. Access to public transport 1000 200 800 945 189 756 1059 212 847 200 -200 200 189 -189 189 212 -212 212
9. Access to education facilities 394 197 985 390 195 974 399 200 998 -197 -197 197 -195 -195 195 -200 -200 200
10. Access to local services 374 187 934 351 176 878 397 199 993 0 -187 187 0 -176 176 0 -199 199
11. Access to recreational space 964 193 964 925 185 925 1005 201 1005 193 -193 193 185 -185 185 201 -201 201
12. Access to community centres 898 180 718 898 180 718 897 179 718 180 -180 180 180 -180 180 179 -179 179
13. Access to emergency services 523 871 174 526 876 175 520 867 173 0 174 -174 0 175 -175 0 173 -173
14. Crime prevention & safety 990 396 198 984 393 197 997 399 199 198 -198 -198 197 -197 -197 199 -199 -199
15. Traffic calming 352 176 881 355 178 888 350 175 874 0 -176 176 0 -178 178 0 -175 175
16. Commercial establishments 152 762 762 148 739 739 156 780 780 -152 152 152 -148 148 148 -156 156 156
17. Affordable housing 158 631 789 159 637 796 155 622 777 -158 158 158 -159 159 159 -155 155 155
18. Housing option diversity 150 750 750 151 754 754 148 741 741 -150 150 150 -151 151 151 -148 148 148
Composite index 10976 7935 14657 10866 7891 14494 11092 7967 14813 342 -
1400 2169 334 -1369 2132 353 -1438 2204
2 3 1 2 3 1 2 3 1 2 3 1 2 3 1 2 3 1
*Framework: A=categorical+all experts, B=categorical+Malaysian experts, C= categorical+international experts, D= below/above mean+all experts,
E=below/above mean+Malaysian experts and F= below/above mean+international experts
Page 190
170 Chapter 6
6.5 Uncertainty and Sensitivity analysis
As explain earlier, this study constructs the framework using two normalisation
techniques: the categorical scale techniques and the above and below mean technique
for normalisation; and the budget allocation process derived from expert Malaysian
and international respondents for indicator weighting and category aggregation.
Therefore, the possible error could result in dubious analytic rigour of the framework,
which might be expected to come from the normalisation technique or expert group
respondents (Nardo, et al., 2005). In order to examine these errors, uncertainty and
sensitivity analyses were conducted on the framework. The purpose of these two
analyses was to examine the consistency of (a) the techniques used in normalisation
and weighting, and (b) the expert respondents‘ opinion in assessing the sustainability
of the residential neighbourhood layout. The following two subsections described
these two analyses with further details.
6.5.1 Uncertainty analysis between different groups of experts
Uncertainty analysis examines the input factors that propagate through the structure of
the sustainability composite indicator index (ranking order). Since there were three
case studies, the ranking order is 1, 2 3. The highest sustainability index received rank
1, while the lowest received rank 3. This study addresses the source of uncertainty due
to differences between the groups of experts. This was to examine the consistency of
a) the expert respondents‘ opinion in assessing the sustainability of residential
neighbourhood layouts and b) techniques used in normalisation and weighting. The
first uncertainty analysis involved comparing ranking differences (derived from
composite index) between different groups of experts; all experts, Malaysian, and
international were based on the categorical scale technique. Similarly, the second
analysis compared the differences between the different groups of expert but was
based on the above and below mean technique of normalisation.
Page 191
Chapter 6 171
Table 6-12 presents the sustainability rank of the three case studies based on the
categorical scale normalisation. The results show that both the Malaysian and
international experts ranked case study 3 (Master-planned development) the first, case
study 1 (sub-division development) second, and case study 2 (piecemeal development)
third.
Table 6-12 Differences in ranking between three groups of experts based on
categorical scale normalisation
Indicators All Malaysian International
CS1 CS2 CS3 CS1 CS2 CS3 CS1 CS2 CS3
1. Land use mix diversity 711 237 1184 695 232 1159 727 242 1211
2. Dwelling density 215 859 1074 220 880 1100 209 834 1043
3. Impervious surfaces 1063 213 638 1114 223 668 1011 202 607
4. Internal connectivity 714 238 1190 702 234 1171 727 242 1211
5. External connectivity 1106 663 221 1091 654 218 1122 673 224
6. Open space provision 977 244 1222 982 245 1227 974 243 1217
7. Non-motorised transport 235 938 1173 230 921 1151 239 956 1195
8. Access to public transport 1000 200 800 945 189 756 1059 212 847
9. Access to education facilities 394 197 985 390 195 974 399 200 998
10. Access to local services 374 187 934 351 176 878 397 199 993
11. Access to recreational space 964 193 964 925 185 925 1005 201 1005
12. Access to community centres 898 180 718 898 180 718 897 179 718
13. Access to emergency services 523 871 174 526 876 175 520 867 173
14. Crime prevention & safety 990 396 198 984 393 197 997 399 199
15. Traffic calming 352 176 881 355 178 888 350 175 874
16. Commercial establishments 152 762 762 148 739 739 156 780 780
17. Affordable housing 158 631 789 159 637 796 155 622 777
18. Housing option diversity 150 750 750 151 754 754 148 741 741
Total 10976 7935 14657 10866 7891 14494 11092 7967 14813
Rank 2 3 1 2 3 1 2 3 1
CS1=Subdivision development; CS2=Piecemeal development; CS3=Master-planned development
Page 192
172 Chapter 6
When comparing the rank order based on the above and below normalisation
technique (Table 6-13), the results were found consistent between the Malaysian and
international experts. Both groups ranked case study 3 as first, case study 1 as second
and case study 2 as third. These results (Table 6-12 and Table 6-13) demonstrate that
both groups of experts share common opinion and judgement in assessing the
sustainability of all three residential neighbourhoods.
Table 6-13 Differences in ranking between three groups of experts based on above and
below normalisation
Indicators
All Malaysian International
CS1 CS2 CS3 CS1 CS2 CS3 CS1 CS2 CS3
1. Land use mix diversity 0 -237 237 0 -232 232 0 -242 242
2. Dwelling density -215 215 215 -220 220 220 -209 209 209
3. Impervious surfaces 213 -213 0 223 -223 0 202 -202 0
4. Internal connectivity 0 -238 238 0 -234 234 0 -242 242
5. External connectivity 221 -221 -221 218 -218 -218 224 -224 -224
6. Open space provision 244 -244 244 245 -245 245 243 -243 243
7. Non-motorised transport -235 235 235 -230 230 230 -239 239 239
8. Access to public transport 200 -200 200 189 -189 189 212 -212 212
9. Access to education facilities -197 -197 197 -195 -195 195 -200 -200 200
10. Access to local services 0 -187 187 0 -176 176 0 -199 199
11. Access to recreational space 193 -193 193 185 -185 185 201 -201 201
12. Access to community centres 180 -180 180 180 -180 180 179 -179 179
13. Access to emergency services 0 174 -174 0 175 -175 0 173 -173
14. Crime prevention & safety 198 -198 -198 197 -197 -197 199 -199 -199
15. Traffic calming 0 -176 176 0 -178 178 0 -175 175
16. Commercial establishments -152 152 152 -148 148 148 -156 156 156
17. Affordable housing -158 158 158 -159 159 159 -155 155 155
18. Housing option diversity -150 150 150 -151 151 151 -148 148 148
Total 342 -1400 2169 334 -1369 2132 353 -1438 2204
Rank 2 3 1 2 3 1 2 3 1
CS1=Subdivision development; CS2=Piecemeal development; CS3=Master-planned development
Since the preceding analyses have found out that there is no difference in the ranking
order for the three case studies among the three expert groups, the analysis to examine
the consistency of the normalisation techniques is conducted based on all respondents
(a combination of both Malaysian and international). The results indicate that the
ranking order of the three case studies is consistent between the two techniques, as can
Page 193
Chapter 6 173
be seen in Table 6-14, where both techniques ranked CS3 first, CS1 second and CS2
third. Generally, these uncertainty analyses have shown the potential input factors
from respondent groups and both techniques used in normalisation to generate
sustainability composite indicator index are consistent. This also indicates that all
frameworks are robust. However, it is necessary to select only one framework that is
the most suitable for use in Malaysia. Pertaining to this, sensitivity index between two
normalisation techniques is calculated to examine the level of sensitivity of each
indicator.
Table 6-14 Differences in ranking between categorical normalisation and above and
below mean normalisation technique based on all experts
Indicators Categorical Above and below mean
CS1 CS2 CS3 CS1 CS2 CS3
1. Land use mix diversity 711 237 1184 0 -237 237
2. Dwelling density 215 859 1074 -215 215 215
3. Impervious surfaces 1063 213 638 213 -213 0
4. Internal connectivity 714 238 1190 0 -238 238
5. External connectivity 1106 663 221 221 -221 -221
6. Open space provision 977 244 1222 244 -244 244
7. Non-motorised transport 235 938 1173 -235 235 235
8. Access to public transport 1000 200 800 200 -200 200
9. Access to education facilities 394 197 985 -197 -197 197
10. Access to local services 374 187 934 0 -187 187
11. Access to recreational space 964 193 964 193 -193 193
12. Access to community centres 898 180 718 180 -180 180
13. Access to emergency services 523 871 174 0 174 -174
14. Crime prevention & safety 990 396 198 198 -198 -198
15. Traffic calming 352 176 881 0 -176 176
16. Commercial establishments 152 762 762 -152 152 152
17. Affordable housing 158 631 789 -158 158 158
18. Housing option diversity 150 750 750 -150 150 150
Total 10976 7935 14657 342 -1400 2169
Rank 2 3 1 2 3 1
CS1=Subdivision development; CS2=Piecemeal development; CS3=Master-planned development
Page 194
174 Chapter 6
6.5.2 Sensitivity analysis between two normalisation techniques
Sensitivity analysis is a technique used to determine how differences in the values
associated with an independent variable will affect the dependent variable (Pannel,
1997). It is helpful in determining the uncertainty in the model prediction through
variations in model inputs (Lilburne & Tarantola, 2009). This study adopted the
sensitivity index, which is based on the variations of the indicator input on the
variation of output (Hoffman and Gardner, 1983; Chen, et al., 2010). The sensitivity
index compares the output differences of each indictor using EQ21:
SIk=
(EQ21)
where SI=sensitivity index, k=indicator, Dmax=Composite index when k is set to
maximum normalised scale, and Dmin=composite index when k is set
to a minimum normalised scale.
The composite index values for these calculations are derived from Table 6-14. As an
example, the SI for land use mix diversity indicator for categorical scale normalisation
will be as follows: SI land use mix diversity=(1184-237)/1184 which is equivalent to 0.8.
Table 6-15 presents a list of the sensitivity index (SI) for all indicators based on the
above and below mean normalisation and categorical scale normalisation techniques.
The results demonstrate that the SI for the categorical scale ranged from 0.8 to 1.0
where 10 indicators scored 0.8 and eight indicators scored 1.0. Meanwhile, the SI for
the above and below mean technique ranged from 0 to 2.0 where three indicators
scored 0, seven indicators scored 1.2 and six indicators scored 2.0.
Page 195
Chapter 6 175
Table 6-15: Sensitivity index of two normalisation techniques
Indicators Sensitivity index
Above and below mean Categorical scale
1. Land use mix 2.0 0.8
2. Dwelling density 2.0 0.8
3. Impervious surfaces 2.0 0.8
4. Internal connectivity 2.0 0.8
5. External connectivity 2.0 0.8
6. Open space provision 2.0 0.8
7. Non-motorised transport 2.0 0.8
8. Access to public transport facilities 1.2 1.0
9. Access to education facilities 1.2 1.0
10. Access to local services 1.2 1.0
11. Access to recreational space 1.2 1.0
12. Access to community centres 1.2 1.0
13. Access to emergency services 1.2 1.0
14. Crime prevention and safety 1.2 1.0
15. Traffic calming 1.2 1.0
16. Commercial establishments 0.0 0.8
17. Affordable housing 0.0 0.8
18. Housing option diversity 0.0 0.8
SI with a lower value indicates that the indicator is less sensitive over the composite
index. This shows that three indicators (commercial establishments, affordable
housing and housing option diversity) are less sensitive, and, therefore, less reliable
for measuring residential development layouts when used with the above and below
mean technique. However, these three indicators are found to be reliable when used
with the categorical scale technique. Thus, in comparing between these two
techniques, this study found that the categorical scale normalisation technique is more
appropriate for the development of the framework because all indicators are sensitive
and reliable for measuring sustainability.
Page 196
176 Chapter 6
6.6 Summary
The construction of a framework for calculating a composite index is subject to error
due to the indicator values and assumptions, and, therefore, requires validation
(Pannel, 1997; Nardo, et al., 2005). This study constructs the framework for the
sustainability composite index for residential neighbourhood layouts, which has
applied two normalisation techniques – categorical scale techniques and above and
below mean technique, and one weighting and aggregation technique, the budget
allocation process (BAP). The normalisation procedures are based on three different
types of residential neighbourhood in Malaysia and weighting and aggregation are
derived from expert surveys (Malaysians and internationals).
Both uncertainty and sensitivity analysis are techniques used to determine the
behaviour and magnitude of indicators that would affect the composite index (Pannel,
1997; Lilburne & Tarantola, 2009). The source of uncertainty is examined based on
the consistency of (a) the consistency of techniques used in normalisation and
weightings, and (b) the expert respondents‘ opinion in assessing the sustainability of
residential neighbourhood layouts. The results of uncertainty analysis showed that
both techniques are consistent in giving similar rankings to the case studies, and this
also indicates that consistency is also evident in regards to the opinions and judgement
given by all experts. This also indicates that all frameworks are robust. When looking
at the sensitivity analysis, the sensitivity index (SI), which compares the output
differences of each indicator demonstrated variations between the two techniques. The
indicators were found to be reliable when used with the categorical scale technique.
Based on results from both analyses, the categorical scale normalisation technique is
the most suitable and appropriate for the development of the framework.
Page 197
Chapter 7 177
Chapter 7: Discussion, Implications and
Conclusion
7.1 Introduction
The purpose of this research is to bridge the gap that have been identified earlier
regarding the need to have a mechanism within which sustainability levels of existing
residential development layouts can be quantified in a practical and systematic way.
This chapter discusses the significant research findings, the implications of the study
in respect of the body of knowledge and current practice, the limitations of the study,
recommendations for further research, and final concluding comments. Following the
introduction, the second section presents the discussion on the findings according to
the research objectives. The objectives which propelled this research are (1) to
identify environmental, social and economic indicators that can be used to evaluate
the level of sustainability of neighbourhood layouts; (2) to develop a valid assessment
framework based on the indicators identified for measuring the level of sustainability
of neighbourhood layouts, and, (3) to apply the assessment framework to different
types of neighbourhood developments in order to determine their level of
sustainability. The fourth section discusses the implications of this research both in
terms of theoretical and practical aspects. The fifth section explains the limitations of
this research and recommendations for future research stemming from the findings
highlighted in this research and the chapter concludes with an overall summary of the
research.
7.2 Discussion of findings in relation to the research objectives
Each indicator in the assessment framework is measured against the case studies to
determine the scores which are combined to ultimately determine the sustainability
levels of the case studies. As such the conduct of this research is in line with others
such as Becker (2004, 2005) who compares the indicator with a reference value or
target, and Dusenbury (2000) who uses such performance measurement to provide
feedback to adjust and strengthen the strategic plans towards achieving sustainable
development. In this research, based on the indicator measurement scores, planners
Page 198
178 Chapter 7
would be able to identify areas which need improvements to enhance the sustainability
further.
In line with the methodology of this research, the analyses are undertaken and
presented in sequence according to each research objective. As far as the discussion is
concerned this sequential approach enhances the understanding of the research, which
also adopts the embedded research design, whereby one dataset is embedded within
the other so as to provide a supportive role for the other dataset (Creswell & Plano
Clark, 2007). It is also believed that by relating the discussion according to the actual
steps that have to be followed in the framework formulation process, potential errors
can be minimised. The following sections discuss the findings from the analysis in
line with objectives listed in the previous section.
7.2.1 Identification of the environmental, social and economic indicators
which can be used to evaluate the level of sustainability of
neighbourhood layouts
The first research objective is to identify environmental, social and economic
indicators that can be used to evaluate the level of sustainability of neighbourhood
layouts. The development of urban sustainability indicators was initiated in the early
1980s. However, many of these indicators focus on assessment at national and
international levels, and indicators focusing on sustainability assessment at local level,
including on neighbourhood development are limited (UNCED, 1992; UNDP, 2001;
Winston & Eastaway, 2008). The selection of relevant and appropriate indicator sets is
vital because the strengths and weakness of the framework are largely dependent on
the quality of the underlying indicators (Nardo, et al., 2005). Using the Triple bottom
line sustainability approach and the domain-based framework by Maclaren (1996) to
frame this research, a total of 128 potential indicators are identified from the relevant
literature but not limited to the field of sustainability and residential development.
Consistent with the conceptual framework, the classification of the indicators under
the three categories – environmental (80 indicators), social (37 indicators) and
economic (11 indicators) reflects the relative importance of environmental and social
indicators in the sustainability research and development fields. After undergoing a
selection process involving conditions set by Hatry et al. (1977), DETR (1998) and
Hemphill et al. (2004), a total of 38 initial indicator set has been identified as having
Page 199
Chapter 7 179
the potential for measuring the sustainability levels of residential development
layouts. This filtering process is an effective way to separate indicators which do not
fulfil the requirements of this study.
The Delphi study is used in this research because findings from the literature conclude
that it is the most appropriate technique for such research to gather consensus opinion
(Dalkey, 1972; Mitchell, 1991; Rowe, et al., 1991; Adler & Ziglio, 1996; Rowe &
Wright, 1999; Powell, 2003; Skulmoski, et al., 2007; Grisham, 2009; Landeta, et al.,
2011). It is also found that the Delphi technique has the ability to provide hindsight
and garner consensus where the knowledge or evidence about the issue of interest is
lacking or even unknown (Adler & Ziglio, 1996; Murphy, et al., 1998). This is in line
with the limited studies conducted on using indicators for measuring neighbourhood
layouts. It is even more appropriate for the Malaysian case because such study
involving the use of indicators for measuring sustainability levels has not been
conducted in Malaysia.
The use in this study of the three-round Delphi survey on the 38 indicators in this
study is an important step to identify the most relevant and appropriate sustainability
indicators. All three Delphi rounds have their own importance, from ascertaining the
content validity of indicators according to their category based on the perceptions of
experts (Pikora, et al., 2003), to selecting important indicators based on an agreed cut-
off point (for example 75% agreement of importance). The involvement of expert
respondents with diverse backgrounds in the built environment, academicians,
practitioners and state and local government agencies both from Malaysia and abroad
is another important approach adopted in this research. It enables the researcher to get
the best out of these two groups of experts in regard to both local and international
sustainability knowledge and experience respectively.
The use of a cut off-point for determining consensus is adopted in this research
because it enables the researcher to delineate indicators which are considered more
important than others which are considered to show less importance. This research
uses 75% agreement of relevance as the cut-off point for selection of the key
indicators. As indicated in the literature, this was among the widely used cut-off point
in studies involving consensus of agreement (Tigelaar, et al., 2004). Based on the
Page 200
180 Chapter 7
three-round Delphi survey and using the 75% agreement of relevance as the cut-off
point, 18 of the 38 relevant indicators were identified by the panel of expert
participants the key indicators for assessing the sustainability of neighbourhood
layouts (Figure 7-1) This indicator set, grouped under three categories: environmental
(seven indicators), social (eight indicators) and economical (three indicators) provides
the primary information for the development of the framework, which is in line with
the first objective of this research.
Figure 7-1: Final list of sustainability indicators according to category
The outcome also reveals that the number of final indicators in each group is
proportionately consistent with the initial amount of indicators selected prior to the
Delphi rounds. However, it should be cautioned that the result could be different if
other consensus techniques as highlighted in the literature were used, for example
interquartile range (Beattie, et al., 2004; Nelson, 2006), standard deviation (Scott,
2002; Seibert, 2004; Brill, et al., 2006), or group mean (Brown, et al., 2006).
Page 201
Chapter 7 181
7.2.2 Development of a valid assessment framework based on the indicators
identified for measuring the level of sustainability of neighbourhood
layouts
The second objective of this research seeks to develop a valid assessment framework
based on the indicators identified for measuring the level of sustainability of
neighbourhood layouts. This objective involves a two-stage process. The first stage is
to establish the normalised indicator scores, indicator weighting as well as the
category aggregate prior to the development of the framework. Once the framework is
established, the second stage comes into play, which is to validate the framework for
measuring the sustainability of neighbourhood layouts.
The normalisation of the indicator scores is important to enable the generation of a
composite index. The normalised indicator scores are derived from spatial data of
three different types of residential development in Malaysia (master-planned,
piecemeal, and sub-division developments). The justification for using these three
residential types is because they are representative of the major types of housing
development in Malaysia.
The normalised scores for these key indicators are generated from two normalization
techniques, the categorical scale and the above or below mean (Nardo et. al., 2005).
The purpose of using more than one normalisation techniques in this research is to
ascertain the most appropriate one for application in Malaysia. This is because
different techniques have different strengths that affect the composite index (Nardo, et
al., 2005). Table 7-1 shows normalised indicator scores derived from category scale
and above and below normalisation techniques. These normalised indicator scores
provide fundamental input information about the case studies and together with the
indicator weighting and category aggregate, are utilised to generate the sustainability
composite index of the case studies.
Page 202
182 Chapter 7
Table 7-1: Normalised indicator scores derived from category scale and above and
below normalisation techniques
Indicator Category scale Above and below mean
CS1 CS2 CS3 CS1 CS2 CS3
1. Land use mix 3 1 5 0 -1 1
2. Dwelling density 1 4 5 -1 1 1
3. Impervious surfaces 5 1 3 1 -1 0
4. Internal connectivity 3 1 5 0 -1 1
5. External connectivity 5 3 1 1 -1 -1
6. Open space provision 4 1 5 1 -1 1
7. Non-motorised transport 1 4 5 -1 1 1
8. Access to public transport 5 1 4 1 -1 1
9. Access to education 2 1 5 -1 -1 1
10. Access to local services 2 1 5 0 -1 1
11. Access to recreational space 5 1 5 1 -1 1
12. Access to community centres 5 1 4 1 -1 1
13. Access to emergency services 3 5 1 0 1 -1
14. Crime prevention and safety 5 2 1 1 -1 -1
15. Traffic calming 2 1 5 0 -1 1
16. Commercial establishment 1 5 5 -1 1 1
17. Affordable housing 1 4 5 -1 1 1
18. Housing option diversity 1 5 5 -1 1 1
Once the normalised indicator scores are established, the assignment of indicator
weighting and category aggregate is carried out. The procedures for assigning
indicator weighting and category aggregate involve various techniques and this study
applies the budget allocation process (BAP), which totally relies on expert opinion
and judgement (Nardo et. al., 2005). The expert respondents are selected from diverse
backgrounds in the built environment – academicians, practitioners and planners in
state and local government agencies, both from Malaysia and abroad. The assignment
of weighting and aggregate is conducted separately according to the respondent‘s
regional location in order to examine whether there are any differences in opinion and
judgement of the level of importance of indicators in contributing to sustainability.
The group mean of importance was calculated to generate the indicator weighting and
category aggregate between all experts, Malaysian experts only and international
experts only. The establishment of the normalised indicator scores, indicator
Page 203
Chapter 7 183
weighting and aggregate category is the principal task in development of framework
for measuring a sustainability composite index of development layouts.
This study applies two normalisation techniques and uses three groups of expert
respondents (all experts, Malaysians only, and international only), which created six
possible assessment frameworks for calculating the sustainability index of residential
neighbourhood development layouts (Table 7-2). The purpose of developing the six
possible frameworks in this research is to ascertain the most appropriate framework
for Malaysia. By selecting the most appropriate framework, this research ensures that
a reliable outcome of assessment on the sustainability levels of residential
development layouts in Malaysia can be obtained.
Table 7-2: Six frameworks derived from different combinations of development
techniques
Framework Normalisation
Technique
Expert group
A Categorical
All
B Categorical Malaysian
C Categorical International
D Above and below mean All
E Above and below mean Malaysian
F Above and below mean
International
Once the most appropriate assessment framework measuring the sustainability of
neighbourhood layouts has been selected, the second stage towards developing it into
a valid framework is to validate it. The validation procedure is vital in this research
because it helps to identify any possible sources of uncertainty which influence the
framework. The sources of uncertainty are examined based on the consistency of (a)
the expert respondents‘ opinion in assessing the sustainability of residential
neighbourhood layouts and (b) techniques used in normalisation and weightings. The
results show that both Malaysian and international experts are consistent in their
opinion and judgement in measuring residential neighbourhood development layouts
where both groups rank case study 3 (master-planned development) in first place, case
study 1 (sub-division development) the second place and case study 2 (piecemeal
development) the third place. Consistency is also found between the two
normalisation techniques.
Page 204
184 Chapter 7
The validation procedure continues with a sensitivity analysis to determine how
differences in the values associated with a normalised indicator score (independent
variable) affect the sustainability composite index (dependent variable) (Pannel,
1997). It is helpful in determining the uncertainty in the framework prediction through
variations in framework inputs (Lilburne & Tarantola, 2009). This study adopts the
sensitivity index (SI), which is based on the variations of the indicator input on the
variation of output (Chen, et al., 2010). The results demonstrate that the SI for the
categorical scale ranges from 0.8 to 1.0 where 10 indicators score 0.8 and eight
indicators score 1.0 (Figure 7-2). Meanwhile, the SI for the above and below mean
technique ranges from 0 to 2.0 where three indicators score 0, seven indicators score
1.2 and six indicators score 2.0.
Figure 7-2: Sensitivity index of two normalisation techniques
Looking at the above and below mean technique, three indicators (commercial
establishments, affordable housing and housing option diversity) score an SI of zero
and are found to be less sensitive, and therefore are less reliable to measure residential
development layouts. However, these three indicators are more sensitive and reliable
Page 205
Chapter 7 185
when used with the categorical scale technique. Thus, comparing between these two
techniques, this study finds that the categorical scale normalisation technique is more
appropriate for the development of the framework because all the indicators are
sensitive and reliable for measuring sustainability.
Therefore, taking into account the findings of uncertainty and sensitivity analyses, this
research suggests the framework that used the normalised indicator scores based on
category scale technique and incorporated with indicator weighting and category
aggregate based on a combination of expert respondents (both Malaysian and
international) as the most suitable to measure the sustainability composite index of
residential development layouts in Malaysia. The selected framework is called the
neighbourhood layout sustainability assessment (NLSA), as shown in Figure 7-3. The
framework shows the relationship among the indicator normalized score, indicator
weighting and aggregate category which contribute to the overall sustainability index.
Figure 7-3: The neighbourhood layout sustainability assessment (NLSA)
framework developed in this study
Page 206
186 Chapter 7
While acknowledging the view of Carmona and Sieh (2005, 2008) that the complexity
and multi-objective nature of planning has resulted in a few attempts being made to
conceptualise a performance measurement framework, concern for sustainability in
the built environment has made such framework an important element in measuring
sustainability. This research has shown that such quantitative-based measurement
framework is feasible and can have a practical application in local sustainability
efforts.
7.2.3 Application of the assessment framework to different types of
neighbourhood developments in order to determine their level of
sustainability
The third and final research objective is to test the framework on the three types of
residential development and to determine their level of sustainability. Based on the
literature description, master-planned development seems to offer the best option for
creating sustainable layouts. However since there is no previous studies to ascertain
this claim, this research has developed the neighbourhood layout sustainability
assessment (NLSA) framework (Figure 7-3). The framework can be used to validate
such claim by determining the sustainability level of not only master-planned
development but also other development types. This is achieved by calculating their
sustainability index. The relationship between the indicator normalized score,
indicator weighting and aggregate category that contributes to the sustainability index
is shown using the equation below:
Sustainability composite index (SCI)=
where k=indicator, t=indicator category, a=indicator normalised score of case
study, b= indicator weighting, and c= category aggregate score
Following application of the framework on the three case studies used in this research,
Table 7-3 shows a composite sustainability index and the order of ranking of the case
studies. The normalised indicator scores of 4 and 5 indicates higher sustainability,
score of 3 indicates acceptable sustainability while score of 1 and 2 indicates lower
sustainability level.
𝑎𝑘𝑏𝑘𝑐𝑡 𝑘 = 1,2,… ,18 𝑎𝑛𝑑 𝑡 = 1,2,3
𝑘 ,𝑡
Page 207
Chapter 7 187
Table 7-3: Sustainability composite index and rank between different types of residential neighbourhood development
Indicator (k) **Normalised indicator score (a) Indicator
weighting (b) Aggregate
category (c)
Indicator composite index
CS1* CS2* CS3* CS1 CS2 CS3
1. Land use mix 3 1 5 6.03
39.28
711 237 1184
2. Dwelling density 1 4 5 5.47 215 859 1074
3. Impervious surfaces 5 1 3 5.41 1063 213 638
4. Internal connectivity 3 1 5 6.06 714 238 1190
5. External connectivity 5 3 1 5.63 1106 663 221
6. Open space provision 4 1 5 6.22 977 244 1222
7. Non-motorised transport 1 4 5 5.97 235 938 1173
8. Access to public transport facilities 5 1 4 6.06
33.00
1000 200 800
9. Access to education facilities 2 1 5 5.97 394 197 985
10. Access to local services 2 1 5 5.66 374 187 934
11. Access to recreational space 5 1 5 5.84 964 193 964
12. Access to community centres 5 1 4 5.44 898 180 718
13. Access to emergency services 3 5 1 5.28 523 871 174
14. Crime prevention and safety 5 2 1 6.00 990 396 198
15. Traffic calming measures 2 1 5 5.34 352 176 881
16. Commercial establishment 1 5 5 5.50
27.72
152 762 762
17. Affordable housing 1 4 5 5.69 158 631 789
18. Housing option diversity 1 5 5 5.41 150 750 750
Sustainability composite index 10976 7935 14657
Rank 2 3 1
* CS1=Subdivision development, CS2=Piecemeal development, CS3=Master-planned development
**1=Very low; 2=Low; 3=Acceptable; 4=Good; and 5= Very good
Page 208
188 Chapter 7
7.2.4.1 Master-planned development
Based on the overall normalised indicator scores generated from spatial data analyses
as shown in Table 7-4, master-planned development (MPD) records a full score of 5
(very good) on 12 indicators, score of 4 (good) on two indicators, score of
3(acceptable) on one indicator and score of 1(very low) on three indicators. Looking
at the indicator sustainability levels, a good sustainability achieved by the MPD is due
to its high scores on 14 indicators, which involves large scale integrated housing
developments with mixed of land uses, dwelling density, internal connectivity, open
space provision, non-motorised transport, access to education facilities, access to local
services, access to recreational space, traffic calming measures, commercial
establishment, affordable housing, housing option diversity, access to public transport
facilities and access to community centres.
Table 7-4: Sustainability level of different indicators of the Master-planned
development
Indicator Indicator
normalised
score
Sustainability
level
1. Land use mix 5
High
2. Dwelling density 5
3. Internal connectivity 5
4. Open space provision 5
5. Non-motorised transport 5
6. Access to education facilities 5
7. Access to local services 5
8. Access to recreational space 5
9. Traffic calming measures 5
10. Commercial establishment 5
11. Affordable housing 5
12. Housing option diversity 5
13. Access to public transport facilities 4
14. Access to community centres 4
15. Impervious surfaces 3 Acceptable
16. External connectivity 1
Low 17. Access to emergency services 1
18. Crime prevention and safety 1
Page 209
Chapter 7 189
On the other hand, the MPD achieves low sustainability level at three indicators
namely, external connectivity, access to emergency services and crime prevention and
safety. Consistent with Gwyther (2005), the MPD concept should be consistently
promoted throughout the country not only because of its good sustainability but also
because it serves as ‗a mechanism of planning control over an entire project site,
underpinned by a particular vision for the completed development‘. Moreover,
sustainable residential design helps to shape strong characters, identity and perception
of a place, and create a distinctive MPD community, which is equally important for
market appeal.
The results from this study indicate that master-planned development is the most
sustainable neighbourhood in Malaysia compared to subdivision and piecemeal
developments. However, the result does not indicate in any way the degree to which
master-planned development layouts is better than the others. This is because the
research only seeks to identify which one of the three types of neighbourhood layouts
typically found in low rise residential developments in Malaysia is the most
sustainable. Having said that however, the finding provides justification to the policy
makers and built environment agencies to encourage more future residential
neighbourhoods to be developed based on the master-planned concept (Suen & Tang,
2002). This finding also justifies the claims by planners that such comprehensive
development of MPD by a single agent has the advantages of providing greater design
flexibility, better neighbourhood environments, exclusive open spaces, and
community facilities for the residents (Minnery & Bajracharya, 1999; Suen & Tang,
2002).
Another reason explaining the higher score of MPD lies in the stringent development
control mechanism that large scale developments, including residential MPD must
adhere to, in the form of an environmental impact assessment (EIA) and social impact
assessment (SIA) requirements. EIA and SIA reports are required for residential
development of more than 50 hectares. Due to its sheer size, MPD in Malaysia
generally fall within this category and are therefore subject to EIA and SIA approval
from the relevant ministries. As the reports need to justify that the proposed MPD
fulfils the criteria required of the reports, this helps explain why MPD is generally
Page 210
190 Chapter 7
well-developed compared to the smaller sized piecemeal and subdivision
developments.
7.2.4.2 Subdivision development
The results show that subdivision development (SDD) is ranked second, with
sustainability composite index of 10976. Based on the overall normalised indicator
scores generated from spatial data analyses as shown in Table 7-5, SDD records full
score of 5 (very good) on six indicators, score of 4 (good) on one indicators, score of 3
(acceptable) on three indicator, score of 2 (low) on three indicators and score of 1
(very low) on five indicators. The indicator sustainability levels indicate that SDD
achieves high sustainability on its 7 indicators comprising impervious surfaces,
external connectivity, access to public transport facilities, access to recreational space,
access to community centres, crime prevention and safety, and finally open space
provision.
Table 7-5: Sustainability level of different indicators of the subdivision development
Indicator Indicator normalised
score Sustainability level
1. Impervious surfaces 5
High
2. External connectivity 5
3. Access to public transport facilities 5
4. Access to recreational space 5
5. Access to community centres 5
6. Crime prevention and safety 5
7. Open space provision 4
8. Land use mix 3
Acceptable 9. Internal connectivity 3
10. Access to emergency services 3
11. Access to education facilities 2
Low
12. Access to local services 2
13. Traffic calming measures 2
14. Dwelling density 1
15. Non-motorised transport 1
16. Commercial establishment 1
17. Affordable housing 1
18. Housing option diversity 1
Page 211
Chapter 7 191
On the other hand, the SDD achieves low sustainability level due to lacking in access
to education facilities, access to local services, traffic calming measures, dwelling
density, non-motorised transport, commercial establishment, affordable housing and
housing option diversity. The results indicate that in the Malaysian scenario, SDD is
still regarded as having a fairly acceptable level of sustainability, especially in terms
of providing for common neighbourhood facilities and access to open space. This is
helped by its typically small parcel size configuration of 500 sqm, creating an average
density of over 14 dwellings per hectare (dph). Such size is lower than typical SDD
lots in the American or Australian examples (Minnery & Bajracharya, 1999;
Goodman & Douglas, 2008).
7.2.4.3 Piecemeal development
Results show that piecemeal development (PMD) scores third place with a composite
index of 7935. PMD records a full score of 5 (very good) on three indicators, score of
4 (good) on three indicators, score of 3(acceptable) on one indicator, score of 2 (low)
on one indicator and score of 1 (very low) on 10 (majority) indicators (Table 7-6).
Table 7-6: Sustainability level of different indicators of the piecemeal development
Indicator Indicator normalised
score Sustainability level
1. Access to emergency services 5
High
2. Commercial establishment 5
3. Housing option diversity 5
4. Dwelling density 4
5. Non-motorised transport 4
6. Affordable housing 4
7. External connectivity 3 Acceptable
8. Crime prevention and safety 2
Low
9. Land use mix 1
10. Impervious surfaces 1
11. Internal connectivity 1
12. Open space provision 1
13. Access to public transport
facilities 1
14. Access to education facilities 1
15. Access to local services 1
16. Access to recreational space 1
17. Access to community centres 1
18. Traffic calming measures 1
Page 212
192 Chapter 7
Looking at the indicator sustainability levels, the PMD achieves high sustainability on
access to emergency services, commercial establishment, housing option diversity,
dwelling density, non-motorised transport and affordable housing. However, the PMD
achieves low sustainability levels on a majority of its indicators (11) namely, crime
prevention and safety, land use mix, impervious surfaces, internal connectivity, open
space provision, access to public transport facilities, access to education facilities,
access to local services, access to recreational space, access to community centres and
traffic calming measures.
Within the Malaysian context, the development of residential neighbourhoods in a
piecemeal approach is not seen as desirable because it is considered as lacking in
overall planning of the neighbourhood that supports and influence sustainability. This
explains why the outcomes of the sustainability assessment among the three case
studies put piecemeal development in third place, after master-planned and
subdivision developments. This is in contrast with the literature findings from western
experience as argued by IBI Group (2011) that with a proper planning, piecemeal
development can become a well-functioning residential development and provide
opportunities for residents to live close to existing amenities and workplace as well as
providing better support for local commercial establishments.
7.3 Application of assessment framework within the Malaysian planning
system
7.3.1 The need for assessment framework
Even though sustainability issues and awareness at the international arena have been
around for nearly three decades, the local sustainability awareness and initiatives and
achievements in Malaysia still lag behind compared to the developed nations. This is
more apparent in the built environment field where most physical development takes
place. However, the existence of a structured development control practice and
mechanism in the country provides a potential avenue for introducing the
sustainability assessment framework in the country. The assessment framework will
not only complement the planning and development system in Malaysia but also
enhance the sustainability drive across the residential development sector, which
constitutes a large proportion of urban land use in the country.
Page 213
Chapter 7 193
7.3.2 Application at planning approval stage
Consistent with the urban planning and development process identified in Figure 2-6
in the literature, implementation of the neighbourhood layout sustainability
assessment (NLSA) framework can take place prior to development, or after
development has been completed and occupied. For implementation on new
development, the NSLA can be undertaken during planning approval stage of a new
residential planning layout (Figure 7-4). Once an application for residential
development is submitted, it is passed through the NSLA and evaluated by a planner.
If the outcome from the evaluation shows that the proposal achieves the sustainable
level set by the authority, the application will be taken to the next stage in the
approval process. If however the layout proposal does not meet the pre-set
sustainability requirement, it will be returned to the applicant for amendments based
on the planner‘s recommendations to meet the sustainability standard. Once the
amendments are completed and resubmitted, the sustainability assessment process is
repeated, until the application is either accepted or rejected.
Figure 7-4: Implementation of NSLA at planning approval stage
Page 214
194 Chapter 7
7.3.3 Application at post occupation stage
Another way of using the NSLA is to gauge the sustainability levels of existing,
completed and occupied neighbourhood developments. The purpose of undertaking
such assessment is to identify the extent to which existing neighbourhood
developments meet the sustainability requirements as envisaged in the framework. If
the NSLA is to be implemented after development has been completed and occupied,
then it should follow the flowchart as shown in Figure 7-5. This is a straightforward
process whereby the assessment is conducted based on the neighbourhood layouts
which have actually been developed on the ground. Compliance with sustainability
evaluation characteristics means such projects are contributing towards the long term
vision of creating a sustainable residential development. On the other hand, existing
layouts or projects which are judged as unsustainable or non-compliant to the
sustainability assessment will be subject to a re-evaluative process, which may require
retrofitting where applicable to ensure they fulfil the sustainability assessment criteria.
Figure 7-5: Implementation of NSLA at post completion / occupation stage
Page 215
Chapter 7 195
7. 4 Summary of findings
7.4.1 Case study findings
Within the Malaysian context, the findings from the case studies have demonstrated
master-planned residential development (MPD) as the most sustainable followed by
subdivision (SDD) and piecemeal (PMD) development. This has been justified by the
ranking as well as the indicator‘s composite index score. This provides justification
for the policy makers and built environment agencies to encourage more future
residential neighbourhoods to be developed based on the master-planned concept.
This finding also justifies the claims by planners that such comprehensive
development of MPD by a single agent has the advantages of providing greater design
flexibility, better neighbourhood environments, exclusive open spaces, and
community facilities for the residents (Minnery & Bajracharya, 1999; Suen & Tang,
2002).
The concept of MPD in Malaysia is still new but the continuing national economic
growth has encouraged its development. Although MPD scores a high overall
sustainability ranking, there is still room for improvement to increase its sustainability
further. For example, the MPD can learn from SDD experience especially with regard
to the provision of external connectivity, crime prevention and safety, and access to
emergency services.
With regard to the development of residential neighbourhoods in a piecemeal
approach, a new innovative strategy is needed to improve its sustainability level. The
findings show it is not seen as a desirable development and attention needs to be given
to the issue of lacking in overall planning of the neighbourhood that supports
sustainability. Particular attention needs to be given especially on crime prevention
and safety, land use mix, impervious surfaces, internal connectivity, open space
provision, access to public transport facilities, access to education facilities, access to
local services, access to recreational space, access to community centres and traffic
calming measures.
Page 216
196 Chapter 7
7.4.2 Overall findings
The development of the NSLA framework has bridged the gaps highlighted earlier
this research which is to examine or to ascertain which of the three residential
development layouts (master-planned, subdivision or piecemeal developments) is
more sustainable. Not only it provides an opportunity for evaluating the sustainability
levels of neighbourhood development layouts in Ipoh City Council areas, which are
well-known for its low-rise residential developments, the framework also has a great
potential to be applied in neighbourhood layouts of similar nature in other local
authority areas in Malaysia. Such application is feasible as long as it takes into
account any possible variations in the local planning guidelines currently in force in
these areas. This flexibility paves the way for a nationwide application of the
framework to gauge the sustainability levels of these neighbourhood layouts at a
national level. Such information will provide an awareness of the level of
sustainability of each neighbourhood, facilitate a comparison of sustainability over
time for neighbourhoods, provide continuous monitoring and assessment, and guide
policy makers and environment agencies in their decision making process to improve
the sustainability further.
The integrative aspects of sustainability indicators are seen as a powerful way to
portray the link between environmental, social and economic dimension of
sustainability. This link can also be shown by combining these indicator dimensions
into a composite figure. Following the guidelines by Nardo et al. (2005), the research
has managed to design methods and calculations for generating the composite
indicator score. It must be noted however that there are difficulties which need to be
overcome before the indicators can be combined into a single number. These include
giving weightings to the individual indicators, normalising the different measurement
units, and aggregation issues.
This research reveals that there is a lack of sustainability assessment mechanism
targeted at local level of planning, including assessment on neighbourhood
sustainability. This deficiency has led to the investigation of a possible indicator-based
framework to measure the sustainability of residential neighbourhood layouts. The
final 18 indicators identified through the three-round Delphi process in this study have
provided an important input for the proposed assessment framework. It reflects a
Page 217
Chapter 7 197
sound indicator set due to the nature of its selection process by those who are
knowledgeable in their field of studies. The selection process reveals the useful
contribution of the Delphi technique in areas such as the research, where concrete and
complete information about the most suitable set of neighbourhood sustainability
assessment indicators are not known.
7.5 Implications of the research
The implications of this research are in terms of both the theoretical and practical
aspects. A review of the literature highlights the awareness to promote sustainability
levels, however, there have been limited research conducted to investigate the
sustainability of residential development layouts. This research makes a contribution
to the body of knowledge by identifying specific indicators for measuring the level of
sustainability of residential development layouts. In addition, the findings from this
research have added to the existing body of knowledge concerning the level of
sustainability of subdivision developments, piecemeal developments and master-
planned developments. Thus, this research validates the view that master-planned
developments are more sustainable compared to subdivision and piecemeal
developments. Generally, this research does not only extend the literature on
sustainability but also provides a new perspective in assessing the level of
sustainability for residential layouts.
This research contributes practically through the development of a neighbourhood
sustainability assessment framework, which is relatively new, particularly in
Malaysia. This framework helps to provide policy makers and development agencies
with useful guidance to evaluate and determine the level of sustainability of
neighbourhood developments. The framework can also facilitate sustainability
comparisons over time concerning the neighbourhoods as a means to monitor changes
in the level of sustainability, and, whether it heads towards a better level or otherwise.
Thus, the results generated from this framework are expected to provide evidence for
the policy makers and development agencies and develop an awareness of the level of
sustainability, which needs collective effort towards developing a sustainable
neighbourhood.
Page 218
198 Chapter 7
The framework also has a huge potential for helping to promote sustainable planning
of physical developments at local level, which currently is still limited. The proposal
to include the assessment framework into the existing planning and development
control mechanisms within the local planning authority represents a noble approach to
introduce sustainability elements within the local planning system. This is a huge
challenge because it involves not only legal consideration but also acceptance of the
sustainability drive within the local community.
7.6 Limitations and recommendations for future research
The first limitation is that this research covers only three sustainability categories
(environmental, social and economic) because it only measures neighbourhood
layouts using spatial data. The literature, however, also highlights the increasing
importance of the institutional dimension in sustainability measurement. Therefore, it
is recommended that future research should also include this institutional domain in
the assessment of sustainability. However, this would be time consuming to undertake
because the institutional dimension involves considerable non-spatial data from
interviews, content analyses and document study. Due to these technical difficulties, it
is recommended that such a study be undertaken periodically.
The second limitation is that during the development of the framework, the study used
two normalisation techniques. This option limits the possibility of testing the
framework against various testing scenarios. Therefore, future research should extend
this study using similar indicators but including various other normalisation
techniques. Such approach will increase the possible testing scenarios and hence
provide a rich comparison between scenarios.
The third limitation is that the case studies in this research are limited to one local
authority in Malaysia. Therefore, it limits generalisation to within that particular local
authority context. Even any generalisation to other local authority areas in different
states in Malaysia should take into account the possible differences in the guidelines
of the local authorities in question. This is because all matters pertaining to land fall
under the particular state‘s prerogative. Future studies should look into these possible
differences and refine the framework to accommodate for a generalisation within the
Malaysian context. In addition, the framework can also be applied at the international
Page 219
Chapter 7 199
level with case studies selected from various countries to enable international
comparisons in terms of the achievement of sustainability levels.
7.7 Conclusion
To summarise, this research has established three main findings in relation to the
objectives which underpin this research. First, the research has generated the 18 key
indicators for use in evaluating the level of sustainability of neighbourhood layouts.
The generation of these indicators within the three sustainability categories has
answered the first research objective, that is, to identify environmental, social and
economic indicators that can be used to evaluate the level of sustainability of
neighbourhood layouts. Second, the research has established indicator weightings and
category aggregate to be incorporated into the assessment framework. It has also
managed to select and validate the most suitable sustainability assessment framework
for use in Malaysia by subjecting all potential frameworks to the normalisation
techniques and uncertainty and sensitivity analysis. These procedures and
achievements have answered the third research objective, that is, to develop a valid
assessment framework based on the indicators identified for measuring the level of
sustainability of neighbourhood layouts. Third, using case studies of different
neighbourhood types, the framework reveals that master-planned development
achieves a higher level of sustainability in terms of its layout design compared to
piecemeal development and subdivision development. This finding has successfully
answered the third and final research objective, that is, to apply the assessment
framework to different types of neighbourhood developments in order to determine
their level of sustainability.
The findings of the study show that the framework developed in this study provides
necessary guidance to quantify the level of sustainability of neighbourhood
developments at the layout stage. Importantly, the output from the assessment will
provide an insight into the level of sustainability of a particular neighbourhood
development. More importantly, it can be used to support responsible decisions of
development agencies and policymakers in mitigating and improving the level of
sustainability of existing neighbourhood developments and any future development
before it commences.
Page 220
200 Chapter 7
This research has demonstrated the value of the Delphi study and GIS analysis as
potential tools for generating important sustainability indicators and helped in
generating indicator scores. While the specific example given in this research is for
assessing the level of sustainability of neighbourhood layouts in one local authority
area in one state, this research has shown a path that can be replicated in other
neighbourhood developments in other states in Malaysia, subject to changes to suit
local planning standards and guidelines. The framework may even be replicated in
other countries, albeit subject to modification to the types of indicator and weighting
deemed important in the respective country.
Page 221
Bibliography 201
Bibliography
Adams, D. (1994). Urban planning and the development process. London: Routledge.
Adler, M., & Ziglio, E. (1996). Gazing into the oracle: The Delphi method and its
application to social policy and public health. London: Jessica Kingsley
Publishers.
AMCORD. (1997). A national resource document for residential development.
Canberra: Commonwealth of Australia.
Arendt, R. (2004). Linked landscapes: Creating greenway corridors through
conservation subdivision design strategies in the northeastern and central
United States. Landscape and Urban Planning, 68(2-3), 241-269.
Aurand, A. (2010). Density, housing types and mixed land use: Smart tools for
affordable housing. Urban Studies, 47(5), 1015-1036.
Aurbach, L. (2005). TND design ratings standards: Version 2.2. Retrieved August
19, 2010, from http://www.tndtownpaper.com
Austin, M. (2004). Resident perspectives of the open space conservation subdivision
in Hamburg Township, Michigan. Landscape and Urban Planning, 69, 245-
253.
Babbie, E. (2005). The basics of social research (Third ed.). Belmont, Ca: Thompson
Wadsworth.
Babbie, E. (2008). The Basics of Social Research (Fourth ed.). California: Thompson
Higher Education.
Baker, T. (1999). Doing Social Research (Third ed.). Boston: McGraw-Hill.
Bakhtiar, B., & Ibrahim, R. (2007). Identifying affordable quality housing components
for developing a Smart Growth model. International Journal of Sustainable
Tropical Design Research & Practice, 2(1), 41-48.
Barrett, S., Stewart, M., & Underwood, J. (1978). The land market and the
development process Occasional Paper 2: School for Advanced Urban
Studies, University of Bristol.
Barton, H. (2009). Land use planning and health and well-being. Land Use Policy,
26(Supplement 1), S115-S123.
Basinger, R. (2009). Competencies for a United States Horticulture undergraduate
major: A national Delphi study. HortTechnology, 19(2), 452-458.
Page 222
202 Bibliography
Beattie, A., Hek, G., Ross, K., & Galvin, K. (2004). Future career pathways in nursing
and midwifery: A Delphi survey of nurses and midwives in South West
England. NT Research, 9(5), 348-364.
Bebbington, J., & Gray, R. (2001). An account of sustainability: Failure, success and
reconceptualisation. Critical Perspective on Accounting, 12, 557-605.
Becker, J. (2004). Making sustainable development evaluations work. Sustainable
Development, 12(4), 200-211.
Becker, J. (2005). Measuring progress towards sustainable development: An
Ecological framework for selecting indicators. Local Environment, 10(1), 87-
101.
Bell, S., & Morse, S. (2003). Measuring sustainability: Learning by doing. London:
Earthscan.
Bell, S., & Morse, S. (2008). Sustainability: Measuring the immeasurable. London:
Earthscan.
Benfield, E. (1955). Note on conceptual scheme. In M. Meyersen & E. Benfield
(Eds.), Politics, planning and the public interest (pp. 303-336). Glencoe: Free
Press.
Berg, P., & Nycander, G. (1997). Sustainable neighbourhoods—a qualitative model
for resource management in communities. Landscape and Urban Planning,
39(2-3), 117-135.
Berke, P., Godschalk, D., & Kaiser, E. (2006). Urban land use planning (Fifth ed.).
Chicago: University of Illinois Press.
Biehl, D. (1986). The contribution of infrastructure to regional development: Final
report the Commission of the European Communities. Luxembourg: Office for
Official Publications of the European Communities.
Bigotte, J., & Antunes, A. (2007). Social infrastructure planning: A location model
and solution methods. Computer-Aided Civil and Infrastructure Engineering,
22(8), 570-583.
Blaike, N. (2000). Designing social research: The logic of anticipation. Maden, MA:
Blackwell Publishers Inc.
Blair, J., Fisher, M., Prasad, D., Judd, B., Soebarto, V., Hyde, R., et al. (2003).
Affordability and sustainability outcomes of 'greenfield' suburban development
and master-planned communities - A case study approach using triple bottom
line assessment. Melbourne: Australian Housing and Urban Research Institute
(AHURI).
Blakely, E., & Snyder, M. (1997). Fortress America: Gated communities in the United
States. Washington DC.
Page 223
Bibliography 203
Blumenthal, D., & Martin, E. (2007). Urban sustainable development, lower income
communities, and transorganizational public administration. International
Journal of Public Administration, 30(1), 95 - 107.
Boer, R., Zheng, Y., Overton, A., Ridgeway, G., & Cohen, D. (2007). Neighbourhood
design and walking trips in ten U.S. metropolitan areas. American Journal of
Preventive Medicine, 32(4), 298-304.
Bowman, T., Thompson, J., & Colletti, J. (2009). Valuation of open space and
conservation features in residential subdivisions. Journal of Environmental
Management, 90(1), 321-330.
Boyd, B. (2003). Identifying competencies for volunteer administrators for the coming
decade: A national Delphi study. Journal of Agricultural Education, 44(4), 47-
56.
Brabec, E. (2009). Imperviousness and land-use policy: Toward an effective approach
to watershed planning. Journal of Hydrologic Engineering, 14(4), 425-433.
Brabec, E., Schulte, S., & Richards, P. (2002). Impervious surfaces and water quality:
A review of current literature and its implications for watershed planning.
Journal of Planning Literature, 16(4), 499-514.
Brandon, P., & Lombardi, P. (2005). Evaluating sustainable development in the built
environment. Victoria: Blackwell Science.
Brill, J., Bishop, M., & Walker, A. (2006). The competencies and characteristics
required of an effective project manager: A web-based Delphi study.
Educational Technology Research and Development 54(2), 115-140.
Brown, B., Yamada, I., Smith, K., Zick, C., Kowaleski-Jones, L., & Fan, J. (2009).
Mixed land use and walkability: Variations in land use measures and
relationships with BMI, overweight, and obesity. Health & Place, 15(4), 1130-
1141.
Brown, N., Crawford, I., Carley, S., & Mackway-Jones, K. (2006). A Delphi-based
consensus study into planning for biological incidents. Manchester: Faculty of
Public Health.
Bruton, M. (2007). Malaysia: Planning of a nation. Kuala Lumpur: Persada.
Bryman, A. (2004). Social research methods (2nd ed.). New York: Oxford University
Press.
Bryman, A. (2006). Integrating quantitative and qualitative research: how is it done?
Qualitative Research, 6(1), 97-113.
Bryman, A., & Cramer, D. (2001). Quantitative data analysis with SPSS Release 10
for Windows: A guide for social scientists. London: Routledge.
Page 224
204 Bibliography
Camagni, R. (1998). Sustainable urban development: definition and reasons for a
research programme. International Journal of Environment and Pollution,
10(1), 6-27.
Campbell, S. (2003). Green cities, growing cities, just cities? Urban planning and the
contradictions of sustainable development. In S. Campbell & S. Fainstein
(Eds.), Readings in planning theory (pp. 435-458). Malden: Blackwell
Publishing.
Carmona, M., & Sieh, L. (2005). Performance measurement innovation in English
planning authorities. Planning Theory & Practice, 6(3), 303-333.
Carmona, M., & Sieh, L. (2008). Performance measurement in planning - towards a
holistic view. Environment and Planning C: Government and Policy, 26(2),
428-454.
Cauwenbergh, V., K., B., C., B., Brouckaert, V., Franchois, L., Cidad, V., et al.
(2007). SAFE - A hierarchical framework for assessing the sustainability of
agricultural systems. Agriculture, Ecosystems and Environment, 20, 229-242.
Chen, Y., Yu, J., & Khan, S. (2010). Spatial sensitivity analysis of multi-criteria
weights in GIS-based land suitability evaluation. Environmental Modelling
and Software, 25(12), 1582-1591.
Choguill, C. (1996). Ten steps to sustainable infrastructure. Habitat International,
20(3), 389-404.
Choguill, C. (2008). Developing sustainable neighbourhoods. Habitat International,
32(1), 41-48.
Christchurch City Council. (2003). Triple bottom line measures (financial plan and
programme 2003). Retrieved 20th January, 2009, from
http://archived.ccc.govt.nz/annualplan/2003/triplebottomline/
Clark, M. (2001). Domestic futures and sustainable residential development. Futures,
33(10), 817-836.
Clarke, G. (1995). Re-appraising the urban planning process as an instrument for
sustainable urban development and management. In A. C. Mosha (Ed.), A
reappraisal of the urban planning process. New York: UN Habitat.
Coffman, M., & Umemoto, K. (2010). The triple-bottom-line: Framing of trade-offs in
sustainability planning practice. Environment, Development and Sustainability,
12(5), 597-597-610.
Cohen, D., Sehgal, A., Williamson, S., Golinelli, D., Lurie, N., & McKenzie, T.
(2007). Contribution of public parks to physical activity. American Journal of
Public Health, 97(3), 509-514.
CNU (Congress of New Urbanism). (2002). Charter of the new urbanism. Retrieved
20th November, 2009, from http://www.cnu.org/cnu_reports/Charter.pdf
Page 225
Bibliography 205
Costley, D. (2006). Master-planned communities: Do they offer a solution to urban
sprawl or a vehicle for seclusion of the more affluent consumers in Australia?
Housing, Theory and Society, 23(3), 157-175.
Cramer, C., Klasser, G., Epstein, J., & Sheps, S. (2008). The Delphi process in dental
research. Journal of Evidence Based Dental Practice, 8(4), 211-220.
Creswell, J. (2009). Research design: qualitative, quantitative, and mixed methods
approaches (3rd ed. ed.). Thousand Oaks: Sage Publications.
Creswell, J., & Plano Clark, V. (2007). Designing and conducting mixed methods
research. Thousand Oaks, California: Sage Publications.
Creswell, J. W., & Plano Clark, V. L. (2011). Designing and conducting mixed
methods research. Thousand Oaks: SAGE Publications.
Criterion Planners. (2011). Index PlanBuilder planning support system: Indicator
dictionary. Retrieved 20th June, 2011, from
http://www.crit.com/documents/indicatordictionary.pdf
Cutts, B., Darby, K., Boone, C., & Brewis, A. (2009). City structure, obesity, and
environmental justice: An integrated analysis of physical and social barriers to
walkable streets and park access. Social Science & Medicine, 69(9), 1314-
1322.
Czinkota, M., & Ronkainen, I. (2005). A forecast of globalization, international
business and trade: report from a Delphi study. Journal of World Business,
40(2), 111-123.
Dale, A. (2001). At the edge. Vancouver: UBC Press.
Dalkey, N. (1972). The Delphi Method: An experimental study of group opinion. In
N. Dalkey, D. Rourke, R. Lewis & D. Snyder (Eds.), Studies in the quality of
life: Delphi and decision-making (pp. 13-54). Toronto: Lexington Books.
Dawes, S., Pardo, T. Simon, S., Cresswell, A., LaVigne, M., Andersen, D., et al.,
(2004). Making smart IT choices: Understanding value and risk in government
IT investments, Center for Technology in Government, University of Albany.
Deakin, M., Curwell, S., & Lombardi, P. (2002). Sustainable urban development: the
framework and directory of assessment methods. Journal of Environmental
Assessment Policy and Management, 4(2), 171-197.
Dempsey, N. (2008). The social dimension of sustainable development: Defining
urban social sustainability Sustainable Development, 1-12.
Department of Statistics. (2000). Population and housing census of Malaysia 2000.
Kuala Lumpur: Department of Statistics Malaysia.
Department of Statistics. (2010). Population and housing census of Malaysia 2010.
Kuala Lumpur: Department of Statistics Malaysia.
Page 226
206 Bibliography
DETR. (1998). Sustainability counts. London: Department of the Environment,
Transport and Regions.
deVaus, D. (2001). Research design in social research. London: Sage Publications.
Dill, J. (2004). Measuring network connectivity for bicycling and walking. Paper
presented at the 83rd Annual Meeting of the Transportation Research Board,
Washington DC.
Dobbins, T. (1999). Clinical experiences for agricultural teacher education programs
in North Carolina, South Carolina, and Virginia. Unpublished doctoral thesis.
Virginia Polytechnic Institute and State University.
Dresner, S. (2008). The Principles of Sustainability (Second ed.). London: Earthscan.
DTCP (Department of Town and Country Planning). (1995). Planning standards and
guidelines. Kuala Lumpur: Ministry of Housing and Local Government.
DTCP (Department of Town and Country Planning). (2003). Planning guidelines:
Optimum layout for housing areas. Kuala Lumpur: Ministry of Housing and
Local Government.
DTCP (Department of Town and Country Planning). (2005). National Physical Plan.
Kuala Lumpur: Ministry of Housing and Local Government.
DTCP (Department of Town and Country Planning). (2006). Guidelines for the
development of affordable housing schemes. Kuala Lumpur: Ministry of
Housing and Local Government.
DTCP (Department of Town and Country Planning). (2010a). 2nd National Physical
Plan. Kuala Lumpur: Ministry of Housing and Local Government.
DTCP (Department of Town and Country Planning). (2010b). Gated community and
guarded neighbourhood. Kuala Lumpur: Ministry of Housing and Local
Government.
Dusenbury, P. (2000). Strategic planning and performance measurement. Washington
DC: The Urban Institute.
Edwards, B. (2000). Sustainable Housing: Architecture, Society and Professionalism.
In B. Edwards & D. Turrent (Eds.), Sustainable Housing: Principles and
practice. London: E & F Spoon.
Edwards, W. (1982). Multiattribute evaluation. Beverly Hills, CA: Sage Publications.
Ekins, P. (2000). Economic growth and environmental sustainability: The prospects
for green growth. New York: Routledge.
Elkington, J. (1998). Cannibals with forks: The triple bottom line of the 21st century.
Gabriola: New Society Publisher.
Page 227
Bibliography 207
EPU (Economic Planning Unit). (1999). Malaysian Quality of Life Index.
Government Printer, Kuala Lumpur.
EPU (Economic Planning Unit). (2002). Malaysian Quality of Life Index.
Government Printer, Kuala Lumpur
Ewing, R., & Handy, S. (2009). Measuring the unmeasurable: Urban design qualities
related to walkability. Journal of Urban Design, 14(1), 65-84.
Fahy, F., & Ó Cinnéide, M. (2007). Developing and testing an operational framework
for assessing quality of life. Environmental Impact Assessment Review, In
Press, Corrected Proof.
Farris, T. (2001). The barriers to using urban infill development to achieve smart
growth. Housing Policy Debate, 12(1), 1-30.
Fleissig, W., & Jacobsen, V. (2002). Smart Scorecard for developing projects.
Retrieved 12 January, 2010, from http://www.cnu.org/cnu_
reports/Scorecard_exp.pdf
Foster, S., Giles-Corti, B., & Knuiman, M. (2010). Neighbourhood design and fear of
crime: A social-ecological examination of the correlates of residents' fear in
new suburban housing developments. Health & Place, 16(6), 1156-1165.
Frame, B., & Vale, R. (2006). Increasing uptake of low impact design and
development: the role of sustainability assessment systems. Local
Environment: The International Journal of Justice and Sustainability, 11, 287-
306.
Frank, D. (2004). Economic determinants of urban form: resulting trade-offs between
active and sedentary forms of travel. American Journal of Preventive
Medicine, 27, 146-153.
Frank, L., Andresen, M., & Schmid, T. (2004). Obesity relationships with community
design, physical activity, and time spent in cars. American Journal of
Preventive Medicine, 27(2), 87-96.
Friedman, A. (2005). Sustainable residential development: Planning and design for
green neighbourhoods. Washington: Island Press.
Frowein, H., Folstad, A., & Schliemann, T. (2004). Applying Multi-Attribute Utility
Technique to assess alternative communication media. Proceedings of the
human factors and ergonomics society annual meeting, New York: Sage
Publication.
Garde, A., Saphores, J.D., Matthew, R., & Day, K. (2010). Sustainable neighbourhood
development: missed opportunities in Southern California. Environment and
Planning B: Planning and Design, 37, 387-407.
Page 228
208 Bibliography
Giles-Corti, B., Macintyre, S., Clarkson, J., Pikora, T. J., & Donovan, R. (2003).
Environmental and lifestyle factors associated with with overweight and
obesity in Perth, Australia. American Journal of Health Promotion, 18(1), 93-
102.
Giles-Corti, B., Timperio, A., Cutt, H., Pikora, T., Bull, F., Knuiman, M., et al.
(2006). Development of a reliable measure of walking within and outside the
local neighborhood: RESIDE's Neighborhood Physical Activity Questionnaire.
Preventive Medicine, 42(6), 455-459.
Girling, C., & Kellett, R. (2005). Skinny streets and green neighbourhoods: Design
for environment and community. Washington DC: Island Press.
Goh, B. (1988). The future of urban planning in Malaysia. Habitat International,
12(4), 5-12.
Goodman, R. (2008). The truth about sustainability. Planning, 74(5), 12-15.
Goodman, R., & Douglas, K. (2008). Privatised communities: The use of owners
corporations in master-planned estates in Melbourne. Australian Geographer,
39(4), 521-536.
Gore, T., & Nicholson, D. (1991). Models of the land development process: A critical
review. Environment and Planning A, 23(5), 705-730.
Government of Malaysia. (1966). Housing Developers and Control Act. Kuala
Lumpur: Ministry of Housing and Local Government.
Grant, J. (2004). Sustainable urbanism in historical perspective. In A. Sorensen, P. J.
Mrcotullio & J. Grant (Eds.), Towards sustainable cities: East Asian, North
American and European Perspectives on Managing Urban Regions (pp. 24-
37). Aldershot: Ashgate.
Green, E., & Champion, A. (1991). The booming town studies: methodological issues.
Environment and Planning A, 23, 1393-1408.
Green, L., & Kreuter, M. (1999). Health Promotion Planning: An Educational and
Environmental Approach. Mountain View, CA: Mayfield.
Grisham, T. (2009). The Delphi technique: a method for testing complex and
multifaceted topics. International Journal of Managing Projects in Business,
2(1), 112-130.
Gupta, U., & Clarke, R. (1996). Theory and applications of the Delphi technique: A
bibliography (1975-1994). Technological Forecasting and Social Change,
53(2), 185-211.
Gwyther, G. (2005). Paradise planned: Community formation and the master-planned
estate. Urban Policy and Research, 23(1), 57 - 72.
Page 229
Bibliography 209
Haas, L., Brunvoll, F., & Hoie, H. (2002). Overview of sustainable development
indicators used by national and international agencies: OECD.
Hacking, T., & Guthrie, P. (2008). A framework for clarifying the meaning of triple
bottom-line, integrated, and sustainability assessment. Environmental Impact
Assessment Review, 28(2–3), 73-89.
Hak, T., Moldan, B., & Dahl, A. (2007). Sustainability indicators: A scientific
assessment. Washington DC.
Hajkowicz, S. (2005). Evaluating natural resource management investment
performance with multi-attribute utility theory. In J. Bellamy (Eds.), Regional
Natural Resource Management Planning: the challenges of evaluation as seen
through different lenses, Occasional Symposium Monograph Series, CSIRO,
Department of Natural Resources and Mines.
Halcomb, E., Andrew, S., & Brannen, J. (2009). Introduction to mixed methods
research for Nursing and the Health Sciences. In S. Andrew & E. Halcomb
(Eds.), Mixed methods research for nursing and the health sciences (pp. 1-12).
Ames, Iowa: Blackwell Publishing.
Halme, M., Anttonen, M., Hrauda, G., & Kortman, J. (2006). Sustainability evaluation
of European household services. Journal of Cleaner Production, 14, 1529-
1540.
Hamby, D. (1994). A review of techniques for parameter sensitivity: Analysis of
environmental models. Environmental Monitoring and Assessment, 32, 135-
154.
Handy, S., & Clifton, K. (2001). Local shopping as a strategy for reducing automobile
travel. Transportation, 28(4), 317-346.
Hardi, P., Barg, S., Hodge, T., & Pinter, L. (1997). Measuring sustainable
development: review of current practice. Ottawa: Industry Canada.
Harrison, J. (2005). Future attributes and job competencies needed by the Texas
Department of State Health Services (DSHS), State Hospital Section,
registered nurse managers: A Delphi study. Unpublished doctoral thesis. Texas
A&M University.
Hart, M. (2006). Guide to Sustainable Community Indicators (Second ed.). Hartford:
Sustainable Measures.
Hasson, F., Keeney, S., & McKenna, H. (2000). Research guidelines for the Delphi
survey technique. Journal of Advanced Nursing, 32(4), 1008-1015.
Hatry, P., Blair, L., & Fisk, M. (1977). How effective are your community services?
Procedures for monitoring the effectiveness of municipal services. Washington
DC: The Urban Institute.
Page 230
210 Bibliography
Healey, P. (2006). Collaborative Planning: Shaping places in fragmented society.
Hampshire: Pelgrave Macmillan.
Healy, G. N., Dunstan, D. W., Salmon, J., Cerin, E., Shaw, J. E., Zimmet, P. Z., et al.
(2008). Breaks in sedentary time. Beneficial associations with metabolic risk.
[10.2337/dc07-2046]. Diabetes Care, 31, 661-666.
Hemphill, L., Berry, J., & McGreal, S. (2004). An Indicator-based approach to
measuring sustainable urban regeneration performance: Part 1, conceptual
foundations and methodological framework. Urban Studies, 41(4), 725-755.
Hezri, A. (2004). Sustainability indicator system and policy processes in Malaysia: a
framework for utilisation and learning. Journal of Environmental
Management, 73(4), 357-371.
Hezri, A. & Hasan, M. (2006). Towards sustainable development? The evolution of
environmental policy in Malaysia. Natural Resources Forum, 30(1), 37-50.
HNEPH (Hunter New England Population Health). (2011). Gunnedah Liveable
Communities Assessment: Final Report: Hunter New England Population
Health. Retrieved 18 October, 2011, from http://www.hnehealth.nsw.gov.au/
_data/assets/pdf_file/0010/88669/Gunnedah_Liveable_Communities_Assessm
ent_Final_Report_22_Nov.pdf
Hoch, C. (2007). Making plans: Representation and intention. Planning Theory, 6(1),
16-35.
Hoehner, C., Brennan Ramirez, L., Elliott, M., Handy, S., & Brownson, R. (2005).
Perceived and objective environmental measures and physical activity among
urban adults. American Journal of Preventive Medicine, 28, 105-116.
Hoffman, F., & Gardner, R. (1983). Evaluation of uncertainties in environmental
radiological assessment models. In J. Till & H. Meyer (Eds.), Radiological
assessments: A textbook on environmental dose assessment. Washington DC.
Hopkins, L. (2001). Urban development: The logic of making plans. Washington:
Island Press.
Hopkins, L. (2012). Plan assessment: Making and using plans well. In R. Crane and R
Weber (Eds.), Oxford handbook of urban planning. New York: Oxford
University Press.
Houlahan, J., & Findlay, C. (2004). Estimating the ‗critical‘ distance at which adjacent
land-use degrades wetland water and sediment quality. Landscape Ecology,
19(6), 677-690.
Hung, H., Altschuld, J., & Lee, Y. (2008). Methodological and conceptual issues
confronting a cross-country Delphi study of educational program evaluation.
Evaluation and Program Planning, 31(2), 191-198.
Page 231
Bibliography 211
IBI Group. (2011). Small scale ground oriented residential infill. Smart choice for
developing our community Retrieved 20 December, 2011, from
http://webdocs.edmonton.ca/InfraPlan/SmartChoices/OnlineShowcaseIdea4Sm
allScaleGroundOrientedResidentialInfill.pdf
ICLEI (International Council for Local Environment Initiatives). (1996). Local
Agenda 21 planning guide. Toronto: ICLEI.
Innes, J., & Booher, D. (1999). Consensus building and complex system adaptive.
Journal of the American Planning Association, 65(4), 412-423.
Ipoh City Council. (2010). Ipoh draft local plan 2020: Executive summary. Kuala
Lumpur: Ipoh City Council.
Jabareen, Y. (2006). Sustainable urban forms: Their typologies, models, and concepts.
Journal of Planning Education and Research 26, 38-52.
Jairath, N., & Weinstein, J. (1994). The Delphi methodology: a useful administrative
approach. Canadian Journal of Nursing Administration. Canadian Journal of
Nursing Administration, 7, 29-42.
Jamaliah, J. (2004). Emerging trends of urbanisation in Malaysia. Statistics Malaysia,
1, 43-54.
Jasch, C. (2009). Environmental and material flow cost accounting: Principles and
procedures. Vienna: Springer.
Jenks, M., & Dempsey, N. (2007). Defining the neighbourhood: Challenges for
empirical research. The Town Planning Review, 78(2), 153.
Jeste, D., Ardelt, M., Blazer, D., & Meeks, T. (2010). Expert consensus on
characteristics of wisdom: A Delphi method study. Gerontologist, 50(5), 668-
680.
Jones, E. (2001). Liveable Neighbourhood. Paper presented at the Australia: Walking
the 21st Century.
Karol, E., & Brunner, J. (2009). Tools for measuring progress towards sustainable
neighbourhood environments. Sustainability, 1(3), 612-627.
Kavaliaukas, P. (2008). A concept of sustainable development for regional land use
planning: Lithuanian experience. Technological and Economic Development of
Technology, 14(1), 51-63.
KLCH (Kuala Lumpur City Hall). (2003). Kuala Lumpur Structure Plan 2020
(KLSP2020). Kuala Lumpur: Federal Town and Country Planning Department.
KLCH, (Kuala Lumpur City Hall). (2007). Kuala Lumpur City Plan 2020 (KL
CityPlan2020). Kuala Lumpur: Federal Town and Country Planning
Department.
Page 232
212 Bibliography
Kroll, T., & Neri, M. (2009). Design for mixed methods research. In S. Andrew & E.
Halcomb (Eds.), Mixed methods research for nursing and the health sciences
(pp. 31-49). Ames, Iowa: Blackwell Publishing.
Lafferty, W., & Eckerberg, K. (Eds.). (1998). From the Earth Summit to Local
Agenda 21: Working towards sustainable development. London: Earthscan.
Landeta, J., & Barrutia, J. (2011). People consultation to construct the future: A
Delphi application. International Journal of Forecasting, 27(1), 134-151.
Landeta, J., Barrutia, J., & Lertxundi, A. (2011). Hybrid Delphi: A methodology to
facilitate contributions from experts in professional contexts. Technological
Forecasting and Social Change, In Press, Corrected Proof.
Lawrence, D. (2000). Planning theories and environmental impact assessment.
Environmental Impact Assessment Review, 20, 607-625.
Lee, B. T. (1996). Emerging urban trends and the globalising economy in Malaysia. In
F.-C. Lo & Y.-M. Yeung (Eds.), Emerging World Cities in Pacific Asia. New
York: United Nations University Press.
Lee Lik, M. (1991). Town planning law in Malaysia: Politics, rights and jealousies.
Habitat International, 15(4), 105-114.
Lilburne, L., & Tarantola, S. (2009). Sensitivity analysis of spatial models.
International Journal of Geographical Information Science, 23(2), 151-168.
Listokin, D., & Walker, C. (2007). Infill development standards and policy guide.
New Jersey: Centre for Urban and Policy Research.
Lyle, J. (1985). Design for human ecosystems: Landscape, land use, and natural
resources. New York: Van Nostrand Reinhold.
Lyle, J. (1994). Regenerative design for sustainable development. New York: John
Wiley and Sons.
Lundberg, K., Balfors, B., & Folkeson, L. (2009). Framework for environmental
performance measurement in a Swedish public sector organization. Journal of
Cleaner Production, 17(11), 1017-1024.
Mackay, M. (2001). Which Suburbs Work: A comparison between traditionally
planned suburbs and conventional suburban development. Perth: Ministry of
Planning, WA.
Maclaren, V. (1996). Urban sustainability reporting. Journal of the American
Planning Association, 62(2), 184-202.
Malaysia Productivity Corporation. (2010). Productivity report 2009. Kuala Lumpur:
Malaysia Productivity Corporation.
Page 233
Bibliography 213
Marcotullio, P. (2004). Why the Asian urbanisation experience should make us think
differently about planning approaches. In A. Sorensen, P. J. Marcotullio & J.
Grant (Eds.), Towards sustainable cities: East Asian, North American and
European perspectives on managing urban regions (pp. 38-58). Aldershot:
Ashgate.
McGhee, T. (2008). Managing the rural-urban transformation in East-Asia in the 21st
century. Sustain Sci, (3), 155-167.
McGranahan, G., Jacobi, P., Songsore, J., Surjadi, C., & Kjellen, M. (2001). The
citizen at risk: from urban sanitation to sustainable cities. London: Earthscan.
McGuirk, P., & Dowling, R. (2009). Master-planned residential developments:
Beyond iconic spaces of neoliberalism? Asia Pacific Viewpoint, 50(2), 120-
134.
McHarg, I. (1969). Design with nature. Philadelphia: Natural History Press.
Ministry of Environment. (2001). Spatial planning as an instrument for promoting
sustainable development in the Nordic countries: Action programme for 2001–
2004. Copenhagen: Ministry of the Environment.
Minnery, J., & Bajracharya, B. (1999). Visions, planning process and outcomes:
master-planned communities in South East Queensland. Australian Planner,
35, 33-41.
Mitchell, V. (1991). The Delphi technique: an exposition and application. Technology
Analysis & Strategic Management, 3(4), 333 - 358.
Mog, J. (2004). Struggling with sustainability: A comparative framework for
evaluating sustainable development programmes. World Development, 32(12),
2139-2160.
Mohamed, E. (2002). Macro economic impact on urbanisation process in Malaysia.
Retrieved from http://www.asian-forum.net/conference/paper/08-
2002PaperMalaysia8EE.pdf
Moles, R., Foley, W., Morrissey, J., & O'Regan, B. (2008). Practical appraisal of
sustainable development - Methodologies for sustainability measurement at
settlement level. Environmental Impact Assessment Review, 28(2-3), 144-165.
Mori, K., & Christodoulou, A. (2012). Review of sustainability indices and indicators:
Towards a new City Sustainability Index (CSI). Environmental Impact
Assessment Review, 32(1), 94-106.
MOSTE (Ministry of Science, Technology and the Environment). (2002). National
policy on the environment. Kuala Lumpur: Ministry of Science, Technology
and the Environment.
Muoghalu, L. (1990). Measuring housing and environmental quality as indicator of
quality of urban life. Social Science & Medicine, 25(1), 63-98.
Page 234
214 Bibliography
Murphy, M., Black, N., Lamping, D., McKee, C., Sanderson, C., Askham, J., et al.
(1998). Consensus development methods and their use in clinical guideline
development. Health Technology Assessment, 2(3), 1-88.
NAPIC (National Property Information Centre). (2010). Property market report.
Kuala Lumpur: NAPIC.
Nardo, M., Saisana, M., Saltelli, A., & Tarantola, S. (2005). Tools for composite
indicators building. Ispra, Italy.
Nelson, A. (2006). Exploring a competency model for distributed learning leaders.
Unpublished doctoral thesis. Capella University.
Ness, B., Urbel-Piirsalu, E., Anderberg, S., & Olsson, L. (2007). Categorising tools
for sustainability assessment. Ecological Economics, 60(3), 498-508.
Neufeld, D., Cockfield, R., Fox, B., & Whitelaw, G. (1994). Towards an ecosystem
approach to land-use planning. Ontario: Ministry of Environment and Energy.
Neuman, L. (2006a). Social research methods: Qualitative and quantitative
approaches. New York: Pearson Education.
Niemela, J. (1999). Ecology and urban planning. Biodiversity and Conservation, 8,
119-131.
Odum, E. (1989). Ecology and our endangered life support systems. Massachusetts:
Sinauer Associates.
OECD (Organisation for Economic Co-operation and Development). (2001).
Environmental indicators: OECD Core Sets. Paris: OECD.
Olalla-Tárraga, M. (2006). A conceptual framework to assess sustainability in urban
ecological systems. International Journal of Sustainable Development and
World Ecology, 13(1), 1-15.
PAM (Persatuan Arkitek Malaysia). (2009). Green building index for residential new
construction. Kuala Lumpur: PAM.
Pannel, D. J. (1997). Sensitivity analysis of normative economic models: Theoretical
framework and practical strategies. Agricultural Economics, 16, 139-152.
Papargyropoulou, E., Padfield, R., Harrison, O., & Preece, C. The rise of
sustainability services for the built environment in Malaysia. Sustainable
Cities and Society (2012), http://dx.doi.org/10.1016/j.scs.2012.05.008
Patton, M. (1990). Qualitative evaluation and research methods, (Second ed.).
Newbury Park, California: Sage.
Pawar, K., & Driva, H. (1999). Performance measurement for product design and
development in a manufacturing environment. International Journal of
Production Economics, 60-61, 61-68.
Page 235
Bibliography 215
Pelchar, L., Morgan, P., Caldwell, M., Palmer, C., & Daily, G. (2007). Evaluating the
potential for conservation development: Biophysical, economic, and
institutional perspectives. Conservation Biology, 21(1), 69-78.
Pereira, J., Tiong, T., & Komoo, I. (2010). Mainstreaming climate change adaptation
and disaster risk reduction: A Malaysian approach. In R. Shaw, J. Pulhin & J.
Pereira (Eds.), Climate change adaptation and disaster risk reduction: An
Asian perspective (Vol. 5, pp. 147-167): Emerald Group Publishing.
Pickett, S., & Grooge, J. (2009). Urban ecosystems: What would Tansley do? Urban
Ecosystem, 12, 1-8.
Pike, A., Tomaney, J., & Rodrigues, A. (2006). Local and regional development.
London: Routledge.
Pikora, T., Giles-Corti, B., Bull, F., Jamrozik, K., & Donovan, R. (2003). Developing
a framework for assessment of the environmental determinants of walking and
cycling. Social Science & Medicine, 56, 1693-1703.
Pikora, T., Giles-Corti, B., Knuiman, M., Bull, F., Jamrozik, K., & Donovan, R.
(2006). Neighbourhood environmental factors correlated with walking near
home: Using SPACES. Medicine and Science in Sports and Exercise, 38(4),
708-714.
Pope, J., Annandale, D., & Morrison-Saunders, A. (2004). Conceptualising
sustainability assessment. Environmental Impact Assessment Review, 24(6),
595-616.
Powell, C. (2003). The Delphi technique: Myths and realities. Journal of Advanced
Nursing, 41(4), 376-382.
Priemus, H. (2005). How to make housing sustainable? The Dutch experience.
Environment and Planning B: Planning and Design, 32(1), 5-19.
Pulcini, J., Wilbur, J., Allan, J., Hanson, C., & Uphold, C. (2006). Determining
criteria for excellence in nurse practitioner education: Use of the Delphi
technique. Nursing Outlook, 54(2), 102-110.
Rainham, D., McDowel, I., & Krewski, D. (2008). A sense of possibility: What does
governance for health and ecological sustainability look like? In C. Soskolne
(Ed.), Sustaining life on earth: Environmental and human health through
global governance (pp. 171-193). Lanham: Lexington Books.
Redwood, T. (1994). Tree time. Planning, 60(9), 13-15.
Reid, N. (1988). The Delphi technique: its contribution to the evaluation of
professional practice. In R. Ellis (Ed.), Professional competence and quality
assurance in the caring professions (pp. 230-254). London: Chapman & Hall.
Riggs, W. (1983). The Delphi technique: An experimental evaluation. Technological
Forecasting and Social Change, 23, 89-94.
Page 236
216 Bibliography
Ross, N., Houle, C., Dunn, R., & Aye, M. (2004). Dimensions and dynamics of
residential segregation by income in urban Canada. The Canadian
Geographer, 48, 433-445.
Ross, N., Norbrega, K., & Dunn, J. (2002). Income segregation, income inequality and
mortality in North American metropolitan areas. GeoJournal, 53, 117-124.
Rowe, G., & Wright, G. (1999). The Delphi technique as a forecasting tool: Issues and
analysis. International Journal of Forecasting, 15(4), 353-375.
Rowe, G., Wright, G., & Bolger, F. (1991). Delphi: A re-evaluation of research and
theory. Technological Forecasting and Social Change, 39, 235-251.
Saadatian, O., Haw, C., Mat., S., & Sopian, K. (2012). Perspective of sustainable
development in Malaysia. International Journal of Energy and Environment,
6(2), 260-267.
Saville-Smith, K., Lietz, K., Bijoux, D., & Howell, M. (2005). Neighbourhood
sustainability framework: Prototype. Auckland: Beacon Pathway Limited.
Schmitz, A. (1998). New visions in community design. In Urban Land Institute. (Ed.),
Trends and innovations in master-planned communities (pp. 83-98).
Washington DC: Urban Land Institute.
Schonwandt, W. (2008). Planning in crisis? Theoretical orientations for architecture
and planning. Aldershot: Ashgate.
Scott, C. (2002). Competencies needed by business teachers to work with students
who have disabilities. Unpublished doctoral thesis. Virginia Polytechnic
Institute and State University.
Seibert, J. (2004). The identification of strategic management counselling
competencies essential for the small business and technology development
centre: A modified Delphi study. Unpublished doctoral thesis. North Carolina
State University.
Shellharbour City Council. (2004). Residential subdivision development control plan.
Retrieved 28 August 2009, from Shellharbour City Council:
http://www.shellharbour.nsw.gov.au/FileData/pdf/Residential_Subdivision_D
CP_Am_1.pdf
Skulmoski, G., Hartman, F., & Krahn, J. (2007). The Delphi method for graduate
research. Journal of Information Technology Education, 6, 1-21.
Soltani, A., Primerano, F., Allan, A., & Somenahalli, S. (2006). Design for movement:
linking non-work travel and activity level to local urban design dimensions.
Urban Design International, 11(3-4), 173-173-186.
Sproull, N. (1995). Handbook of research methods: A guide for practitioners and
students in the social sciences. New Jersey: Scarecrow Press.
Page 237
Bibliography 217
Steiner, F. (1991). The living landscape: An ecological approach to landscape
planning. New York: McGraw Hill.
Stone, B. (2003). Paving over paradise: How land use regulations promote residential
imperviousness. Landscape and Urban Planning, 69, 101-113.
Suen, W., & Tang, B. (2002). Optimal site area for high-density housing development.
Habitat International, 26(4), 539-552.
Sustainable Seattle. (1993). Indicators of sustainable community. Seattle: Sustainable
Seattle.
Taib, M., & Ho, C. (2008). Planning system in Malaysia. Paper presented at the
Seminar of sustainable development and governance. Universiti Teknologi
Malaysia.
Tan Loke Mun. (2009). The development of Green Building Index Malaysia (GBI).
GBI, 15, 1-8.
Teddlie, C., & Tashakkori, A. (2009). Foundations of mixed methods research:
integrating quantitative and qualitative approaches in the social and
behavioural sciences. Thousand Oaks: Sage Publications.
Teriman, S., Yigitcanlar, T., & Mayere, S. (2009). Urban sustainability and growth
management in South-East Asian city-regions: A comparative policy analysis
of Kuala Lumpur and Hong Kong. Journal of the Malaysian Institute of
Planners, 7, 47-68.
Teriman, S., & Yigitcanlar, T. (2011). Social infrastructure planning and sustainable
communities: Example from South East Queensland, Australia. World Journal
of Social Sciences, 1(4), 23-32.
Thorsnes, P. (2000). Internalizing neighbourhood externalities: The effect of
subdivision size and zoning on residential lot prices. Journal of Urban
Economics, 48(3), 397-418.
Tigelaar, D., Dolmans, D., Wolfhagen, I., & Vleuten, C. (2004). The development and
validation of a framework for teaching competencies in higher education.
Higher Education, 48(2), 253-268.
Turcotte, D. (2006). A framework for sustainable housing development in the United
States. Unpublished Thesis, University of Massachusetts, Amherst.
ULI (Urban Land Institute). (1998). Trends and innovations in master-planned
communities. Washington DC: ULI.
ULI (Urban Land Institute). (2003). The new shape of suburbia: Trends in residential
development. Washington DC: ULI.
UN-Habitat. (2010). Planning for climate change: A Strategic, values-based approach
for urban planners. Nairobi.
Page 238
218 Bibliography
UNCED (United Nations Conference on Environment and Development). (1992).
Earth Summit 92 (Agenda 21). London: UNCED.
UNCSD (United Nations Conference on Sustainable Development). (1996).
Indicators of sustainable development: Framework and methodologies. New
York: UNCSD.
UNDP (United Nations Development Programme). (2001). Human Development
Report: Making new technologies work for human development. New York:
UNDP.
United Nations. (2002). Johannesburg Declaration on Sustainable Development. New
York: United Nations Division on Sustainable Development.
USEPA (United States Environmental Protection Agency). (2002). Smart growth
INDEX: A sketch tool for community planning New York: USEPA.
USGBC (United States Green Building Council). (2009). LEED 2009 for
neighbourhood development. New York: USGBC.
Vasishth, A. (2008). A scale-hierarchic ecosystem approach to integrative ecological
planning. Progress in Planning, 70(3), 99-132.
Vaus, D. d. (2001). Research design in social research. London: Sage Publications
Ltd.
Veal, A. (2006). Research methods for leisure and tourism: A practical guide (Third
ed.). London: Prentice Hall.
Vidal, L., Marle, F., & Bocquet, J. (2011). Using a Delphi process and the Analytic
Hierarchy Process (AHP) to evaluate the complexity of projects. Expert
Systems with Applications, 38(5), 5388-5405.
Wachs, M. (2001). Forecasting versus envisioning: A new window on the future.
Journal of the American Planning Association, 67(4), 367-372.
Wallbaum, H., Krank, S., & Teloh, R. (2011). Prioritizing sustainability criteria in
urban planning processes: Methodology application. Journal of Urban
Planning & Development, 37(1), 20-28.
WCED (World Commission on Environment and Development). (1987). Our
Common Future. New York: Oxford University Press.
WHO (World Health Organisation). (1999). Towards a new planning process: A
guide towards reorienting urban planning towards Local Agenda 21. New
York: WHO.
Winston, N. (2009). Urban regeneration for sustainable development: The role of
sustainable housing? European Planning Studies 17(12), 1781-1796
Page 239
Bibliography 219
Winston, N. (2010). Regeneration for sustainable communities? Barriers to
implementing sustainable housing in urban areas. Sustainable Development,
18(6), 319-330.
Winston, N., & Eastaway, M. (2008). Sustainable housing in the urban context:
International sustainable development indicator sets and housing. Social
Indicators Research, 87(2), 211-221.
World Bank. (2002). Environmental indicators: An overview of selected indicators at
the World Bank. Washington: World Bank.
Wyatt, J. (2000). When to use web-based surveys. Journal of the American Medical
Informatics Association, 7, 426-430.
Yang, P., & Lay, O. (2004). Applying ecosystem concepts to the planning of
industrial areas: a case study of Singapore's Jurong Island. Journal of Cleaner
Production, 12(8-10), 1011-1023.
Yigitcanlar, T. & Dur, F. (2010). Developing a sustainability assessment model: the
sustainable infrastructure, land-use, environment and transport model.
Sustainability, 2, pp. 321-340.
Yigitcanlar, T., Dodson, J., Gleeson, B., & Sipe, N. (2007). Travel self containment in
master-planned estates: Analysis of recent Australian trends. Urban Policy and
Research, 25(1), 133-153.
Zakaria, R. (2007). Sustainable housing for residential-industrial neighbourhood in
Malaysia- A study on the indoor environmental quality in Malaysia.
Unpublished PhD, Queensland University of Technology, Brisbane.
Zakaria, R., & Yang, J. (2004). Smart and sustainable inhabitations in residential-
industrial neighbourhood. Paper presented at the International Engineering
Management Conference - Innovation and Enterpreneurship for Sustainable
Development, Singapore.
Page 241
Appendix A 221
Appendices
Appendix A
Letter of invitation to expert respondents
Dear (expert‘s name),
My name is Suharto Teriman and I am currently undertaking PhD study with Queensland University of
Technology, Brisbane, Australia. My research project focuses on sustainable residential development
with an overall aim to establish a framework to assess the sustainability levels of residential
neighbourhood site layouts. This framework will utilise a set of indicators from the literature and
suggestions from experts in the sustainable development fields, such as yourself. A total of 38 indicators
have been shortlisted for its potential use in the proposed assessment framework.
This letter invites you, as an expert in design, sustainability, and/or planning, to participate in this
research by answering our upcoming 3-round survey. The objective is to seek your expert opinion to
ascertain the importance of potential indicators (or criteria) mentioned above, for assessing/evaluating
the sustainability levels of residential site layouts. One-week duration will be allocated to complete the
questionnaire. After each iteration, a quantitative feedback report, including group analysis and
comments, will be sent to you.
Please be assured that all information collected will remain confidential and will only be used to calculate
group averages. Your name or organisation will not be attached to any comments you provide. In
addition, you will not be referred to by name or organisation in the feedback reports and research write-
up. The success of our research depends on your insights and that of the other participants. By sharing
your expertise, you can help establish and advance the body of knowledge related to the development of
sustainable neighbourhoods. This study adheres to the ethical procedures and requirements of Queensland
University of Technology (QUT). If you have any further queries concerning your participation in this
research, please contact QUT Research Ethics Officer on +61 73138 2091 or [email protected] .
Please email Mr Teriman at [email protected] at your earliest possible convenience to
notify him of your potential participation in the study. In return for the generous donation of your time,
Mr Teriman, the final author of this research project, will provide you with a digital copy of the executive
summary of his dissertation. If you have any further questions concerning this survey please do not
hesitate to contact Mr Teriman on +614 38128402 or via the above email.
Thank you very much and we look forward to hearing from you.
Yours sincerely,
Suharto Teriman
School of Urban Development
Queensland University of Technology
[email protected]
Page 242
222 Appendix B
Appendix B
Delphi round one survey questionnaire
DELPHI ROUND ONE
Dear Sir/Madam,
This letter invites you to participate in this Round 1 survey. The objective is to seek your expert opinion to
ascertain the importance of a list of indicators for measuring the level of sustainability of residential
neighbourhood layouts. The survey should take about 15 to 20 minutes to complete, as most of the survey
requires only a checkmark in the appropriate box. This questionnaire consists of two sections: section A
consists of 38 indicator items from which you will determine the level of relevance; section B requests
information about your professional/working experience and contact information. After each iteration, a
quantitative feedback report, including group analysis and comments, will be sent to you.
I would appreciate it if you could email the completed questionnaire at [email protected]
within two weeks of receiving this questionnaire. If you have any further questions concerning this survey
please do not hesitate to contact the researcher on +614 38128402 or via the above email.
Thank you very much and we look forward to hearing from you.
Best regards,
Suharto Teriman
School of Urban Development
Queensland University of Technology
[email protected]
Section A: Indicators & Rankings
The following section contains a list of 38 indicators classified under 3 categories (environmental, social
and economic). Based on your expert knowledge and opinion, please rate the relevance of each indicator
for measuring the level of sustainability of neighbourhood layouts. Please indicate your choice by clicking
the option button to the right of each indicator. You are encouraged to suggest other indicators that you feel
are relevant but not included in the list. You can also make recommendations to delete/combine/rephrase
any indicators that you believe will improve the understanding and quality of the overall questions.
Please use the following rating scale when indicating your preference:
Rating and
percentage score Description
1 Very low Not relevant at all for measuring neighbourhood
sustainability levels
2 Low Least relevant for measuring neighbourhood sustainability
levels
3 Medium Moderately relevant for measuring neighbourhood
sustainability levels
4 High Relevant for measuring neighbourhood sustainability levels
5 Very high Very relevant for measuring sustainability levels
Page 243
Appendix B 223
Environmental Sustainability
The quality of neighbourhood layouts where the physical arrangement/design and ecological attributes
are capable of providing for and supporting the existence of a healthy environment for the community
and surrounding habitat. Please rank the level of relevance of the following indicators that
contribute to the assessment of the sustainability of residential
neighbourhood layouts.
1 2 3 4 5 Very
Low
Low Medium High Very
high
Land use mix Diversity of compatible land use (housing, retail, food, educational,
recreation, offices, services, civic spaces).
Dwelling density Net dwelling density per designated residential parcel (including
internal public streets).
Impervious surfaces Amount of land surface covered by roads, buildings, car parks,
sidewalks, drainage.
Street connectivity
Street route directness
Pedestrian accessibility Ease of walking within the neighbourhood, expressed as ped-shed or
pedestrian catchment (areas actually within walking distance from
home/centre).
Pedestrian network coverage
Vehicular entry and exit routes
Non-motorised transport Availability of dedicated walkways and cycleways within the
neighbourhood.
Open space/active green per dwelling Amount of gross areas designated for open space, including play
areas/active greens.
Open space/active green per development area Amount of gross areas designated for open space, including play
areas/active greens.
Natural topography preservation
Sensitive areas/natural environment preservation Proximity to riverbanks/catchment and/or within
floodplain/excessive slopes.
Vegetation retained to create the development
Storm water retention/detention system Tree planting for shade/wind-break
Building exposure to natural ventilation (non-disastrous
winds)
Additional indicators or comments Please include other indicator(s), if any, that you believe are relevant but not listed above. Comments are welcome.
Page 244
224 Appendix B
Social Sustainability
The quality of neighbourhoods capable of building and maintaining social capital, including quality of
life (e.g., equity of access to key services), safety, cohesion and cultural integration, and participation of
citizens. Please rank the level of relevance of the following indicators that
contribute to the assessment of the sustainability of residential
neighbourhood layouts.
1 2 3 4 5 Very
Low
Low Medium High Very high
Proximity to public transit nodes/system Number of houses within a 400 m walking catchment distance to
bus stops.
Resident’s vehicle kilometre travel (VKT) Motor vehicle ownership..
Proximity to recreation facilities (parks/open spaces) Walkable catchment of functional local/neighbourhood parks or
active greens.
Proximity to education facilities Walkable catchment of local primary or secondary schools. Proximity to local services Walkable catchment of neighbourhood services providing daily
needs (grocery shops, day care centres) and other necessary local
services.
Existence of well-defined boundaries
Existence of neighbourhood central place Availability of amenities and services Availability of emergency services (police, fire & rescue, hospital)
within an acceptable service distance.
Provision of community centre Walkable catchment of neighbourhood centre providing
community services for residents.
Provision of religious centre Walkable catchment of venues for performing religious services
and activities that foster personal beliefs.
Provision of common recreation facilities for all ages
Provision of safety elements in crime prevention Natural or passive surveillance observation where public spaces are
visible from passing traffic and from surrounding homes (e.g.,
windows facing public domains).
Traffic calming measures
Separation between pedestrian and motorised traffic
Additional indicators or comments Please include other indicator(s), if any, that you believe are relevant but not listed above. Comments are welcome.
Page 245
Appendix B 225
Economic Sustainability
The quality of neighbourhoods where resources are efficiently used, economic capital is provided and
maintained and human capital (skills, knowledge) is utilised. Please rank the level of relevance of the following indicators
that contribute to the assessment of the sustainability of
residential neighbourhood layouts.
1 2 3 4 5 Very
Low
Low Medium High Very high
Availability of commercial establishments Availability of establishments providing a various range of
commercial services (restaurants, banks, post offices,
convenience stores, pharmacies, hardware stores, hair care
stores, laundrettes, retail stores, etc.).
Diversity of housing options Availability of various types of houses and floor space. Provision of affordable housing Availability of houses in various price ranges Employment opportunity within the immediate vicinity Availability of local employment opportunities within the
immediate vicinity of the neighbourhood.
Soil quality
Additional indicators or comments Please include other indicator(s), if any, that you believe are relevant but not listed above. Comments are
welcome.
Section B:
This section requests information about your professional working experience and contact information.
Please select the option that best describes your
primary area of expertise:
Please state the length of your working
experience/involvement in this field:
__________________________________________
Please provide your email address (Note: your email address will only be used to send you the group
result of this survey and to send you the final round of the survey):
Once completed, please save this document and kindly email it to the researcher at
[email protected]
Thank you for your time and effort in completing this questionnaire. We will send you the group
findings of this questionnaire and the final round questionnaire.
Please select Please select
Page 246
226 Appendix C
Appendix C
Delphi round two survey questionnaire
DELPHI SURVEY ROUND TWO
Dear Sir/Madam,
You have successfully participated in the Round 1 to identify the relevancy of indicators for measuring
the level of sustainability of neighbourhood layouts. This letter invites you to participate in this Round 2
survey.
The results from the Round 1 survey identified 24 relevant indicators, which are included in this second
round. This survey should take about 15 to 20 minutes to complete, as most of it requires only a
checkmark in the appropriate box.
The objective is to seek your expert opinion to ascertain the level of importance of these indicators for
measuring the level of sustainability of residential neighbourhood layouts. This questionnaire consists
of 2 sections: section A consists of all indicator items from which you will determine their level of
importance; and section B consists of three domains from which you will allocate points for each domain.
We would appreciate it if you could return the completed questionnaire to Mr Teriman at
[email protected] within one week of receiving this questionnaire. If you have any
further questions concerning this survey please do not hesitate to contact Mr Teriman on +614 38128402
or via the above email.
Please be assured that all information collected will remain confidential and will only be used to calculate
group averages. Your name, firm, school, or organisation will not be attached to any comments you
provide. In addition, you will not be referred to by name or organisation in the feedback reports and
research write-up. If you have any further queries concerning your participation in this research, please
contact the QUT Research Ethics Officer on +61 73138 2091 or [email protected] .
Thank you very much and we look forward to hearing from you.
Yours sincerely,
Suharto Teriman
School of Urban Development
Queensland University of
Technology
[email protected]
Page 247
Appendix C 227
Section A: Indicator importance & Rankings This section contains a list of 24 indicator items belonging to 3 categories (environmental, social, and
economic). Based on your expert knowledge and opinion, please rank the importance of each indicator item in
terms of its contribution to the sustainability assessment exercise. Please indicate your choice by clicking the
Option button to the right of each indicator.
Please rank the level of importance of the following indicators that contribute to the assessment of the
sustainability of residential neighbourhood layouts. Please use the following ranking scale when indicating
your preference:
Ranking and percentage score Description 1 0 – 15% Very Low Least important contribution to the overall assessment score
2 16 – 30% Low Less important contribution to the overall assessment score
3 31 – 45% Medium Low Below average important contribution to the overall assessment score
4 46 – 55% Medium Average important contribution to the overall assessment score
5 56 – 70% Medium High Above average important contribution to the overall assessment score
6 71 – 85% High Very important contribution to the overall assessment score
7 86 – 100% Very High Extremely important contribution to the overall assessment score
ENVIRONMENTAL SUSTAINABILITY
The quality of neighbourhood layouts where the physical arrangement/design and ecological attributes are
capable of providing for and supporting the existence of a healthy environment for the community and
surrounding habitat.
Indicators 1 2 3 4 5 6 7
Very
Low
Low Medium
Low
Medium High Medium
High
Very
High
Percentage score 0-15% 16-
30% 31-45% 46-55%
56-
70% 71-85%
86-
100%
Land use mix Diversity of compatible land use (housing, retail, food,
educational, recreation, offices, services, civic space).
Residential dwelling density Net dwelling density per designated residential parcel
(including internal public streets).
Impervious surfaces Amount of land surface covered by roads, buildings,
car parks, sidewalks, drainage.
Internal connectivity Efficiency of travel, expressed in terms of route
directness within the neighbourhood.
External connectivity Ease of street connection to surrounding developments.
Expressed in terms of average distance to next exit
point.
Open space provision Amount of gross area designated for open space,
including play areas/active greens.
Preservation of environmentally sensitive areas Proximity to river banks/catchment and/or within
floodplain/excessive slope.
Non-motorised transport Availability of dedicated walkways and cycleways
within the neighbourhood.
Solar orientation Amount of lot parcels with good solar orientation (as
close to cardinal compass points as possible.
Approximately 20-30% deviation acceptable).
Page 248
228 Appendix C
SOCIAL SUSTAINABILITY:
The quality of neighbourhoods capable of building and maintaining social capital, including quality of life
(e.g., equity of access to key services), safety, cohesion and cultural integration, and participation of
citizens.
Indicators 1 2 3 4 5 6 7
Very
Low
Low Medium
Low
Medium High Medium
High
Very
High
Percentage score 0-15% 16-
30% 31-45% 46-55%
56-
70% 71-85%
86-
100%
Access to public transport facilities Number of houses within a 400 m walking
catchment distance of bus stops.
Access to education facilities Walkable catchment of local primary or secondary
schools.
Access to health facilities Proximity to or acceptable distance from nearest
centres providing community (or private)
medical/health services.
Access to recreation space Walkable catchment of functional
local/neighbourhood parks or active greens.
Access to local services Walkable catchment of neighbourhood services
providing daily needs (grocery shops, day care
centres) and other necessary local services.
Access to community services Walkable catchment of neighbourhood centre
providing community services for residents.
Access to emergency services Availability of emergency services (police, fire &
rescue, hospital) within acceptable service distance.
Crime prevention and safety Natural or passive surveillance observation where
public spaces are visible from passing traffic and
from surrounding homes (e.g., windows facing
public domains).
Traffic calming measures Safety features on street or junction design (speed
humps, pedestrian crossings, traffic lights, target
hardening
ECONOMIC SUSTAINABILITY
The quality of neighbourhood where resources are efficiently used, economic capital is provided and
maintained and human capital (skills, knowledge) is utilised.
Indicators 1 2 3 4 5 6 7
Very
Low
Low Medium
Low
Medium High Medium
High
Very
High
Percentage score 0-15% 16-
30% 31-45% 46-55%
56-
70% 71-85%
86-
100%
Availability of commercial establishments Establishments providing a range of commercial
services (restaurants, banks, post offices,
convenience stores, pharmacies, hardware stores,
hair care stores, laundrettes, retail stores, etc.).
Employment self-containment Availability of local employment opportunities
within the vicinity of the immediate
neighbourhood.
Page 249
Appendix C 229
Economic sustainability (cont‘d)
Indicators 1 2 3 4 5 6 7
Very
Low
Low Medium
Low
Medium High Medium
High
Very
High
Percentage score 0-15% 16-30% 31-45% 46-55% 56-
70% 71-85%
86-
100%
Housing option diversity Availability of various types of houses and floor
space.
Provision of affordable housing Availability of affordable housing within the
neighbourhood.
Availability of skilled development centres Availability of centres providing training and
technical skills development services.
Diversity of housing prices Availability of houses in various price ranges.
Section B: Category importance
This section requests your expert opinion to allocate relative importance points of each category in
contributing to the level of sustainability based on a combined total of 100 points:
Indicator category Points
Environmental sustainability
Social sustainability
Economic sustainability
Total (100 points)
Once completed, please save this document and kindly email it to the researcher at
[email protected]
Thank you for your time and effort in completing this questionnaire. We will send you the group
findings of this questionnaire and the final round questionnaire.
0
0
0
0
Page 250
230 Appendix D
Appendix D
Delphi round three survey questionnaire
DELPHI SURVEY ROUND THREE
Dear Sir/Madam,
You have successfully participated in the round one and two surveys to identify the relevancy and
importance of indicators for measuring the level of the sustainability of neighbourhood layouts. This letter
invites you to participate in this final Round 3 survey. Table 1 presents the group mean for all indicators
derived from the previous round two survey. The table indicates that seven indicators failed to achieve
consensus in the round two survey, and, therefore, are included in this third round survey to ascertain
their impact on the sustainability of residential development.
The survey should take about 5 minutes to complete, as most of the survey only requires a checkmark in
the appropriate box. The objective is to seek your expert opinion to reconsider or ascertain the level of
the importance of these remaining indicators for assessing/evaluating the level of the sustainability of
residential site layouts. Your individual round two answers are also attached as a guide in answering the
questions. You may stick to the answers that you provided in the previous round two or you may choose a
different level of importance closer to the group mean.
We would appreciate it if you could return the completed questionnaire to Mr Teriman at
[email protected] within one week of receiving this questionnaire. If you have any
further questions concerning this survey please do not hesitate to contact Mr Teriman on +614 38128402
or via the above email.
Thank you very much and we look forward to hearing from you.
Yours sincerely,
Suharto Teriman
School of Urban Development
Queensland University of Technology
[email protected]
Page 251
Appendix D 231
Table 1: Group mean derived from round two of the Delphi survey
Indicator Mean % agreement
Environmental
25. Land use mix diversity 6.03 87.5
26. Dwelling density 5.47 81.3
27. Impervious surfaces 5.41 84.4
28. Internal connectivity 6.06 90.7
29. External connectivity 5.63 87.6
30. Non-motorised transport facilities 5.97 90.7
31. Environmentally sensitive areas 5.06 59.4
32. Open space provision 6.22 96.9
33. Solar orientation 4.88 62.5
Social
34. Access to public transport facilities 6.06 93.8
35. Access to education facilities 5.97 93.9
36. Access to health facilities 4.78 53.2
37. Access to local services 5.66 93.7
38. Access to recreational space 5.84 97.0
39. Access to community centre 5.44 87.6
40. Access to emergency services 5.16 71.9
41. Crime prevention and safety 6.00 96.9
42. Traffic calming 5.34 81.2
Economic
43. Commercial establishments 5.50 93.8
44. Skills development centres 4.19 37.5
45. Employment self-containment 4.66 53.2
46. Housing option diversity 5.41 87.6
47. Housing prices diversity 5.28 68.8
48. Affordable housing 5.69 81.3
Instructions:
Based on your expert knowledge and opinion, please rank the importance of each indicator
item in terms of its contribution to the sustainability assessment exercise. Please indicate your
choice by clicking the Option button to the right of each indicator. Please use the following
ranking scale when indicating your preference:
Ranking and percentage score Description
1 0 – 15% Very Low Least important contribution to the overall assessment score
2 16 – 30% Low Less important contribution to the overall assessment score
3 31 – 45% Medium Low Below average important contribution to the overall assessment score
4 46 – 55% Medium Average important contribution to the overall assessment score
5 56 – 70% Medium High Above average important contribution to the overall assessment score
6 71 – 85% High Very important contribution to the overall assessment score
7 86 – 100% Very High Extremely important contribution to the overall assessment score
Page 252
232 Appendix D
Please rank the level of importance of the
following indicators that contribute to the
assessment of the sustainability of
residential neighbourhood layouts.
1 2 3 4 5 6 7 Very
Low
Low Medium
Low
Medium High Medium
High
Very
High
Percentage score 0-15% 16-
30% 31-45% 46-55%
56-
70% 71-85%
86-
100%
Environmental Sustainability
Environmentally sensitive areas Proximity to riverbanks/catchments and/or
within floodplain/excessive slope.
Solar orientation Amount of lot parcels with good solar
orientation (as close to cardinal compass points
as possible. About 20-30% deviation
acceptable).
Social Sustainability
Medical centre Proximity to or acceptable distance from nearest
centres providing community (or private)
medical/health services.
Emergency services Availability of three main ES (police, fire &
rescue, hospital) within 5 minutes response
distance (4km) to centre of neighbourhood
Economic Sustainability
Skills development Availability of centres providing training and
technical skills development services.
Employment self-containment Availability of local employment opportunities
within the immediate vicinity of the
neighbourhood.
Housing prices diversity Availability of houses in various price ranges.
Once completed, please save this document and kindly email it to the researcher at
[email protected]
Thank you for your time and effort in completing this questionnaire.