Page 1
University of Arkansas, FayettevilleScholarWorks@UARK
Civil Engineering Undergraduate Honors Theses Civil Engineering
5-2016
Measuring Relative Humidity in ConcretePavements as a Method to Assess ASR MitigationMeasuresRemington G. ReedUniversity of Arkansas, Fayetteville
Follow this and additional works at: http://scholarworks.uark.edu/cveguht
Part of the Civil Engineering Commons, Structural Materials Commons, and the TransportationEngineering Commons
This Thesis is brought to you for free and open access by the Civil Engineering at ScholarWorks@UARK. It has been accepted for inclusion in CivilEngineering Undergraduate Honors Theses by an authorized administrator of ScholarWorks@UARK. For more information, please [email protected] , [email protected] .
Recommended CitationReed, Remington G., "Measuring Relative Humidity in Concrete Pavements as a Method to Assess ASR Mitigation Measures" (2016).Civil Engineering Undergraduate Honors Theses. 31.http://scholarworks.uark.edu/cveguht/31
Page 2
Measuring Relative Humidity in Concrete Pavements as a Method to Assess ASR Mitigation Measures
Remington G. Reed
University of Arkansas, FayettevilleMay 2016
Page 3
Abstract
Alkali-silica reaction (ASR) in concrete is partly facilitated by available moisture
within the concrete. In order to better understand this facilitation and to develop processes
for ASR mitigation methods, it is necessary to establish a means of monitoring internal
relative humidity (RH) within the concrete. Current procedures for measuring RH are time
consuming; requiring several hours of equilibration time and specific external conditions to
yield accurate results. In order to better understand RH monitoring, laboratory tests were
conducted using commercially available RH probes and different controlled environments.
Probes were carefully monitored and calibrated in controlled environments, and laboratory
tests on internal RH were conducted on concrete slabs in ambient conditions as well as
concrete prisms in controlled environments. Preliminary results show that differing probes
must be calibrated at different intervals and require different equilibrium times. Current
internal RH test procedures are inefficient in terms of equilibration and measurement
parameters.
KEYWORDS: Alkali-silica reaction (ASR), relative humidity, pavements, mitigation
1 INTRODUCTION
Mitigating alkali-silica reaction in concrete is achieved through reducing the available
moisture within the concrete. One method of validating mitigation measures is through
monitoring the internal relative humidity (RH) of the concrete. Measuring relative humidity
in the field is difficult due to fluctuation in temperature. Several hours are required for
temperature and humidity equilibrium between the humidity probe and the concrete. In
addition, the temperature of the concrete needs to be between 21 and 24 degrees Celsius [1].
Changes in temperature during monitoring increase the time required for equilibrium.
Several methods have been developed for measuring RH in the field. Portable digital RH
probes that use capacitive or resistive type sensors are often used because of the rapid and
repeatable results [2]. The process of measuring RH involves drilling a port to the selected
depth within the concrete and then cleaning the port and inserting a plastic tube, which is then
affixed with epoxy and plugged with rubber. After the air in the port reaches temperature and
humidity equilibrium with the concrete, the plug is removed and a probe is inserted [3, 4].
The probe remains in the port until it is in equilibrium with the air in the port.
This method has proven effective in several publications [3, 5, 6]. However, there are
some limitations to this method, which can be difficult to overcome. The measurements must
be conducted when the temperature of the concrete is near 21 to 24 degrees Celsius and the
temperature is stable. If the temperature fluctuates rapidly during measurements the probe
will require additional time to equilibrate, and may not provide accurate measurements. In
addition, fluctuations in temperature can cause moisture to condense within the port, which
will cause RH readings that are artificially high [3, 7].
Improved methods for measuring RH in the field are being evaluated as part of a larger
ongoing research program between the University of Arkansas and the Arkansas State
Highway and Transportation Department (AHTD). The evaluation of RH was conducted in
three phases, the first phase included calibration of RH probes. The second phase, was to
determine the required equilibrium time for measuring RH in concrete elements and the third
phase evaluated the critical RH required to sustain ASR related expansion over a range of
temperatures.
Page 4
2 MATERIALS AND METHODS
2.1 Calibration
Two different probes were used to measure relative humidity: Vaisala HMP40S and
Labjack EI1050 probes. The Vaisala probes use a sensor that is accurate within 1.5 percent
below a relative humidity of 90 percent, and within 2.5 percent at a relative humidity above
90 percent. The Labjack probes are within 3.5 percent accuracy at all relative humidity
levels. Both probes function best in a temperature range of 0 to 40 degrees Celsius. Three
Vaisala probes were available at the start of the project; however, one of the probes
malfunctioned during the project. In addition, eighteen Labjack probes were used during the
project, with three malfunctioning. The probe malfunctions were all caused by ammonium
sulfate saturated salt solution, which reacted with the soldered connections in the probes and
resulted in failure of the RH sensor.
In order to check the accuracy and compare the two types of probes, the probes needed
to be tested in known relative humidity. Three tests containers were established using
saturated salt solutions. In each container a salt was added to a small amount of warm water
until completely saturated, then the containers were sealed and small ports were drilled in the
lid so the probes could later be placed in them. The three salts used were sodium nitrite,
potassium chloride, and potassium nitrate. These salts created an approximate relative
humidity of 65 percent, 85 percent, and 95 percent, respectively. The containers were placed
in an environmental chamber at a constant temperature of 23 degrees Celsius.
First a Vaisala probe was placed in each container and monitored an hour a day for
three days. These measurements showed the average temperature and relative humidity
readings for each Vaisala probe in each salt. Following the Vaisala specific recordings, a
Vaisala probe was left in each container. Each of the 15 functioning Labjack probes was
placed in each of the containers and was monitored alongside the Vaisala probe for an hour
after placement, and an hour the following day. Using the average values for all these
readings, differences between the probe types were documented.
2.2 Internal Relative Humidity
To begin the internal relative humidity tests, two concrete slabs were cast. Concrete
slab specimens were cast using a standard CPT mix design. The cement content was 420
kg/m3 and the water to cement ratio was 0.45. The aggregates consisted of 1062 kg/m3 of a
non-reactive crushed limestone and 687 kg/m3 of a moderately reactive natural sand. The
slabs were placed outdoors in a moderately shady area. In order to conduct the necessary
tests, six ports had to be drilled at three different depths. Each port was used for a humidity
probe. A pattern was made out of cardboard with two rows of three ports evenly spaced. The
pattern was placed on a slab and two ports were drilled to a depth 25 mm, 50 mm and 75 mm
using a hammer drill. Once the ports were drilled, they were thoroughly cleaned to be free of
dust or debris. One Vaisala probe and one Labjack probe was placed at each depth. The
Labjack probes were then attached to a data acquisition board and accompanying computer
and all of the probes were monitored for three days, approximately one hour a day. This
process was repeated twice on each of the two slabs. Each time the manner in which the
probes were placed in the concrete was changed. The first rotation, the probes were inserted
using only O-rings to seal them in the concrete on the first slab, and on the second slab O
Page 5
rings were used for the Labjack probes and sealant was used for the Vaisala probes. On the
second rotation a silicon sealant was used for all six probes per slab.
After the first tests were conducted, two of the 50mm and 75mm Vaisala ports on each
slab were plugged using rubber plugs supplied by Vaisala. For each of these two depths on
both slabs a new port of equal depth was drilled. Immediately after drilling and cleaning, a
probe was inserted and both it and an accompanying probe in the previously drilled port was
monitored for 2 to 3 hours, and monitored again the next day using the Vaisala probes. This
process was used to compare the difference in RH for probes inserted into a freshly drilled
port, as compared to a port which has had several days to equilibrate with the concrete.
2.3 Critical Relative Humidity and Temperature
The test method for determining the critical RH, below which ASR does not occur,
involved storing ASR reactive concrete prisms at a range of temperatures and ambient
relative humidity. The concrete prisms were cast following the ASTM C1293 mixture
design. A highly reactive sand from El Paso, TX (Jobe) was selected as the reactive fine
aggregate, because it reacts quickly. A non-reactive limestone was selected as an inert coarse
aggregate. A high alkali (0.90 percent Na2Oe) cement was used, and the alkalis were boosted
to 1.25 percent by addition of NaOH pellets. The prisms were cured at 23 degrees Celsius for
four weeks before being placed in the storage containers.
Standard 19 L pails were used for storage, and each container had saturated salt
solution in the bottom to regulate RH within the container. Saturated salt solutions were
prepared by first boiling distilled water, and then mixing in the selected salt. The
concentration of salt added to the mixture was determined from the solubility of the salt at the
final storage temperature. Additional salt was added to the mixture after, the mixture
returned to room temperature to ensure that the solution remained saturated. Each pail was
filled to a depth of 25 mm with salt solution, and then the prisms were placed within the
container, so that the prisms did not come into contact with the salt solution.
The pails were then placed in a temperature regulated water bath. The temperatures
and RH conditions, as well as the salts, are summarized in Table 2. Each pail contained three
prisms, and the expansion values were determined as the average of three samples. The pails
were removed from the temperature regulated baths and placed in an environmental chamber
at 23 degrees Celsius 24 hours before measurements. Length change measurements were
conducted using a standard length comparator as used for CPT testing. There were twelve
temperature/RH points evaluated in the test matrix, which allowed the critical RH to be
determine at three temperatures. The test matrix is summarized in Table 1, and includes the
salts used to regulate RH within each container.
3 RESULTS AND DISCUSSION
3.1 Calibration
Two different types of relative humidity probes were used for data collection in the
internal relative humidity measurements: Vaisala and Labjack. The Labjack probes are less
expensive than the Vaisala probes and are more functional as several of them can be
monitored in real time and recorded on a computer. Because of the differing probes types, a
calibration factor could be used to convert between the two to eliminate measurement error
due to probe performance. In order to establish these calibrations factors, each of the Labjack
probes was cycled through sealed containers with different saturated salt solutions. During
Page 6
this, Labjack and Vaisala readings were taken simultaneously during the first hour of
placement and after 24 hours.
The data collected during the first hour showed differences in equilibration times for
the probes types. The 24-hour data showed that the Labjack and Vaisala probes read within a
few percent relative humidity of the other probe type on most occasions and was used for the
calibration table. Table 2 summarizes the difference in the average 24 hour readings using
Vaisala probes as controls. The majority of Labjack probes used were within ± 3.5 percent of
the control, the acceptable range per the sensor specifications. Labjack probes 6, 7, 10, and
11 all exhibited differences of more than the allowable limit, specifically in 70 percent
relative humidity container. Large differences in the readings indicated some sort of probe
error. The aforementioned four probes all read high in the one solution containing the
relative humidity most within optimum operating range of the Vaisala probes, below 90
percent relative humidity. They could not exhibit this same large error at higher humidity
levels due to the nearing maximum measurable values. This suggests that these probes are
highly uncalibrated and are likely recording inaccurate data.
During the course of testing one of the Vaisala probes began malfunctioning and
eventually failed to read. Due to the failure of the Vaisala probe, data points were lost or
inaccurate throughout the calibration and internal relative humidity testing. Three new
Labjack probes, which were to be used for the internal relative humidity tests, showed
increasing disparity between relative humidity readings with the Vaisala probes over time in
the calibration records. This decrease in accuracy shows that the Labjack probes accuracy
may decrease faster than the Vaisala probes over time. The sensor in the Vaisala probes is
more heavily protected than the sensor in the Labjack probes. Whereas the Labjack sensor is
exposed and this exposure could lead to gradual loss of accuracy over time. However, the
protection of the Vaisala sensor resulted in longer calibrations times than the Labjack probes
under the same conditions.
3.2 Internal Relative Humidity
To observe the behavior of the relative humidity internally, two specific tests were
conducted on two separate concrete slabs. Two slabs were cast for these tests and placed
outside in exposed conditions. The first test was designed to observe the collection of
relative humidly data at different depths. Two ports were drilled at each of three depths; 25,
50, and 75 mm. At each depth, both a Labjack and Vaisala probe was placed and monitored
for three days. This was done twice for each slab. Following the six probe measurements,
the ports drilled for the Vaisala probes were plugged until the second test was run. To
observe the effects of time after drilling, a new port was drilled at 50 and 75 mm on each
slab. Relative humidity of the new port and of an old port of equal depth was monitored for
two days to observe the effect of time after drilling on the required equilibration time.
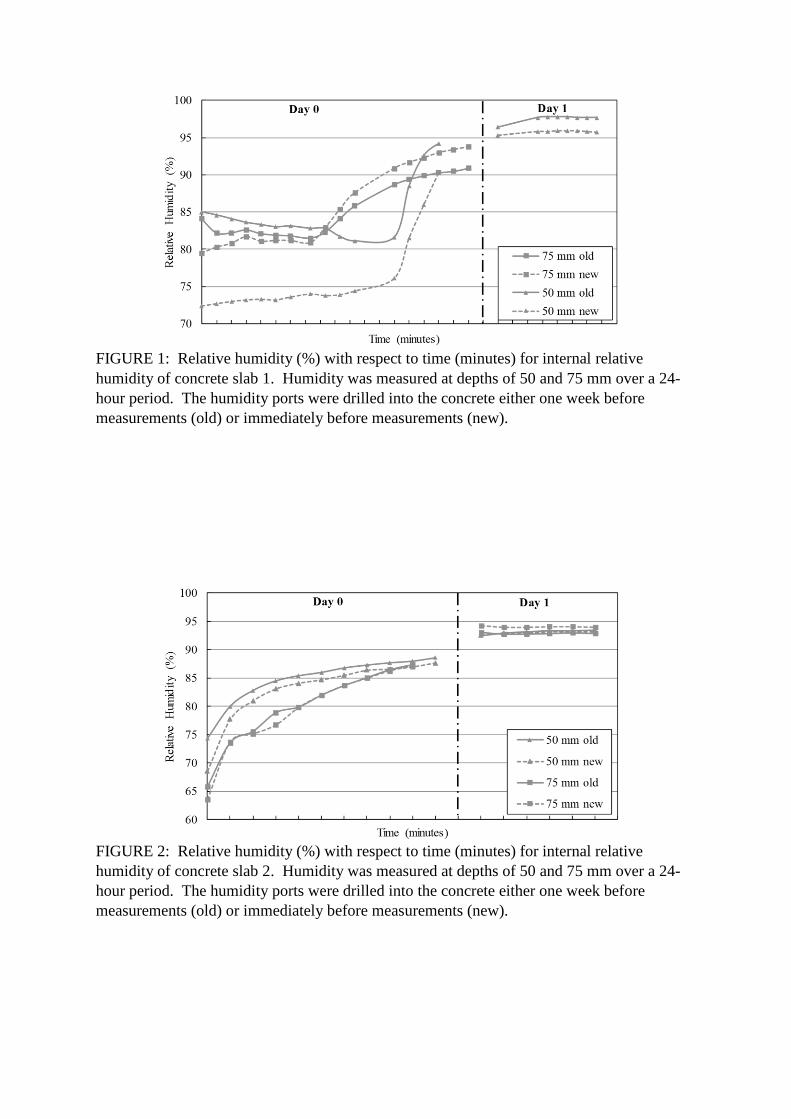
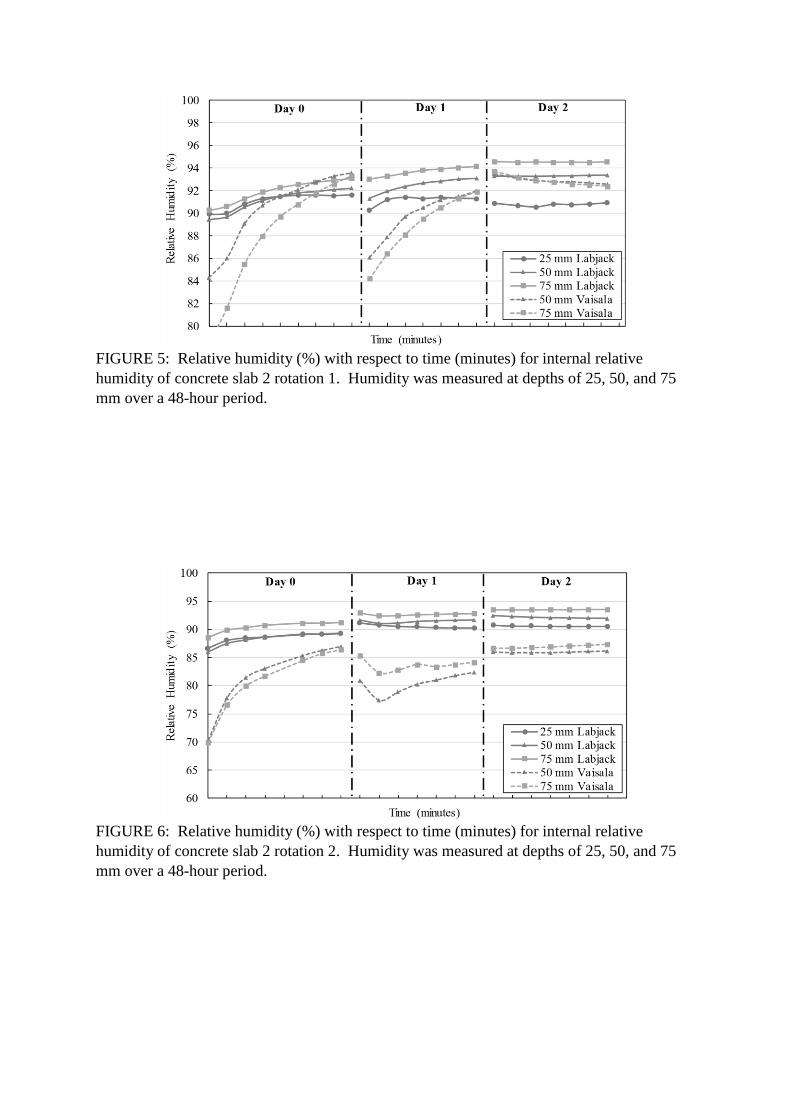
In the first rotation, results were consistent with expectations. The deeper within the
concrete the probe was placed, the higher the measured relative humidity and the lower
fluctuations in temperature. Over the four tests, two rotations for two slabs, one of the
Vaisala probes began malfunctioning. The 25mm depth was already showing inconsistent
data as seen in Figure 4, so it was deemed most useful to use the remaining two Vaisala
probes at the 50 and 75mm tests. At each rotation, a different method of securing the probes
in the slab was used. Figure 3 summarized when the probes were only placed with O-rings to
maintain a seal between the concrete and probe casing, Figure 5 summarizes when a silicon
Page 7
sealant was used for the Vaisala probes only, and Figures 4 and 6 represent when all probes
were sealed with silicon. For all four, the data recorded shows that the probe types converge
on approximately the same relative humidity readings within the first hour or two of
placement and become consistent following the first day. The rotation where no silicon
sealant was used shows the highest consistency of the rotations, maintaining almost identical
readings for the second and third day. For all of the rotations, the Labjack probes
equilibrated faster than the Vaisala probes and remained more consistent over the following
days. It appears as though the main effect of using a silicon sealant was to reduce
inconsistencies between the relative humidity at different depths. This shows that exposure
to ambient relative humidity, or the use of sealant has an effect on recorded relative humidity.
This also suggests that even though the data was consistent with expectations it may be easier
to observe differences in internal relative humidity using greater variations in depth.
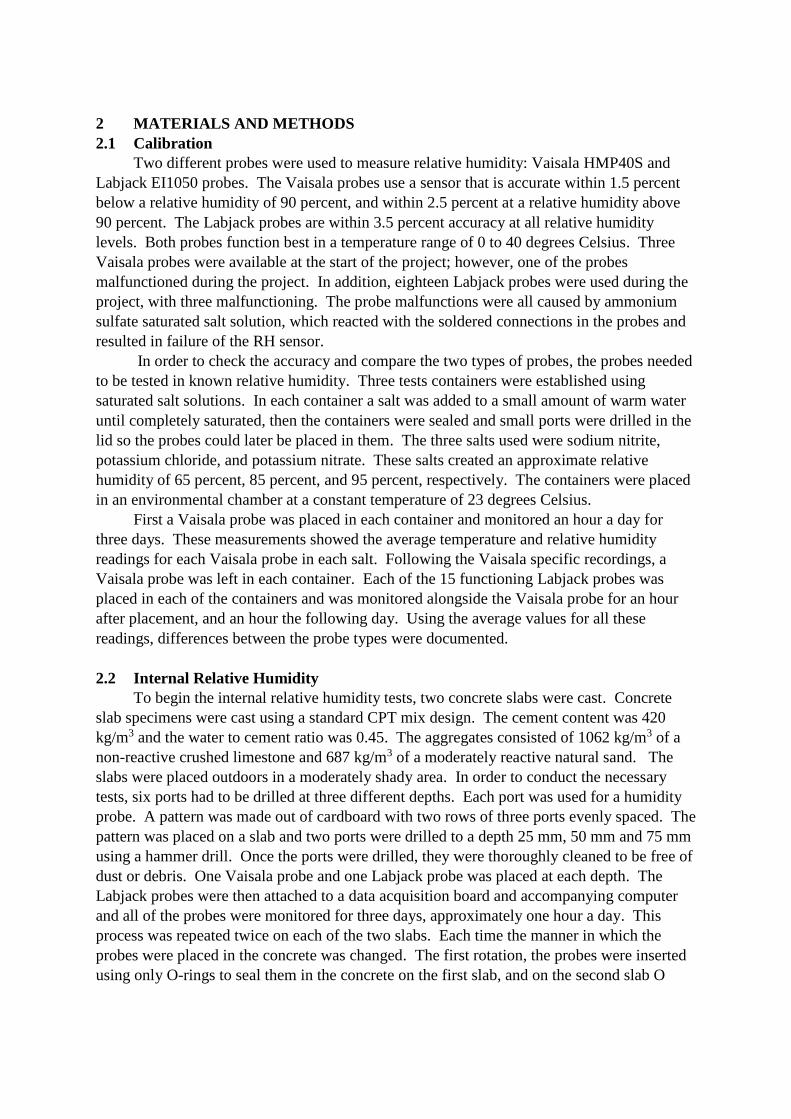
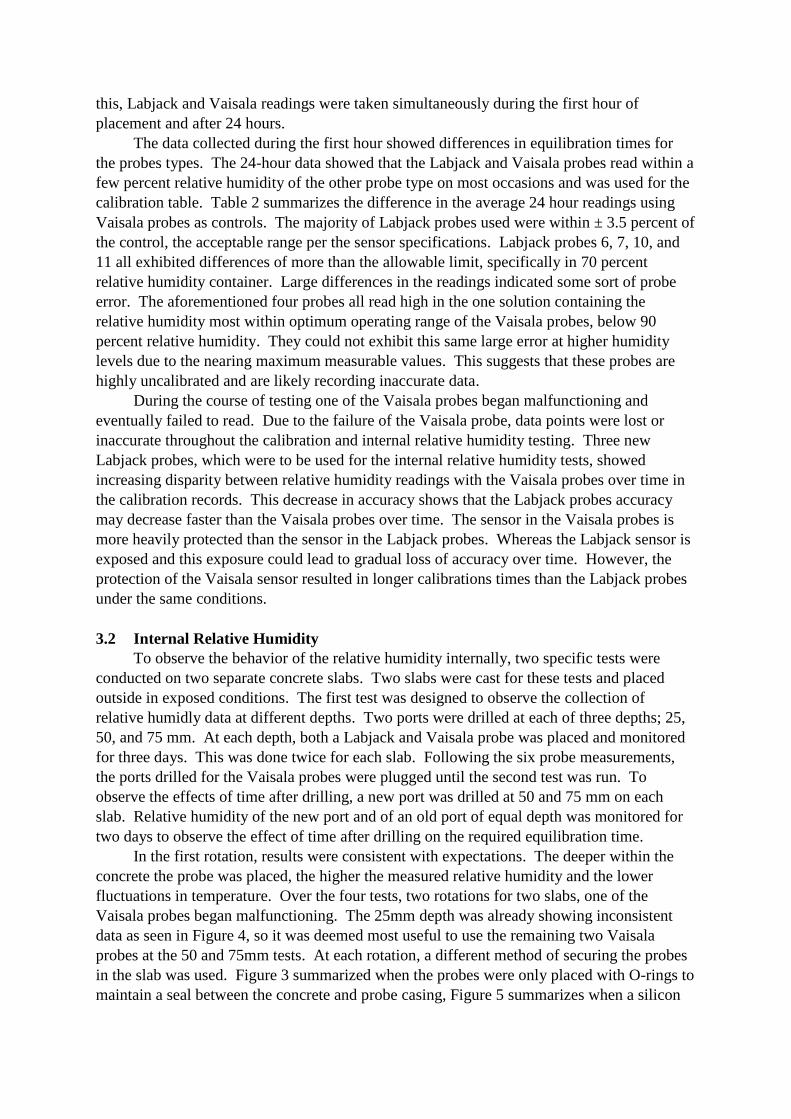
The second test indicates that time after drilling has little effect on the relative humidity
at depth within the concrete. The old ports and new ports were both sealed around the casing,
and the old ports were plugged during the time between drilling and the beginning of
readings. In Figures 1 and 2 the relative humidity of both ports is nearly identical after 24
hours and the age has little bearing there. More significantly, Figure 2 shows that the new
port and old port are at the same relative humidity, within probe accuracy, as compared to
one another within 3 hours after drilling. It is suggested in the literature that freshly drilled
ports would give inaccurate readings and that it took three days for humidity to equilibrate
before yielding accurate relative humidity readings [8]. However, from this test, it appears as
though the age of the port has little effect on relative humidity and the more important factor
is probe-specific equilibration time.
3.3 Critical Relative Humidity and Temperature
Concrete prism samples were stored in sealed 19 L pails, which were stored at a
controlled temperature and RH. The relative humidity within each pail was controlled using
saturated salt solutions. The four salts selected for controlling RH are summarized in Table
1. The actual RH for each salt solutions varies with temperature as compared to the values
provided within the table. However, the temperature dependence of each salt is within ± 2.5
percent for the salts, when at a temperature between 20 and 40 degrees Celsius [9, 10].
The concrete prisms were cast with a highly reactive Jobe fine aggregate and a non-
reactive limestone coarse aggregate. Due to the reactivity of this aggregate, the critical RH is
actually lower than 80 percent, and from Figure 7 falls near 60 percent. Interestingly, the
critical RH is similar at all three temperatures. However, this critical RH is not representative
of less reactive aggregates. Therefore, the test method will be repeated with a mildly reactive
fine aggregate from Arkansas. The results of this test will be used to improve field methods
for measuring RH. Currently, field testing requires that RH be measured when the ambient
temperature is near 21 to 24 degrees Celsius [1]. This limitation leads to two issues when
measuring RH in the field. First, the weather must be appropriate so that the internal concrete
temperature falls within or near this small range. Second, and more difficult to achieve, the
temperature must remain within this range for a sufficient period in order for the RH probe to
achieve temperature and humidity equilibrium with the concrete. However, the temperature
of the concrete often changes faster than that of the probe introducing additional errors.
Therefore, knowing the critical RH over a broad range of temperatures allows field
measurements to be conducted at a wider range of temperatures. However, this does not
Page 8
address the second limitation, and RH must still be measured when concrete temperature is
stable over a several hour period. The results from slab testing indicate that stable RH
measurements can be conducted in as little as three hours after drilling into the concrete,
which is a sufficiently small time period for field measurements when the weather is stable
and the concrete is not exposed to direct sunlight.
4 CONCLUSION
Results of field tests suggest that the standard procedure for measuring internal relative
humidity within concrete stands to be improved. By calibrating probes and monitoring probe
behavior in a controlled environment any probe malfunction and degradation over time
becomes evident. Calibration data also shows that equilibration time varies with probe type
and exposure, affecting the time necessary to make accurate readings. When testing internal
relative humidity of in-situ concrete the age of the monitoring port has little effect on the
accuracy of readings. Internal RH values are influenced more by port depth and exposure to
ambient conditions. Using larger than current standard variations in port depth it may
become easier to accurately catalog the changes in internal RH. Additional testing at
different depths and different ambient temperatures will be conducted to better understand the
humidity gradient within the concrete and the effect of drilling on concrete equilibration time.
The current temperature range (21 to 24 degrees Celsius) for RH measurement is restrictive,
and information about critical RH values was cataloged over a broad range of temperatures to
increase the range of field temperatures at which RH can be measured. The highly reactive
aggregate used for measuring critical RH resulted in critical RH values that are not indicative
of most concrete found in the field. Therefore, additional testing is being conducted to
determine the critical RH for moderately reactive concrete.
5 ACKNOWLEDGEMENTS
The authors would like to acknowledge the Arkansas Highway and Transportation
Department for funding and supporting the research program. Several graduate and
undergraduate researchers from the University of Arkansas were invaluable in conducting the
research project.
Page 9
REFERENCES
[1] Stark, D. (1990). “The moisture condition of field concrete exhibiting alkali-silica
reactivity”. CANMET/ACI International Workshop on Alkali-Aggregate Reaction in
Concrete, Halifax, Nova Scotia, 19 pp.
[2] Quincot G., Azenha M., Barros J., Faria R. (2011). “State of the art – Methods to
measure moisture in concrete.” Project report PTDC/ECM/099250/2008. Foundation
for Science and Technology: FCT. 40 pp.
[3] Thomas, M.D.A., Folliard, K.J., Fournier, B., Rivard, P., and Drimalas, T. (2013).
“Methods for Evaluating and Treating ASR-Affected Structures: Results of Field
Application and Demonstration Projects” (Report No. FHWA-HIF-14-0002). Federal
Highway Administration, U.S. Department of Transportation, Washington DC, 80 pp.
[4] Nilsson L. (1980). “Hygroscopic moisture in concrete - drying, measurements &.
related material properties.” Report TVBM – 1003. Division of Building Materials,
Lund Institute of Technology, 178 pp.
[5] Bérubé, M.-A., Chouinard, D., Pigeon, M., Frenette, J., Rivest, M., & Vézina D.
“Effectiveness of sealers in counteracting alkali–silica reaction in highway median
barriers exposed to wetting and drying, freezing and thawing, and deicing salt.”
Canadian Journal of Civil Engineering, 29, 2002, pp. 329-337.
[6] Thomas, M.D.A., Folliard, K.J., Fournier, B., Drimalas, T., & Rivard, P. (2012).
“Study of Remedial Actions on Highway Structures Affected by ASR”. Proceedings of
the 14th International Conference on Alkali-Aggregate Reaction (ICAAR), Austin,
Texas.
[7] Deschenes, R. A. (2014). “Mitigation of Alkali-Silica Reaction (ASR) in an Interstate
Median Barrier”. Master’s Thesis, University of Arkansas, Fayetteville Arkansas, 108
pp.
[8] Rust, C. (2009). “Role of Relative Humidity in Concrete Expansion due to Alkali-
Silica Reaction and Delayed Ettringite Formation: Relative Humidity Thresholds,
Measurement Methods, and Coatings to Mitigate Expansion.” M.S. Thesis, The
University of Texas at Austin, Austin, TX.
[9] Greenspan L. (1977). “Humidity fixed points of binary saturated aqueous solutions.”
Journal of Research of the National Bureau of Standards—A. Physics and Chemistry,
81(1), pp. 89-96.
[10] Rockland L. (1960). “Saturated salt solutions for static control of relative humidity
between 5° and 40° C.” Analytical Chemistry, 32(10), pp. 1375-1376.
TABLE 1: Relative humidity and temperature testing matrix.
Relative Humidity
T (°C ) 65 75 85 95
20 NaNO2 NaCl KCl KNO3
30 NaNO2 NaCl KCl KNO3
40 NaNO2 NaCl KCl KNO3
Salt Sodium
Nitrite
Sodium
Chloride
Potassium
Chloride
Potassium
nitrate
**Actual RH values vary with temperature.
Page 10
TABLE 2: Calibration data for Labjack probes, with standard deviation and difference from
the control.
Probe RH (%) Stdev RH (%)
Control Diff. Probe RH (%) Stdev
RH (%)
Control Diff.
1
93.1 0.3 93.0 -0.1
2
90.8 0.3 92.2 1.4
86.2 0.3 84.2 -2.1 83.3 0.5 83.7 0.4
74.1 0.2 70.7 -3.4 71.0 0.2 70.5 -0.5
3
92.4 0.3 92.9 0.5
6
95.3 0.2 94.3 -1.0
85.1 0.1 84.3 -0.8 88.8 0.5 85.5 -3.3
73.4 0.1 72.3 -1.1 76.8 0.2 70.9 -5.9
7
94.4 0.2 92.9 -1.5
8
93.4 0.2 94.5 1.0
86.9 0.3 83.9 -3.0 86.7 0.2 85.7 -1.0
75.7 0.2 70.8 -4.9 73.9 0.2 70.7 -3.2
10
92.6 2.1 93.6 1.0
11
97.7 0.3 97.0 -0.7
84.7 0.1 84.4 -0.3 88.9 0.2 85.0 -3.9
75.9 0.1 71.1 -4.8 77.7 0.1 70.7 -7.0
12
90.4 0.1 93.6 3.2
13
87.5 0.8 91.1 3.6
84.0 0.3 84.9 0.9 82.7 0.2 84.4 1.7
73.3 0.1 72.7 -0.6 69.4 0.2 69.7 0.3
14
90.3 0.1 92.3 2.1
15
89.7 0.1 92.1 2.4
84.4 0.1 85.0 0.7 83.3 0.2 85.1 1.7
69.0 0.1 70.0 1.0 71.1 0.2 69.8 -1.3
16
89.9 0.3 92.2 2.3
17
91.4 0.0 93.6 2.3
82.4 0.1 84.4 2.0 82.8 0.1 84.1 1.3
70.4 0.1 72.1 1.7 69.9 0.1 70.0 0.1
18
89.0 0.0 92.9 3.9
82.8 0.1 84.9 2.1
69.8 0.1 71.6 1.8
Page 11
FIGURE 1: Relative humidity (%) with respect to time (minutes) for internal relative
humidity of concrete slab 1. Humidity was measured at depths of 50 and 75 mm over a 24-
hour period. The humidity ports were drilled into the concrete either one week before
measurements (old) or immediately before measurements (new).
FIGURE 2: Relative humidity (%) with respect to time (minutes) for internal relative
humidity of concrete slab 2. Humidity was measured at depths of 50 and 75 mm over a 24-
hour period. The humidity ports were drilled into the concrete either one week before
measurements (old) or immediately before measurements (new).
Page 12
FIGURE 3: Relative humidity (%) with respect to time (minutes) for internal relative
humidity of concrete slab 1 rotation 1. Humidity was measured at depths of 25, 50, and 75
mm over a 48-hour period.
FIGURE 4: Relative humidity (%) with respect to time (minutes) for internal relative
humidity of concrete slab 1 rotation 2. Humidity was measured at depths of 25, 50, and 75
mm over a 48-hour period.
Page 13
FIGURE 5: Relative humidity (%) with respect to time (minutes) for internal relative
humidity of concrete slab 2 rotation 1. Humidity was measured at depths of 25, 50, and 75
mm over a 48-hour period.
FIGURE 6: Relative humidity (%) with respect to time (minutes) for internal relative
humidity of concrete slab 2 rotation 2. Humidity was measured at depths of 25, 50, and 75
mm over a 48-hour period.
Page 14
FIGURE 7: Strain (%) measurements with respect to relative humidity (%) of the storage
environment. Each sample was stored at a temperature of either 20, 30, or 40 degrees
Celsius.