21
Measuring Rural Transit Availability Nicholas E. Lownes, Ph.D. 18th National Rural and Intercity Bus Transportation Conference October 21, 2008
| Date post: | 21-Dec-2015 |
| Category: |
Documents |
| View: | 218 times |
| Download: | 3 times |

Measuring Rural Transit Availability
Nicholas E. Lownes, Ph.D.18th National Rural and Intercity Bus
Transportation Conference
October 21, 2008

Motivation
• Rural transit service presents several difficulties: CT has significant rural population
• Theoretical treatments of rural transit availability may miss important nuance
• Fixed-route measures miss important aspects
• Invite input: [email protected]

Fixed-Route Availability
• Studied a circulator route design in Austin, TX (not rural)
• Under idealized conditions, definition of accessibility and opportunity cost of no access impacted results significantly.

User-Focused
Station
UT

Operator-Focused
Station
UT

Balanced
Station
UT

Accessibility Perspectives
• Characterization depends on perspective & purpose
• Accessibility– Restricted Budget – Best service within
restrictive budget constraints– Social Benefit or Inducing Demand–
Maximizing accessibility/coverage
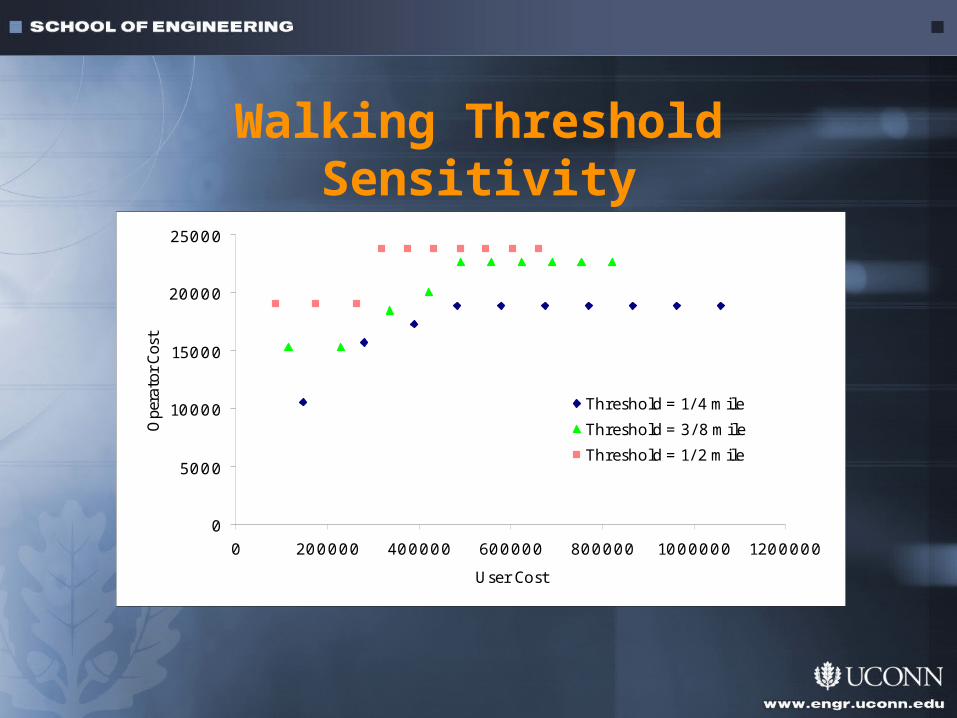
Walking Threshold Sensitivity
0
5000
10000
15000
20000
25000
0 200000 400000 600000 800000 1000000 1200000
User Cost
Ope
rato
r Cos
t
Threshold = 1/ 4 mile
Threshold = 3/ 8 mile
Threshold = 1/ 2 mile
Availability Measures
• Fixed-route Measures• Spatial Measures– Local Index of Transit Accessibility
(LITA): Developers seeking to improve real estate investments
– Transit Capacity and Quality of Service Manual (TCQSM): Transit planners & managers

Availability Measures
• Spatiotemporal Measures– Transit Level of Service (TLOS): Transit
planners & managers• Track boarding opportunities (spatial coverage) over
time• Demand variability throughout day
• Utility Measures– TxDOT Transit Accessibility Measure (TAM)
• Function of origin, destination, demographics, trip purpose

Opportunity Cost
• Back of the envelope– Cost of maintaining single-car vs. two-
car household ≈ $6000 (fuel at $2.75 per gallon
– Function of: • proximity to transit (3/4 mile), • Driving less• Walking more• Owning fewer cars
From: Bailey, L. Public Transportation and Petroleum Savings in the U.S.: Reducing Dependence on Oil. ICF International, American Public Transportation Association, Washington, D.C., 35 pp, (2007).

Opportunity Cost Sensitivity
0
5000
10000
15000
20000
25000
0 200000 400000 600000 800000 1000000 1200000
User Cost
Ope
rato
r Cos
t
Unserved Demand Cost < $4K
Unserved Demand Cost $4K - $7K
Unserved Demand Cost > $7K

Opportunity Cost
• Econometric Analyses– Both SP/RP modeling and analysis– Relative WTP for features of transit
service– Elasticity of transit– Value of travel time savings

Rural Transit Availability
• TCQSM offers methods for estimating rural transit LOS, incorporating availability
• Rural areas will fall below density threshold for transit-supportive areas in fixed-route calculations
Demand Responsive Availability
• Treated separately in TCQSM – a much different service
• Availability a function of:– Response time– Trip availability/connectivity– Hours and days of service– Reliability– Quality of service w.r.t. time, comfort

Rural Transit Availability
Rural populations differ from urban counterparts– Demographically– More vulnerable to energy price fluctuations– Equity issues
• What’s missing: Information Penetration– No doubt this is a topic rural operators have
thought about considerably (there was a session at this conference)

Rural Transit Availability
• Can we consider transit service available if people are unaware?
• Rural demographics may impact:– Internet usage– Attitudes toward transit
• How can we incorporate these ideas in an availability measure?

Our work in CT
• Phase I: Analysis of Availability Measures– Consistency– Parameters of Interest– Appropriate Response Variable
• Propensity to ride• Spatial Coverage• O-D coverage• Temporal Coverage• Service hours

Work in CT
• Phase II: Expanding to Rural Markets• How do we integrate rural markets?– Park and ride express coverage?– DRT – ridership and/or LOS– Information penetration
• What are the best practices for communicating and how do we include in Connecticut?

Acknowledgement
• Partially sponsored by the Connecticut Cooperative Highway Research Program, Project 08-5

Thank you
Source: www.fta.dot.gov/about/about_FTA_2449.html/
Ideas, comments, questions: [email protected]


