Measuring School Climate for Gauging Principal Performance A Review of the Validity and Reliability of Publicly Accessible Measures Quality School LEADERSHIP A QUALITY SCHOOL LEADERSHIP Issue Brief | April 2012
Transcript
Measuring School Climate for Gauging Principal Performance A Review of the Validity and Reliability of Publicly Accessible Measures
Quality School LEADERSHIP
A Q
UA
LIT
Y S
CH
OO
L L
EA
DE
RS
HIP
Is
su
e B
rie
f |
A
pri
l 2
01
2
Measuring School Climate for Gauging Principal Performance
A Review of the Validity and Reliability of Publicly Accessible Measures
April 2012
Matthew Clifford, Ph.D., American Institutes for Research
Roshni Menon, Ph.D., American Institutes for Research
Tracy Gangi, Psy.D., Consultant
Christopher Condon, Ph.D., American Institutes for Research
Katie Hornung, Ed.M., American Institutes for Research
Contents 1 Introduction
5 Procedure
7 School Climate Surveys Reviewed
11 Discussion
13 Conclusion
20 References
Acknowledgments
The authors wish to thank Lisa Grant, Pinellas County Schools; Eric Hirsch, New Teacher Center; Anthony Milanowski, Westat; Steven Ross, Johns Hopkins University; Lisa Lachlan-Haché, American Institutes for Research; Andrew Wayne, American Institutes for Research; and Jane McConnochie, American Institutes for Research; whose reviews of this brief improved its content.
The authors also wish to thank the Publication Services staff at American Institutes for Research who helped to shape the work.
A REVIEW OF THE VALIDITY AND RELIABILITY OF PUBLICLY ACCESSIBLE MEASURES | 1
IntroductionMany states and school districts are working to improve principal performance evaluations as a means of ensuring that effective principals are leading schools. Federal incentive programs (e.g., Race to the Top, the Teacher Incentive Fund, and School Improvement Grants) and state policies support consistent and systematic measurement of principal effectiveness so that school districts can clearly determine which principals are most and least effective and provide appropriate feedback for improvement. Although professional standards are in place to clearly articulate what principals should know and do, states and school districts are often challenged to determine how to measure principal performance in ways that are fair, systematic, and useful.
Designing principal performance evaluation is challenging for several reasons, two of which are given here. First, the literature provide little guidance on effective principal performance evaluation models. Few research or evaluation studies have been conducted to test the effectiveness of one evaluation system over another (Clifford and Ross, 2011; Sanders and Kearney, 2011). Second, reliance on current practice is problematic. Goldring, Cravens, Porter, Murphy, and Elliot (2007) found that district performance evaluation practices are inconsistent and idiosyncratic, and they provide little meaningful feedback to improve leadership practice. This means that performance evaluation designers have few guideposts to inform new designs.
One guidepost offered by research suggests that principals influence teaching and learning by creating a safe and supportive school climate. Some designers of improved school principal evaluation systems are including school climate surveys as one of many measures of principal performance.1 School climate data are important sources of feedback because principals often have control over school-level conditions, although they have less direct control over classroom instruction or teaching quality (Hallinger & Heck, 1998). High-quality principal performance evaluations are closely aligned to educators’ daily work and immediate spheres of influence (Joint Committee on Standards for Educational Evaluation, 2010). Such evaluation data offer educators opportunities to reflect on and improve their practices.
This policy brief provides principal evaluation system designers information about the technical soundness and cost (i.e., time requirements) of publicly available school climate surveys. We focus on the technical soundness of school climate surveys because we believe that using validated and reliable surveys as an outcomes measure can contribute to an evaluation’s fairness, accuracy, and utility for a state or a school district. However, none of the climate surveys that we reviewed were expressly validated for principal evaluation purposes. We advise states and school districts to carefully study principal evaluation systems that are performing well and then select climate surveys that are useful measures of performance.
1 For available measures, see the Guide to Evaluation Products at http://resource.tqsource.org/GEP for an unreviewed list of principal evaluation products.
2 | MEASURING SCHOOL CLIMATE FOR GAUGING PRINCIPAL PERFORMANCE
In addition, policymakers tell us that they need technical soundness and cost information to initially screen possible measures for inclusion in principal evaluation systems. Designers can use the information presented in this brief to identify technically sound school climate surveys and then critically review those surveys to determine how well they fit into principal evaluation system designs.
This brief begins with an overview of school climate surveys and their potential uses for principal evaluation. Next it outlines our procedure for reviewing school climate surveys, which is followed by brief synopses of each survey that meets the minimum criteria for inclusion in the review. The brief ends with a discussion of the surveys reviewed.
School Climate and Principal Effectiveness
Policymakers and educators might take the view that principals, as school leaders, are ultimately responsible for all that occurs in a school building and all aspects of organizational performance. Such a perspective raises the possibility that principals will be evaluated on things that they do not (or cannot) control. Effective performance evaluations focus on aspects of school life and learning that principals can reasonably influence. For example, principals in some school districts have no budget allocation authority; therefore, it makes little sense to evaluate their performance as budget developers or managers. Performance feedback resulting from evaluations closely tied to work practices is more useful for changing practice than those that are not well aligned (DeNisi & Kruger, 2000; Joint Committee on Standards for Educational Evaluation, 2010).
Although the work responsibilities of principals vary, measures of school conditions offer principals and their evaluators useful feedback on performance because principals tend to have a direct influence on school conditions. Principals tend to have authority in controlling school-level conditions, such as school climate, and principals influence student learning by creating conditions within a school for better teaching and learning to occur. Studies of principal influence on student achievement note that their influence is indirect, meaning that principals affect student learning through the work of others. Principals, through their leadership and management practices, can determine what human, financial, material, and social resources are brought to bear on schools, and how those resources are allocated (Hallinger & Heck, 1998; Leithwood, Louis, Anderson, & Wahlstrom; 2004). These functions are reflected in national professional standards for principals (e.g., Council of Chief State School Officers, 2008; National Association of Elementary School Principals, 2009).
For these and other reasons, states and school districts have turned to school surveys—specifically school climate surveys—as measures of principal performance (see Box 1 for a definition of school climate). As research indicates, school climate is associated with robust and encouraging outcomes, such as better staff morale (Bryk & Driscoll, 1988) and greater student academic achievement (Shindler, Jones, Williams, Taylor, & Cardenas, 2009). Conversely, school climate research has indicated that a poor school climate is associated with higher absenteeism (Reid, 1983), suspension rates (Wu, Pink, Crain, & Moles, 1982), and school dropout rates (Anderson, 1982). Mowday, Porter, and Steers (1982) and Wynn, Carboni, and Patall (2007) reported that schools with negative school climates had high teacher absenteeism and turnover.
A REVIEW OF THE VALIDITY AND RELIABILITY OF PUBLICLY ACCESSIBLE MEASURES | 3
School climate surveys have a long history of use in education and educational research, but only recently have they been used for principal evaluation. For example, researchers have used climate surveys to determine whether school improvement efforts have achieved the desired effects or explain why some schools perform better or worse than others (e.g., a shared mission or vision). Climate surveys meet these purposes by asking teachers, staff, and others to make judgments about a school. A climate survey, for example, might ask teachers about how much they trust their colleagues, how much they believe in the school mission, or how safe they feel in expressing their ideas and opinions.
School climate surveys differ from school audits
or school walk-throughs, which involve observations of school activities by trained staff. School climate surveys also differ from 360-degree assessments of principal practice because these assessments focus exclusively on gathering multiple perspectives on a principal’s performance at a single point in time. (For a review of leadership assessments, see Condon & Clifford [2010].) Climate surveys more broadly assess the quality and the characteristics of school life, which include the availability of supports for improved teaching and learning.
State-level staff, superintendents, and others seeking to redesign performance evaluation systems may determine that a school climate survey should be used as one measure of principal effectiveness and seek existing surveys or develop one of their own. (For an overview of the principal evaluation design process, see Clifford et al. [2011].) Climate surveys with publicly available testing and validation information can provide policymakers the data they need to make decisions about which climate survey is best for their state or school district. Validated and reliable surveys can contribute to the fairness, the accuracy, and the legal defensibility of performance evaluation systems.
School climate is considered an outcome or a result of principals’ work, such as improved instructional quality, community relationships, or student growth. When used for principal evaluation purposes, school climate surveys can contribute to a summative evaluation of principal performance; yet they are also often used for formative purposes. Principal evaluation system designers must determine if and how school climate measures should be included in principal evaluation, including what priority such results should be given in a principal’s overall evaluation. Principal evaluation systems also include measures of principal practice, such as observations or a portfolio review, which provide insights on the quality of the work of principals.
Box 1. Climate, Culture and Context: What’s the Difference?
The terms climate, culture, and context are frequently used interchangeably in education, but some argue that differences exist between these constructs (Deal & Peterson, 1999). Each term has different meanings, and no set list of variables is assigned to each term.
For the purposes of this brief, we define climate as the quality and the characteristics of school life, which includes the availability of supports for teaching and learning. It includes goals, values, interpersonal relationships, formal organizational structures, and organizational practices.
Culture refers to shared beliefs, customs, and behaviors. Culture can be measured, but school culture measures are not included in this brief. Culture represents people’s experiences with ceremonies, beliefs, attitudes, history, ideology, language, practices, rituals, traditions, and values.
Context is the conditions surrounding schools, which interact with the culture and the climate in a school. School context can be measured, but such measures are not included in this brief.
4 | MEASURING SCHOOL CLIMATE FOR GAUGING PRINCIPAL PERFORMANCE
Box 2. Definitions of Reliability and Validity
The school climate surveys included in this brief have not been validated for the purpose of principal evaluation, but several are currently being used for that purpose. We believe that using validated school climate surveys contributes to the credibility of principal evaluation systems, and policymakers should consider validity and reliability as criteria for selecting measures for the principal evaluation system. Subsequent to the selection of measures, policymakers will need to examine—and possibly adapt—surveys for use as principal evaluation instruments.
For an instrument to be included in this review, technical information on the psychometric soundness (i.e., accepted tested measures used to test for reliability and validity) on the instrument had to be publicly available, either on the Internet or by request. The instrument was determined to be psychometrically sound through a set of a priori criteria developed by the research panel, which will be discussed in the “Procedure” that follows. Reliability and validity testing provides evidence of psychometric rigor when measuring school climate. Psychometric rigor must be considered prior to implementing such instruments in schools and school districts, to ensure that the information gathered is accurate and valid, because of the high stakes in principal performance evaluations.
Reliability is the extent to which a measure produces similar results when repeated measurements are made. For example, if an instrument is used to measure school climate, it should consistently produce the same results as long as the school climate and the survey respondents have not changed.
Validity is the extent to which an instrument measures what it is intended to measure. This review was concerned with two types of validity: construct validity and content validity. Construct validity is an instrument’s ability to identify or measure the variables or the constructs that it proposes to identify or measure. For example, if an instrument intends to measure school safety as one construct of school climate, then multiple items on the survey instrument are needed to measure the degree to which a school is safe. Testing the construct validity of the school safety construct would determine how well the survey items measure school safety.
Content validity is the degree to which the content of the items within a survey instrument accurately reflects the various facets of a content domain or a construct. To use the same example as earlier, if school safety is one construct that a survey instrument intends to measure, then items within the instrument need to cover aspects of school safety (e.g., drug use and violence) that are identified in the research literature, by an expert review panel, or a set of widely accepted research-based standards.
The review does not include other forms of validity because we believed these forms of validity are a good starting point for policymakers’ deliberations. Other forms of validity are important, and we encourage policymakers to review all the available literature on the surveys prior to selection.
A REVIEW OF THE VALIDITY AND RELIABILITY OF PUBLICLY ACCESSIBLE MEASURES | 5
ProcedureTo prepare this brief, we reviewed technical information on publicly available school climate surveys. All the surveys in this review were created and distributed by private companies, higher education institutions, school districts, or states for either no cost or a fee. The survey developers provided technical information on the survey contents, time requirements, and psychometric testing either through promotional literature, peer-reviewed journals, or on request. Some surveys were excluded from this brief because the content was proprietary or the survey developers did not publicly provide technical information with which to judge validity and reliability. Our purpose for the review is to provide principal evaluation system designers information about available school climate surveys. We do not endorse any particular survey.
We conducted a keyword2 search of Google Scholar and Google to locate instruments measuring school climate. When the initial search yielded about 1,000 leads to follow, additional keywords of reliability and validity were added, and a content screen was conducted. The content screen narrowed the review to school climate surveys focusing on key aspects of school leadership, rather than a single and constrained focus. For example, we excluded surveys that focused solely on school safety because school leadership involves more than school safety, and we assumed that states and school districts would be disinclined to administer multiple surveys to assess principal performance.
This reduced the number of leads returned to about 125, which included but was not limited to surveys located by Gangi (2010) and AIR’s Safe and Supportive Schools Technical Assistance Center (2011). Both sources were located after the initial review, and both independently analyzed psychometric properties of publicly available surveys through expert review. In addition, a snowball sampling (Miles & Huberman, 1994) method was used to query experts on principal performance evaluation design at state and district levels.
The criteria for sampling instruments were as follows:
¡ Reports on school climate as an intended use of the instrument.
¡ The instrument and the technical reporting information must be publicly available either on the Internet or by request.
¡ The instrument was developed within the last 15 years, which avoids the consideration of older instruments that do not reflect the dynamic nature of school climate research.
¡ The instrument is psychometrically sound (in reliability and validity) according to a priori criteria set by the research panel.
¡ Either teachers or school administrators complete the instrument.3
2 The keywords used were school climate survey, measuring school environment, and school learning environment.3 Parent and student surveys can also be administered to gauge school climate, but these surveys were excluded
from the review because they are less commonly used for principal evaluation.
6 | MEASURING SCHOOL CLIMATE FOR GAUGING PRINCIPAL PERFORMANCE
Our work is ongoing, and we welcome the opportunity to conduct additional, impartial reviews of other school climate surveys that are being used.
For the purposes of the review, psychometrically sound means that the instrument must be tested for validity and reliability using accepted testing measures. A minimum overall scale for reliability rating of .75 must be achieved.4 Also, content validity must have been evidenced by, at minimum, a rigorous literature review or an expert panel review. Finally, construct validity testing must be adequately documented to allow the research panel to judge the relative rigor by which the testing occurred (see Box 2).
Using these criteria, about 25 instruments were initially identified, but only 13 instruments met all the criteria to be included in the final review (see Table 1). Two American Institutes for Research (AIR) researchers conducted separate full reviews of the identified school climate surveys, and two additional AIR reviewers served as objective observers of the review process.
4 The research community differs on the benchmark or the minimum scale reliability needed to signify a reliable measure. Some researchers use a benchmark of .70, while others use .80 as a minimum. We set a minimum overall scale reliability of .75 as a compromise. Sometimes, overall reliability indexes are not computed for a scale because some researchers believe that an overall reliability for a scale that includes several subscales measuring different constructs is not warranted. In cases where no overall scale reliability is reported for the measures in this document, we report on the average subscale reliability. We set a minimum average subscale reliability of .60 for inclusion in Table 1, which is smaller than the benchmark for overall scale reliability, because subscales have fewer items, leading to smaller reliability coefficients. If the overall scale and subscale reliabilities are reported, we considered the overall scale reliability to be more definitive.
A REVIEW OF THE VALIDITY AND RELIABILITY OF PUBLICLY ACCESSIBLE MEASURES | 7
School Climate Surveys Reviewed
Alliance for the Study of School Climate– School Climate Assessment Inventory
Shindler, Taylor, Cadenas, and Jones (2003) originally developed the Alliance for the Study of School Climate–School Climate Assessment Inventory (ASSC–SCAI), which was published in 2004 by the Western Alliance for the Study of School Climate (now the Alliance for the Study of School Climate). According to Shindler et al. (2009), SCAI’s purpose is to capture a detailed understanding of each school’s function, health, and performance. It provides surveys for faculty, parents, and students for elementary, middle, and high schools that can be administered either individually or in a group setting. It takes approximately 20 minutes to complete. The measured constructs are physical appearance, faculty relations, student interactions, leadership and decisions, discipline environment, learning and assessment, attitude and culture, and community relations. For more information on ASSC–SCAI, see http://www.calstatela.edu/centers/schoolclimate/assessment/school_survey.html.
Brief California School Climate Survey
You, O’Malley, and Furlong (2012) developed the Brief California School Climate Survey (BCSCS) in response to the data collection requirement within the Safe and Drug Free Schools and Communities Act. BCSCS is adapted from California School Climate Survey and provides schools with data that can be used to promote a healthy learning and working environment. The survey is administered to teachers, administrators, and other school staff, and the responses are completed and submitted electronically. The completion time is not reported; based on the number of items, we estimate it will take about 7–10 minutes. It measures two major constructs: relational supports and organizational supports. For more information, see You et al. (2012) or http://cscs.wested.org/faqs_outside_ca.
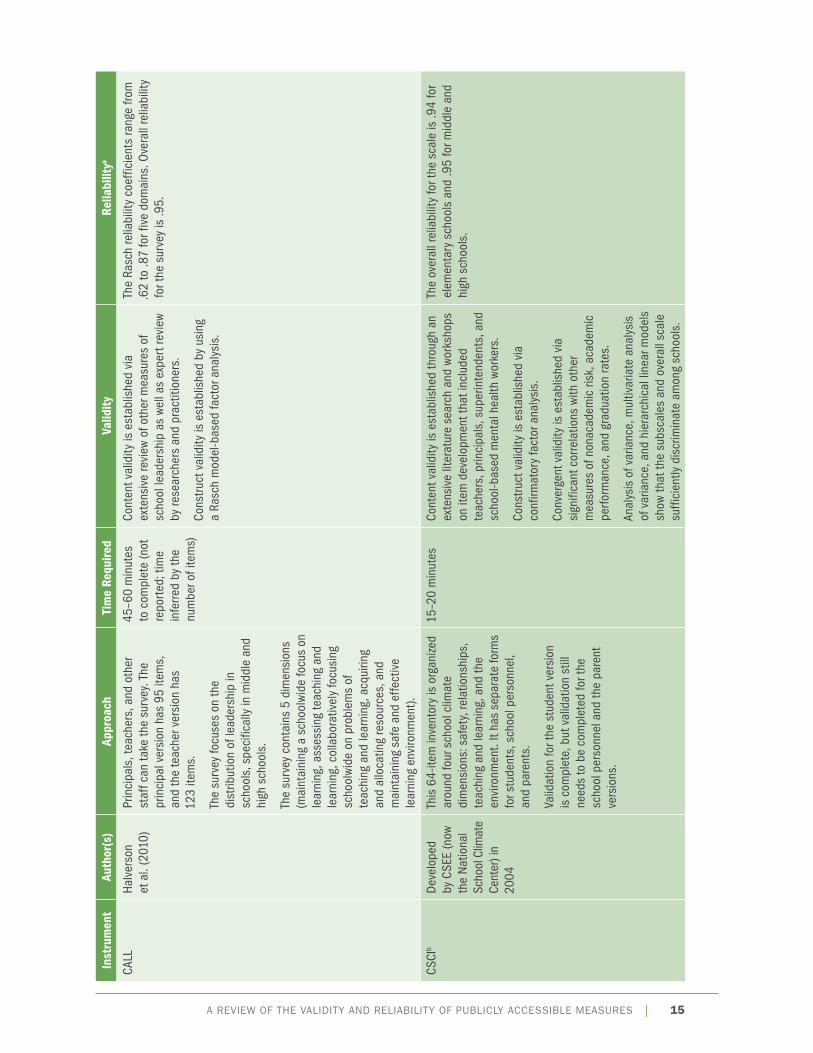
Comprehensive Assessment of Leadership for Learning
The Wisconsin Center for Educational Research (WCER) created the Comprehensive Assessment of Learning for Learning (CALL). This survey instrument is the only survey reviewed for this brief that was developed as a formative feedback tool for school leaders. CALL gathers data from principals, school staff, and teachers and is intended for middle schools and high schools. WCER will soon be developing an elementary school version. The completion time for this survey is approximately 45–60 minutes. CALL captures current leadership practices in 5 domains: focus on learning, monitoring teaching and learning, building nested learning communities, acquiring and allocating resources, and maintaining a safe and effective learning environment. The survey is administered online to administrators and instructional staff and includes an electronic analysis and reporting mechanism. CALL also includes a procedure for ensuring
8 | MEASURING SCHOOL CLIMATE FOR GAUGING PRINCIPAL PERFORMANCE
respondent anonymity through the assignment of special codes. For more information, see Halverson, Kelley, and Dikkers (2010) or http://www.callsurvey.org.
Comprehensive School Climate Inventory
The Center for Social and Emotional Education (CSEE; now the National School Climate Center) developed the Comprehensive School Climate Inventory (CSCI) in 2002 to measure the strengths and the needs of schools by surveying students, parents, and school staff. CSCI has versions available for elementary, middle, and high schools, and the reported completion time is 15–20 minutes. The measured constructs fall under four broad categories: safety, teaching and learning, interpersonal relationships, and institutional environment. The school staff version of the survey measures two additional constructs: leadership and professional relationships. For more information on CSCI, see http://www.schoolclimate.org.
Creating a Great Place to Learn Survey
Developed by the Search Institute (2006), the Creating a Great Place to Learn (CGPL) Survey focuses on the psychosocial and learning environment as experienced by students and staff. The student survey measures 11 dimensions, and the staff survey measures 17 dimensions. The dimensions can be organized into the following 3 categories: relationships, organizational attributes, and personal development. The completion time is not provided; based on the number of items, we estimate it will take about 30 minutes to complete the student survey and about 40 minutes to complete the faculty and staff survey. For more information, see Search Institute (2006) or http://www.search-institute.org/survey-services/surveys/creating-great-place-learn.
Culture of Excellence and Ethics Assessment
The Culture of Excellence and Ethics Assessment (CEEA) from the Institute for Excellence and Ethics is a comprehensive battery of school climate survey tools for students, staff, and parents. It focuses on the cultural assets, or protective factors, provided by school and family culture. The completion time is not provided; based on the number of items, we estimate the student survey to take between 35 and 40 minutes, the staff survey to take between 45 and 50 minutes, and the parent survey to take about 25 minutes to complete. The student and faculty-staff surveys include 3 constructs (with additional subconstructs): safe, supportive, and engaging climate; culture of excellence; and ethics. The faculty-staff survey includes a fourth construct for professional community and school-home partnership. For more information, see http://excellenceandethics.com/assess/ceea.php.
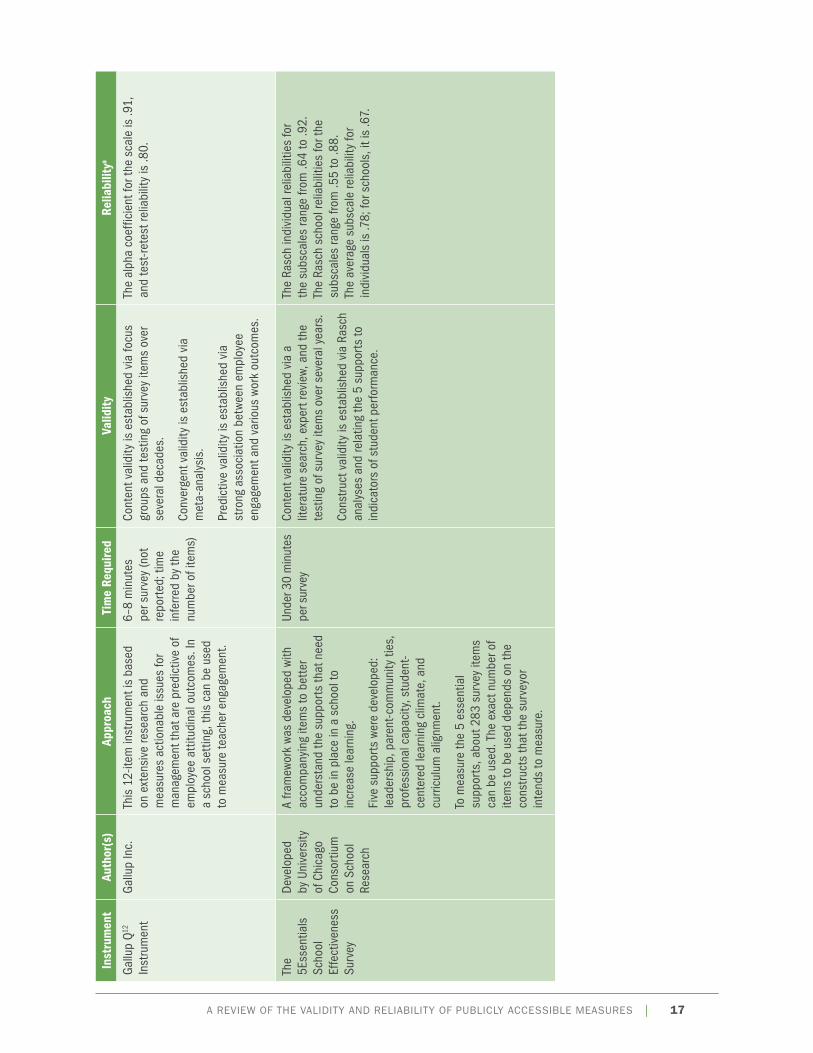
Gallup Q12 Instrument
The Q12 is an employee engagement survey from Gallup. It is an indicator of employee engagement or general workplace climate and measures the involvement and the
A REVIEW OF THE VALIDITY AND RELIABILITY OF PUBLICLY ACCESSIBLE MEASURES | 9
enthusiasm of employees in the workplace. It can be used in a school setting, as a measure of teacher engagement. The completion time is not reported, but based on the number of items, we estimate it to be between 6 and 8 minutes. The Q12 is based on more than 30 years of accumulated quantitative and qualitative research, and the 12 items include an overall satisfaction question followed by items measuring “engagement conditions” such as role clarity, resources, fit between abilities and requirements, receiving feedback, and feeling appreciated (Harter, Schmidt, Killham, & Agrawal, 2009). For more information, see http://www.gallup.com/consulting/52/Employee-Engagement.aspx.
The 5Essentials School Effectiveness Survey
5Essentials from the University of Chicago Consortium on School Research is an evidence-based diagnostic system designed to drive improvement in schools nationwide. The survey is based on more than 20 years of research by the University of Chicago Consortium on School Research on schools and what makes them successful. The 5Essentials system includes comprehensive school effectiveness surveys of students and teachers that measures the following 5 constructs: effective leaders, collaborative teachers, involved families, supportive environment, and ambitious instruction. The student and teacher surveys each take less than 30 minutes to complete and are available in online format. For more information, see http://www.uchicagoimpact.org/5essentials.
Inventory of School Climate-Teacher
Brand, Felner, Seitsinger, Burns, and Bolton (2008) developed the Inventory of School Climate-Teacher (ISC-T) to collect information on teachers’ views of school climate to understand the effect of school climate on school functioning and school reform efforts. The survey is completed by teachers and measures 6 dimensions: peer sensitivity, disruptiveness, teacher-pupil interactions, achievement orientation, support for cultural pluralism, and safety problems. The completion time is not reported; based on the number of items, we estimate that it will require 15–20 minutes to complete. For more information on ISC-T, see Brand et al. (2008).
Organizational Climate Inventory
The Organizational Climate Index (OCI) is a short organizational climate descriptive measure for schools. The index measures 4 dimensions: principal leadership, teacher professionalism, achievement press for students to perform academically, and vulnerability to the community; it is completed by teachers. The completion time is not provided; based on the number of items, we estimate that it will require 15–20 minutes to complete. For more information on OCI, see Hoy, Smith, & Sweetland (2002) and http://www.waynekhoy.com/oci.html.
10 | MEASURING SCHOOL CLIMATE FOR GAUGING PRINCIPAL PERFORMANCE
The Teacher Version of My Class Inventory—Short Form
Sink and Spencer (2007) developed the Teacher Version of My Class Inventory—Short Form as an accountability measure for elementary school counselors to use when evaluating a school’s counseling program. This instrument assesses teachers’ perceptions of the classroom climate as they relate to 5 scales: overall student satisfaction with the learning experience, peer relations, difficulty level of classroom materials, student competitiveness, and school counselor impact on the learning environment. The completion time is not reported; based on the number of items, we estimate it will take approximately 12–15 minutes to complete. For more information, see Sink and Spencer (2007).
School Climate Inventory-Revised
The School Climate Inventory-Revised (SCI-R) was originally developed to determine the effect of school reform efforts. Dean Butler and Martha Alberg (Butler & Alberg, 1991) developed SCI-R for the Center for Research in Educational Policy (CREP) at the University of Memphis. It was published in 1989, and revised in 2002. According to the authors, the survey provides formative feedback to school leaders on personnel perceptions of climate and identifies potential interventions specifically for the climate factors that hinder a school’s effectiveness. The instrument surveys faculty and is intended to be administered in a group setting over a 20-minute period. The measured constructs are order, leadership, environment, involvement, instruction, expectations, and collaboration. For additional information on contractual arrangements for SCI-R administration or use, contact CREP at 901-678-2310 or 1-866-670-6147.
Teaching Empowering Leading and Learning Survey
The Teaching Empowering Leading and Learning (TELL) Survey was published by the New Teacher Center in 2002 and revised in 2011. The revised survey measures 8 constructs: time, facilities and resources, community support and involvement, managing student conduct, teacher leadership, school leadership, professional development, and instructional practices and support. Each construct contains numerous items; states can add, delete, or revise items to align the survey with their specific context. The survey is administered electronically through a centralized hub administered by the New Teacher Center, which provides survey access, data displays, and supportive text to assist with date interpretation. The survey is being used for principal evaluation purposes by states and school districts. The completion time is not reported; based on the number of items, we estimate it will take approximately 20 minutes to complete the survey. For more information, see http://www.newteachercenter.org/node/1359.
A REVIEW OF THE VALIDITY AND RELIABILITY OF PUBLICLY ACCESSIBLE MEASURES | 11
DiscussionSchool principals are responsible for creating a school climate that is amenable to teaching and learning improvement. Policymakers are, logically, investigating school climate surveys as a means of evaluating the outcomes of principals’ work. As policymakers consider measurement options, we believe that they should critically review school climate surveys for technical soundness (validity and reliability) and cost. Valid and reliable climate surveys can contribute to the accuracy, the fairness, and the utility of new principal evaluation systems.
This brief provides policymakers an initial review of school climate surveys that have psychometric testing available for review. Most of the surveys included in this brief have not been developed for the express purpose of evaluating school principals, but they have been validated for research or program evaluation purposes. After reviewing this brief, we encourage policymakers to ask climate survey developers and vendors for information on using the surveys for principal evaluation purposes.
This brief identified 13 school climate surveys that displayed publicly available evidence of psychometric rigor (see Table 1). We believe that it is likely that additional school climate surveys have strong psychometric properties, but we were unable to locate evidence about these surveys through our Internet search or efforts to correspond with authors.
Our review suggests that school climate can be validly and reliably measured through surveys of school staff, parents, and students, and each group provides a different perspective on a school. Eight surveys were intended for use with school staff only, two were written for school staff and students, and three were written for staff, students, and parents. Some climate surveys have versions for certain types of respondents (e.g., SCI-R) that have been validated for use with all types of respondents, while other surveys have been validated for only one type of respondent (e.g., school staff or students). When selecting school climate surveys for principal evaluation or other purposes, it is important to consider the validity of use for different populations and the cost—in terms of the time required for respondents to complete the survey—necessary to gather accurate information about the school and weigh cost against the potential utility of gathering multiple perspectives on school climate.
Policymakers should also closely examine the constructs included in the surveys for alignment with state or district standards. The majority of the school climate surveys that we reviewed focused on school-level conditions that have been associated with improved student achievement and organizational effectiveness, but policymakers should examine these measures in light of principals’ job expectations. If a principal is not responsible for improving certain conditions (e.g., principals may lack budgetary control), then certain climate surveys or certain items within surveys should not be used to measure principal performance. We also found that, with the exception of the CALL survey, the school climate surveys were not necessarily tied to leadership actions but are tied to expected outcomes. Therefore, states and school districts may need to provide principals support when interpreting the results and determining courses of action. The CALL survey specifically examines how well leadership systems in schools are functioning.
12 | MEASURING SCHOOL CLIMATE FOR GAUGING PRINCIPAL PERFORMANCE
The surveys included in this brief also vary on brevity and costs. Accurate and brief surveys can be less financially or politically costly than longer form surveys. Convenient surveys may also have strong response rates, which are very important. The Gallup Q12 and BCSCS (an adapted version of the longer California School Climate Survey) are good examples of surveys designed to be brief. Other surveys measure a host of additional constructs and subconstructs and could take up to 60 minutes to complete, an example being the CALL survey. Although longer surveys can be time consuming, they gather more information on additional constructs. Several surveys also have online interfaces for protecting respondent anonymity, which is critical for supplying principals and other administrators trustworthy information about constituent opinions. Other surveys, such as TELL, 5Essentials, and CALL, can provide analytic services to school districts or states, which reduce the overall costs and make the use of climate surveys more feasible.
A REVIEW OF THE VALIDITY AND RELIABILITY OF PUBLICLY ACCESSIBLE MEASURES | 13
ConclusionAIR has produced this brief in response to state and school district requests for information about the validity and the reliability of existing, publicly available school climate surveys for use as a measure of principal performance. High-quality principal evaluation systems should be technically sound and logically tied to the standards and the purposes driving the evaluation system design. The AIR research team has located 13 school climate surveys that may be useful in measuring the degree to which principals have improved school climate, which is one of several expected outcomes of school-level leadership.
Using valid, reliable, and feasible school climate surveys as one measure of principal practice can provide evaluators a more holistic depiction of principal practice. Engaging in a time-consuming and potentially high-stakes principal performance evaluation without first choosing a scientifically sound measure can be a waste of valuable time and limited financial resources. If an ineffective or an inappropriate tool is used to measure broad-based school climate constructs for assessment purposes, misleading findings can lead to an inaccurate evaluation system and, ultimately, wrong decisions.
This brief reviews technical information on 13 school climate surveys that met the minimum criteria for inclusion in the sample as a starting point for identifying viable measures of principal performance. We emphasize that this is a starting point for selection. Policymakers are encouraged to contact survey vendors or technical experts to conduct an in-depth review of school climate surveys and specifically review surveys for
¡ Financial cost, particularly costs associated with survey analysis and feedback provision.
¡ Training and support for implementation to ensure reliability.
¡ Alignment with evaluation purposes, principal effectiveness definitions, and professional standards.
In addition, policymakers should raise questions with vendors about the applicability of climate surveys for elementary, middle, and high schools and procedures for assuring respondent anonymity (a method of ensuring that the survey respondents can respond honestly) and case study or other information about the use of climate surveys for principal feedback. Finally, we encourage policymakers to network with other states or school districts implementing school climate surveys for principal evaluation to learn more about using survey data for summative and formative evaluation purposes.
14 | MEASURING SCHOOL CLIMATE FOR GAUGING PRINCIPAL PERFORMANCE
Tabl
e 1.
Sch
ool C
limat
e M
easu
res
Inst
rum
ent
Auth
or(s
)Ap
proa
chTi
me
Requ
ired
Valid
ity
Relia
bilit
ya
ASSC
-SCA
IbDe
velo
ped
by
Shin
dler
et a
l. (2
003)
; pu
blis
hed
by
ASS
C
Sepa
rate
sur
veys
for u
se w
ith
facu
lty, s
tude
nts
(ele
men
tary
, se
cond
ary,
and
hig
h sc
hool
), an
d pa
rent
s in
an
indi
vidu
al o
r a g
roup
se
tting
.
The
vario
us v
ersi
ons
rang
e fro
m
30 to
79
item
s, a
nd a
ll ve
rsio
ns
addr
ess
8 di
men
sion
s (p
hysi
cal
envi
ronm
ent,
teac
her i
nter
actio
ns,
stud
ent i
nter
actio
ns, l
eade
rshi
p an
d de
cisi
ons,
dis
cipl
ine
and
man
agem
ent,
lear
ning
and
as
sess
men
t, at
titud
e an
d cu
lture
, an
d co
mm
unity
).
20 m
inut
esCo
nten
t val
idity
is e
stab
lishe
d vi
a lit
erat
ure
revi
ew a
nd th
eore
tical
sup
port
.
Cons
truct
val
idity
is e
stab
lishe
d by
su
bsta
ntia
l cor
rela
tions
am
ong
the
8
dim
ensi
ons.
Pred
ictiv
e va
lidity
is e
vide
nt b
y be
ing
ab
le to
pre
dict
stu
dent
ach
ieve
men
t re
ason
ably
well
base
d on
the
surv
ey s
core
.
The
subs
cale
relia
bilit
y co
effic
ient
s ra
nge
from
.73
to .9
6. T
he o
vera
ll re
liabi
lity
for t
he
scal
e is
.97.
BCSC
ScYo
u et
al.
(200
9)A
15-it
em s
urve
y th
at m
easu
res
2
dim
ensi
ons:
rela
tiona
l sup
port
s an
d or
gani
zatio
nal s
uppo
rts
(ada
pted
from
the
Calif
orni
a Sc
hool
Clim
ate
Surv
ey).
Adm
inis
tere
d to
all
scho
ol s
taff
(teac
hers
, adm
inis
trato
rs, a
nd
othe
rs) t
o as
sess
sch
ool c
limat
e.
7–10
min
utes
(not
re
port
ed; t
ime
infe
rred
by th
e nu
mbe
r of i
tem
s)
Cont
ent v
alid
ity is
bas
ed o
n re
view
of
scho
ol c
limat
e lit
erat
ure
and
19 s
taff
scho
ol c
limat
e su
rvey
s.
Cons
truct
val
idity
is e
stab
lishe
d th
roug
h co
nfirm
ator
y fa
ctor
ana
lysi
s.
The
surv
ey c
onta
ins
two
subs
cale
s:
(1) o
rgan
izat
iona
l sup
port
s: T
he in
tern
al
cons
iste
ncy
of th
e su
bsca
les
rang
es fr
om
.84
to .8
6 fo
r tea
cher
s an
d fro
m .7
9 to
.81
for a
dmin
istra
tor v
ersi
ons
acro
ss e
lem
enta
ry,
mid
dle,
and
hig
h sc
hool
s. T
he a
vera
ge
subs
cale
relia
bilit
y fo
r tea
cher
s is
0.8
5, a
nd
the
aver
age
for a
dmin
istra
tors
is .8
0.
(2) r
elat
iona
l sup
port
s: T
he in
tern
al
cons
iste
ncy
of th
e su
bsca
les
rang
es fr
om
.91
to .9
3 fo
r tea
cher
and
adm
inis
trato
r ve
rsio
ns a
cros
s el
emen
tary
, mid
dle,
and
hi
gh s
choo
ls. T
he a
vera
ge s
ubsc
ale
relia
bilit
y fo
r tea
cher
s is
.85,
and
the
aver
age
for a
dmin
istra
tors
is .8
0.
A REVIEW OF THE VALIDITY AND RELIABILITY OF PUBLICLY ACCESSIBLE MEASURES | 15
Inst
rum
ent
Auth
or(s
)Ap
proa
chTi
me
Requ
ired
Valid
ity
Relia
bilit
ya
CALL
Halv
erso
n
et a
l. (2
010)
Prin
cipa
ls, t
each
ers,
and
oth
er
staf
f can
take
the
surv
ey. T
he
prin
cipa
l ver
sion
has
95
item
s,
and
the
teac
her v
ersi
on h
as
123
item
s.
The
surv
ey fo
cuse
s on
the
dist
ribut
ion
of le
ader
ship
in
scho
ols,
spe
cific
ally
in m
iddl
e an
d hi
gh s
choo
ls.
The
surv
ey c
onta
ins
5 di
men
sion
s (m
aint
aini
ng a
sch
oolw
ide
focu
s on
le
arni
ng, a
sses
sing
teac
hing
and
le
arni
ng, c
olla
bora
tivel
y fo
cusi
ng
scho
olwi
de o
n pr
oble
ms
of
teac
hing
and
lear
ning
, acq
uirin
g an
d al
loca
ting
reso
urce
s, a
nd
mai
ntai
ning
saf
e an
d ef
fect
ive
lear
ning
env
ironm
ent).
45–6
0 m
inut
es
to c
ompl
ete
(not
re
port
ed; t
ime
infe
rred
by th
e nu
mbe
r of i
tem
s)
Cont
ent v
alid
ity is
est
ablis
hed
via
exte
nsiv
e re
view
of o
ther
mea
sure
s of
sc
hool
lead
ersh
ip a
s we
ll as
exp
ert r
evie
w by
rese
arch
ers
and
prac
titio
ners
.
Cons
truct
val
idity
is e
stab
lishe
d by
usi
ng
a Ra
sch
mod
el-b
ased
fact
or a
naly
sis.
The
Rasc
h re
liabi
lity
coef
ficie
nts
rang
e fro
m
.62
to .8
7 fo
r fiv
e do
mai
ns. O
vera
ll re
liabi
lity
for t
he s
urve
y is
.95.
CSCI
bDe
velo
ped
by
CSE
E (n
ow
the
Natio
nal
Scho
ol C
limat
e Ce
nter
) in
2004
This
64-
item
inve
ntor
y is
org
anize
d ar
ound
four
sch
ool c
limat
e di
men
sion
s: s
afet
y, re
latio
nshi
ps,
teac
hing
and
lear
ning
, and
the
envi
ronm
ent.
It ha
s se
para
te fo
rms
for s
tude
nts,
sch
ool p
erso
nnel
, an
d pa
rent
s.
Valid
atio
n fo
r the
stu
dent
ver
sion
is
com
plet
e, b
ut v
alid
atio
n st
ill
need
s to
be
com
plet
ed fo
r the
sc
hool
per
sonn
el a
nd th
e pa
rent
ve
rsio
ns.
15–2
0 m
inut
esCo
nten
t val
idity
is e
stab
lishe
d th
roug
h an
ex
tens
ive
liter
atur
e se
arch
and
wor
ksho
ps
on it
em d
evel
opm
ent t
hat i
nclu
ded
teac
hers
, prin
cipa
ls, s
uper
inte
nden
ts, a
nd
scho
ol-b
ased
men
tal h
ealth
wor
kers
.
Cons
truct
val
idity
is e
stab
lishe
d vi
a co
nfirm
ator
y fa
ctor
ana
lysi
s.
Conv
erge
nt v
alid
ity is
est
ablis
hed
via
sign
ifica
nt c
orre
latio
ns w
ith o
ther
m
easu
res
of n
onac
adem
ic ri
sk, a
cade
mic
pe
rform
ance
, and
gra
duat
ion
rate
s.
Anal
ysis
of v
aria
nce,
mul
tivar
iate
ana
lysi
s of
var
ianc
e, a
nd h
iera
rchi
cal l
inea
r mod
els
show
that
the
subs
cale
s an
d ov
eral
l sca
le
suffi
cien
tly d
iscr
imin
ate
amon
g sc
hool
s.
The
over
all r
elia
bilit
y fo
r the
sca
le is
.94
for
elem
enta
ry s
choo
ls a
nd .9
5 fo
r mid
dle
and
high
sch
ools
.
16 | MEASURING SCHOOL CLIMATE FOR GAUGING PRINCIPAL PERFORMANCE
Inst
rum
ent
Auth
or(s
)Ap
proa
chTi
me
Requ
ired
Valid
ity
Relia
bilit
ya
CGPL
Sur
vey
Sear
ch
Inst
itute
(2
006)
Focu
s on
psy
chos
ocia
l and
le
arni
ng e
nviro
nmen
t as
expe
rienc
ed b
y st
uden
ts
and
staf
f.Th
ere
are
11 d
imen
sion
s
(55
item
s) in
the
stud
ent s
urve
y an
d 17
dim
ensi
ons
(76
item
s)
in th
e st
aff s
urve
y. Th
ere
are
3
cate
gorie
s of
dim
ensi
ons:
re
latio
nshi
ps, o
rgan
izatio
nal
attri
bute
s, a
nd p
erso
nal
deve
lopm
ent.
Not p
rovi
ded
(est
imat
ed a
s
30 m
inut
es fo
r th
e st
uden
t su
rvey
and
40
min
utes
for
the
facu
lty/s
taff
surv
ey)
Cont
ent v
alid
ity is
est
ablis
hed
by
theo
retic
al a
nd e
mpi
rical
wor
k in
ed
ucat
iona
l psy
chol
ogy.
Disc
rimin
ant a
nd c
onve
rgen
t val
idity
is
esta
blis
hed
via
corre
latio
ns w
ith o
ther
sc
ales
in th
e su
rvey
.
Cons
truct
val
idity
is e
stab
lishe
d vi
a fa
ctor
an
alys
is.
Pred
ictiv
e va
lidity
is e
stab
lishe
d th
roug
h si
gnifi
cant
cor
rela
tions
bet
wee
n di
men
sion
s an
d st
uden
t gra
de p
oint
av
erag
e.
Low
to m
oder
ate:
The
stu
dent
sur
vey
dim
ensi
on re
liabi
litie
s ra
nge
from
.60
to .8
5.
(Not
e: M
ost d
imen
sion
s ha
ve 4
or f
ewer
ite
ms,
whi
ch h
ampe
rs re
liabi
lity.)
The
test
-re
test
relia
bilit
ies
for d
imen
sion
s ra
nge
from
.6
1 to
.87.
Low
to h
igh:
The
facu
lty/s
taff
surv
ey
dim
ensi
on re
liabi
litie
s ra
nge
from
.68
to .8
5.
(Not
e: M
ost d
imen
sion
s ha
ve 5
or f
ewer
ite
ms,
whi
ch h
ampe
rs re
liabi
lity.)
The
test
-re
test
relia
bilit
ies
for d
imen
sion
s ra
nge
from
.6
5 to
.90.
CEEA
Inst
itute
for
Exce
llenc
e an
d Et
hics
Sepa
rate
stu
dent
, fac
ulty
/sta
ff,
and
pare
nt s
urve
ys.
Stud
ent (
75 it
ems)
and
facu
lty/
staf
f sur
veys
(105
item
s) in
clud
e
3 co
nstru
cts
(with
add
ition
al
subc
onst
ruct
s): s
afe,
sup
port
ive,
an
d en
gagi
ng c
limat
e; c
ultu
re o
f ex
celle
nce;
and
eth
ics
(sep
arat
e st
uden
t beh
avio
rs a
nd fa
culty
/sta
ff pr
actic
es c
onst
ruct
s fo
r cul
ture
of
exce
llenc
e an
d et
hics
). Fa
culty
/st
aff s
urve
y al
so in
clud
es a
four
th
cons
truct
for p
rofe
ssio
nal
com
mun
ity a
nd s
choo
l/ho
me
part
ners
hip.
The
par
ent s
urve
y
(54
item
s) in
clud
es 5
con
stru
cts:
pa
rent
s’ p
erce
ptio
ns o
f sch
ool
cultu
re, s
choo
l eng
agin
g pa
rent
s,
pare
nts
enga
ging
with
sch
ool,
lear
ning
at h
ome/
prom
otin
g ex
celle
nce,
and
par
entin
g/pr
omot
ing
ethi
cs.
Not p
rovi
ded
(est
imat
ed a
s 35
–40
min
utes
fo
r the
stu
dent
su
rvey
, 45
–50
min
utes
fo
r the
facu
lty/
staf
f sur
vey,
an
d 25
min
utes
fo
r the
par
ent
surv
ey)
Prac
titio
ners
and
rese
arch
exp
erts
es
tabl
ishe
d co
nten
t val
idity
thro
ugh
revi
ews
of it
ems.
Disc
rimin
ant a
nd c
onve
rgen
t val
idity
is
esta
blis
hed
via
corre
latio
ns w
ith e
xter
nal
scal
es.
Mod
erat
e to
hig
h: s
tude
nt s
urve
y co
nstru
ct
relia
bilit
ies
rang
e fro
m .8
5 to
.91.
Mod
erat
e to
hig
h: fa
culty
/sta
ff su
rvey
co
nstru
ct re
liabi
litie
s ra
nge
from
.84
to .9
3.
Mod
erat
e to
hig
h (a
part
from
one
con
stru
ct
with
low
relia
bilit
y): p
aren
t sur
vey
cons
truct
re
liabi
litie
s ra
nge
from
.64
to .9
1 wi
th a
hi
gh s
choo
l/m
iddl
e sc
hool
sam
ple
and
from
.6
8 to
.92
for a
n el
emen
tary
sch
ool s
ampl
e.
(Not
e: T
he c
onst
ruct
relia
bilit
ies
that
are
.64
and
.68
are
for a
con
stru
ct w
ith o
nly
5 ite
ms.
)
A REVIEW OF THE VALIDITY AND RELIABILITY OF PUBLICLY ACCESSIBLE MEASURES | 17
Inst
rum
ent
Auth
or(s
)Ap
proa
chTi
me
Requ
ired
Valid
ity
Relia
bilit
ya
Gallu
p Q12
In
stru
men
tGa
llup
Inc.
This
12-
item
inst
rum
ent i
s ba
sed
on e
xten
sive
rese
arch
and
m
easu
res
actio
nabl
e is
sues
for
man
agem
ent t
hat a
re p
redi
ctiv
e of
em
ploy
ee a
ttitu
dina
l out
com
es. I
n a
scho
ol s
ettin
g, th
is c
an b
e us
ed
to m
easu
re te
ache
r eng
agem
ent.
6–8
min
utes
pe
r sur
vey
(not
re
port
ed; t
ime
infe
rred
by th
e nu
mbe
r of i
tem
s)
Cont
ent v
alid
ity is
est
ablis
hed
via
focu
s gr
oups
and
test
ing
of s
urve
y ite
ms
over
se
vera
l dec
ades
.
Conv
erge
nt v
alid
ity is
est
ablis
hed
via
met
a-an
alys
is.
Pred
ictiv
e va
lidity
is e
stab
lishe
d vi
a
stro
ng a
ssoc
iatio
n be
twee
n em
ploy
ee
enga
gem
ent a
nd v
ario
us w
ork
outc
omes
.
The
alph
a co
effic
ient
for t
he s
cale
is .9
1,
and
test
-ret
est r
elia
bilit
y is
.80.
The
5Ess
entia
ls
Scho
ol
Effe
ctiv
enes
s Su
rvey
Deve
lope
d
by U
nive
rsity
of
Chi
cago
Co
nsor
tium
on
Sch
ool
Rese
arch
A fra
mew
ork
was
deve
lope
d wi
th
acco
mpa
nyin
g ite
ms
to b
ette
r un
ders
tand
the
supp
orts
that
nee
d to
be
in p
lace
in a
sch
ool t
o in
crea
se le
arni
ng.
Five
sup
port
s we
re d
evel
oped
: le
ader
ship
, par
ent-c
omm
unity
ties
, pr
ofes
sion
al c
apac
ity, s
tude
nt-
cent
ered
lear
ning
clim
ate,
and
cu
rricu
lum
alig
nmen
t.
To m
easu
re th
e 5
esse
ntia
l su
ppor
ts, a
bout
283
sur
vey
item
s ca
n be
use
d. T
he e
xact
num
ber o
f ite
ms
to b
e us
ed d
epen
ds o
n th
e co
nstru
cts
that
the
surv
eyor
in
tend
s to
mea
sure
.
Unde
r 30
min
utes
pe
r sur
vey
Cont
ent v
alid
ity is
est
ablis
hed
via
a lit
erat
ure
sear
ch, e
xper
t rev
iew,
and
the
test
ing
of s
urve
y ite
ms
over
sev
eral
yea
rs.
Cons
truct
val
idity
is e
stab
lishe
d vi
a Ra
sch
anal
yses
and
rela
ting
the
5 su
ppor
ts to
in
dica
tors
of s
tude
nt p
erfo
rman
ce.
The
Rasc
h in
divi
dual
relia
bilit
ies
for
the
subs
cale
s ra
nge
from
.64
to .9
2.
The
Rasc
h sc
hool
relia
bilit
ies
for t
he
subs
cale
s ra
nge
from
.55
to .8
8.
The
aver
age
subs
cale
relia
bilit
y fo
r in
divi
dual
s is
.78;
for s
choo
ls, i
t is
.67.
18 | MEASURING SCHOOL CLIMATE FOR GAUGING PRINCIPAL PERFORMANCE
Inst
rum
ent
Auth
or(s
)Ap
proa
chTi
me
Requ
ired
Valid
ity
Relia
bilit
ya
ISC-
TBr
and
et a
l. (2
008)
This
29-
item
ass
essm
ent
addr
esse
s 6
dim
ensi
ons
(pee
r se
nsiti
vity
, dis
rupt
iven
ess,
teac
her-
pupi
l int
erac
tions
, ach
ieve
men
t or
ient
atio
n, s
uppo
rt fo
r cul
tura
l pl
ural
ism
, saf
ety
prob
lem
s). I
t co
llect
s in
form
atio
n ab
out
teac
hers
’ vie
w of
sch
ool c
limat
e.
15–2
0 m
inut
es
per s
urve
y (n
ot
repo
rted
; tim
e in
ferre
d by
the
num
ber o
f ite
ms)
Ther
e is
ext
ensi
ve v
alid
atio
n ac
ross
thre
e st
udie
s.
Cont
ent v
alid
ity is
bas
ed o
n ex
tens
ive
liter
atur
e re
view
of e
xist
ing
mea
sure
s (in
clud
ing
ISC-
S [s
tude
nt v
ersi
on])
of
educ
atio
nal c
limat
e as
wel
l as
liter
atur
e on
how
wel
l ado
lesc
ents
ada
pt to
lear
ning
en
viro
nmen
ts.
Cons
truct
val
idity
is e
stab
lishe
d th
roug
h ex
plor
ator
y an
d co
nfirm
ator
y fa
ctor
an
alys
is u
sing
div
erse
sam
ples
of s
choo
ls.
Conv
erge
nt a
nd d
iver
gent
val
idity
is
esta
blis
hed
with
mod
erat
e re
latio
nshi
ps
betw
een
ISC-
S an
d IS
C-T.
The
alph
a co
effic
ient
s fo
r sub
scal
es ra
nge
from
.57
to .8
6, w
ith m
ost s
ubsc
ale
relia
bilit
ies
grea
ter t
han
.76.
The
alp
ha
coef
ficie
nt fo
r ent
ire s
urve
y is
.89.
OCI
Hoy,
Sm
ith,
& S
weet
land
(2
002)
This
30-
item
inst
rum
ent
mea
sure
s 4
dim
ensi
ons:
pr
inci
pal l
eade
rshi
p, te
ache
r pr
ofes
sion
alis
m, a
chie
vem
ent
pres
s fo
r stu
dent
s to
per
form
ac
adem
ical
ly, a
nd v
ulne
rabi
lity
to
the
com
mun
ity.
15–2
0 m
inut
es
(not
repo
rted
; tim
e in
ferre
d
by th
e nu
mbe
r of
item
s)
Cont
ent v
alid
ity is
est
ablis
hed
via
a se
ries
of e
mpi
rical
, con
cept
ual,
and
stat
istic
al te
sts.
Cons
truct
val
idity
is e
stab
lishe
d vi
a co
nfirm
ator
y fa
ctor
ana
lysi
s.
The
subs
cale
relia
bilit
y co
effic
ient
s ra
nge
from
.87
to .9
5.
TMCI
-SF
Sink
&
Spen
cer
(200
7)
This
24-
item
inst
rum
ent h
as
5 fa
ctor
s: s
atis
fact
ion,
co
mpe
titiv
enes
s, d
iffic
ulty
, pe
er re
latio
ns, a
nd S
CI (s
choo
l co
unse
lor i
mpa
ct o
r inf
luen
ce).
12–1
5 m
inut
es
(not
repo
rted
; tim
e in
ferre
d
by th
e nu
mbe
r of
item
s)
Cont
ent v
alid
ity is
est
ablis
hed
via
a lit
erat
ure
sear
ch.
Cons
truct
val
idity
is e
stab
lishe
d th
roug
h ex
plor
ator
y an
d co
nfirm
ator
y fa
ctor
an
alys
is.
The
subs
cale
alp
ha c
oeffi
cien
ts ra
nge
from
.5
7 to
.88,
with
mos
t sub
scal
e re
liabi
litie
s gr
eate
r tha
n or
equ
al to
.73.
The
ave
rage
su
bsca
le re
liabi
lity
is .7
7.
A REVIEW OF THE VALIDITY AND RELIABILITY OF PUBLICLY ACCESSIBLE MEASURES | 19
Inst
rum
ent
Auth
or(s
)Ap
proa
chTi
me
Requ
ired
Valid
ity
Relia
bilit
ya
SCI-R
bDe
velo
ped
by
But
ler
and
Albe
rg
(orig
inal
ly
publ
ishe
d
in 1
989
and
revi
sed
in
2002
); re
sear
ch o
n in
stru
men
t pr
esen
ted
in
Butle
r and
Ra
kow
(199
5);
publ
ishe
d by
CR
EP
This
49-
item
ass
essm
ent t
hat
addr
esse
s 7
dim
ensi
ons:
ord
er,
lead
ersh
ip, e
nviro
nmen
t, in
volv
emen
t, in
stru
ctio
n,
expe
ctat
ions
, and
col
labo
ratio
n.
It is
adm
inis
tere
d to
facu
lty o
nly.
20 m
inut
esCo
nten
t val
idity
is b
ased
on
a re
view
of
lite
ratu
re o
n fa
ctor
s as
soci
ated
with
ef
fect
ive
scho
ols
and
orga
niza
tiona
l cl
imat
es.
Cons
truct
val
idity
is c
onfir
med
dur
ing
th
e de
velo
pmen
t of t
he s
urve
y in
that
the
item
s an
d sc
ales
can
dis
crim
inat
e am
ong
scho
ols.
The
inte
rnal
relia
bilit
y co
effic
ient
s fo
r the
7
subs
cale
s ra
nge
from
.73
to .8
4. T
he
aver
age
subs
cale
relia
bilit
y is
.76.
TELL
Sur
vey
Rese
arch
on
mea
sure
re
port
ed b
y Sw
anlu
nd
(201
1);
publ
ishe
d
by th
e Ne
w Te
ache
r Cen
ter
The
revi
sed
surv
ey m
easu
res
8
cons
truct
s (ti
me,
faci
litie
s an
d re
sour
ces,
com
mun
ity s
uppo
rt an
d in
volv
emen
t, m
anag
ing
stud
ent
cond
uct,
teac
her l
eade
rshi
p,
scho
ol le
ader
ship
, pro
fess
iona
l de
velo
pmen
t, an
d in
stru
ctio
nal
prac
tices
and
sup
port)
. Eac
h co
nstru
ct c
onta
ins
num
erou
s ite
ms;
sta
tes
can
add,
del
ete,
or
revi
se it
ems
to a
lign
the
surv
ey
with
thei
r spe
cific
con
text
.
Abou
t 20
min
utes
Cont
ent v
alid
ity is
est
ablis
hed
thro
ugh
an
exte
nsiv
e lit
erat
ure
revi
ew, i
tem
-mea
sure
co
rrela
tions
, and
the
fit o
f the
item
s to
m
odel
exp
ecta
tions
.
Valid
ity is
est
ablis
hed
via
Rasc
h an
alys
is.
The
Rasc
h re
liabi
lity
coef
ficie
nts
for
subs
cale
s ra
nge
from
.80
to .9
8. T
he
aver
age
subs
cale
relia
bilit
y is
.91.
a All
aver
age
relia
bilit
y co
effic
ient
s in
this
tabl
e we
re c
alcu
late
d us
ing
Fish
er’s
z tr
ansf
orm
atio
n. b D
enot
es a
n in
stru
men
t tha
t was
iden
tifie
d by
Gan
gi (2
010)
as
bein
g co
nten
t and
ps
ycho
met
rical
ly s
ound
. c BCS
CS is
incl
uded
in li
eu o
f the
com
plet
e ve
rsio
n of
the
surv
ey b
ecau
se th
e co
mpl
ete
vers
ion
has
not b
een
valid
ated
as
of 2
011.
20 | MEASURING SCHOOL CLIMATE FOR GAUGING PRINCIPAL PERFORMANCE
ReferencesAmerican Institutes for Research. (2011). School climate survey compendium. Washington,
DC: Author. Retrieved April 12, 2012, from http://safesupportiveschools.ed.gov/index.php?id=133
Anderson, C. (1982). The search for school climate: A review of the research. Review of Educational Research, 52(3), 368–420.
Brand, S., Felner, R., Seitsinger, A., Burns, A., & Bolton, N. (2008). A large scale study of the assessment of the social environment of middle and secondary schools: The validity and utility of teachers’ ratings of school climate, cultural pluralism, and safety problems for understanding school effects and school improvement. Journal of School Psychology, 46, 507–535.
Bryk, A., & Driscoll, M. (1988). The high school as community: Contextual influences and consequences for students and teachers. Madison: University of Wisconsin, National Center on Effective Secondary Schools.
Butler, E. D., and Alberg, M. J. (1991). Tennessee School Climate Inventory: A Resource Manual. Memphis, TN: Center for Research in Education Policy.
Butler, D. E., & Rakow, J. (1995, July). Sample Tennessee school climate profile. Memphis, TN: University of Memphis, Center for Research in Educational Policy.
Clifford, M., Hansen, U., Lemke, M., Wraight, S., Menon, R., Brown-Sims, M., et al. (2011). A practical guide to designing comprehensive principal evaluation systems. Washington, DC: The National Comprehensive Center for Teacher Quality.
Clifford, M., & Ross, S. (2011). Designing principal evaluation systems: Research to guide decision-making. Washington, DC: National Association of Elementary School Principals.
Condon, C., & Clifford, M. (2010). Measuring principal performance: How rigorous are commonly used principal performance assessment instruments? Washington, DC: American Institutes for Research. Retrieved April 12, 2012, from http://www.learningpt.org/pdfs/QSLBrief2.pdf.
Council of Chief State School Officers. (2008). Educational leadership policy standards: ISLLC 2008. Washington, DC: Author.
Deal, T. & Peterson, K. (1999). The shaping of school culture fieldbook. San Francisco: Jossey-Bass Press.
DeNisi, A. S., & Kluger, A. N. (2000). Feedback effectiveness: Can 360-degree appraisals be improved? Academy of Management Executive, 14(1), 129–139.
Gangi, T. (2010). School climate and faculty relationships: Choosing an effective assessment measure. Unpublished doctoral dissertation, St. John’s University, New York.
Goldring, E., Cravens, X., Porter, A., Murphy, J., & Elliott, S. N. (2007). The state of educational leadership evaluation: What do states and districts assess? Unpublished manuscript, Vanderbilt University.
Hallinger, P., & Heck, R. (1998). Exploring the principal’s contribution to school effectiveness: 1980–1995. School Effectiveness and School Improvement, 9(2), 157–191.
Halverson, R., Kelley, C., & Dikkers, S. (2010, October). Comprehensive assessment of leadership for learning. Paper presented at the annual meeting of the University Council of Educational Administration, New Orleans, LA.
Harter, J. K., Schmidt, F. L., Killham, E. A., & Agrawal, S. (2009). Q12 meta-analysis: The relationship between engagement at work and organizational outcomes. Washington, DC: Gallup Inc.
Hoy, W. K., Smith, P. A., & Sweetland, S. R. (2002). The development of the organizational climate index for high schools: Its measure and relationship to faculty trust. The High School Journal, 86, 38–49.
A REVIEW OF THE VALIDITY AND RELIABILITY OF PUBLICLY ACCESSIBLE MEASURES | 21
Joint Committee on Standards for Educational Evaluation. (2010). Personnel evaluation standards. Iowa City, IA: Author. Retrieved April 12, 2012, from http://www.jcsee.org/personnel-evaluation-standards
Khmelkov, V. T., & Davidson, M. L. (2009). Culture of excellence and ethics assessments: Description and theory. LaFayette, NY: Institute for Excellence and Ethics.
Leithwood, K., Louis, K., Anderson, S., & Wahlstrom, K. (2004). How leadership influences student learning (Review of Research). New York: The Wallace Foundation. Retrieved April 12, 2012, from http://www.wallacefoundation.org/knowledge-center/school-leadership/key-research/Documents/How-Leadership-Influences-Student-Learning.pdf
Mowday, R. T., Porter, W. L., & Steers, R. M. (1982). Employee-organization linkages: The psychology of commitment, absenteeism and turnover. New York: Academic Press.
Miles, M., & Huberman, A. (1994). Qualitative data analysis: An expanded sourcebook. Thousand Oaks, CA: Sage.
National Association of Elementary School Principals. (2009). Professional standards. Washington, DC: Author.
Reid, K. (1983). Retrospection and persistent school absenteeism. Educational Research, 25, 110–115.
Sanders, N., & Kearney, K. (2011). A brief overview of principal evaluation literature. San Francisco, CA: WestEd.
Search Institute. (2006). Search Institute’s Creating a Great Place to Learn Survey: A survey of school climate [Technical Manual]. Minneapolis: Author. Retrieved April 12, 2012, from http://www.search-institute.org/system/files/School+Climate--Tech+Manual.pdf
Sebring, P. B., Allensworth, E., Bryk, A. S., Easton, J. Q., & Luppescu, S. (2006). The essential supports for school improvement. Chicago: Consortium on Chicago School Research.
Shindler, J., Jones, A., Williams, A., Taylor, C., & Cardenas, H. (2009, January). Exploring below the surface: School climate assessment and improvements as the key to bridging the achievement gap. Paper presented at the annual meeting of the Washington State Office of the Superintendent of Public Instruction, Seattle, WA.
Shindler, J., Taylor, C., Cadenas, H., & Jones, A. (2003, April). Sharing the data along with the responsibility: Examining an analytic scale-based model for assessing school climate. Paper presented at the annual meeting of the American Educational Research Association, Chicago, IL.
Sink, C. A., & Spencer, L. R. (2007). Teacher version of the My Class Inventory—Short Form: An accountability tool for elementary school counselors. Professional School Counseling, 11(2), 129–139.
Swanlund, A. (2011). Identifying working conditions that enhance teacher effectiveness: The psychometric evaluation of the Teacher Working Conditions Survey. Chicago: American Institutes for Research.
Wu, S. C., Pink, W., Crain, R., & Moles, O. (1982). Student suspension: A critical reappraisal. Urban Review, 14, 245–303.
Wynn, S. R., Carboni, L. W., & Patell, E. (2007). Beginning teachers’ perceptions of mentoring, climate, and leadership: Promoting retention through a learning communities perspective. Leadership and Policy in Schools, 6(3), 209–229.
You, S., O’Malley, M., & Furlong, M. J. (2012). Brief California School Climate Survey: Dimensionality and measurement invariance across teachers and administrator. Manuscript submitted for publication. Retrieved April 12, 2012, from http://web.me.com/michaelfurlong/HKIED/Welcome_files/MJF-CSCS-Nov7.pdf
This work was originally produced in whole or in part with funds from the U.S. Department of Education’s Fund for the Improvement of Education (FIE) Earmark Grant Awards Program under grant number U215K080187. The content does not necessarily reflect the position or policy of the Education Department, nor does mention or visual representation of trade names, commercial products, or organizations imply endorsement.
1849_04/12
Making Research Relevant
1000 Thomas Jefferson Street, NWWashington, DC 20007877.334.3499 | 202.403.5000