Measuring School Effectiveness . Technical Report on the 2011 Value-added Model. Value-Added Research Center | Wisconsin Center for Educational Research | University of Wisconsin-Madison Technical Report July 2014
Transcript
MeasuringSchoolEffectiveness.Technical Report on the 2011 Value-added Model.
Value-Added Research Center | Wisconsin Center for Educational Research | University of Wisconsin-Madison
Technical Report July 2014
Measuring School Effectiveness Technical Report | September 2012 2
The National Center on Scaling Up Effective Schools (NCSU) is a national research and development center that focuses on identifying the combination of essential components and the programs, practices, processes and policies that make some high schools in large urban districts particularly effective with low income students, minority students, and English language learners. The Center’s goal is to develop, implement, and test new processes that other districts will be able to use to scale up effective practices within the context of their own goals and unique circumstances. Led by Vanderbilt University’s Peabody College, our partners include The University of North Carolina at Chapel Hill, Florida State University, the University of Wisconsin-Madison, Georgia State University, and the Education Development Center.
This paper is part of our technical report series and was written by:
Value-Added Research Center Wisconsin Center for Educational Research University of Wisconsin-Madison
This research was conducted with funding from the Institute of Education Sciences (R305C10023). The opinions expressed in this article are those of the authors and do not necessarily represent the views of the sponsor.
Measuring School Effectiveness Technical Report | July 2014 3
Introduction.
High school dropout, enrollment, and graduation rates are important indicators of students’ college and career readiness, which in turn significantly impact both individual income levels and the overall knowledge-driven economy. As such, extensive research has been conducted in this field, leading to studies that have demonstrated a high correlation between these high school measures and multiple long-term outcomes. For example, holding a high school diploma (or a General Education Diploma) for adults 25 or older significantly raises their probability of joining the labor force as well as of being employed.1 Despite the long-term benefits of a high school education, much of the current literature on raising school effectiveness excludes high schools. This has resulted in a lack of attention given to the unique challenges facing evaluation of school effectiveness at the high school level.
The National Center on Scaling Up Effective Schools (NCSU) is a partnership between Vanderbilt University, the Florida State University, the University of Wisconsin-Madison, and the Education Development Center that strives to explore these unique issues faced by high schools. The purpose of NCSU is twofold: 1) to identify essential programs, practices, processes, and policies that allow some high schools in large urban districts (with low-income students, minority students, and English language learners) to be particularly effective; and 2) to develop processes to both effectively and efficiently transfer these practices to less effective schools.2 Value-added analysis is integral to the dual purpose of the DESC as it identifies both the effective and ineffective high schools by measuring school effectiveness.
Value-added analysis measures the contribution of education units (classrooms and schools) and agents (teachers and principals) to student performance by isolating their effects from external sources of student outcomes (e.g. prior knowledge and student characteristics). In practice, value-added models usually use the improvement of student performance on standardized tests as the student outcome measure. The focus on test-score improvement is based on the idea that comparing a student's measured knowledge before and after instruction isolates the effects of teachers and/or schools from other influences experienced over the student's lifetime. Value-added models attempt to identify the effects of schools and teachers by using statistical models, which in turn use available data to measure school effectiveness. However, substantial variation exists across specific value-added models, depending on the availability of data and the purpose of the value-added analysis.
The value-added model for the 2011 NCSU initiative was developed using data from the Fort Worth Independent School District (FWISD) of Texas. The FWISD value-added model uses a large set of student- and school-level characteristics to identify the extent to which schools
1 Chapman, C., Laird, J., and KewalRamani, A. (2010). Trends in High School Dropout and Completion Rates in the United States: 1972–2008 (NCES 2011-012). National Center for Education Statistics, Institute of Education Sciences, U.S. Department of Education. Washington, DC. Retrieved 28 August 2011 from http://nces.ed.gov/pubsearch. 2 For additional information on the distinctive characteristics of secondary schools, please refer to the proposal.
Measuring School Effectiveness Technical Report | July 2014 4
contribute to student achievement outcomes. In particular, a school-level value-added model was designed to accommodate the purpose of the value-added model, which was to help identify the top and bottom two high schools in school effectiveness for observation. This technical report describes the value-added model used by NCSU and developed in association with the Value-Added Research Center of the Wisconsin Center for Education Research at the University of Wisconsin-Madison. The following report is divided into four parts:
• description of the datasets used to produce the value-added estimates;
• model specifications used to estimate value added for high schools in FWISD;
• analysis of the value-added results; and
• selection of high and low value-added schools for qualitative study.
Measuring School Effectiveness Technical Report | July 2014 5
Analysis Dataset.
The TAKS (Texas Assessment of Knowledge and Skills) data files, which were developed and compiled by the TEA (Texas Education Agency)3, comprised the raw data files used to produce the value-added results for FWISD. The TAKS data files included both the student test outcome variables and the pertinent student-level demographic variables needed to estimate the value-added model.
Multiple analysis datasets were then produced from these raw data files to implement the FWISD value-added model. More specifically, a separate analysis dataset was produced for each subgroup (all, free- and reduced-price lunch, limited English proficiency, special education, black, Hispanic), subject (reading, math, science), and school year (2008-09, 2009-10, 2010-11), totaling 54 datasets.
For each analysis dataset, the value-added model produced value-added measures for each student, which were then aggregated to produce grade-level value-added measures, and again aggregated to produce school-level value-added measures.4 The resulting school-level value-added measures were then used to identify the most and least effective high schools in FWISD. The following section describes the student-level variables included in the analysis datasets in greater detail.
Student-level Variables
Posttest and Pretest Variables The test scores used in the dataset were TAKS scale scores in reading, math, and science for students in grades 8 through 12 for years 2008-20115. The administration of TAKS imposed some constraints on the value-added model. First, the science assessment for TAKS was not administered to 9th graders; as such, the science value-added measure for each school is comprised of fewer students. Second, reading and math scores from the 2009-2010 school year used multiple conversion scales between raw scores and scale scores. In other words, a particular raw score would be converted to multiple scale scores; the scale scores were all standardized by using the conversion scale provided by the TAKS Technical Digest published by the TEA.
For the purpose of value-added analysis, scale scores from the TAKS assessments were “normalized” by being converted into z-scores. The purpose of normalization is to make student test scores comparable across all TAKS tests. For example, assume Student A and Student B both
3 Additional raw data files from FWISD included student- and teacher-level data as well as student-teacher linkage data. However, as the purpose of the project was to identify effective and ineffective schools, only the student-level data was used, which was then aggregated to ultimately produce the school-level value-added results. Of the student-level data available, the TAKS dataset was used as it yielded the larger sample size. 4 The intermediary step of producing grade-level value added before aggregating to school-level estimates was to adjust for across-grade differences. 5 8th grade test scores were only used for pretest scores for the posttest 9th graders.
Measuring School Effectiveness Technical Report | July 2014 6
took the 2008-09 math TAKS test for 9th and 11th grades, respectively, and received scores of 27 and 29. While these students attained different scale scores, it is possible for these students to have the same z-score of -0.5; a z-score of -0.5 would signify that both Student A and Student B tested -0.5 standard deviations (unit of normalized distribution) below the average 9th and 11th grade student who took the math TAKS test, respectively. Thus, Students A and B performed equally compared to the other students of their grades who took the math TAKS tests, even though their scale scores differed. The normalization was done by subtracting the average scale score from each individual student’s scale score within subject, grade, and year. The result was then divided by the standard deviation, calculated by using the sample of student test scores of that subject, grade, and year. Both the mean scale score values and standard deviation values were available from the TAKS Technical Digest.
Standard Errors of Measurement of Pretest Variables No assessment can perfectly measure a student’s knowledge on the tested subject. The resulting deviation between a student’s true knowledge and the observed knowledge as measured by the assessment is referred to as “measurement error”. Standard errors of measurement are used to correct for this inherent measurement error. The standard errors of measurement (SEM) of reading, math, and science scale scores were available through the state technical digests.
Gender Gender information was drawn from the student biographical section of the TAKS dataset. In the analysis dataset, students were assigned gender from the posttest year. Gender categories are male and female.
Race Similarly, race information was drawn from the student biographical section of the TAKS dataset. For the value-added model, students were assigned the race category as assigned from the posttest year. Race categories are Asian, Black, Hispanic, Native American, and white. The 2010-11 TAKS data use different race categories, in which white is defined as “white, not Hispanic” to distinguish non-Hispanic white students from Hispanic white students. This is a particularly relevant issue in Texas, where there is a very high Hispanic student population.
Free- and Reduced-Price Lunch Free- and reduced-price lunch (FRL) information was also available from the student biographical section of the TAKS dataset. For the analysis dataset of the value-added model, students were assigned the FRL indicator category from the posttest year.
Special Education Special education information was similarly drawn from the TAKS dataset. For the analysis dataset, students were assigned the special education category from the pretest year. The special education variable is an indicator (dummy) variable that indicates whether the student is participating in a special education instructional program or a regular education program using special education support services, supplementary aids, or other special arrangements. Disability status from the pretest year is used because of the potential endogeneity of disability status from
Measuring School Effectiveness Technical Report | July 2014 7
the posttest year. Endogeneity occurs when two or more variables have causal effects on each other, making it difficult to determine the causal relationship when a correlation is observed. Special education status in the current year is indistinguishable from enrolment in SPED programs, which could directly cause higher achievement and rate of growth.
At Risk At-risk status was drawn from the TAKS dataset. The at-risk indicator variable from the TAKS data was assigned to the students using the pretest year, again to avoid endogeneity. In particular, a student is categorized as at risk based on TEC, Section 29.081, which lists 13 statutory criteria for at-risk status of students who are 21 of age or younger. Some of the criteria include a student who:
“was not advanced from one grade level to the next for one or more school years[;]…did not perform satisfactorily on an assessment instrument administered to the student under Subchapter B, Chapter 39, and who has not in the previous or current school year subsequently performed on that instrument or another appropriate instrument at a level equal to at least 110 percent of the level of satisfactory performance on that instrument[;]… is pregnant or is a parent[;]… is currently on parole, probation, deferred prosecution, or other conditional release[;]… is a student of limited English proficiency, as defined by Section 29.052[;]… is in the custody or care of the Department of Protective and Regulatory Services or has, during the current school year, been referred to the department by a school official, officer of the juvenile court, or law enforcement official[;]… is homeless, as defined by 42 U.S.C. Section 11302, and its subsequent amendments.”
The TAKS dataset draws this information from the Public Education Information Management System (PEIMS) student demographic and enrollment records.
Gifted and Talented Gifted and talented status was also drawn from the TAKS dataset. The indicator variable data for students’ gifted and talented status from the posttest year was assigned to the students in the analysis dataset. This indicator variable categorizes those students who participate in a state-approved gifted and talented program, which is defined in 19 TAC, Section 89.1.
Limited English Proficiency Similarly, the limited English proficiency status indicator variable from the TAKS dataset from the pretest year was used in the final analysis dataset.
Retained in Grade/Skipped Grade Indicator variables that specify whether a student was retained in grade between the pretest and posttest years are included in the analysis dataset. This information was calculated from the student grade-level data of the TAKS dataset. A student is considered to have been retained if he or she is in the same grade in the pretest and posttest years. Similarly, a student is considered to have skipped grades if he or she has skipped one or more grades between the pretest and posttest years.
Measuring School Effectiveness Technical Report | July 2014 8
Value-added Model.
Value added for NCSU in 2011 was estimated for high schools in Fort Worth, Texas, and was measured in math, reading, and science for grades 9 through 11 at the school level. The value-added results were measured for both the 2010-2011 school year and the three-year average for the 2008-09, 2009-10, and 2010-11 school years; aggregating results from three years of data and comparing the three-year average value-added results with the 2010-2011 school year results allowed the cross-validation of consistency between the two results. Additionally, value-added results were computed for selected student subgroups: free- and reduced-price lunch (FRL), limited English proficiency (LEP), special education (SPED), black, and Hispanic students. The FWISD univariate constant effects model has two main stages: (i) running the end-of-year constant effects value- added model, and (ii) subsetting the analysis dataset by a variable of interest—such as ELL or FRL status—and running the value-added model on that student subsample.
It should be noted that there is substantial variation in the specification of value-added models, depending on various factors such as data availability (e.g., type of assessment and demographic data) and whether we are measuring school- or teacher-level value added. Moreover, there are a number of model features that can be included in value-added models—features designed to produce estimates that are highly valid and reliable. In particular, precision is critical to all statistical models. Large sample sizes produce more precise and accurate results for aggregated education measures because the measures are based on information from more students. Conversely, small sample sizes (particularly those smaller than 30) have less precision that results from randomness; the possibility of randomly having a group of fast-growing or slow-growing students is higher when the group is smaller. Since such models are already disadvantaged by inherent biases that are only partially captured by the error term, precision should be prioritized as one of the key issues in using models of education measurement, especially when these measurements are used to evaluate schools. Measurement error and shrinkage are included in the FWISD value-added model precisely for this reason. These techniques are described in further detail below.
Model Description The FWISD value-added model measures the average test-score improvement among a school’s students, while controlling for prior achievement and a large number of student characteristics, as outlined in the previous section. The model can be defined by the following four equations:
(1)
(2)
Measuring School Effectiveness Technical Report | July 2014 9
(3)
(4)
where i denotes a student, k denotes a school, g denotes grade, t denotes time, denotes an
alternate-subject test, and
= true ability for student i in grade g of school k in year t. = TAKS test score for student i in grade g of school k in year t.
= measurement error for student i in grade g of school k in year t. = vector of demographic variables on student i in grade g of school k in year t.
= grade g of school k’s constant effect value added. Equation (1) states that a student’s posttest score is equal to the sum of a constant ( , the same-
subject pretest and its slope parameter ( an alternate-subject pretest and its slope parameter ( , the vector of student characteristics with its slope parameter
, and an error term ( ). In other words, a student’s posttest score can be measured by the two pretests and the student’s characteristics (in this model, gender, race, English language learner status, free- and reduced-price lunch status, special education status, at-risk status, gifted and talented status, and grade retention6 between the pretest and posttest years). A constant is also included to account for any shift in the student’s achievement between the pretest and posttest, and the remaining discrepancy is accounted for by an error term that captures any error that may result from student achievement measurements and inherent biases of the data. Hereafter, and are used interchangeably to indicate the posttest. Similarly, and are used interchangeably to refer to the pretest; time subscripts from all variables are dropped.
Equations (2), (3), and (4) state that a student’s knowledge cannot be perfectly measured by each test in the model—in this case, the posttest and the two pretests. In other words, a student’s true knowledge of a subject (as measured by is only partially observed by the subject tests , respectively). The fact that there are three equations—one for the posttest and two for the pretests—states that each assessment has its own measurement error, which is determined by individual test characteristics, such as the difficulty of test questions, the number of tested topics, and the number of question items. The model adjusts for measurement error in lagged test scores using standard errors of measurement (SEMs), using approaches described in Wayne Fuller’s Measurement Error Models (Wiley, 1986). It is important to adjust for pretest measurement error to
6 Since we estimated separate models for each grade, the coefficient on the retention indicator was allowed to differ by grade.
Measuring School Effectiveness Technical Report | July 2014 10
avoid underestimating the pretest coefficient , because such underestimation would bias estimates of the demographic and value-added coefficients and .
Since , , and are not observable, equations (2), (3), and (4) can be substituted into equation (1), which yields an equation defined in terms of measured student achievement:
(5)
(6)
The new error term in equation (6) now includes both the original error component ( ) and the measurement error components ( ). Moreover, the error term in the model is allowed to have a variance that differs across subjects, grades, and years but is identically independently distributed (i.d.d.) across students within each combination of subject, grade, and year. This model then uses two consecutive years of assessment data to produce value-added results for a given growth year As a result, regression (6) can be run separately by subject, grade, and year. Equation (6) can also be more simply understood as a regression of a student’s 2011 TAKS score (posttest) on the student’s 2010 TAKS score (pretest), a vector of demographic variables, and a vector of dummy variables that indicates the school the student was enrolled in during the 2010-2011 school year. When the regression is run, the parameters on the school indicators are specified as fixed rather than random. This approach is chosen so that the estimates of (the coefficient on pretest) and
(the coefficients on the demographic variables) are estimated from within-school, across-student variation only. The advantage of this approach is that estimates are not based on across-school variation, which may be endogenous (correlated with unobserved components of school productivity). For example, it is possible that students with higher pretest scores have higher posttest scores, in part, because they attend more effective schools. This is not an effect that should be controlled for when measuring value added, as the purpose of value added is to measure the effectiveness of schools. Consequently, to avoid including this effect, the parameters are specified as fixed and the and parameters are estimated entirely from within-school variation. One side effect of specifying the parameters as fixed is that they are not shrunk to a distribution
when estimated; as a result, the estimates are shrunk in post-estimation instead.7
In the model set out in equation (6), schools’ constant effects for two consecutive grades over a single test-to-test interval of time measures the effects of schooling over a single test-to-test
7 When estimating value-added results, a shrinkage approach is employed to ensure that teachers with fewer students are not overrepresented among the highest- and lowest-value-added teachers due to randomness. The approach, Empirical Bayes shrinkage, is described in J. N. K. Rao, Small Area Estimation (Wiley, 2003).
Measuring School Effectiveness Technical Report | July 2014 11
interval for a group of students. For example, the effect measures the constant (average)
effects of schools attended by students moving on from grade 3 to grade 4 between the pretest and posttest school year. Estimates of school effects, obtained after the regression of equation (1)
are relative to a certain school’s effect. Since there is no compelling reason for choosing one school over the other as a point of comparison, these effects are centered around 0. Hence, the resulting estimates are relative to the average school effect used in the sample—in this case, FWISD high schools. Since these steps are mid-steps for obtaining differential effects, these estimates are not reported.
Aggregating to School-Level Value Added
The grade-level value-added results are then aggregated to the school level by calculating the weighted average by the number of students in each grade. In other words, to compute the school-level constant effect value added, , we use the n-weighted average of the grade-level constants effect value added : .
Shrinkage Estimates of the Constant Effect Value Added Shrinkage is an important part of value added because it helps account for randomness. Every school's value added is based on a finite number of students, and some schools have more students than others. When a school has a relatively small number of students, there are greater possibilities for randomness. Consequently, if value added is measured simply as the average growth of students in each school from one year to the next, one would expect schools with smaller numbers of students to be disproportionately represented among the schools with the highest and lowest value added, entirely as a result of randomness. The same concept can be applied at the grade level: grades with fewer students would be disproportionately represented among those grades with the highest and lowest values added.
Shrinkage accounts for this issue by "shrinking" the values added of grades with a small number of students toward the average. This tempers the effects of randomness on the values added of grades with small numbers of students, ensuring that they are not always among the highest- and lowest-value-added grades as a matter of chance. In practice, this means that the value added of a grade with 100 students who experienced very fast or very slow growth is shrunk toward the district average because of the reasonably high probability that the growth is a result of noise. In contrast, a grade with 1,000 students who experienced fast or slow growth is not tempered as much because randomness is unlikely to cause fast or slow growth among such a large number of students. Shrinkage recognizes that while very fast or very slow growth among a small number of students might be the result of randomness, the same growth among a large number of students probably is not, and adjusts the value-added results accordingly.
The technique used for shrinking the unshrunk value-added estimates is Empirical Bayes Shrinkage. Both grade-level and school-level value added are shrunk using a univariate shrinkage technique. The first step in shrinking the estimates is to estimate the variance of the true (rather
Measuring School Effectiveness Technical Report | July 2014 12
than the estimated) effects. In value added for a single grade-to-grade progression (say, fifth grade to sixth grade) or for a single year, the underlying distribution of across schools has a mean of
0 and a variance of . It is important to note that is not the variance of the estimation errors of
the estimates, rather it is the variance of the estimates themselves.
Let the squared standard error of equal for school . When univariate shrinkage is used, the shrinkage estimates of and the standard errors of the shrunk estimates will equal:
(7)
(8)
In order to run shrinkage, estimates of , the underlying variance of grade-level value added over
schools within grades, subjects, and years, is needed. The estimates used are computed in the following way:
= Sample variance of – Sample mean of (9)
The sample means and variances in the sample statistics above are all measured across schools within year, grade, and subject and account for measurement error in the estimates. The
sample means and variances used to measure are computed using (the number of students
used in measuring value added) as weights. When the shrinkage is done, is substituted for
Results.
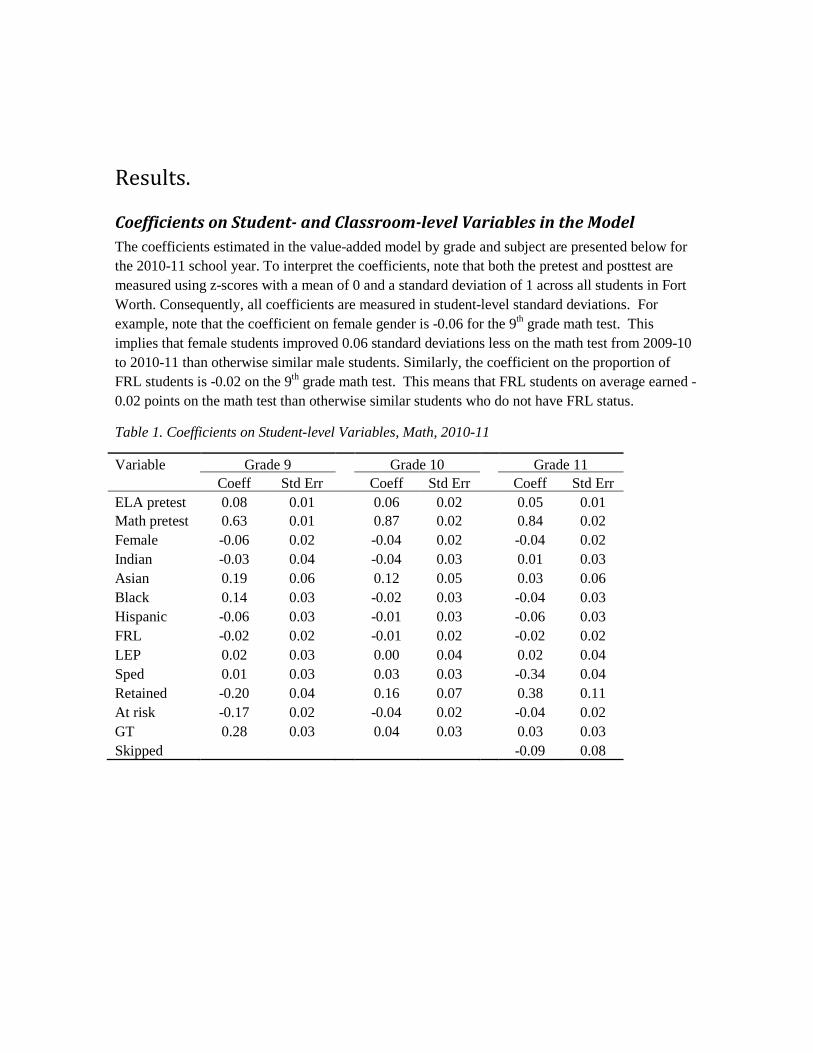
Coefficients on Student- and Classroom-level Variables in the Model The coefficients estimated in the value-added model by grade and subject are presented below for the 2010-11 school year. To interpret the coefficients, note that both the pretest and posttest are measured using z-scores with a mean of 0 and a standard deviation of 1 across all students in Fort Worth. Consequently, all coefficients are measured in student-level standard deviations. For example, note that the coefficient on female gender is -0.06 for the 9th grade math test. This implies that female students improved 0.06 standard deviations less on the math test from 2009-10 to 2010-11 than otherwise similar male students. Similarly, the coefficient on the proportion of FRL students is -0.02 on the 9th grade math test. This means that FRL students on average earned -0.02 points on the math test than otherwise similar students who do not have FRL status.
Table 1. Coefficients on Student-level Variables, Math, 2010-11
It is important to keep in mind the standard errors of the coefficients when interpreting the coefficients. A span of approximately two standard deviations in both the positive and negative directions provides a 95 percent confidence range for a coefficient. For example, note that the coefficient on female is -0.06. The standard error on this coefficient is 0.02. This means that, while
Measuring School Effectiveness Technical Report | July 2014 15
the best estimate of the effect of gender on student-level growth is -0.06 standard deviations, a 95 percent confidence range for the effect estimate would range from -0.1 to -0.02 standard deviations. Since this range does not include zero, the hypothesis that student gender has no effect on student improvement can be rejected with 95 percent confidence. Similarly, from its standard error we can see that the estimated coefficient on FRL status in the Grade 9 Reading model is not significantly different from 0.
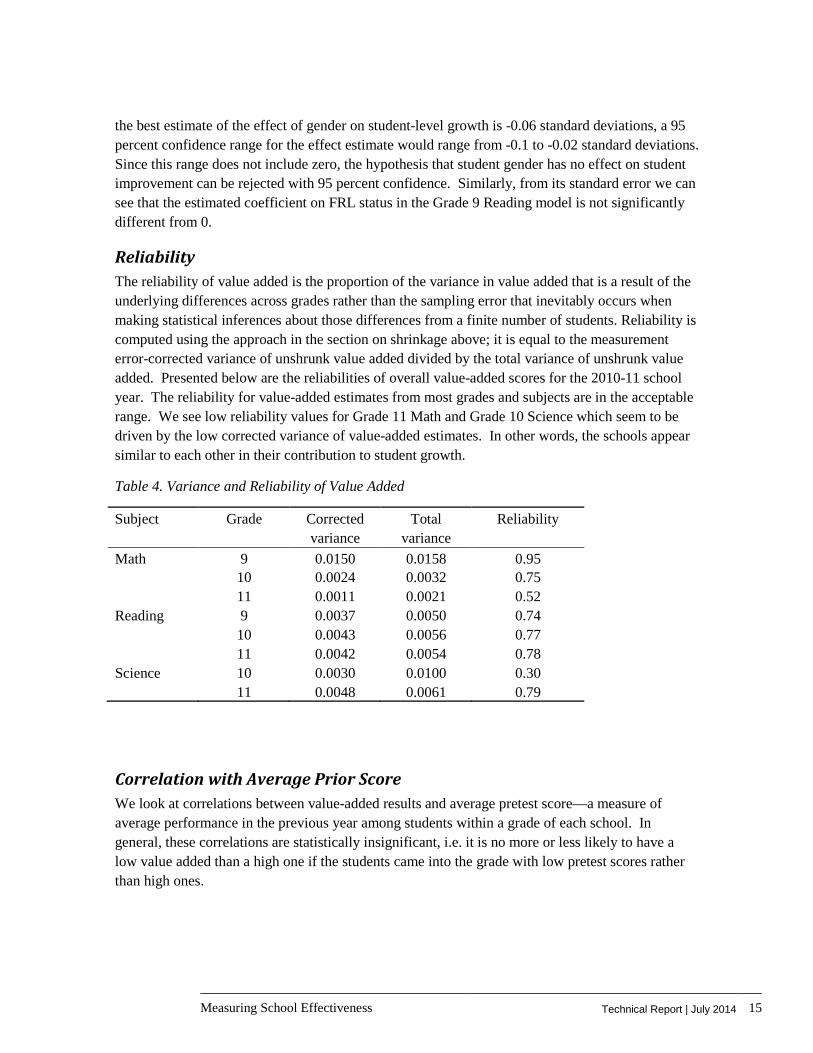
Reliability The reliability of value added is the proportion of the variance in value added that is a result of the underlying differences across grades rather than the sampling error that inevitably occurs when making statistical inferences about those differences from a finite number of students. Reliability is computed using the approach in the section on shrinkage above; it is equal to the measurement error-corrected variance of unshrunk value added divided by the total variance of unshrunk value added. Presented below are the reliabilities of overall value-added scores for the 2010-11 school year. The reliability for value-added estimates from most grades and subjects are in the acceptable range. We see low reliability values for Grade 11 Math and Grade 10 Science which seem to be driven by the low corrected variance of value-added estimates. In other words, the schools appear similar to each other in their contribution to student growth.
Correlation with Average Prior Score We look at correlations between value-added results and average pretest score—a measure of average performance in the previous year among students within a grade of each school. In general, these correlations are statistically insignificant, i.e. it is no more or less likely to have a low value added than a high one if the students came into the grade with low pretest scores rather than high ones.
Measuring School Effectiveness Technical Report | July 2014 16
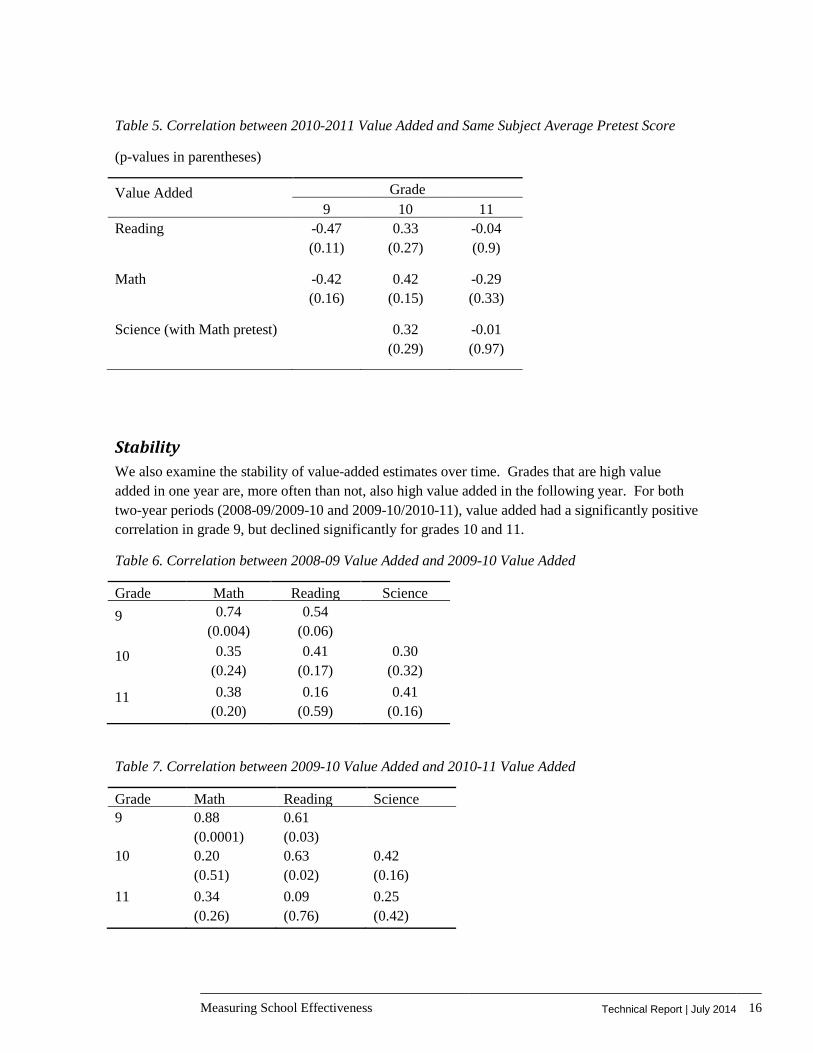
Table 5. Correlation between 2010-2011 Value Added and Same Subject Average Pretest Score
(p-values in parentheses)
Value Added Grade 9 10 11
Reading -0.47 (0.11)
0.33 (0.27)
-0.04 (0.9)
Math -0.42 (0.16)
0.42 (0.15)
-0.29 (0.33)
Science (with Math pretest) 0.32 (0.29)
-0.01 (0.97)
Stability We also examine the stability of value-added estimates over time. Grades that are high value added in one year are, more often than not, also high value added in the following year. For both two-year periods (2008-09/2009-10 and 2009-10/2010-11), value added had a significantly positive correlation in grade 9, but declined significantly for grades 10 and 11.
Table 6. Correlation between 2008-09 Value Added and 2009-10 Value Added
Grade Math Reading Science 9 0.74
(0.004)
0.54 (0.06)
10 0.35 (0.24)
0.41 (0.17)
0.30 (0.32)
11 0.38 (0.20)
0.16 (0.59)
0.41 (0.16)
Table 7. Correlation between 2009-10 Value Added and 2010-11 Value Added
Grade Math Reading Science 9 0.88
(0.0001) 0.61 (0.03)
10 0.20 (0.51)
0.63 (0.02)
0.42 (0.16)
11 0.34 (0.26)
0.09 (0.76)
0.25 (0.42)
Measuring School Effectiveness Technical Report | July 2014 17
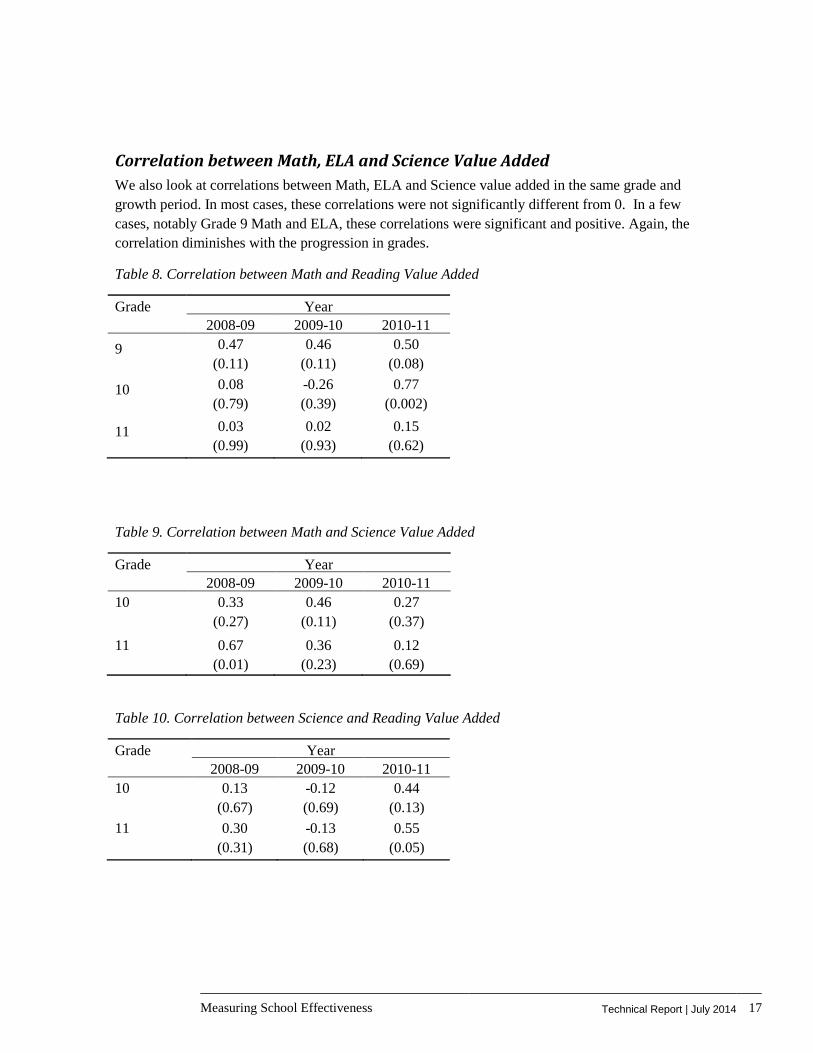
Correlation between Math, ELA and Science Value Added We also look at correlations between Math, ELA and Science value added in the same grade and growth period. In most cases, these correlations were not significantly different from 0. In a few cases, notably Grade 9 Math and ELA, these correlations were significant and positive. Again, the correlation diminishes with the progression in grades.
Table 8. Correlation between Math and Reading Value Added
Grade Year 2008-09 2009-10 2010-11
9 0.47 (0.11)
0.46 (0.11)
0.50 (0.08)
10 0.08 (0.79)
-0.26 (0.39)
0.77 (0.002)
11 0.03 (0.99)
0.02 (0.93)
0.15 (0.62)
Table 9. Correlation between Math and Science Value Added
Grade Year 2008-09 2009-10 2010-11
10 0.33 (0.27)
0.46 (0.11)
0.27 (0.37)
11 0.67 (0.01)
0.36 (0.23)
0.12 (0.69)
Table 10. Correlation between Science and Reading Value Added
Grade Year 2008-09 2009-10 2010-11
10 0.13 (0.67)
-0.12 (0.69)
0.44 (0.13)
11 0.30 (0.31)
-0.13 (0.68)
0.55 (0.05)
Measuring School Effectiveness Technical Report | July 2014 18
Selecting High and Low Value-Added Schools.
Based on the value-added estimates for each of the high schools in the district, four high schools (two high value-added schools and two low value-added schools) were selected for additional in-depth fieldwork and on-site investigation to explore school characteristics that could be scaled up to improve school effectiveness beyond FWISD. A list of the schools under consideration and their characteristics is provided in Appendix A. However, we do not identify the schools by name or specific details in this technical report.
The selection of these high schools was based on the 2010-2011 value-added results alone, and we confirmed the selection using an aggregated estimate based on all three years of data (2008-2011). The 2010-11 school year estimate would be most reflective of the school characteristics that would be observed by NCSU fieldwork. However, the 2008-2011 estimate accounts for personnel and resources that may be in flux across school years; schools that can accommodate these changes without diminishing their overall school effectiveness were given additional consideration.
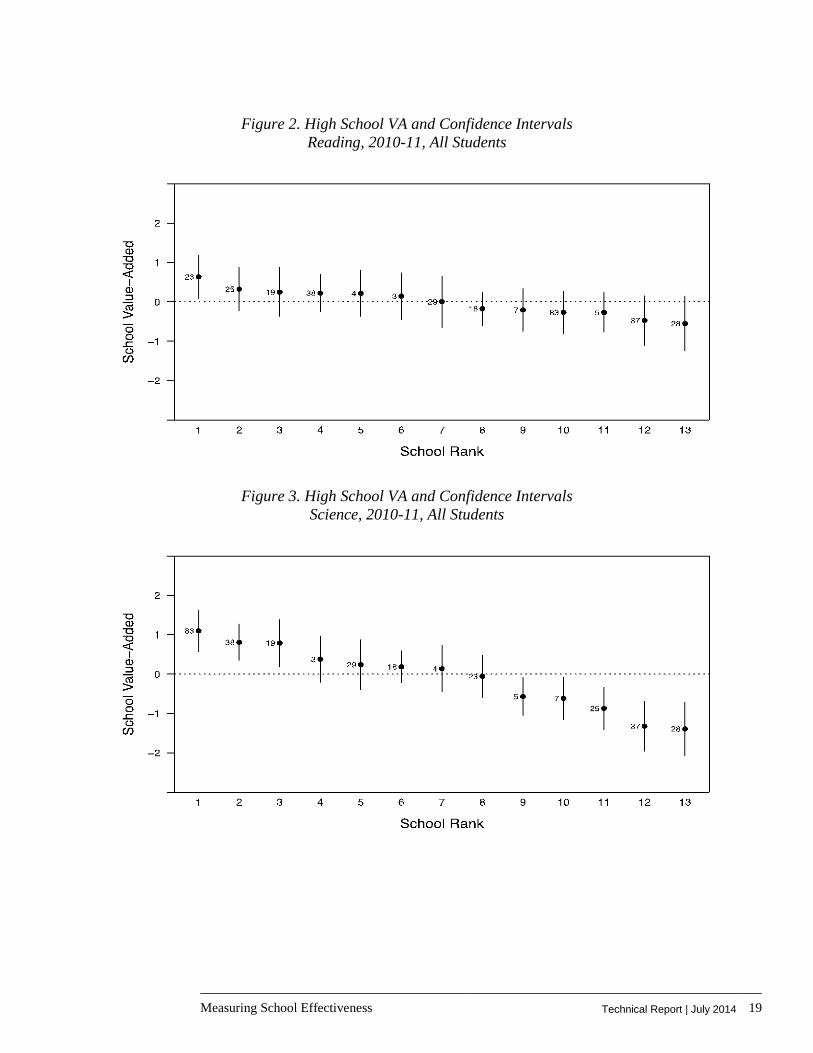
In order to select high and low value-added schools for the qualitative study, we aggregated the school-grade level value-added results reported in the previous section up to the school-subject level. We obtained school rankings based the aggregated value-added estimates for each subject. These are presented in Figures 1 to 3, together with the value-added estimates and their confidence intervals.
Figure 1. High School VA and Confidence Intervals Mathematics, 2010-11, All Students
Measuring School Effectiveness Technical Report | July 2014 19
Figure 2. High School VA and Confidence Intervals Reading, 2010-11, All Students
Figure 3. High School VA and Confidence Intervals Science, 2010-11, All Students
Measuring School Effectiveness Technical Report | July 2014 20
From these figures, we can see that there are no significant differences in school-level math and reading value added between most of the schools. We are able to distinguish between high and low value-added schools using the science value-added measure. Moreover, the school rankings change quite a bit between the three subjects. We based our selection on the average ranking of the school across all three subjects, shown in the table below.
Table 11. School Rankings by Subject, All Students
Blind School ID
Math Reading Science Average
003 6 3 4 4.3
004 3 10 7 6.7
005 11 1 9 7.0
007 9 5 10 8.0
018 8 2 6 5.3
019 4 6 3 4.3
023 1 13 8 7.3
025 2 4 11 5.7
028 13 8 13 11.3
029 7 11 5 7.7
037 12 9 12 11.0
038 5 12 2 6.3
083 10 7 1 6.0
Schools 003 and 019 were selected as the high value-added schools, while schools 007 and 028 were selected as the low value-added schools. School 037 was removed from consideration as one of the selected low VA schools, based on having higher value-added estimates from previous years.
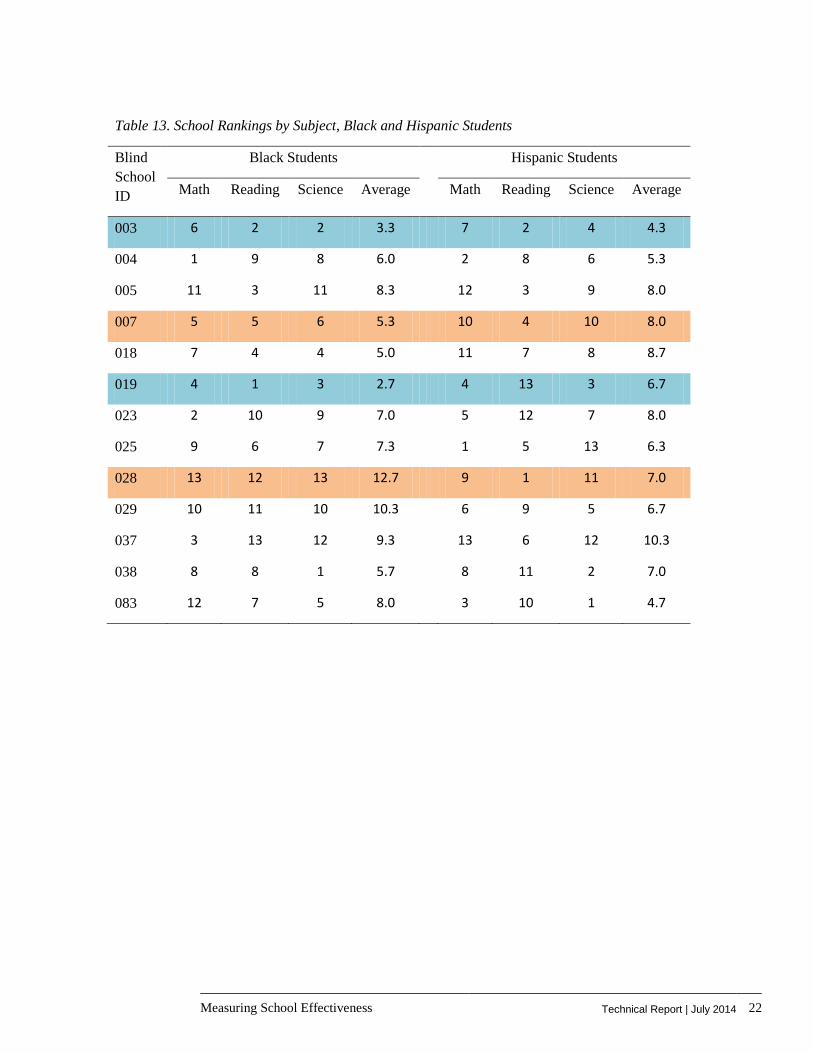
We confirmed our selections using school rankings based on value-added estimates for specific sub-groups of the student population. These rankings are reported on the next page for students enrolled in a Free or Reduced-Price Lunch Program, and for Black and Hispanic students. Again, the rankings are not consistent across subjects for the sub-groups. However, it should be noted that the sub-groups based on race have a small sample size in certain schools that are more likely to
Measuring School Effectiveness Technical Report | July 2014 21
have either Black or Hispanic students. We omit school rankings based on Limited English Proficiency and Special Education status, as these have small sample sizes in all schools.
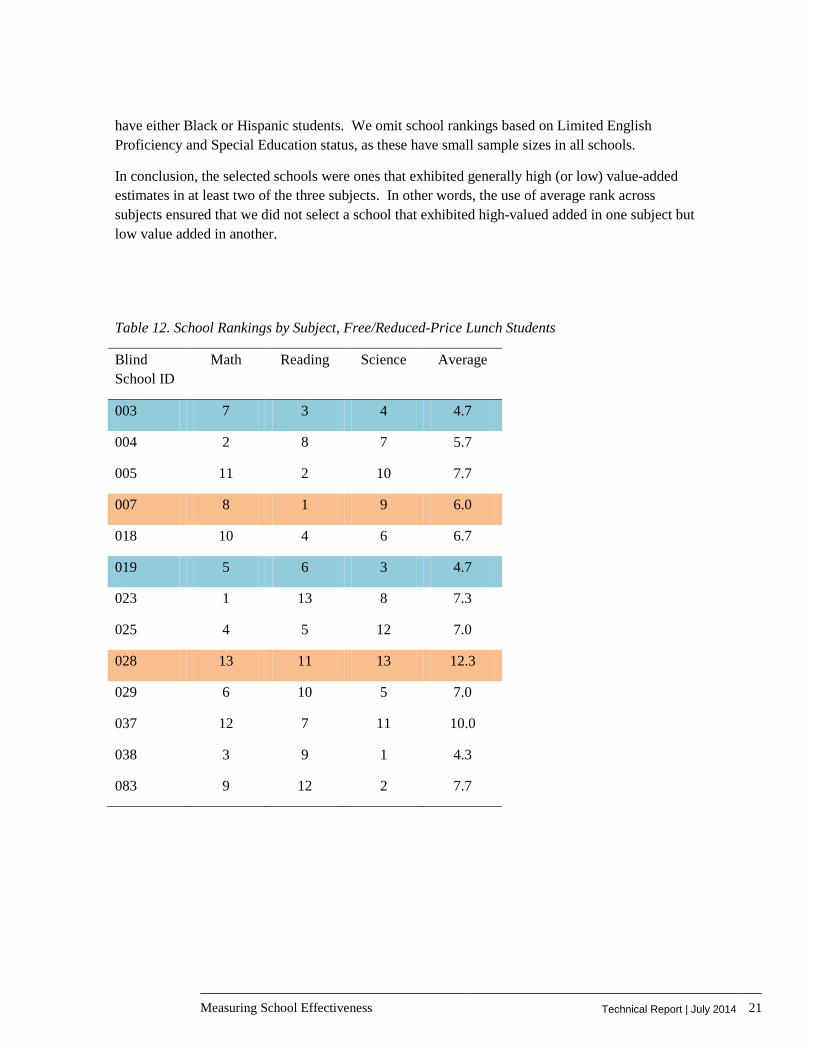
In conclusion, the selected schools were ones that exhibited generally high (or low) value-added estimates in at least two of the three subjects. In other words, the use of average rank across subjects ensured that we did not select a school that exhibited high-valued added in one subject but low value added in another.
Table 12. School Rankings by Subject, Free/Reduced-Price Lunch Students
Blind School ID
Math Reading Science Average
003 7 3 4 4.7
004 2 8 7 5.7
005 11 2 10 7.7
007 8 1 9 6.0
018 10 4 6 6.7
019 5 6 3 4.7
023 1 13 8 7.3
025 4 5 12 7.0
028 13 11 13 12.3
029 6 10 5 7.0
037 12 7 11 10.0
038 3 9 1 4.3
083 9 12 2 7.7
Measuring School Effectiveness Technical Report | July 2014 22
Table 13. School Rankings by Subject, Black and Hispanic Students
Blind School ID
Black Students Hispanic Students
Math Reading Science Average Math Reading Science Average
003 6 2 2 3.3 7 2 4 4.3
004 1 9 8 6.0 2 8 6 5.3
005 11 3 11 8.3 12 3 9 8.0
007 5 5 6 5.3 10 4 10 8.0
018 7 4 4 5.0 11 7 8 8.7
019 4 1 3 2.7 4 13 3 6.7
023 2 10 9 7.0 5 12 7 8.0
025 9 6 7 7.3 1 5 13 6.3
028 13 12 13 12.7 9 1 11 7.0
029 10 11 10 10.3 6 9 5 6.7
037 3 13 12 9.3 13 6 12 10.3
038 8 8 1 5.7 8 11 2 7.0
083 12 7 5 8.0 3 10 1 4.7
Measuring School Effectiveness Technical Report | July 2014 23
Conclusion.
This technical report described the value-added model used with Fort Worth Independent School District data in the IES Effective Schools: Scaling Up Effective High Schools initiative and developed in association with the Value-Added Research Center of the Wisconsin Center for Education Research at the University of Wisconsin-Madison. For more information on the value-added research of the Value-Added Research Center, visit VARC's website at: http://varc.wceruw.org/
Measuring School Effectiveness Technical Report | July 2014 24
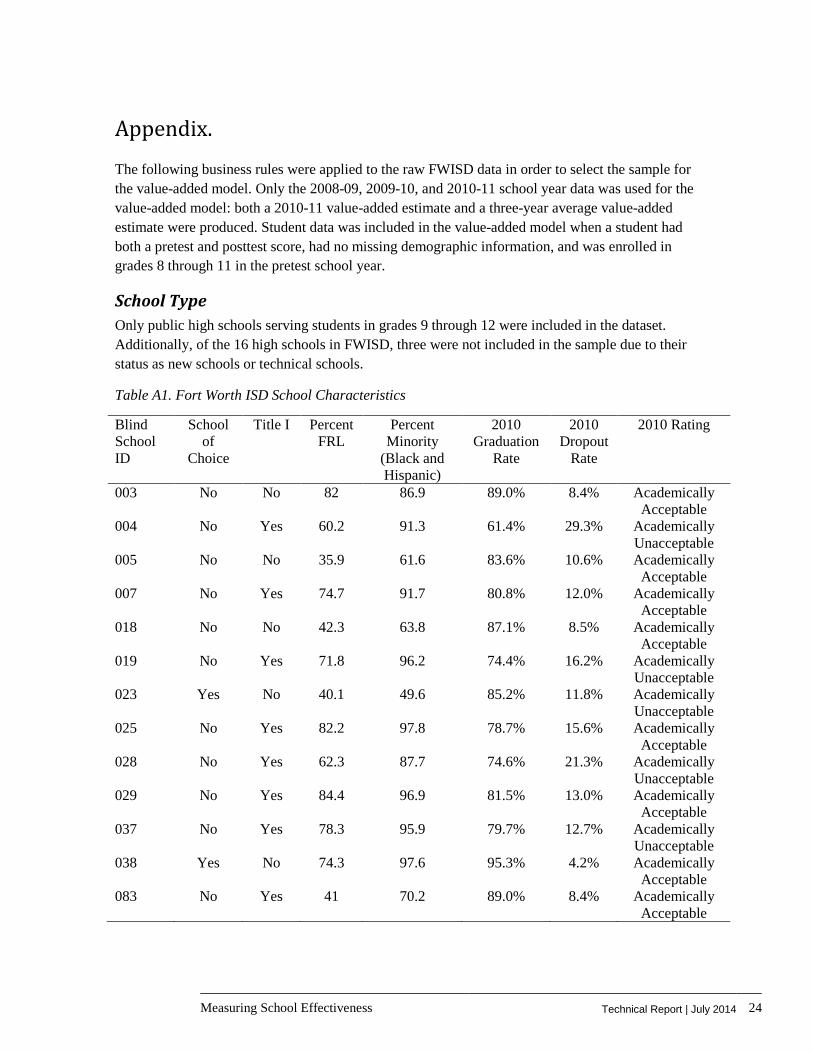
Appendix.
The following business rules were applied to the raw FWISD data in order to select the sample for the value-added model. Only the 2008-09, 2009-10, and 2010-11 school year data was used for the value-added model: both a 2010-11 value-added estimate and a three-year average value-added estimate were produced. Student data was included in the value-added model when a student had both a pretest and posttest score, had no missing demographic information, and was enrolled in grades 8 through 11 in the pretest school year.
School Type Only public high schools serving students in grades 9 through 12 were included in the dataset. Additionally, of the 16 high schools in FWISD, three were not included in the sample due to their status as new schools or technical schools.
Table A1. Fort Worth ISD School Characteristics
Blind School ID
School of
Choice
Title I Percent FRL
Percent Minority
(Black and Hispanic)
2010 Graduation
Rate
2010 Dropout
Rate
2010 Rating
003 No No 82 86.9 89.0% 8.4% Academically Acceptable
004 No Yes 60.2 91.3 61.4% 29.3% Academically Unacceptable
005 No No 35.9 61.6 83.6% 10.6% Academically Acceptable
007 No Yes 74.7 91.7 80.8% 12.0% Academically Acceptable
018 No No 42.3 63.8 87.1% 8.5% Academically Acceptable
019 No Yes 71.8 96.2 74.4% 16.2% Academically Unacceptable
023 Yes No 40.1 49.6 85.2% 11.8% Academically Unacceptable
025 No Yes 82.2 97.8 78.7% 15.6% Academically Acceptable
028 No Yes 62.3 87.7 74.6% 21.3% Academically Unacceptable
029 No Yes 84.4 96.9 81.5% 13.0% Academically Acceptable
037 No Yes 78.3 95.9 79.7% 12.7% Academically Unacceptable
038 Yes No 74.3 97.6 95.3% 4.2% Academically Acceptable
083 No Yes 41 70.2 89.0% 8.4% Academically Acceptable
Measuring School Effectiveness Technical Report | July 2014 25
Demographic Variables The following table describes the demographic variables are included in the value-added model.
Table A2. Demographic Controls
Variable Name Description Values
Race/Ethnicity Student’s reported race or ethnicity8
1 = American Indian or Alaskan Native
2 = Asian, Native Hawaiian, or other Pacific Islander
3 = Hispanic
4 = Black or African American
5 = White
Gender Student’s reported gender 1 = Female
0 = Male
Free or Reduced Price Lunch (FRL)
Student is eligible for reduced-price or free meals under the National School Lunch and Child Nutrition Program
1 = Yes
0 = No
Limited English Proficiency (LEP or ELL)
Student is currently identified as LEP
1 = Yes
0 = No
Special Education (SPED) Student is participating in a special education program
1 = Yes
0 = No
At Risk Student is designated at risk of dropping out of school under state-mandated academic criteria only
1 = Yes
0 = No
Gifted/Talented Student is participating in a state-approved Gifted/Talented program
1 = Yes
0 = No
8 The race variable was coded differently starting in the 2009-10 school year, meaning that two different race variables had to be merged.
Measuring School Effectiveness Technical Report | July 2014 26
Grade Promotion Students who skipped or retained grades between the pretest and posttest years were also included in the dataset, as long as they were enrolled in grades 9 through 11 in the posttest year. In other words, students who skipped or were retained are also included in the dataset. The coefficient on these indicators was allowed to vary by grade because we estimated the value-added models separately by grade.
Test Scores There are multiple test administration dates for each TAKS assessment, depending on the school year, test subject, and grade. Since the 2008-2011 school years are used in the value-added model, TAKS information from the 2007-2008 was also used to account for the pretest year of the 2008-2009 sample cohort. The test score from the earliest test administration for each student was counted as the pretest. The six test administration dates are in the following months: October, March, April, May, June, and July.9 The majority of students took the TAKS in October.
Only valid scores in math, reading/ELA, and science TAKS were included in the dataset if the TAKS score code was “S,” which denotes that the student has a score for the associated assessment. Using the score code allows the data to distinguish students who received the minimum score as a result of taking the test or their absence. In other words, only students who took the test on the test day were included in the dataset.
A few students had multiple test scores recorded for their first test administration. In this case, the mean of the two test scores was included in the final TAKS dataset.
For all assessments, scale scores are used to calculate z-scores. It should be noted that the 8th grade math and reading TAKS assessments from the 2009-10 school year used two scales: one in the 800s, and the other in the 2000s. Since the majority of the scores used the 800 scale, all 8th grade math and reading TAKS scale scores in 2009-10 were re-coded in the 800 scale.
9 One exception is the 2007-08 school year, which had three test administration dates: March, April, and May.