49
MEASURING SCRUM ESSENTIAL METRICS FOR HYPER PRODUCTIVE TEAMS WITH JEFF SUTHERLAND & SCOTT DOWNEY

MEASURING
SCRUM
ESSENTIAL METRICS FOR HYPER PRODUCTIVE TEAMS
WITH JEFF SUTHERLAND
&
SCOTT DOWNEY
Agenda
• Goal of this Work
• Data Collection
• A Few Metrics & Formulas
• Comparing Teams
• RoboScrum™ version 7.6
• Corrections
• New Metrics
• Comparison of Real Teams

THE GOAL Why bother measuring Scrum?

Goal of this Work
To develop a standardized set of minimally invasive metrics that can help Scrum Masters evaluate and advise Teams while providing rich insights about Performance and the benefits of Scrum in a fully portable language for comparison of Scrum Teams across an Agile
Enterprise.

Goal of this Work
To develop a standardized set of minimally invasive metrics that can help Scrum Masters evaluate and advise Teams while providing rich insights about Performance and the benefits of Scrum in a fully portable language for comparison of Scrum Teams across an Agile
Enterprise.

DATA COLLECTION The minimal touch for maximum gain
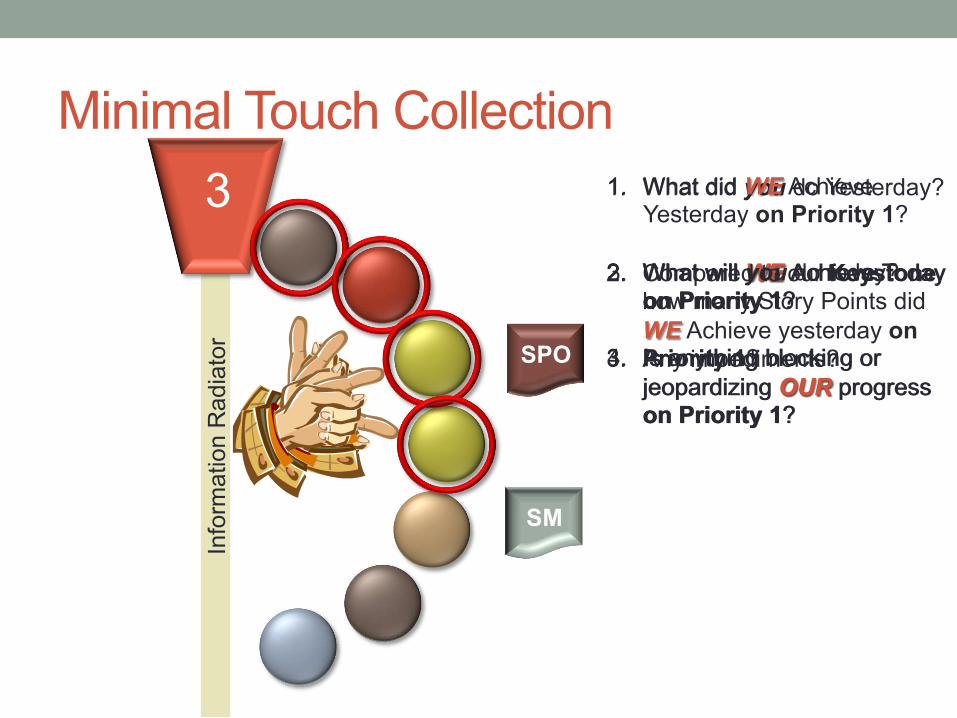
Minimal Touch Collection
2. What will WE Achieve Today on Priority 1?
3. Is anything blocking or
jeopardizing OUR progress on Priority 1?
3. What will WE Achieve Today on Priority 1?
4. Is anything blocking or
jeopardizing OUR progress on Priority 1?
1. What did you do Yesterday?
2. What will you do today?
3. Any impediments?
2. Compared to our Keystone, how many Story Points did
WE Achieve yesterday on Priority 1?
1. What did WE Achieve Yesterday on Priority 1?
Minimal Touch Collection
SPO
Info
rma
tio
n R
ad
iato
r 3

Minimal Touch Collection
Info
rma
tio
n R
ad
iato
r 3

Minimal Touch Collection
Info
rma
tio
n R
ad
iato
r
3

3. What will WE Achieve Today on Priority 1?
4. Is anything blocking or jeopardizing OUR progress
on Priority 1?
2. Compared to our Keystone, how many Story Points did WE
Achieve yesterday on Priority 1?
1. What did WE Achieve Yesterday on Priority 1?
Forecast In
Progress DONE
P1 P1
P1
P1
P5
Minimal Touch Collection
3
P3
P4
P1
P1
P1
P2
3
3
2 3
3
5
3

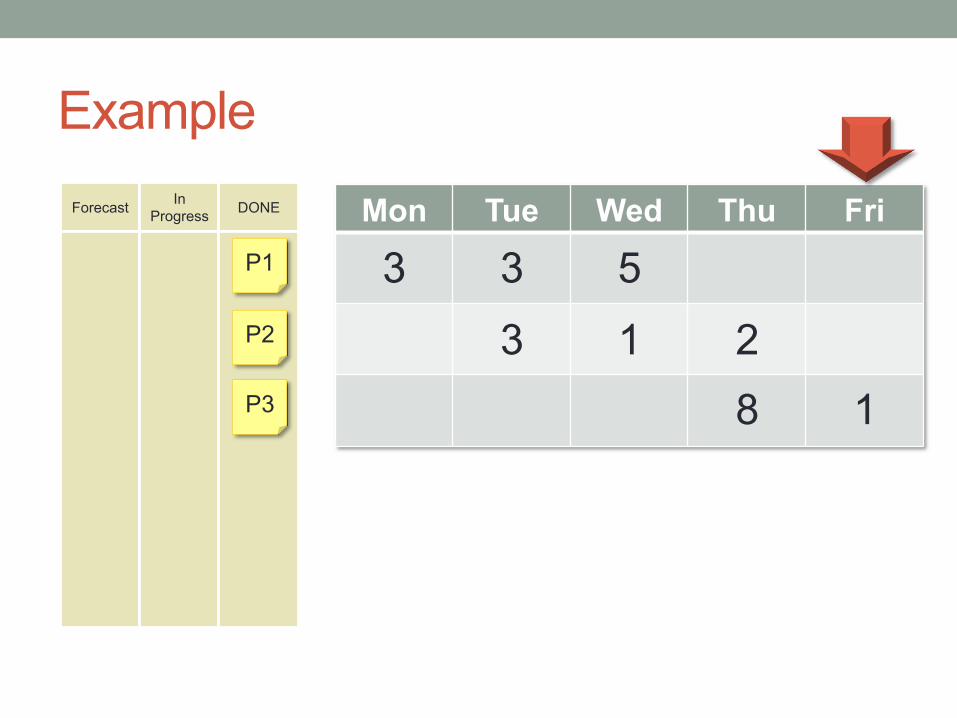
Example
Forecast In
Progress DONE
P3
P1
P2
Mon Tue Wed Thu Fri
3 3 5
3 1 2
8 1
3
3
2 3
3
5
3
Example
Forecast In
Progress DONE Mon Tue Wed Thu Fri
3 3 5
3 1 2
8 1 P3
P1
P2

The Fourth Question causes…
• …swarming on the highest priority.
• …the Team practice Story Points daily.
• …the Team to self-police the quality of the DSU.
• …everyone to stay engaged throughout DSU.
• …people who don’t understand Story Points to speak up.

THE ORIGINAL 8 METRICS Creating cross-team clarity & conversation

8. Forecast Accuracy – How much of our ability does our Forecast represent?
1. Velocity – How much Value do we deliver per Sprint?
2. Work Capacity – How much effort can we expend in a Sprint?
3. Focus Factor – What percentage of our Effort becomes Value?
4. Adopted Work – How much work do we add to the Sprint after Planning?
5. Found Work – How much unexpected work is associated with our SBIs?
6. Velocity Increase – How much better are we now than when we began?
7. Estimation Accuracy – When we estimate X=5pts, how often are we right?
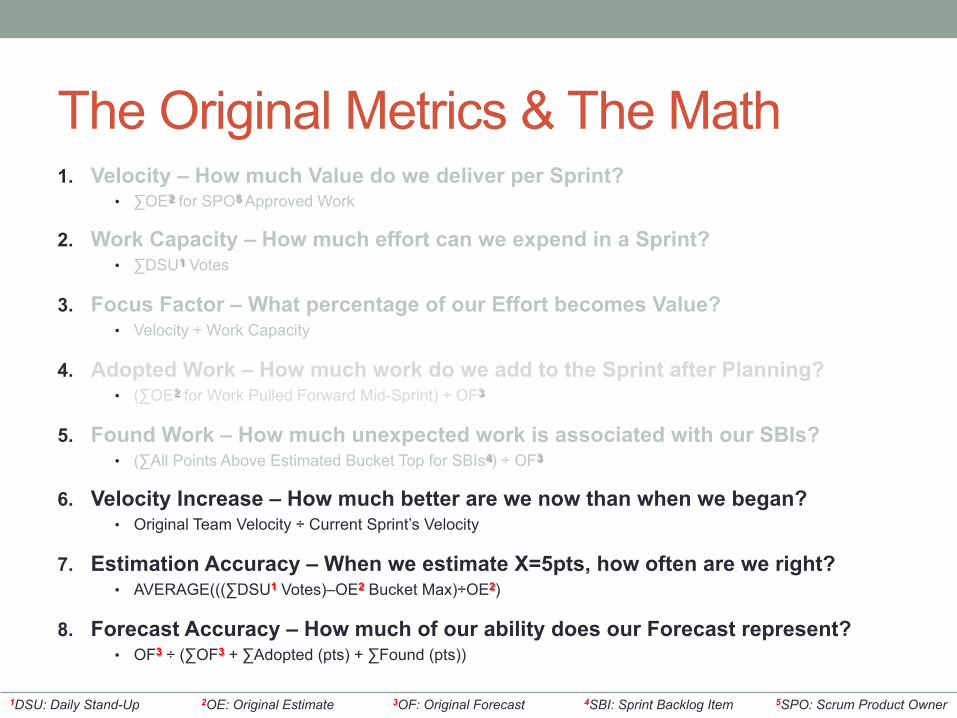
The Original Metrics & The Math

8. Forecast Accuracy – How much of our ability does our Forecast represent?
1. Velocity – How much Value do we deliver per Sprint?
2. Work Capacity – How much effort can we expend in a Sprint?
3. Focus Factor – What percentage of our Effort becomes Value?
4. Adopted Work – How much work do we add to the Sprint after Planning?
5. Found Work – How much unexpected work is associated with our SBIs?
6. Velocity Increase – How much better are we now than when we began?
7. Estimation Accuracy – When we estimate X=5pts, how often are we right?
The Original Metrics & The Math
1DSU: Daily Stand-Up 2OE: Original Estimate 3OF: Original Forecast 4SBI: Sprint Backlog Item 5SPO: Scrum Product Owner

1. Velocity – How much Value do we deliver per Sprint? • ∑OE2 for SPO5 Approved Work
2. Work Capacity – How much effort can we expend in a Sprint? • ∑DSU1 Votes
3. Focus Factor – What percentage of our Effort becomes Value? • Velocity ÷ Work Capacity
4. Adopted Work – How much work do we add to the Sprint after Planning? • (∑OE2 for Work Pulled Forward Mid-Sprint) ÷ OF3
5. Found Work – How much unexpected work is associated with our SBIs? • (∑All Points Above Estimated Bucket Top for SBIs4) ÷ OF3
6. Velocity Increase – How much better are we now than when we began? • Original Team Velocity ÷ Current Sprint’s Velocity
7. Estimation Accuracy – When we estimate X=5pts, how often are we right? • AVERAGE(((∑DSU1 Votes)–OE2 Bucket Max)÷OE2)
8. Forecast Accuracy – How much of our ability does our Forecast represent? • OF3 ÷ (∑OF3 + ∑Adopted (pts) + ∑Found (pts))
The Original Metrics & The Math
1DSU: Daily Stand-Up 2OE: Original Estimate 3OF: Original Forecast 4SBI: Sprint Backlog Item 5SPO: Scrum Product Owner

11
6
9
5
5
3
Example: Velocity & Capacity
P3
P1
P2
Mon Tue Wed Thu Fri
3 3 5
3 1 2
8 1
Original Estimates
Work Invested

11 6 9 + + + 5 5
5
5
3
Example: Velocity & Capacity
11
6
9
SPO Accepted
Yes
Yes
No
Original Estimates
Work Invested
Velocity is the sum of the Original Estimates for all work approved by the SPO by the
end of the Sprint.
Work Capacity is the sum of all Daily Stand-Up votes for daily complexity resolution whether the
SPO ultimately accepts the Sprint Backlog Item or not.

Example: Focus Factor
11 6 9 + + + 5 5
= = 38.5%
Focus Factor is a measure of how much of the
Team’s effort becomes requested
Value.

Example: Found vs. Adopted Work
Original Estimates
Work Invested
P1 5 11 Planned
Work Type
Found Work
5
P2 5 6 Planned 0
P3 3 9 Adopted 4
Found Work occurs when the Original Estimate was too low.
Adopted Work occurs when the Team finishes their Forecast early.

1. Velocity – How much Value do we deliver per Sprint? • ∑OE2 for SPO5 Approved Work
2. Work Capacity – How much effort can we expend in a Sprint? • ∑DSU1 Votes
3. Focus Factor – What percentage of our Effort becomes Value? • Velocity ÷ Work Capacity
4. Adopted Work – How much work do we add to the Sprint after Planning? • (∑OE2 for Work Pulled Forward Mid-Sprint) ÷ OF3
5. Found Work – How much unexpected work is associated with our SBIs? • (∑All Points Above Estimated Bucket Top for SBIs4) ÷ OF3
6. Velocity Increase – How much better are we now than when we began? • Original Team Velocity ÷ Current Sprint’s Velocity
7. Estimation Accuracy – When we estimate X=5pts, how often are we right? • AVERAGE(((∑DSU1 Votes)–OE2 Bucket Max)÷OE2)
8. Forecast Accuracy – How much of our ability does our Forecast represent? • OF3 ÷ (∑OF3 + ∑Adopted (pts) + ∑Found (pts))
The Original Metrics & The Math
1DSU: Daily Stand-Up 2OE: Original Estimate 3OF: Original Forecast 4SBI: Sprint Backlog Item 5SPO: Scrum Product Owner

Further Reading & Examples
http://www.scruminc.com/wp-content/uploads/2014/05/Hyper-
Productive-Metircs.pdf

THE NEW METRICS Creating even more opportunity for conversation

1. Caution, Clarity & Bravery – Why are our estimates incorrect?
2. The Happiness Metric – How Happy is our Team?
3. Kaizen Investment – How much energy do we dedicate to continuous improvement?
4. Honoring Priority – How well do we put work in progress in priority order?
5. Success at Scale – How often do we succeed when work is of scale X?
Some NEW Metrics & Formulas
1DSU: Daily Stand-Up 2OE: Original Estimate 3OF: Original Forecast 4SBI: Sprint Backlog Item 5SPO: Scrum Product Owner

1. Caution, Clarity & Bravery – Why are our estimates incorrect? 1. Caution, Clarity & Bravery – Why are our estimates incorrect?
Some NEW Metrics & Formulas
1DSU: Daily Stand-Up 2OE: Original Estimate 3OF: Original Forecast 4SBI: Sprint Backlog Item 5SPO: Scrum Product Owner
2. The Happiness Metric – How Happy is our Team?
3. Kaizen Investment – How much energy do we dedicate to continuous improvement?
4. Honoring Priority – How well do we put work in progress in priority order?
5. Success at Scale – How often do we succeed when work is of scale X?

Some NEW Metrics & Formulas 1. Caution, Clarity & Bravery – Why are our estimates incorrect?
1. Caution: What percentage of the Original Forecast was due to Anxiety Voting?
• (∑(OE2 Bucket Min – DSU1 Votes for each SBI4) for all SBIs4) ÷ OF3
2. Clarity: What percentage of the Original Forecast was seen Clearly during Planning?
• (∑OE2 (where OE Bucket Min <= ∑DSU Votes <= OE Bucket Max)) ÷ OF3
3. Bravery: What percentage of the Team’s Work Capacity was invested in underestimated SBIs?
• (∑DSU1 Votes – OE2 Bucket Max) ÷ Work Capacity
2. The Happiness Metric – How Happy is our Team? • Team Votes on a Scale of 1-5 how happy they are with:
1. Their Position within the Company (Averaged for all Team Members)
2. The Company as a Whole (Averaged for all Team Members)
NOTE: The Team then must discus what changes would make them happier in the next Sprint and take action to make it so!
3. Kaizen Investment – How much energy do we dedicate to continuous improvement? • (∑Work Invested in Kaizen) ÷ Work Capacity
4. Honoring Priority – How well do we put work in progress in priority order? • ∑(∑Bad Relationships per SBI) for all SBIs ÷ (#SBIs x (#SBIs – 1))
5. Success at Scale – How often do we succeed when work is of scale X? • Number of SBIs4 Accepted of scale X ÷ Number of Attempted SBIs4 at Scale X
1DSU: Daily Stand-Up 2OE: Original Estimate 3OF: Original Forecast 4SBI: Sprint Backlog Item 5SPO: Scrum Product Owner

5
Example: Caution, Clarity & Bravery
Underestimated
Correctly Estimated
Original Estimates
Work Invested
5 11 5 6 3 9 Underestimated
Anxiety
0 0 0
1 2 3 4 5 6 7 8 9 10 11 12 13 14 15 16 17 18 19 20 21 22 23 24 25 26 27 28 29 30 31 32 33 34 35 36
1 2 3 4 5 6 7 8 9 10 11 12 13 14 15 16 17 18 19 20 21 22 23 24 25 26 27 28 29 30 31 32 33 34 35 36
Clarity
Bravery
17
6 6 3
11
5 0 6
Caution: 5 ÷ 33 = 15.15%
Clarity: 17 ÷ 33 = 51.52%
Bravery: 11 ÷ 33 = 33.33%
8 2 Overestimated 5 2 0
33 pts.


Example: Honoring Priority
Days of the Sprint
Priorities Day 1 Day 2 Day 3 Day 4 Day 5
1 2 1 3
2 3 3
3 2 2 3
4 3 5
5 2 1

Example: Honoring Priority
Days of the Sprint
Priorities Day 1 Day 2 Day 3 Day 4 Day 5
1 2 1 3
2 3 3
3 2 2 3
4 3 5
5 2 1

Example: Honoring Priority
Days of the Sprint
Priorities Day 1 Day 2 Day 3 Day 4 Day 5
1 3
2 2 3
3 3 1
4 3 5
5 3 2

Example: Honoring Priority
Days of the Sprint
Priorities Day 1 Day 2 Day 3 Day 4 Day 5
1 3
2 2 3
3 3 1
4 3 5
5 3 2

Example: Honoring Priority
Days of the Sprint
Priorities Day 1 Day 2 Day 3 Day 4 Day 5
1 3
2 2 3
3 3 1
4 3 5
5 3 2

Example: Success at Scale
100%
0%
-100%
1 2 3 5 8 13 21 34 55
What scale of Backlog Item gives my Team the best chance for success?

A TALE OF TWO TEAMS It was the best of Teams…

Comparing Two Teams

Comparison #1: Burndown Charts
0
10
20
30
40
50
60
Planned
1
2
3
4
5
Story Points
Day of the Sprint
Not Started In Progress Done
Adopted Work Adopted Done Found
Actual
0
5
10
15
20
25
Planned
1
2
3
4
5
Story Points
Day of the Sprint
Not Started In Progress Done
Adopted Work Adopted Done Found
Actual

Comparison #2: Caution vs. Bravery
Caution
9.6%
Clarity
86.5%
Bravery
3.8%
0% 20% 40% 60% 80% 100%
Cau3on, Clarity & Bravery in
Es3ma3on Overes&ma&on is Anxiety. Underes&ma&on is Bravery.
Caution
23.1%
Clarity
65.4%
Bravery
11.5%
0% 20% 40% 60% 80% 100%
Cau3on, Clarity & Bravery in
Es3ma3on Overes&ma&on is Anxiety. Underes&ma&on is Bravery.
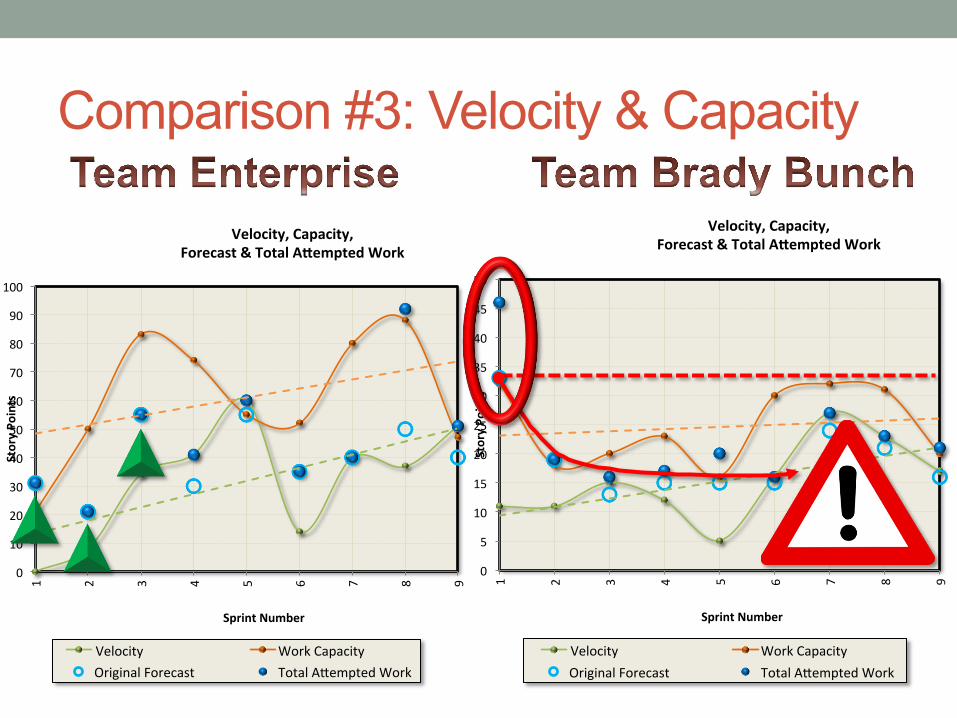
Comparison #3: Velocity & Capacity
0
10
20
30
40
50
60
70
80
90
100
1
2
3
4
5
6
7
8
9
Story Points
Sprint Number
Velocity, Capacity,
Forecast & Total ABempted Work
Velocity Work Capacity
Original Forecast Total AIempted Work
0
5
10
15
20
25
30
35
40
45
50
1
2
3
4
5
6
7
8
9
Story Points
Sprint Number
Velocity, Capacity,
Forecast & Total ABempted Work
Velocity Work Capacity
Original Forecast Total AIempted Work

Comparison #4: Estimation Accuracy
0%
10%
20%
30%
40%
50%
60%
70%
80%
90%
100%
1
2
3
4
5
6
7
8
9
Accuracy
Sprint Number
Es3ma3on Accuracies
EsLmaLon Accuracy Forecast Accuracy
0%
10%
20%
30%
40%
50%
60%
70%
80%
90%
100%
1
2
3
4
5
6
7
8
9
Accuracy
Sprint Number
Es3ma3on Accuracies
EsLmaLon Accuracy Forecast Accuracy

Comparison #5: The Numbers
Velocity
Work Capacity
Focus Factor
Adopted
Found
Estimation Accuracy
Forecast Accuracy
Avg. SBI Size
Avg. Daily Achievement
Bravery
Caution
Volatility
500%
305%
67% (1.61:1)
27%
20%
73%
74%
33% of Velocity
33% of Forecast
4%
10%
17.3%
164%
81%
65% (1.43:1)
17%
28%
73%
82%
22% of Velocity
27% of Forecast
12%
23%
22.5%

Initial Team Assessment

One Sprint Later

After a Few Sprints

Stay Connected • E-mail
• Twitter, Facebook, and G+
• @Scruminc, #Scrum, #Agile
• Our Website
• www.scruminc.com
• check in for announcements, new content and services, book releases, and more!
• ScrumLab
• Scrumlab.scruminc.com
• Articles, videos, papers on all things scrum
• Online Courses
• Advance your learning with our interactive online courses. Visit scrumlab to view upcoming topics.


