MEASURING SUSTAINABLE DEVELOPMENT APPLICATION OF THE GENUINE PROGRESS INDEX TO NOVA SCOTIA HOW EDUCATED ARE NOVA SCOTIANS? EDUCATION INDICATORS FOR THE NOVA SCOTIA GENUINE PROGRESS INDEX Prepared by: Linda Pannozzo, Karen Hayward, and Ronald Colman With assistance from Vanessa Hayward February 2008
Transcript
ME ASUR ING SU STAI NABL E DE VELO PMEN T
AP PLIC ATIO N OF TH E GEN UINE PR OGRE SS IN DEX TO NO VA
SC OTIA
HOW EDUCATED ARE NOVA SCOTIANS?
EDUCATION INDICATORS FOR THE
NOVA SCOTIA GENUINE PROGRESS INDEX
Prepared by:Linda Pannozzo, Karen Hayward, and Ronald Colman
With assistance from Vanessa Hayward
February 2008
GENUINE PROGRESS INDEX Measuring Sustainable Developmentii
Library and Archives Canada Cataloguing in Publication
Pannozzo, Linda How educated are Nova Scotians? [electronic resource] : educationindicators for the Nova Scotia Genuine Progress Index / prepared by Linda Pannozzo,Karen Hayward, and Ronald Colman ; with assistance from Vanessa Hayward.
Includes bibliographical references.ISBN 978-0-9780611-5-9
Education–Nova Scotia–Statistics. 2. Educational indicators–Nova Scotia. I. Hayward, Karen II. Hayward, Vanessa III. Colman,Ronald, 1947- IV. GPI Atlantic V. Title.
LA418.N6P35 2008 370.9716 C2008-901495-2
Publication Type: website: http://www.gpiatlantic.orgAccess Type: open
Errors or misinterpretations and all viewpoints expressed are the sole responsibility of theauthors and GPI Atlantic.
Written permission from GPI Atlantic is required to reproduce this report in whole or inpart. Copies of this report and of other GPI Atlantic publications may be downloaded forfree from the website at http://www.gpiatlantic.org
For those interested in supporting the work of GPI Atlantic, please visit this website,which contains news on GPI Atlantic activities and work in progress, donation andmembership information, latest results, and useful statistics on social, environmental andeconomic realities.
GENUINE PROGRESS INDEX Measuring Sustainable Developmentiii
It is ideas that determine the direction in which civilizations go. If you don’t get yourideas right, it doesn’t matter what policies you try to put in place. The policies willbackfire, because the ideas that dominate will not be the right ideas. You have to beginwith the ideas—then you can simply go ahead and put them into effect.
John Ralston Saul
If society’s education system is ineluctably determined by economic requirements, andthese economic requirements are the requirements of established market-capitalism, thenit follows that we face the prospect of an inevitable transformation of our educationalprocess into an organ of the capitalist market […]. Because an educational process isrequired by its nature to reflect upon and question presupposed patterns of being, itsabsorption into one of these patterns, the global market system, must leave society in avery real sense without its capacity to think. It becomes a kind of mass creature, acollective system of gratifying desires for private profit and consumption with nomovement beyond itself towards understanding and consciousness as a human purpose inits own right.
John McMurtry
This crippling of individuals I consider the worst evil of capitalism. Our wholeeducational system suffers from this evil. An exaggerated competitive attitude isinculcated into the student, who is trained to worship acquisitive success as apreparation for his future career.
Albert Einstein
The goal of education is to make people wiser, more knowledgeable, better informed,ethical, responsible, critical and capable of continuing to learn…[.] Education is also themeans for disseminating knowledge and developing skills, for bringing about desiredchanges in behaviours, values and lifestyles, and for promoting public support for thecontinuing and fundamental changes that will be required if humanity is to alter itscourse, leaving the familiar path that is leading towards growing difficulties, and startingthe uphill climb towards sustainability. Education, in short, is humanity’s best hope andmost effective means to the quest to achieve sustainable development.
United Nations: Decade of Education for Sustainable Development
GENUINE PROGRESS INDEX Measuring Sustainable Developmentiv
TABLE OF CONTENTS
1. Introduction and Framework..................................................................................... 1
1.1 What is an educated populace?................................................................................................2
1.4 A note on data limitations.......................................................................................................10
2. Key Nova Scotia Results ........................................................................................... 12
2.1 Student debt: Average amount of student debt at time of graduation .............................12
2.2 Tuition: Average postsecondary tuition fees ........................................................................18
2.3 Student work hours: Average weekly work hours of full-time postsecondary students..........................................................................................................................................................22
2.4 Financing the public school system: Public expenditures per full-time student (K–12)..........................................................................................................................................................24
2.5 Structure: Class size ................................................................................................................27
2.6 Independence: Public versus private share of sponsored research at Canadianuniversities ......................................................................................................................................29
2.7 Basic adult literacy: Trends in prose and document literacy.............................................32
2.8 Civic literacy: Trends in general political knowledge by age cohort ................................35
2.9 Multicultural literacy: Proportion of Canadians and Nova Scotians who areEnglish–French bilingual ..............................................................................................................37
2.10 Ecological literacy: Percentage who know basic ecological facts ....................................42
GENUINE PROGRESS INDEX Measuring Sustainable Developmentv
LIST OF FIGURES
Figure 1. Framework for the GPI education component .................................................. 7Figure 2. Average amount of government student debt at time of graduation ($2000
CDN), undergraduate classes of 1990, 1995, and 2000, Canada............................. 13Figure 3. Average debt from government student loans at graduation, by province, classes
of 1995 and 2000 ($2000) ..................................................................................... 14Figure 3a. Average amount borrowed (all sources) for the 2003 degree, post-2003 degreeeducation or both, by Maritime province of graduation, 2005…………………………..15Figure 4. Debt repayment rate (percentage of student loan repaid) 2 years after
graduation, all university graduates, by province, 1995 and 2000 .......................... 17Figure 5. Average undergraduate university tuition fees, Canada and provinces,
1990/1991, 2005/2006, and 2007/2008 (in 2005 constant dollars).......................... 19Figure 6. Average university tuition fees by faculty, Canada, 1995/1996 and 2005/2006
(in 2001 constant dollars) ...................................................................................... 20Figure 7. Share of university operating revenue by source, Canada, 1972–2005 ............ 21Figure 8. Average usual work hours worked per week during the school year for full-time
students, aged 18–24 years, with jobs, Canada, 1976–2006 ................................... 22Figure 9. Average usual hours worked per week during the school year for full-time
students, aged 18–24 years, provinces, 1976, 1986, 1996, and 2006 ...................... 23Figure 10. Public expenditure per full-time equivalent public school student, Canada,
1993–2005, ($2003 CDN) ..................................................................................... 25Figure 11. Public expenditure per full-time equivalent student, provinces and territories,
1998/1999 and 2004/2005 ($2003 CDN) ............................................................... 26Figure 12. Class size by educational level, Nova Scotia, 1998–99 to 2005–06............... 28Figure 13. Percentage of classes by size, by educational level, Nova Scotia, 2005–06 ... 29Figure 14. Public versus private share of sponsored research at Canadian universities,
1972–2005 ............................................................................................................ 31Figure 15. Average prose literacy scores across selected regions and provinces, Canadian
population aged 16 and over, 1994 and 2003 ......................................................... 33Figure 16. Average document literacy scores across selected regions and provinces,
Canadian population aged 16 and over, 1994 and 2003.......................................... 34Figure 17. Ecological Footprint by Educational Attainment, Canada, 2005 ................... 47Figure 18. Average scores in the PISA math assessment by quartile of family
socioeconomic status, 15-year-olds, Canada and provinces, 2003 .......................... 56
GENUINE PROGRESS INDEX Measuring Sustainable Developmentvi
LIST OF TABLES
Table 1. Percentile scores of correct answers to general political knowledge questions, byage group, 1984, 1993, 1997, and 2000 ................................................................. 37
Table 2. Percentage of Canadians who are English–French bilingual, by province andterritory, 1991, 1996, and 2001.............................................................................. 39
Table 3. Percentage of Canadians who are English–French bilingual, by language groups,provinces, and territories, 1991, 1996, and 2001.................................................... 41
Table 4. Percentage of the populace who can correctly answer questions about basicenvironmental facts, Canada, United States, Netherlands, Norway, 1993 and 2000 44
GENUINE PROGRESS INDEX Measuring Sustainable Development1
1. Introduction and Framework
Genuine Progress Index (GPI) Atlantic recognizes that the wellbeing of Canadian andNova Scotian society is correlated with certain key conditions, including physical andmental health, healthy ecosystems, decent living standards, strong social ties, vibrantculture, and the ability to balance the often competing demands of paid and unpaid workwith ample leisure time. Wellbeing in the GPI is also explicitly defined to include thewelfare of future generations of Canadians and Nova Scotians as well as that of thepresent generation. In particular, whether Canadians and Nova Scotians have theknowledge required to improve wellbeing and sustainability is seen as a key connectionbetween all of these conditions. In that sense, these GPI educated populace indicatorsserve as vital connective tissue linking all the components of the Genuine Progress Index.
Abundant evidence indicates that education has a significant effect on quality of life interms of its impact on income, population health, environmental quality, civicengagement, and other dimensions of wellbeing. Therefore, the evidence of whether ornot Canadians and Nova Scotians are learning what they need to know to create ahealthy, wise, and sustainable society should be seen in desirable social outcomes such asequity, environmental stewardship, good health, cultural diversity, and social tolerance.From this broad perspective, failure in those realms and poor scores on a range ofrelevant societal indicators might be seen as failures in education and in learningprocesses. This view of educational objectives and indicators is considerably broader thanthat found in conventional education indicator systems.
International organizations such as the United Nations and the Organisation forEconomic Co-operation and Development (OECD), as well as Canadian organizationssuch as the Canadian Council on Learning (CCL), have recognized that learning takesplace not only in formal school settings, but also through informal and nonformal settingssuch as in the home, community, and workplace, and through broadcast, print, andelectronic media.1,2,3
For these reasons, indicators selected for the GPI education component need to go wellbeyond those pertaining to the formal schooling system alone, and must include measuresboth of informal learning and of competencies in specific fields of knowledge that arerequired to improve wellbeing. For example, basic literacy skills improve employabilityand therefore living standards; a basic knowledge of health is required to improvepopulation health; political knowledge is required for effective civic engagement; andknowledge of sustainable living practices is required to improve ecosystem health. Wehave labelled these kinds of knowledge “literacies” in their various fields.
From this broad GPI perspective, good education indicators should also be able to assesswhether Canadians and Nova Scotians are becoming more aware of contextual situationsand systems, social and economic interconnections, current world events, the processes ofthe natural world, and the influence of current lifestyles on population health and on thechoices and quality of life of future generations.
GENUINE PROGRESS INDEX Measuring Sustainable Development2
Thus, education—in the broadest sense of lifelong learning—is seen as a vitalcontribution to, and investment in, both the quality of life and wellbeing of the populaceand the health of the natural environment upon which that populace depends for itssurvival and prosperity.
1.1 What is an educated populace?
In order for a society to assess social progress in general and advances in learning andeducation in particular, it must first identify and define the knowledge required to create ahealthy and sustainable society. In this endeavour, the key question therefore is: What isan educated populace? Some experts have identified proficiency in a range of knowledgeareas that can be taken as indicative of an educated populace in the 21st century, includingbasic literacy (reading, writing, numeracy, problem solving), science, ecology, health,nutrition, civics, arts, culture, statistics, Indigenous knowledge, and the media. Others seethe mark of an educated populace as going beyond knowledge.
In February 2004, for example, the Canadian Education Association (CEA) engagedalmost 100 Canadians from diverse backgrounds in a dialogue asking: “What is aneducated Canadian?”4 Forum participants described educated people as those whodemonstrated values such as care, concern for others, humility, and empathy, and whohave knowledge about, as well as love and appreciation of, life. The most common wordused in the dialogues—said by the CEA to rise effortlessly from the groups—was“wise.”5
Perhaps one of the most inclusive statements concerning the goal of education comesfrom the United Nations:
The goal of education is to make people wiser, more knowledgeable, betterinformed, ethical, responsible, critical and capable of continuing to learn.Education also serves society by providing a critical reflection on the world,especially its failings and injustices, and by promoting greater consciousness andawareness, exploring new visions and concepts, and inventing new techniques andtools. Education is also the means for disseminating knowledge and developingskills, for bringing about desired changes in behaviours, values and lifestyles, andfor promoting public support for the continuing and fundamental changes that willbe required if humanity is to alter its course, leaving the familiar path that isleading towards growing difficulties, and starting the uphill climb towardssustainability. Education, in short, is humanity’s best hope and most effectivemeans to the quest to achieve sustainable development.6
Douglas Stewart, professor emeritus of education at the University of Regina, sees theheart of education as its transformative capacity:
GENUINE PROGRESS INDEX Measuring Sustainable Development3
I am drawing upon a conception of ‘education’ as transformative andempowering. It is one that implies the development and enlargement of humanconsciousness or awareness of the world, of ‘seeing’ or looking at the world withnew and enriched perspectives that transcend the local and particular, and thatenable individuals to achieve a greater meaning and sense of who they are andhow they relate to the world.7
Stewart argues that social, vocational, and economic goals are secondary goals that willcome out of an education that focuses on training the mind or developing “adifferentiated consciousness.”8 Training the mind, according to Stewart, is a prerequisitefor becoming more conscious and aware, and includes the cognitive aspects of social,emotional, and moral development.
In 1997, the Organisation of Economic Co-operation and Development (OECD) initiatedan interdisciplinary program to identify “key competencies” that contribute to a “well-functioning society” and that are “necessary for individuals to lead an overall successfullife, and for society to face the challenges of the present and the future.”9
Key competencies are defined by the demands of modern life and conceptualizedas contributing to a successful life and a well-functioning society, as expressed byuniversal values such as respect for human rights, integrated economic,environmental, and social development, and democratic processes. […]Competent performance or effective action implies the mobilization ofknowledge, cognitive and practical skills, as well as social and behaviorcomponents such as attitudes, emotions, and values and motivations.10
The OECD program identifies three criteria for competencies that are broad enough to beused in a variety of contexts. Competencies should: 1) contribute to highly valuedoutcomes at the individual and societal level; 2) be instrumental for meeting important,complex demands and challenges in a wide variety of contexts; 3) be important for allindividuals.11 The OECD emphasizes that the specific nature of competencies is shapedby cultural, situational, and other contextual factors.
For the education component, GPIAtlantic has used these OECD criteria to assesscompetencies in relation to multiple literacies (including basic literacy, science, ecology,health, nutrition, civics, arts, culture, statistics, Indigenous knowledge, and the media.) Ithas also defined these criteria more specifically using the “principled ground” proposedby John McMurtry. This main principled ground and criterion developed for thiseducation component can be applied to formal, nonformal, and informal education:12
The principled ground and criterion of education that has been proposed is: thoseprocesses of the society that enable learning which is not instrumental to a non-learning goal such as private profit, sectarian belief, or other ulterior purpose thatdoes not enable a more inclusively coherent understanding of human and naturalphenomena.13
GENUINE PROGRESS INDEX Measuring Sustainable Development4
In applying this principled ground to informal learning, McMurtry argues that thelearning or lack of knowledge of Canadians in matters of gender, race, cultural tolerance,ecological awareness, corporate responsibility, and other dimensions of literacy can all beevaluated on the basis of this criterion:
All of these forms of understanding express educational attainment or lack of itinsofar as they enable a more inclusively coherent understanding of human andnatural phenomena. The same principle holds across all spheres, and allows us toinclude these very important forms of understanding as far as we are able in aconsistent manner. For example, sexism or racism score very badly on thecriterion of education, and [the principled ground] explains exactly why. Both areincoherent in principle and non-inclusive in what they take into account as factand as value. The same is true of ecological or corporate irresponsibility.Consistent and exact principled grounds enable us to identify attainments,shortfalls, and trends across informal and formal education spheres as far as islogistically feasible. In all cases, the prior state of the sphere in question canprovide a basic reference body from which to evaluate or measure an educatedpopulace.14
Therefore, the basic criteria used to assess competencies in the various literacies exploredby GPIAtlantic (including basic literacy, science, ecology, health, nutrition, civics, arts,culture, statistics, Indigenous knowledge, and the media), in the few selected literaciespresented in this summary report, are (1) that they “enable a more inclusively coherentunderstanding of human and natural phenomena,” as McMurtry suggests, and (2) thatthey “contribute to highly valued outcomes at the individual and societal level,” as theOECD recommends.
In sum, the long-term goal of any comprehensive and holistic education indicatorprogram should be to track whether, and the degree to which, society is teaching andlearning what is necessary to enable a better understanding of both human society and thenatural world and to create the outcomes required for a sustainable society that promotesthe wellbeing of present and future generations. This includes assessing whetherCanadians and Nova Scotians actually know what they need to know in order to enhancesocial wellbeing, and whether such knowledge is being effectively generated, transmitted,and used for the public good.
This effective creation and use of knowledge for societal benefit requires both basicliteracy and knowledge of multiple literacies in relevant areas such as ecology, civics,science, health, and culture. It must be emphasized that there is no pretence that these andother literacies considered in this study represent a comprehensive assessment of what theCanadian public needs to know in order to be considered “educated.” Rather, they can beconsidered as “markers” or “indicators” of an educated populace. In other words, it isreasonable to consider a populace “educated” if it can read, write, and do basic math; if ithas a reasonable understanding about important issues that affect daily life, such as thoseconcerned with health, science, the environment, and its own and other cultures andhistories; if it can understand the meaning of statistics and how the media presents
GENUINE PROGRESS INDEX Measuring Sustainable Development5
information; and if it knows enough to make informed decisions when voting. A focus onthese and other selected key markers does not deny that there are other areas important toan educated populace that are not assessed in this study.
1.2 Conventional education indicators
By contrast to the goals outlined above, an extensive exploration of the literature in thisfield found that the conventional education indicators that currently exist to assesseducational attainment are too limited, and that many key learning outcomes are notadequately represented. As well, the last two decades have seen a surge in educationindicators related to economic policy objectives in an effort to assess whether formaleducation in particular is contributing adequately to economic productivity andcompetitiveness in the global economy. But critics have argued that what is perhaps mostproblematic about this increased focus on the role of education in serving economicimperatives is that broader considerations, such as “the role of schooling in social justice,the inculcation of democratic values and the transmission of cultural values and forms ofknowledge,” have become increasingly marginalized.225
With few exceptions, like basic literacy assessments, most conventional educationindicators provide very little information about learning or social outcomes, which arethe key concerns of GPIAtlantic. In fact, a Special Study Panel on Education Indicatorsconvened by the U.S. Department of Education in the early 1990s to review existingeducation indicator models and the criteria for indicator selection concluded that thecommon practice of relying on limited sets of conventional education indicators was“misguided” and did not “do justice to the complexity of the educational enterprise.”15
The Special Study Panel rejected the dominant ‘input-processes-output’ model statingthat it was “flawed” and “encouraged the view that the educational system produces‘products’ by taking various raw materials (e.g. students and resources) and processingthem in schools.” 16 This critique has also been echoed by UNESCO’s Education for Allreport and other experts in the field.
It is noteworthy that the U.S. Study Panel’s argument in this regard is precisely therationale for developing broader and more comprehensive measures of societal progresslike the GPI. What a society measures reflects what it values, and determines what getsonto the policy agenda of governments. A narrow focus on GDP-based measures ofprogress not only “may create more problems than [it solves],” to borrow the panel’sphrase, but also skews policy responses and ignores key social issues like populationhealth, environmental quality, and community vitality. In sum, if a key goal of the GPI isto broaden our assessments of progress in order to gauge wellbeing more accurately andcomprehensively, we must apply the same criterion to each component of the GPI,including our education indicators—as the U.S. Study Panel and McMurtry recommend.
A detailed critique of conventional education indicators has been undertaken byGPIAtlantic. Here we simply note that these conventional indicators focus too narrowlyon outputs of the formal education system that may be unrelated to desired learning and
GENUINE PROGRESS INDEX Measuring Sustainable Development6
societal outcomes, that they generally ignore informal and non-formal learning processesthat may have a greater impact on learning outcomes than schooling, and that theyfrequently send contradictory messages as noted for example in Chapter 3, section 2below.
1.3 Indicator framework
The following framework was developed by GPIAtlantic and is based on a systems andsustainability lens that encompasses all aspects of lifelong learning from early childhoodeducation, through primary and secondary school, to higher education, adult education,and learning for life. The framework also includes “lifewide” learning—including theformal education system, both work-related and personal-interest nonformal learning, andtacit and informal learning—in all its settings. Ideal comprehensive indicators that mighteventually populate this framework (but for which data mostly do not yet exist) arepresented in a separate list accompanying this summary report. These ideal indicatorsrepresent a long-term developmental objective for this domain.
Among the many potential frameworks for education indicators reviewed, presented, andexplored by GPIAtlantic, five (including the GPI framework itself) were identified asforming an appropriate basis for an indicator framework for the GPI educationcomponent. The five sources identified as main influences are:
1. Educational values for an ecologically sustainable future as defined by C.A. Bowers17
2. The Delors report, Learning the Treasure Within, from UNESCO, especially Delors’four pillars of learning—learning to be, learning to live together, learning to know,and learning to do18
3. The Centre for Ecoliteracy framework comprising four metaphors, which correspondto the four-part Delors framework—learning for spirit, heart, head, and hands19
4. The United Nations Decade of Education for Sustainable Development (DESD)20
5. The Genuine Progress Index itself—particularly the 19 domains (in addition toeducation), which are taken to represent the desired societal outcomes of effectiveeducational processes and structures.21
The framework for the GPI education component is also based on a relationship betweenthe pillars of learning (Delors) on the one hand and specified economic and socialoutcomes that the educational system is expected to produce on the other. Thisframework, illustrated in Figure 1 below, is circular, with the individual componentsnested within each other, rather than formed by a vertical or horizontal relationship.
GENUINE PROGRESS INDEX Measuring Sustainable Development7
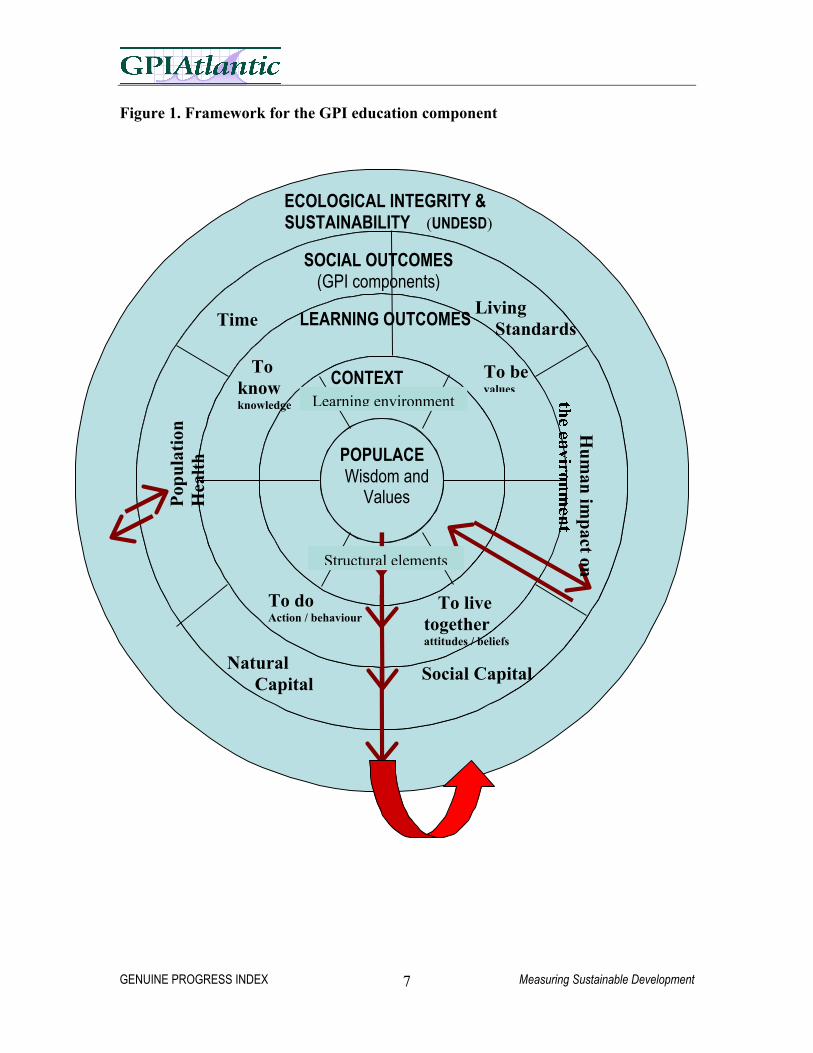
Figure 1. Framework for the GPI education component
POPULACEWisdom and
Values
CONTEXT
LEARNING OUTCOMES
ECOLOGICAL INTEGRITY & SUSTAINABILITY (UNDESD)
SOCIAL OUTCOMES(GPI components)
Pop
ulat
ion
Hea
lth
Time Living
Standards
Hum
an impact on
Social Capital
Natural Capital
To livetogetherattitudes / beliefs
To doAction / behaviour
To bevalues
Toknowknowledge Learning environment
Structural elements
GENUINE PROGRESS INDEX Measuring Sustainable Development8
This relationship demonstrates that the identified learning processes and outcomes have amulti-causal and interdependent relationship, rather than a linear relationship based onoverly simplistic cause and effect, or input–output models.
As Figure 1 illustrates, the wisdom and values of the populace are at the centre of a seriesof concentric circles, in which the larger, overarching context of ecological integrity andsustainability forms the outermost circle. Between these two basic referencepoints—reflecting the innermost wisdom and values of the populace and the all-encompassing ecological context—are intermediate circles representing: contextualelements (or determinants) of learning, learning outcomes, and social outcomes. In thismulti-dimensional approach, all of the elements within the circles of the frameworkinteract to produce an educated populace, as illustrated by the arrows.
The innermost circle of the framework in Figure 1, labelled “Populace: wisdom andvalues,” represents the wisdom and values of the populace, which are both an outcomeand a determinant of an educated populace. Educators such as Nicholas Maxwell, of theUniversity of London, suggest that the basic aim of learning should be to cultivatewisdom in society rather than only to promote the acquisition of knowledge, sinceknowledge without the wisdom to use it beneficially can be extremely dangerous, as seenin its contributions to war and environmental damage.22
There is a general consensus among researchers that acquiring wisdom is a lifelongprocess consisting of an amalgamation of knowledge and deep understanding. Thisunderstanding has been identified as including particular characteristics that have beenassociated with wisdom, such as awareness that we are part of something larger thanourselves, compassion and respect for all life forms, action toward improving thecommon good, and profound transformation, on both individual and societal levels.23
If the cultivation of wisdom is one bedrock of an educated populace, then the cultivationof particular values is the other. GPIAtlantic recognizes that any measure of progress isbased on the implicit question—“progress towards what?”—and is therefore value-basedby its very nature. Measures of progress and wellbeing assess progress towards definedgoals and therefore inherently embody a vision or ideal towards which society aspires. Inother words, it is literally not possible to measure progress without a clearly definedsense of what it is that society wants to achieve, which in turn is based on fundamentalvalues. Because values are learned and transmitted through a wide range of learningprocesses, and because they, in turn, act as a determinant of educational content, they area central element of any comprehensive education indicator framework.
The all-encompassing outer circle in the framework chart—ecological integrity andsustainability—represents the overarching framework through which all othercomponents are evaluated. A key criterion for determining relevance in selectingindicators of an educated populace is therefore the concept of sustainability, or theunderstanding that development must meet the needs of the present without jeopardizingthe ability of future generations to meet their own needs. Ideally, therefore, it would bepossible to assess the degree to which existing learning processes and educational
GENUINE PROGRESS INDEX Measuring Sustainable Development9
systems in Canada transmit or ignore the dependence of human society on the naturalworld—our essential life support system— and the degree to which they teach behavioursthat support or undermine ecosystem health and sustainability.
Moving from the inside out, the contextual elements of learning form the next circle inthe framework. These contextual factors are divided into two parts. The first part of thiscontextual circle includes the physical and mental environments within which learningtakes place. This section specifically looks at the contexts of lifelong and life-widelearning, including nonformal and informal learning; the influences ofcommercialization on education; participation in cultural activities as a reflection ofinformal learning environments; and the influence of the mental environment (massmedia, advertising messages, etc.) on learning.
The second part of the contextual circle includes structural elements of the formaleducation system, such as financial investments in education, access to education, andopportunities for learning. These elements correspond to those usually found inconventional education indicator frameworks, and they are generally represented byinput, process, and output indicators such as financing (input), class size (process), andgraduation rates (output). Specifically, these structural elements include formal educationstructures from early childhood education settings through elementary and secondaryschools to universities, financing systems (including shifting balances between public andprivate funding), student achievement testing, and access and barriers to education. Thehigher education section of this analysis includes a discussion of several key contextualelements, ranging from the role of the university in society to research and developmentwithin the university and the extent of independence of that research.
The learning outcomes circle— represents what an educated populace potentially needsto know to create a healthy and sustainable society. This view of successful learningoutcomes vastly expands the conventional use of the term “literacy” to encompass amuch broader spectrum of knowledge, which collectively is sometimes referred to as“cultural literacy” or as “ecoliteracy.” Ecologist and educator David Orr suggests that, inorder to meet the challenge of sustainability, society needs to become “ecoliterate.”24
Ecoliteracy goes beyond environmental or ecological literacy alone and includes a broadrange of literacies or knowledge needed to foster wellbeing in a sustainable world. Itincludes the basics of knowing how to read, write, and count, but it also includesadequate knowledge of health, ecology, science, civics, culture, and other aspects ofhuman interaction with the larger world.25, 26
The literacies explored in detail by GPIAtlantic include the following: basic adultliteracy, arts literacy, media literacy, health literacy, food and nutrition literacy, civicliteracy, multicultural literacy, Indigenous knowledge literacy, statistics literacy,ecological literacy, and science literacy. This is not an exhaustive list of learningoutcomes, but it is recommended here as a useful, adequate minimum that can begin toassess what people need to know to improve wellbeing and sustainability. The availableevidence indicates that reasonable competence in the 11 different literacies listed here canpotentially provide Canadians and Nova Scotians with the tools they need to live well and
GENUINE PROGRESS INDEX Measuring Sustainable Development10
to leave a decent future for their children. Competence in these multiple literacies cantherefore be taken as indicators or markers of an educated populace from a learningoutcomes perspective.
Finally, the social outcomes circle completes the framework. This element of theeducation framework links the indicators in this domain with the indicators in the other19 GPI domains. From GPIAtlantic’s perspective, therefore, the components of the socialoutcomes circle in Figure 1 above represent the desired social outcomes that canpresumably be nurtured and improved by a truly educated populace.
Exploring this relationship between learning outcomes and social outcomes is vital forpolicy purposes. To give just one example, using the framework in Figure 1 as a basis, anexploration of the rise of obesity rates might examine the comparative influence ofschool-based nutritional education programs with the learning that occurs throughadvertising and other commercial influences and the financing of each of these learningcontexts. In short, this framework enables us systematically to relate learning contextslike television, commercials, and classroom instruction with learning outcomes likeknowledge of healthy eating, and finally with social outcomes like rates of obesity.
While Figure 1 above provides a suitable framework for the development of indicatorsfor the GPI education component, it must be emphasized that GPIAtlantic has hithertoundertaken data collection and analysis for only two parts of this framework: 1) theformal education dimension of the context circle, and 2) the middle learning outcomescircle. This brief summary includes just a few select indicators from each of these twoparts for which data are available.
Other key dimensions of the overall framework depicted in Figure 1 have been exploredby GPIAtlantic but have not yet been the subject of data collection and analysis for thisreport. Some of these key dimensions are briefly reviewed in the form ofrecommendations for future indicator development in Section 4 of this summary.
In addition, as noted, a comprehensive list of ideal indicators, which could eventually beused to populate the above framework as data become available, accompanies thissummary report.
1.4 A note on data limitations
A number of data challenges arose in the process of developing indicators for theeducation component of the GPI. First, there are a number of indicators in theaccompanying comprehensive list of indicators where no pan-Canadian data wereavailable, where only single-year data existed, where the data available were too old to beuseful, or where no data were available at all. For example, no pan-Canadian data wereavailable for class size, victimization rates of teachers and students, or research anddevelopment funds for basic or curiosity-driven research. Only single-year data wereavailable for some indicators, including the incidence of advertising in public schools,
GENUINE PROGRESS INDEX Measuring Sustainable Development11
public engagement in creative arts activities, health literacy scores, and other indicatorsusing one-time survey results, such as the immigrants’ citizenship quiz given only once tothe general public.
Second, a substantial portion of essential data needed for this domain is available fromStatistics Canada for a fee. In select cases where data were not available through anysecondary source, GPIAtlantic purchased these data from Statistics Canada at aconsiderable cost. However, financial resources were not available to buy all the requireddata. Needless to say, where primary Statistics Canada data were available for free, wehave used them. In cases where primary data were not available, we have often relied onfree copies of such data produced by other agencies, such as the Council of Ministers ofEducation Canada’s Reports of the Pan-Canadian Education Indicators Program (PCEIP),for example, or even by Statistics Canada itself in publicly available summary andanalytical reports.
Also, many private polling firms have produced data series that could be useful topopulate some of the multiple literacy indicators. However, this syndicated research isextremely expensive to purchase, and many of these data are not freely available andhave not been publicly released.27
The lack of data is especially the case for indicators of multiple literacies. However,current data, research, and promising initiatives in various parts of the world, includingCanada, suggest that it is indeed possible to develop suitable composite indicators foreach of the literacies. For example, while no assessment of science literacy is yet possiblefor the adult population in Canada, the United States has comprehensive, multiple-yearnational data on science literacy at the population level that could serve as a model forCanada.
Although experimental work that may facilitate development of indicators for theseliteracies in the future is continuing in various fields, there are currently very fewCanadian data sources that can be used to populate suitable indicators in these areas atpresent. Therefore, as seen by comparison with the accompanying list of idealcomprehensive indicators at the end of this summary report, it is not yet possible toproduce an inclusive and adequate set of education indicators.
GENUINE PROGRESS INDEX Measuring Sustainable Development12
2. Key Nova Scotia Results
This report on indicators of education constitutes one of the 20 core social, economic, andenvironmental components of the Nova Scotia Genuine Progress Index (GPI). Thissection provides a summary of a few key findings for Nova Scotia in the areas of formaleducation and multiple literacies, selected from among the dozens of indicators exploredin detail by GPIAtlantic for this study, with selection based largely on data availability.
2.1 Student debt: Average amount of student debt at time ofgraduation
Students pursuing a postsecondary education today face increased financial pressures.Rising tuition fees, student debt levels, loan default rates, student employment rates, andstudent work hours, along with slower loan repayment rates and increased reliance onprivate fundraising, are all evidence of this trend.
Increased student debt levels, in particular, raise serious concerns both about equitableaccess to postsecondary education and about the wellbeing of Canadian youth who mayface the stress of loan repayment requirements for years to come. Canadian youth areexperiencing higher rates of low wage employment which may accentuate the difficultyof meeting loan payment obligations.
According to Statistics Canada, Canadian student debt levels increased dramatically inthe 1990s. The undergraduate university graduating class of 2000 owed an average of$19,000 in government debt, about 30% more than the class of 1995, and 76% more thanthe class of 1990 (in 2000 constant dollars). College graduates in the class of 2000 withstudent loans from government loan programs owed $12,500, 21% more than theircounterparts in the class of 1995, and 76% more than those in the class of 1990 (seeFigure 2 below).
When private sources of debt are also included, debt loads are much higher. In 2000, the11% of undergraduate university graduates who owed money to both government andnon-government sources had an average combined debt of $32,000. The averagecombined public and private debt of the 8% of college graduates who owed money toboth sources in 2000 was $20,000.28 Unfortunately, no time series data are available forcombined public and private debt loads, so Figure 2 reports only on debt fromgovernment loan programs.
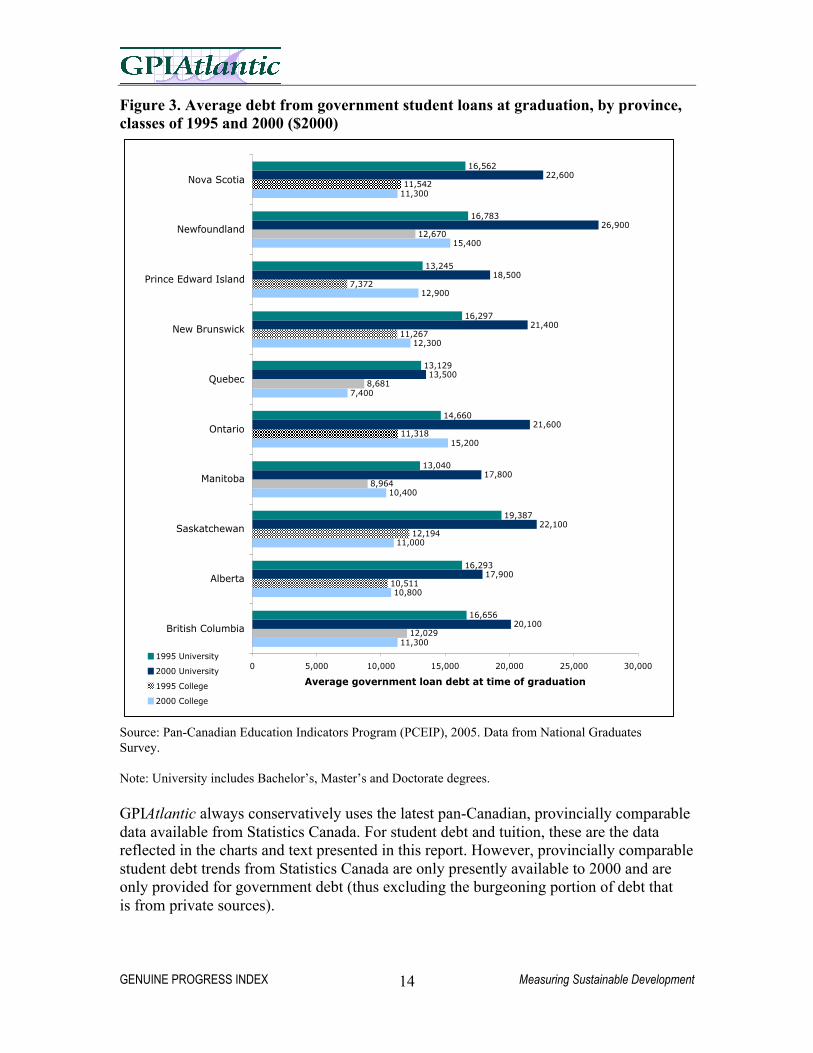
Result: Postsecondary students in Nova Scotia today are graduating withunprecedented debt loads. NS has the second highest level of (university)student debt in the country.
GENUINE PROGRESS INDEX Measuring Sustainable Development13
Figure 2. Average amount of government student debt at time of graduation ($2000CDN), undergraduate classes of 1990, 1995, and 2000, Canada
Source: Mary Allen and Chantal Vaillancourt. Class of 2000 – Student Loans, Canadian Social Trends.Autumn 2004. Statistics Canada. Catalogue No. 11-008. Data from National Graduates Surveys (classes of1990, 1995, 2000).
Note: This Figure refers only to graduates who have not completed any further education in the two yearsafter graduation.
At the provincial level, average student debt from government sources for the class of2000 was highest in Newfoundland and Labrador, followed by Nova Scotia,Saskatchewan, Ontario, and New Brunswick. Quebec had by far the lowest average debtlevels in the country—about half the levels in Newfoundland and Labrador (see Figure 3below). This is clearly related to the relatively lower tuition levels in Quebec and thecorrespondingly higher provincial government support of postsecondary education in thatprovince. In addition, while average university student debt levels increased sharply inalmost all provinces when comparing the classes of 1995 and 2000, they increased onlymarginally in Quebec (by 3%) during this period. The sharpest increases were inNewfoundland and Labrador (60%), Ontario (47%), Prince Edward Island (40%), andNova Scotia and Manitoba (36.5% each). As noted below, these 2000 Newfoundlandnumbers do not account for the lowering of tuition fees in that province since that time.
12,500
19,000
10,300
14,500
7,100
10,800
0 5,000 10,000 15,000 20,000
College
Bachelor's
Average student debt
1990
1995
2000
GENUINE PROGRESS INDEX Measuring Sustainable Development14
Figure 3. Average debt from government student loans at graduation, by province,classes of 1995 and 2000 ($2000)
Source: Pan-Canadian Education Indicators Program (PCEIP), 2005. Data from National GraduatesSurvey.
Note: University includes Bachelor’s, Master’s and Doctorate degrees.
GPIAtlantic always conservatively uses the latest pan-Canadian, provincially comparabledata available from Statistics Canada. For student debt and tuition, these are the datareflected in the charts and text presented in this report. However, provincially comparablestudent debt trends from Statistics Canada are only presently available to 2000 and areonly provided for government debt (thus excluding the burgeoning portion of debt thatis from private sources).
11,300
10,800
11,000
10,400
15,200
7,400
12,300
12,900
15,400
11,300
12,029
10,511
12,194
8,964
11,318
8,681
11,267
7,372
12,670
11,542
20,100
17,900
22,100
17,800
21,600
13,500
21,400
18,500
26,900
22,600
16,656
16,293
19,387
13,040
14,660
13,129
16,297
13,245
16,783
16,562
0 5,000 10,000 15,000 20,000 25,000 30,000
British Columbia
Alberta
Saskatchewan
Manitoba
Ontario
Quebec
New Brunswick
Prince Edward Island
Newfoundland
Nova Scotia
Average government loan debt at time of graduation
1995 University
2000 University
1995 College
2000 College
GENUINE PROGRESS INDEX Measuring Sustainable Development15
In light of these limitations—both of scope and currency—in the available pan-CanadianStatistics Canada data, it is important to note that there are very recent Nova Scotia-specific and regional data (released just this year), which show that average student debtin the Maritimes from all sources (government student loans and private sources) hascontinued to climb—increasing by 10% in recent years from $24,976 in 2003 to $27,486in 2007 ($2007).29
Survey data from the Maritime Provinces Higher Education Commission (MPHEC)indicate that the average amount of student debt in Nova Scotia from all sources for theclass of 2003 was $27,148, second to Prince Edward Island ($32,390). New Brunswickstudents owed $26,199 in student loans (all figures in 2005 dollars). In Nova Scotia, 40%of all graduates with student debt owed more than $30,000 in loans (see Figure 3abelow). 30
Figure 3a. Average amount borrowed (all sources) for the 2003 degree, post-2003degree education or both, by Maritime province of graduation, 2005
$32,390
$27,148 $26,199 $27,104
$0
$5,000
$10,000
$15,000
$20,000
$25,000
$30,000
$35,000
PEI NS NB Maritimes
aver
age
stud
ent d
ebt (
all s
ourc
es)
Average borrowed
Source: Maritime Provinces Higher Education Commission. 2007. 2005 Survey of 2003 MaritimeUniversity Graduates: Selected Provincial Statistics. MPHEC. Available fromhttp://www2.mphec.ca/english/pdfs/GFU2003in2005ProvEng.pdf. Table 1.11a.
In light of the limitations in the available Statistics Canada data on student debt, anyfuture updates of this Education Indicators Report for Nova Scotia would also utilizethese regional data in order to present a more current and complete picture of the studentdebt situation in this province (counting both government and private loan sources).Unfortunately, these more recent provincial and Maritime data are not comparable withdata from other provinces.
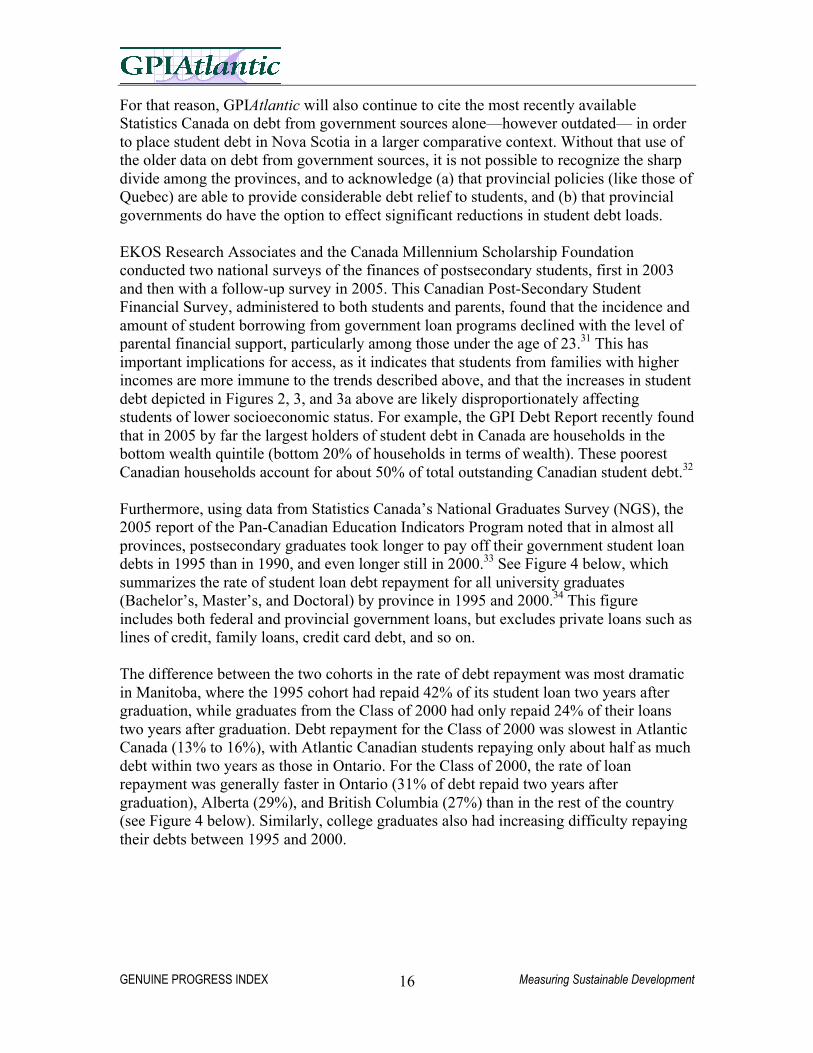
GENUINE PROGRESS INDEX Measuring Sustainable Development16
For that reason, GPIAtlantic will also continue to cite the most recently availableStatistics Canada on debt from government sources alone—however outdated— in orderto place student debt in Nova Scotia in a larger comparative context. Without that use ofthe older data on debt from government sources, it is not possible to recognize the sharpdivide among the provinces, and to acknowledge (a) that provincial policies (like those ofQuebec) are able to provide considerable debt relief to students, and (b) that provincialgovernments do have the option to effect significant reductions in student debt loads.
EKOS Research Associates and the Canada Millennium Scholarship Foundationconducted two national surveys of the finances of postsecondary students, first in 2003and then with a follow-up survey in 2005. This Canadian Post-Secondary StudentFinancial Survey, administered to both students and parents, found that the incidence andamount of student borrowing from government loan programs declined with the level ofparental financial support, particularly among those under the age of 23.31 This hasimportant implications for access, as it indicates that students from families with higherincomes are more immune to the trends described above, and that the increases in studentdebt depicted in Figures 2, 3, and 3a above are likely disproportionately affectingstudents of lower socioeconomic status. For example, the GPI Debt Report recently foundthat in 2005 by far the largest holders of student debt in Canada are households in thebottom wealth quintile (bottom 20% of households in terms of wealth). These poorestCanadian households account for about 50% of total outstanding Canadian student debt.32
Furthermore, using data from Statistics Canada’s National Graduates Survey (NGS), the2005 report of the Pan-Canadian Education Indicators Program noted that in almost allprovinces, postsecondary graduates took longer to pay off their government student loandebts in 1995 than in 1990, and even longer still in 2000.33 See Figure 4 below, whichsummarizes the rate of student loan debt repayment for all university graduates(Bachelor’s, Master’s, and Doctoral) by province in 1995 and 2000.34 This figureincludes both federal and provincial government loans, but excludes private loans such aslines of credit, family loans, credit card debt, and so on.
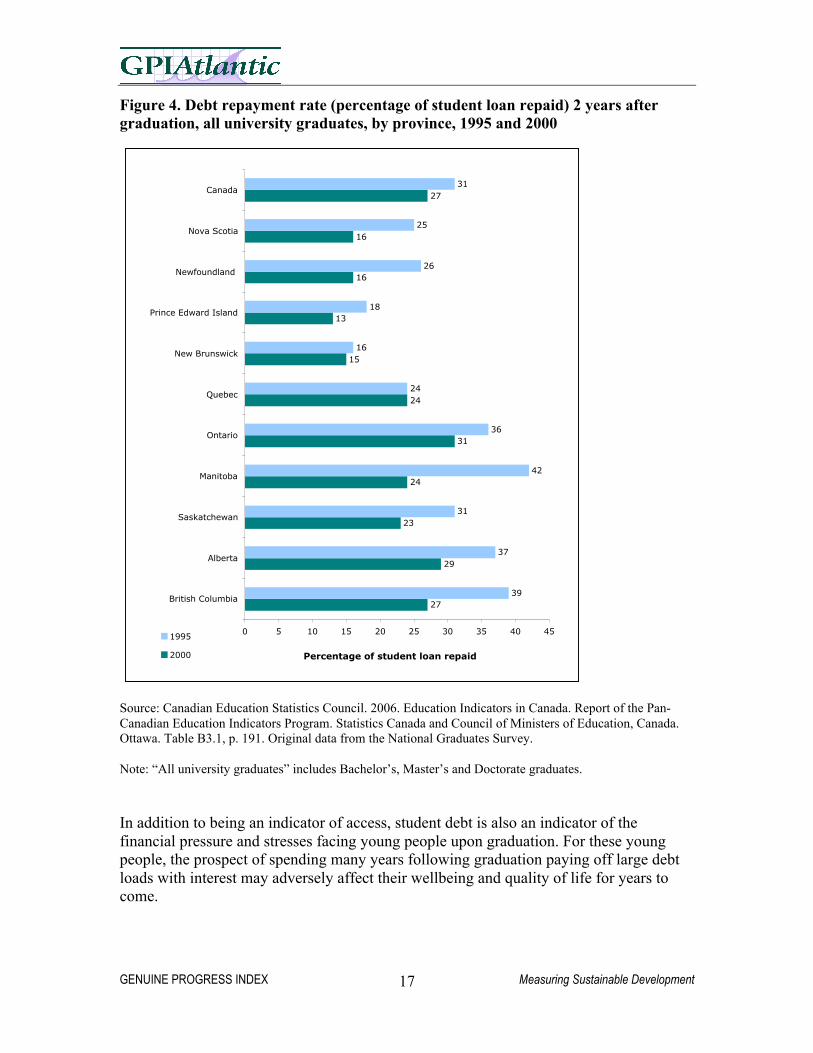
The difference between the two cohorts in the rate of debt repayment was most dramaticin Manitoba, where the 1995 cohort had repaid 42% of its student loan two years aftergraduation, while graduates from the Class of 2000 had only repaid 24% of their loanstwo years after graduation. Debt repayment for the Class of 2000 was slowest in AtlanticCanada (13% to 16%), with Atlantic Canadian students repaying only about half as muchdebt within two years as those in Ontario. For the Class of 2000, the rate of loanrepayment was generally faster in Ontario (31% of debt repaid two years aftergraduation), Alberta (29%), and British Columbia (27%) than in the rest of the country(see Figure 4 below). Similarly, college graduates also had increasing difficulty repayingtheir debts between 1995 and 2000.
GENUINE PROGRESS INDEX Measuring Sustainable Development17
Figure 4. Debt repayment rate (percentage of student loan repaid) 2 years aftergraduation, all university graduates, by province, 1995 and 2000
Source: Canadian Education Statistics Council. 2006. Education Indicators in Canada. Report of the Pan-Canadian Education Indicators Program. Statistics Canada and Council of Ministers of Education, Canada.Ottawa. Table B3.1, p. 191. Original data from the National Graduates Survey.
Note: “All university graduates” includes Bachelor’s, Master’s and Doctorate graduates.
In addition to being an indicator of access, student debt is also an indicator of thefinancial pressure and stresses facing young people upon graduation. For these youngpeople, the prospect of spending many years following graduation paying off large debtloads with interest may adversely affect their wellbeing and quality of life for years tocome.
27
29
23
24
31
24
15
13
16
16
27
39
37
31
42
36
24
16
18
26
25
31
0 5 10 15 20 25 30 35 40 45
British Columbia
Alberta
Saskatchewan
Manitoba
Ontario
Quebec
New Brunswick
Prince Edward Island
Newfoundland
Nova Scotia
Canada
Percentage of student loan repaid
1995
2000
GENUINE PROGRESS INDEX Measuring Sustainable Development18
2.2 Tuition: Average postsecondary tuition fees
The increase in student debt in the 1990s, illustrated in Figures 2 and 3 above, mirrors thesimultaneous rise in postsecondary tuition fees. Between 1990/1991 and 2007/2008,average annual undergraduate tuition fees in Canada more than doubled from less than$2,000 to $4,382(constant $2005). In many provinces, the rise in tuition fees has sharplyexceeded the Canadian average, leading to increasing inter-provincial disparities. Forexample, in Nova Scotia, average undergraduate tuition jumped by nearly 126% from$2,519 in 1990/1991 to $5,694 in 2007/2008 ($2005), and is currently the highest in thecountry (see Figure 5 below). Undergraduate tuition fees in Nova Scotia are presentlynearly 30% higher than the Canadian average and 190% higher than in Quebec. It shouldbe noted that between 2005/2006 and 2007/2008, tuition fees in Nova Scotia declined by9%.
However, it should be acknowledged that there has been some controversy over whetherthis is in fact the case. According to the Nova Scotia Department of Education,administrative changes at Acadia University “caused some statistical anomalies in NovaScotia’s reported numbers.”35 According to an October, 2007, Department news release,Acadia University transferred a $1,419 laptop computer charge from tuition tocompulsory fees, which “artificially increased StatsCan’s reported tuition decrease” andartificially increased the rise in compulsory fees in Nova Scotia.
According to Statistics Canada, compulsory fees in Nova Scotia increased by 26%between 2006/2007 and 2007/2008 (the Canadian average increase was 10%). However,the Nova Scotia Education Department maintains that “even when the Acadia anomaly isfactored out, Nova Scotia remains one of two provinces to reduce tuition at a time whenseveral provinces are increasing tuition.”36
Yet Kaley Kennedy, Nova Scotia representative of the Canadian Federation of Students,argues that the increases in compulsory fees, and the fact that these fees are already thehighest in the country, render the recent tuition cuts meaningless.37 According toStatistics Canada, Nova Scotia university students pay an average of $882 in extra fees,which is one-third higher than the Canadian average. Statistics Canada reports thataverage compulsory fees in Canada in 2007/2008 were $663.38
According to the MPHEC, between 1999/2000 and 2006/2007 the enrolment ofMaritimers at Memorial University in Newfoundland increased 884% from 103 studentsto 1,014 students. Students originally from Nova Scotia showed a more than ten-foldincrease from 64 students in 1999/2000 to 725 students in 2006/07. This increase in
Result: Nova Scotia has the highest average undergraduate tuition fees inCanada. Over the last 30 years, tuition has accounted for an increasing share ofuniversity operating revenue in Canada.
GENUINE PROGRESS INDEX Measuring Sustainable Development19
enrolment from the Maritimes has been largely attributed to the NL government freezeand lowering of tuition fees in that province.39
Figure 5. Average undergraduate university tuition fees, Canada and provinces,1990/1991, 2005/2006, and 2007/2008 (in 2005 constant dollars)
Source: Statistics Canada. University Tuition Fees. The Daily. Thursday, September 1, 2005; StatisticsCanada. University Tuition Fees. The Daily. Thursday October 18, 2007. Data source: Survey of Tuitionand Living Accommodation Costs for Full-time Students, Statistics Canada.
Note: All figures for 1990/1991 were converted to 2005 constant dollars using Bank of Canada’s InflationCalculator, February 19, 2007. Figures for 2007/2008 were converted using Bank of Canada’s InflationCalculator, October 22, 2007.
4,703
4,809
4,625
3,278
5,213
1,962
5,554
4,301
2,551
5,694
4,382
4,874
5,125
5,062
3,272
4,881
1,900
5,037
4,645
2,606
6,281
4,214
2,346
1,669
2,005
1,962
2,180
1,173
2,498
2,432
1,744
2,519
1,900
0 1,000 2,000 3,000 4,000 5,000 6,000 7,000
British Columbia
Alberta
Saskatchewan
Manitoba
Ontario
Quebec
New Brunswick
Prince Edward Island
Newfoundland
Nova Scotia
Canada
Average tuition fees
1990/1991
2005/2006
2007/2008
GENUINE PROGRESS INDEX Measuring Sustainable Development20
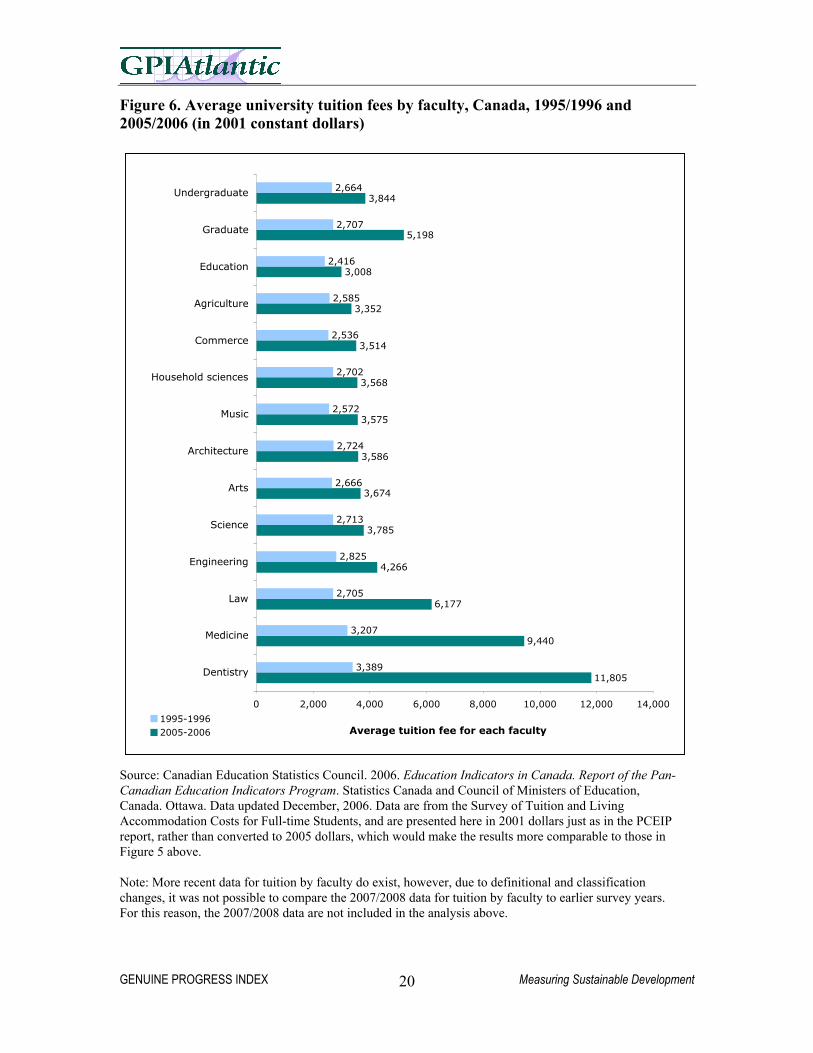
Figure 6. Average university tuition fees by faculty, Canada, 1995/1996 and2005/2006 (in 2001 constant dollars)
Source: Canadian Education Statistics Council. 2006. Education Indicators in Canada. Report of the Pan-Canadian Education Indicators Program. Statistics Canada and Council of Ministers of Education,Canada. Ottawa. Data updated December, 2006. Data are from the Survey of Tuition and LivingAccommodation Costs for Full-time Students, and are presented here in 2001 dollars just as in the PCEIPreport, rather than converted to 2005 dollars, which would make the results more comparable to those inFigure 5 above.
Note: More recent data for tuition by faculty do exist, however, due to definitional and classificationchanges, it was not possible to compare the 2007/2008 data for tuition by faculty to earlier survey years.For this reason, the 2007/2008 data are not included in the analysis above.
11,805
9,440
6,177
4,266
3,785
3,674
3,586
3,575
3,568
3,514
3,352
3,008
5,198
3,844
3,389
3,207
2,705
2,825
2,713
2,666
2,724
2,572
2,702
2,536
2,585
2,416
2,707
2,664
0 2,000 4,000 6,000 8,000 10,000 12,000 14,000
Dentistry
Medicine
Law
Engineering
Science
Arts
Architecture
Music
Household sciences
Commerce
Agriculture
Education
Graduate
Undergraduate
Average tuition fee for each faculty1995-19962005-2006
GENUINE PROGRESS INDEX Measuring Sustainable Development21
Because the latest Statistics Canada data on student debt from government sources arefrom 2000, Figure 3—showing student debt in Newfoundland and Labrador as thehighest in the country in 2000, followed by Nova Scotia—do not reflect these morerecent NL government policy changes and their consequent effect on student debt loads.
Figure 6 above illustrates the skyrocketing of tuition fees in several professional graduateprograms between 2000/2001 and 2005/2006. In particular, annual tuition fees in law,medicine, and dentistry in Canada jumped by 128%, 194%, and 248%, respectively. Indentistry and medicine, average annual tuition fees in 2005/2006 were $11,805 and$9,440, respectively ($2001).
Figure 7. Share of university operating revenue by source, Canada, 1972–2005
Source: Data are originally from Statistics Canada’s Financial Information of Universities and Colleges(FIUC) survey, and were provided to GPIAtlantic free of charge by Larry Dufay, Senior Research Officer,Canadian Association of University Teachers (CAUT).
Note: “Other” includes revenues from donations (including bequests), non-government grants andcontracts, investments, and the sale of services and products. Prior to 2000, funds from the sale of productsand services were not counted as contributing towards general operating revenue.
Government grants and contracts Student fees, including tuition Other
GENUINE PROGRESS INDEX Measuring Sustainable Development22
Tuition fees and other student fees also now make up a much larger share of totaluniversity operating revenues, doubling in the last 34-year period from 18.0% ofoperating revenues in 1972 to 35.9% in 2005. Correspondingly, the government share oftotal operating revenues, counting all levels of government, decreased from 78.6% in1972 to 56.7% in 2005 (see Figure 7 above).
2.3 Student work hours: Average weekly work hours of full-timepostsecondary students
Another important access issue closely linked to financial barriers is that many full-timestudents have to work in order to finance their studies. The additional time commitmentrequired by their jobs has an effect on the amount of time these students can devote totheir studies, and these time pressures in turn can result in increased stress.40 This factoralso has equity implications. Students who have to work long hours to help finance theirpostsecondary studies will have less time for study, may perform less well, and aretherefore at a distinct academic disadvantage compared to students who do not have tohold down jobs or who work fewer hours.
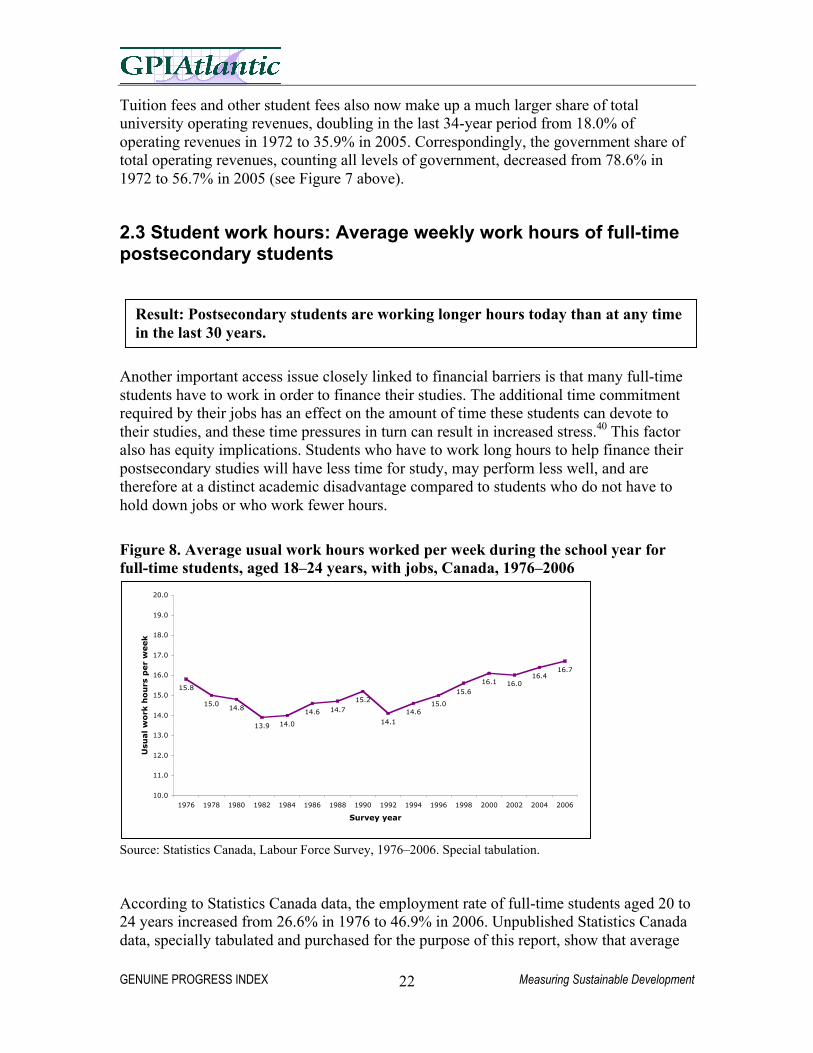
Figure 8. Average usual work hours worked per week during the school year forfull-time students, aged 18–24 years, with jobs, Canada, 1976–2006
Source: Statistics Canada, Labour Force Survey, 1976–2006. Special tabulation.
According to Statistics Canada data, the employment rate of full-time students aged 20 to24 years increased from 26.6% in 1976 to 46.9% in 2006. Unpublished Statistics Canadadata, specially tabulated and purchased for the purpose of this report, show that average
Result: Postsecondary students are working longer hours today than at any timein the last 30 years.
GENUINE PROGRESS INDEX Measuring Sustainable Development23
usual work hours during the school year for full-time students between the ages of 18 and24 years with jobs steadily increased from 14.1 hours a week in 1992 to 16.7 hours in2006—the highest ever recorded in the 30 years that consistent records have been kept(see Figure 8 above).41
Historical LFS data indicate that every province in the country saw an increase in usualweekly hours between 1986 and 2006 among full-time working students between theages of 18–24 years. In 2006, students from Alberta worked the longest hours amongCanadian students—an average of 18.7 hours a week—up 23% from 15.2 hours in 1986,while students in New Brunswick worked the shortest weekly hours in the country (15.6hours in 2006). See Figure 9 below for a summary of average usual work hours for full-time working students by province in 1976, 1986, 1996, and 2006.
Figure 9. Average usual hours worked per week during the school year for full-timestudents, aged 18–24 years, provinces, 1976, 1986, 1996, and 2006
Source: Statistics Canada, Labour Force Survey, 1976–2006. Special tabulation.
Interestingly, full-time working students in Nova Scotia, where tuition is the highest inthe country, worked an average of 16.2 hours a week in 2006—the third lowest in the
17.3
18.7
17.3
16.6
16.1
16.7
15.6
17.2
16.8
16.2
16.7
14.5
16.4
15.9
15.8
14.4
15.7
14.9
13.9
14.6
15.0
15.0
14.1
15.2
14.7
15.2
14.5
14.7
13.9
15.6
15.7
15.9
14.6
16.1
18.8
17.3
16.0
14.5
16.5
16.5
19.8
24.7
16.9
15.8
0.0 5.0 10.0 15.0 20.0 25.0 30.0
British Columbia
Alberta
Saskatchewan
Manitoba
Ontario
Quebec
New Brunswick
Prince Edward Island
Newfoundland
Nova Scotia
Canada
Average work hours per week
1976
1986
1996
2006
GENUINE PROGRESS INDEX Measuring Sustainable Development24
country—while students in Quebec, where tuition is by far the lowest in the country,worked an average of 16.7 hours a week—the same as the Canadian average.42 As well,the data in Figure 9 above show that, in every province, average student work hours werelonger in 1976 than in 1996 when tuition rates were higher. Thus, relative tuition levelsalone clearly do not explain the length of working hours.
While tuition alone cannot explain the length of working hours, other evidence does pointto a direct link between students’ work and their financial needs, indicating that furtherinvestigation into this important issue is required. Thus, for example, the Canadian Post-Secondary Student Financial Survey, conducted in 2003 by EKOS Research Associatesand the Millennium Scholarship Foundation, found that the vast majority (83%) ofstudents who worked during the school year did so because they needed the income. Only7% worked to maintain a position in a job, and just 6% worked to gain experience.43
Despite the increase in average weekly work hours in the 1990s, coupled withunprecedented levels of student debt, there is currently very little information on theschool–work relationship among this group of students and on how the resulting timecrunch is linked to stress levels and academic success, let alone on how the burden ofdebt has affected students’ short and long-term quality of life and sense of wellbeing.
Aside from the possible health, income, achievement, and access issues alreadymentioned, the work-study relationship also has important equity implications, andpotential influences on the quality of postsecondary education altogether. For example, iflower-income students are more likely to work long hours during the school year to helppay for their postsecondary studies while higher-income students have greater luxury todevote themselves more fully to their studies without working for pay, then this mayproduce important income-related disparities in performance, educational outcomes, andfuture employment prospects that in turn fuel a wider range of inequities. For all thesereasons, research into student work hours, including both the reasons for their increaseand their impacts, merits considerably greater attention.
2.4 Financing the public school system: Public expenditures perfull-time student (K–12)
There is a demonstrated link between public funding level inputs and the quality ofeducation. Under-funded schools are less likely than well-funded schools to provide goodcomputers, quality library books, adequate facilities, art and music supplies, and a rangeof extra-curricular programs, and are more likely to have students sharing outdated texts.
Result: Nova Scotia spent the second lowest amount of money per student in thecountry in 2004/2005.
GENUINE PROGRESS INDEX Measuring Sustainable Development25
In Canada, public expenditures per full-time student declined in the 1990s from anaverage of $8,194 per full-time student in 1994 to $7,805 per student in 1998/1999 (inconstant $2003 dollars). Since then, expenditures per student have risen, finallysurpassing the levels of the early 1990s for the first time in 2003/2004, when theyreached $8,381 per student, and increasing further to $8,653 in 2004/2005 (see Figure 10below).44
Figure 10. Public expenditure per full-time equivalent public school student,Canada, 1993–2005, ($2003 CDN)
Sources: Blouin, Patric and Marie-Josee Courchesne. 2007. Research Paper: Summary Public SchoolIndicators for the Provinces and Territories, 1998/1999 to 2004/2005. Statistics Canada. Ottawa; StatisticsCanada, The Daily, July 28, 2000. School board revenues and expenditures, 1993–1997. AccessedDecember 2004.
Note: All figures were converted to 2003 constant dollars using the Bank of Canada’s Inflation Calculator,September 26, 2007. The data from 1998/99 onwards are for a school year, rather than a calendar year. Themore recent year was used when converting to constant dollars. Figures were also rounded.
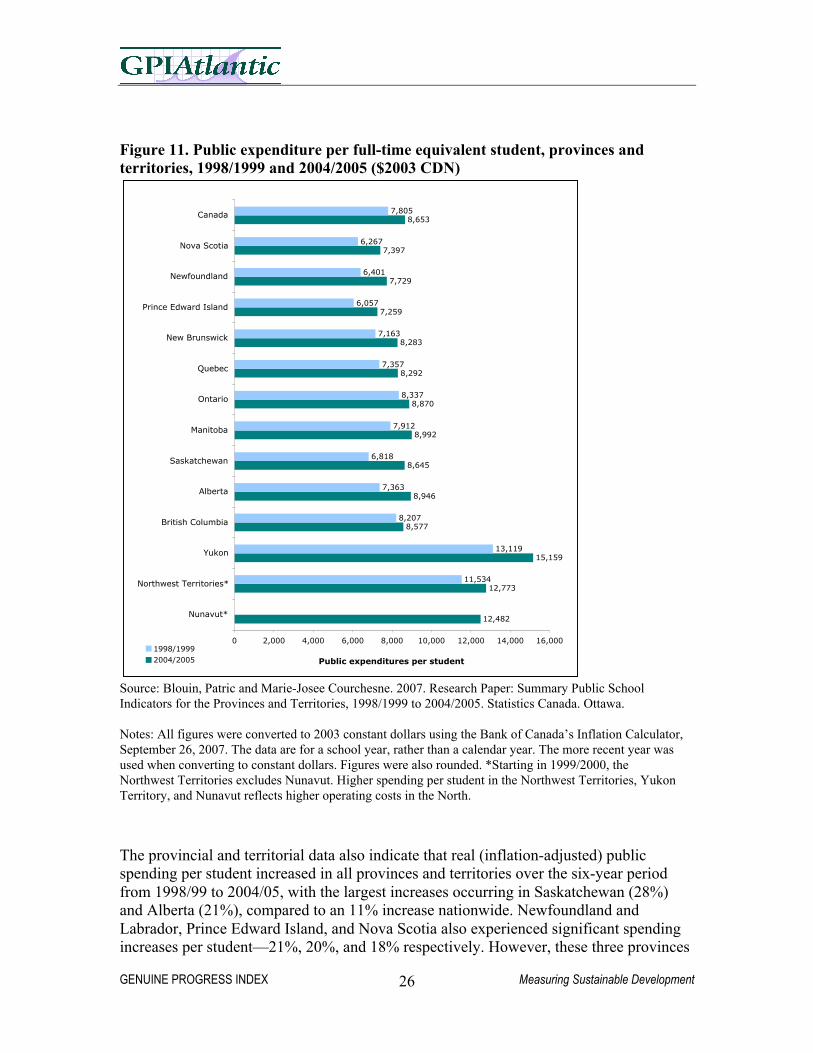
At the provincial and territorial level, Nova Scotia spent the second lowest amount perstudent in the country ($7,397) in 2004/2005—17% less than the Canadian average($8,653), more than 21% less than provincial front-runner Manitoba ($8,992), and 12%less than neighbouring New Brunswick ($8,283). Spending per student was highest in theYukon, Northwest Territories, and Nunavut—where operating costs are higher due inpart to the geographic dispersal of a small population over a large area—followed byManitoba, Alberta, Ontario, Saskatchewan, and British Columbia. Prince Edward Islandspent the least amount ($7,259) per student (see Figure 11 below).
8,1658,194
8,053
7,8697,820 7,805 7,821
7,934 7,927
8,128
8,381
8,653
7,500
7,700
7,900
8,100
8,300
8,500
8,700
1993
1994
1995
1996
1997
1998/1999
1999/2000
2000/2001
2001/2002
2002/2003
2003/2004
2004/2005
Pu
bli
c exp
en
dit
ure
s p
er
stu
den
t
GENUINE PROGRESS INDEX Measuring Sustainable Development26
Figure 11. Public expenditure per full-time equivalent student, provinces andterritories, 1998/1999 and 2004/2005 ($2003 CDN)
Source: Blouin, Patric and Marie-Josee Courchesne. 2007. Research Paper: Summary Public SchoolIndicators for the Provinces and Territories, 1998/1999 to 2004/2005. Statistics Canada. Ottawa.
Notes: All figures were converted to 2003 constant dollars using the Bank of Canada’s Inflation Calculator,September 26, 2007. The data are for a school year, rather than a calendar year. The more recent year wasused when converting to constant dollars. Figures were also rounded. *Starting in 1999/2000, theNorthwest Territories excludes Nunavut. Higher spending per student in the Northwest Territories, YukonTerritory, and Nunavut reflects higher operating costs in the North.
The provincial and territorial data also indicate that real (inflation-adjusted) publicspending per student increased in all provinces and territories over the six-year periodfrom 1998/99 to 2004/05, with the largest increases occurring in Saskatchewan (28%)and Alberta (21%), compared to an 11% increase nationwide. Newfoundland andLabrador, Prince Edward Island, and Nova Scotia also experienced significant spendingincreases per student—21%, 20%, and 18% respectively. However, these three provinces
GENUINE PROGRESS INDEX Measuring Sustainable Development27
were the lowest spenders per student in 1998/1999, and, despite the large increases in perstudent spending since that time, still remain well below the Canadian average and stillhave the lowest per student expenditures in the country.
2.5 Structure: Class size
According to the literature in this field, class size—particularly in the earlygrades—influences educational outcomes of students, teacher workloads, and thelearning environment in general. Pan-Canadian data on class size are not available forany level of education. Some provinces, such as Nova Scotia, Saskatchewan, Ontario,and Alberta do collect and report data on this indicator, but even these data are notcomparable, for reasons explained in the GPI education report.
Instead, pan-Canadian data are available for student–educator ratios at theelementary–secondary level, but these are often much smaller than actual class sizes,because educators include both teachers and administrators who may never enter aclassroom. These student-educator ratios are therefore far less indicative of potentialinfluences on educational outcomes than class sizes.
In Nova Scotia, the Department of Education fortunately does publish detailed data onclass size for the province overall and for each school board at the elementary, junior, andsenior levels. As Figure 12 indicates, class sizes at all levels did not change muchbetween 1998-99 and 2005-06. In 1998-99 the definitions of average class size wererevised, and therefore historical comparisons with prior periods are not possible.
Result: There were no significant changes in class sizes in Nova Scotia (K-12)between 1998-99 and 2005-06.
GENUINE PROGRESS INDEX Measuring Sustainable Development28
Figure 12. Class size by educational level, Nova Scotia, 1998–99 to 2005–06
Source: Statistical Summaries for education are available from the Nova Scotia Department of Education athttp://stats-summary.ednet.ns.ca. Class size data for 2005/2006 can be found at http://stats-summary.ednet.ns.ca/publicat.shtml. Class size data are collected from every school in every school boardin the province.
Notes: At the elementary level, class size is defined as the homeroom class size at each grade. At the juniorlevel, class size is the Language Arts or French Language Arts class at each grade. At the senior level, classsize is defined as any group of students, regardless of size, that occupies one teacher for one full period ofinstruction.
The Department of Education also reports the number and proportion of classes indifferent class size categories. For example, in 2005/2006, at the elementary level, 5% ofclasses had fewer than 15 students, 73% had between 16 and 25 students, 20% hadbetween 26 and 30 students and 1% had greater than 30 students. At the junior level, 3%of classes in the province had fewer than 15 students, 50% had between 16 and 25, 37%had between 26 and 30, and 10% had more than 30 students. At the senior level, 17% ofclasses had fewer than 15 students, 36% had between 16 and 25, 25% had between 26and 30, and 22% had more than 30 students (see Figure 10).45
GENUINE PROGRESS INDEX Measuring Sustainable Development29
Figure 13. Percentage of classes by size, by educational level, Nova Scotia, 2005–06
5
73
20
13
50
37
1017
36
25 22
0
10
20
30
40
50
60
70
80
fewer than 15 16-25 26-30 30 +
number of students per class
perc
enta
ge o
f cl
asse
s
Elementary Junior Senior
Source: Statistical Summaries for education are available from the Nova Scotia Department of Education athttp://stats-summary.ednet.ns.ca. Class size data for 2005/2006 can be found at http://stats-summary.ednet.ns.ca/publicat.shtml. Class size data are collected from every school in every school boardin the province.
2.6 Independence: Public versus private share of sponsoredresearch at Canadian universities
Detailed evidence examined by GPIAtlantic for this study suggests that, when universityresearch is privately funded, there is a greater potential for investigators to face outsideinterference and challenges with regard to study design, access to data, and publicationrights than when research is publicly funded. This problem—particularly restriction onpublication rights —is clearly not limited to university research, but may apply wheneverprivate funding contributes to research of any kind.
In addition, increased pressure is being placed on university and other researchers to findcommercial applications for their work, thus potentially restricting basic or curiosity-based research.
Indeed, anything that restricts or limits the educational horizons of students andresearchers or prevents them from an unhindered pursuit of truth runs counter to theprinciple of “systematic, scientifically-based investigation” that the Pan-CanadianEducation Indicators Program identifies as a central and defining role of postsecondary
Result: The ratio of private to public funding of research has increased since theearly 1970s, posing a potential threat to the academic integrity andindependence of Canadian university research.
GENUINE PROGRESS INDEX Measuring Sustainable Development30
education.46 Analysts have therefore described external influences on university and otherresearch as anti-educational. According to philosopher John McMurtry:
If society’s education system is ineluctably determined by economicrequirements, and these economic requirements are the requirements ofestablished market-capitalism, then it follows that we face the prospect of aninevitable transformation of our educational process into an organ of the capitalistmarket […]. Because an educational process is required by its nature to reflectupon and question presupposed patterns of being, its absorption into one of thesepatterns, the global market system, must leave society in a very real sense withoutits capacity to think. It becomes a kind of mass creature, a collective system ofgratifying desires for private profit and consumption with no movement beyonditself towards understanding and consciousness as a human purpose in its ownright.47
While no direct measures of external influence or interference in research are available,the public versus private share of sponsored research at Canadian universities maypotentially point to issues of independence and academic integrity. This indicatortherefore serves here as a proxy measure—with an increased private share of fundingtaken here as denoting potential threats to independence—until more direct measures aredeveloped.
It should be noted, however, that increased requirements for public–private partnershipsand for commercialization of research in some public funding agreements are blurringconventional distinctions between public and private funding. As well, public fundingalso undoubtedly reflects dominant social paradigms and is therefore by no meansimmune to the more subtle research design and content distortions described above. Thisindicator on the private versus public share of sponsored research by no means gets atthat more subtle dimension of dependence, and therefore again represents only a verymodest first step in efforts to assess genuine research independence.
Over the last 30 years, there has been a marked increase in the private share (and declinein the public share) of funding for university research. As Figure 14 below indicates, thepublic share of sponsored research gradually declined from 83.3% in 1972 to 64.2% in1998 and then increased to 72.4% in 2005 largely as a result of recent public fundingcommitments to the Canada Research Chairs, Canada Foundation for Innovation, andCanadian Institutes of Health Research (CIHR). During the same time period, the privateshare of sponsored research more than doubled from 16.7% in 1972 to 35.8% in 1998,and then declined to 27.6% in 2005, again largely because of the more recent infusion ofpublic monies noted above.
GENUINE PROGRESS INDEX Measuring Sustainable Development31
Figure 14. Public versus private share of sponsored research at Canadianuniversities, 1972–2005
Source: Larry Dufay, Senior Research Officer, Canadian Association of University Teachers (CAUT).Personal communication, September, 2006. Original data from Statistics Canada's Financial Information ofUniversities and Colleges (FIUC) survey and Canadian Association of University Business Officers(CAUBO).
Notes:• Categories of public funding sources include Social Sciences and Humanities Research Council
(SSHRC), Health Canada, Natural Sciences and Engineering Research Council (NSERC), CanadianInstitutes of Health Research (CIHR), Canada Foundation for Innovation (CFI), Canada ResearchChairs, other federal sources, and provincial, municipal, other provincial, and foreign sources. Privatefunding sources include: a) donations and bequests from individuals, business enterprises, foundations,and non-profit organizations and b) non-government grants and contracts from individuals, businessenterprises, foundations, and non-profit organizations.
• According to CAUT’s Senior Research Officer Larry Dufay, prior to 2000, CAUBO did notdisaggregate the data for private funding by type of source; therefore, prior to 2000, private funding ispresented as a total for the sector.48
• By definition, sponsored research is from sources external to the universities themselves. Therefore,Figure 14 above does not include research funding provided by the universities.
83.3 83.781.8
79.777.2
80.4 81.4 79.877.5 76.4
71.969.4 69.1
64.267.8
69.873.6 72.4
16.7 16.218.1
20.322.8
19.6 18.6 20.222.5 23.6
28.130.6 30.9
35.832.2
30.226.4 27.6
10
20
30
40
50
60
70
80
90
1972
1974
1976
1978
1980
1982
1984
1986
1988
1990
1992
1994
1996
1998
2000
2002
2004
2005
Survey year
Perc
en
tag
e o
f sp
on
sore
d r
ese
arc
h
Total public share Total private share
GENUINE PROGRESS INDEX Measuring Sustainable Development32
2.7 Basic adult literacy: Trends in prose and document literacy
Basic adult literacy is the one form of literacy that has been the subject of an impressiveamount of study, data collection, and analysis both in Canada and internationally over thelast 20 years. While literacy in the Genuine Progress Index is more broadly defined toinclude multiple literacies in several knowledge areas rooted in particular social andcultural locations and practices, the available data describe literacy in narrower terms.Thus, the three domains of basic literacy skills measured in the 1994 International AdultLiteracy Survey (IALS) were document, prose and quantitative literacy and the fourdomains measured in the 2003 International Adult Literacy and Skills Survey (IALSS)were prose, document, numeracy, and problem solving.
Due to methodological and definitional issues, the 1994 IALS and the 2003 IALSS arenot fully comparable, and only the prose and document literacy sections in both rounds oftesting are sufficiently similar that they can be compared.49 Thus, trend lines are onlypresently possible for prose and document literacy, which are defined as follows:
• Prose literacy measures the knowledge and skills needed to understand and useinformation from texts such as news stories, instruction manuals, poems, and fiction.
• Document literacy measures the knowledge and skills needed to locate and useinformation in formats such as job applications, maps, transportation schedules,tables, and charts.50
In both surveys, literacy skills are divided into five levels of difficulty, from the lowestproficiency at level 1 to the highest proficiency at level 5. Level 3 is defined as the“desired threshold,” or the “minimum for persons to understand and use informationcontained in the increasingly difficult texts that characterize the emerging knowledgesociety and information economy.”51, 52 In 1994, 53% of Canadians scored at level 3 orhigher in prose literacy and 52% scored at level 3 or higher in document literacy,compared with 52% and 51% in 2003 respectively—indicating a possible marginal,though not statistically significant, decline in prose and document literacy nationwide.
When average scores are examined, there was little change in the prose and documentliteracy profiles of Canadians between the 1994 IALS and 2003 IALSS. In fact, the onlystatistically significant changes in the 9-year period were in Quebec, where there was anincrease in average prose literacy from 255 to 266 and in document literacy from 254 to263, and in the Atlantic region, where there was an increase in document literacy from259 to 267 (see Figures 15 and 16 below for average prose and document literacy scoresby region).53
Furthermore, when earlier Statistics Canada literacy data are adjusted for methodologicalchanges and analyzed by comparison with the 1994 and 2003 results, it is apparent thatliteracy levels in Canada have not improved substantially since 1989—the first available
Result: Despite higher rates of postsecondary graduation, there has been littlechange in the literacy profiles of Canadians between 1989 and 2003.
GENUINE PROGRESS INDEX Measuring Sustainable Development33
observation.54 Thus, over a nearly 15-year period, literacy levels have remained stabledespite rising levels of formal educational attainment in the Canadian populace.
According to Statistics Canada, literacy levels were expected to improve between 1994and 2003 based on the retirement of older, less educated workers; the tendency of newimmigrants to be more highly educated; and the growth in the proportion of theCanadian-born population with postsecondary education.55
The lack of improvement was also surprising to the Canadian Council on Learning(CCL), which stated: “We urgently need to understand why our current literacy andlearning programs are not succeeding in order to develop more effective approaches.56
Figure 15. Average prose literacy scores across selected regions and provinces,Canadian population aged 16 and over, 1994 and 2003
Sources: International Adult Literacy Survey, 1994; International Adult Literacy and Skills Survey, 2003.Notes: In this comparison, the territories are excluded from the Canadian average. The Western regionincludes Manitoba, Saskatchewan, Alberta, and British Columbia. The Atlantic region includesNewfoundland and Labrador, Nova Scotia, New Brunswick, and Prince Edward Island. Except for Quebec,the differences in prose literacy scores between 1994 and 2003 are not statistically significant.
281
270
266
269
272
280
275
255
264
270
240 245 250 255 260 265 270 275 280 285
Western region
Ontario
Quebec
Atlantic region
Canada
Average prose literacy score19942003
GENUINE PROGRESS INDEX Measuring Sustainable Development34
Figure 16. Average document literacy scores across selected regions and provinces,Canadian population aged 16 and over, 1994 and 2003
Sources: International Adult Literacy Survey, 1994; International Adult Literacy and Skills Survey, 2003.
Notes: In this comparison, the territories are excluded from the Canadian average. The Western regionincludes Manitoba, Saskatchewan, Alberta, and British Columbia. The Atlantic region includesNewfoundland and Labrador, Nova Scotia, New Brunswick, and Prince Edward Island. Except for Atlanticregion and Quebec, the differences in document literacy scores between 1994 and 2003 are not statisticallysignificant.
281
270
263
267
271
277
277
254
259
270
240 245 250 255 260 265 270 275 280 285
Western region
Ontario
Quebec
Atlantic region
Canada
Average document literacy score1994
2003
GENUINE PROGRESS INDEX Measuring Sustainable Development35
2.8 Civic literacy: Trends in general political knowledge by agecohort
Henry Milner, of the Université Laval in Quebec, defines civic literacy simply as “theknowledge and capacity of citizens to make sense of their world,” or the “knowledge tobe effective citizens.”57 Explaining the value and importance of civic literacy, Milnerargues that, because knowledge of the world and of civic processes inevitably points toneeded actions, civic literacy encourages political participation as well as more equitablesocieties “based on sustainable wellbeing.”58 Milner also notes that: “Informedindividuals can better identify the effects policy options have upon their own interestsand those of others in their community and make their votes count toward attainingdesired long-term […] outcomes.”59
Researchers have found political knowledge to be highly correlated with voter turnoutand political engagement, especially among young adults. Well-informed citizens aremore likely to follow and be interested in politics, to participate in politics by voting, towork for a political party, and to attend community meetings.60 Research also shows thatpeople who are more informed in one area of politics (such as foreign affairs) are morelikely to be informed in other areas of politics (such as domestic policies and politicalprocesses).61 Therefore, even a very limited and partial assessment of political knowledgemight serve to indicate broader political knowledge and to predict levels of civicengagement.
Paul Howe, of the University of New Brunswick, has analyzed results from selectedCanadian Election Study (CES) surveys. He notes that the CES is “the only [Canadianstudy] on which a reasonable selection of knowledge-based items appear.”62
Howe has constructed a knowledge scale, based on 29 questions from the 1984, 1993,1997, and 2000 CES surveys, in order to measure general political knowledge across timeand by age-group distribution. The questions include knowledge of the names ofpremiers, party leaders, and the federal finance minister, and knowledge of partypositions and campaign promises. Howe’s composite scale allows a comparison of levelsof political knowledge over time despite the different questions asked in the differentCES surveys.63 While results for a wide range of specific questions have been exploredfor this report, we reproduce only one Table here, based on Howe’s composite politicalknowledge scale.
In order to help identify general trends over time, “sub-par levels” of knowledge (below50th percentile) are located to the left of the zig-zag line in Table 1 below, and “above-average” levels of knowledge (above 50th percentile) are located to the right of the zig-zag line.64
Result: The political knowledge of Canadians is in general decline. This declineis particularly marked among younger people, who tend to have considerablyless political knowledge today than younger people did a generation ago.
GENUINE PROGRESS INDEX Measuring Sustainable Development36
Table 1 indicates that, in general, younger people have considerably less politicalknowledge than older people, and that the political knowledge of younger people isdecreasing over time and at a faster rate than for any other group.65 Thus, between 1984and 2000, scores fell by 20% for the youngest group (aged 18–23), by 17% for the nextyoungest group (24–29), by 8% for those aged 30–34, and by between 4% and 6% formiddle-aged Canadians, while knowledge scores improved for those 50 and over.
The results show clearly that political knowledge generally increases with age, with those50 and older being considerably (and increasingly) more knowledgeable than thoseyounger than 30. For example, in 1984, the 18- to 23-year-old age group was in the 39th
percentile, whereas the 60 and older age group was in the 52nd percentile—a difference of13 percentage points. By 2000, this gap had increased sharply, so that 18- to 23-year-oldswere in the 31st percentile and those 60 and older were in the 58th percentile—adifference of 27 percentage points. Thus, the gap between the political knowledge levelsof the youngest and oldest age groups grew by 14 percentage points between 1984 and2000.
The gap between the 18- to 23-year-olds and 50- to 59-year-olds also increased duringthis period—from a gap of 18.6 percentage points in 1984 to a gap of 28.3 percentagepoints in 2000—an increase of 9.7 percentage points. The gap between the politicalknowledge of the next youngest group (aged 24–29) and those 60 and older also grewsharply during this period—from a gap of 8.7 percentage points in 1984 to a gap of 22.1percentage points in 2000—an increase of 13.4 percentage points.
In comparing the political knowledge of young people in 2000 with the politicalknowledge of young people in previous years, there is evidence of a fairly steady declinein knowledge. In 1984, the 18–23 and 24–29 age groups were in the 39th and 43rd
percentiles, respectively. By 2000, these scores had dropped to the 31st and 36th
percentiles respectively, representing drops of 8 and 7 percentage points, respectively,between 1984 and 2000.
Finally, the number of age groups falling below the 50th percentile has also increasedsteadily over time, as the zig-zag line in Table 1 demonstrates. In 1984, only the youngestgroups (those aged 18–29) had percentile scores under 50. In 1993, these two groupswere joined by 30- to 34-year-olds; and by 1997, the 35–39 age group had also fallen intothe lower half of the scores. This decline in political knowledge among youngerCanadians over time is largely confirmed again by the 2000 results, in which (despitemarginal improvements in the scores of those aged 30–39) Canadians under 40 again fellbelow the 50th percentile.
Indeed, the 1984–2000 CES results appear to indicate that, except for those 50 and older,the level of political knowledge in the Canadian populace is in general decline.
GENUINE PROGRESS INDEX Measuring Sustainable Development37
Table 1. Percentile scores of correct answers to general political knowledgequestions, by age group, 1984, 1993, 1997, and 2000
Source: Adapted from Howe, Paul. "Political Knowledge and Electoral Participation in the Netherlands:Comparisons with the Canadian Case." Paper presented at the Annual conference of the Canadian PoliticalScience Association, Winnipeg, June 3–5, 2004; accessed July 2005; available from http://www.cpsa-acsp.ca/template_e.cfm?folder=conference&page_name=agm-papers-2004.htm, based on the 1984, 1993,1997, and 2000 CES surveys.
Note: Knowledge scores for each election year are based on the number of questions respondents answeredcorrectly in each year, with results then converted to percentile scores. Relative knowledge levels of thedifferent age groups were calculated based on the mean percentile scores within each age group.
2.9 Multicultural literacy: Proportion of Canadians and NovaScotians who are English–French bilingual
Multicultural literacy has been defined as “the ability to understand and appreciate thesimilarities and differences in the customs, values, and beliefs of one’s own culture andthe culture of others.”66 It also includes an understanding and appreciation of diversityand equity issues. According to Saskatchewan Education, multicultural literacy should“lead towards the elimination of racism, prejudice and intolerance in order to create apolitically, socially and economically just society.”67
In light of the significance of multiculturalism, particularly within the Canadian contextwhere it is official policy, Canadian educators have frequently stressed that it is importantfor Canadians to learn about, understand, and appreciate multiculturalism and diversity aspart of their core stock of knowledge. Canadian Heritage notes that legislation is notenough to ensure equity, peace, and understanding among and between multiple cultures.Rather, it argues that multicultural literacy in the general populace, acquired throughexperience and informal learning, as well as through formal multicultural education, isalso necessary.68
While Canada may be officially bilingual, bilingualism is not a reality for thevast majority of Canadians. Only one in ten Nova Scotians speaks both officiallanguages fluently. Increases in bilingualism nationwide are mostly due to morenative French speakers learning English rather than to more English speakerslearning French.
GENUINE PROGRESS INDEX Measuring Sustainable Development38
At this point, we have found no comprehensive, common international or nationalindicators of multicultural literacy that can be adequately and effectively utilized in theGPI education indicators report from the perspective of learning outcomes. Publicopinion research firms conduct periodic surveys about attitudes, interests, sense ofheritage, and perceptions of social integration, including feelings about racism anddiscrimination—all of which are relevant to multiculturalism. These surveys consistentlyfind that Canadians appreciate diversity and the contribution of different cultures, andvalue the retention of cultural heritages and knowledge. However, the public opinionresults tell more about whether the basic concept of multiculturalism is generallyaccepted in Canada than about the actual level of multicultural literacy—including thestate of learning and level of knowledge about diverse cultures—that exists in thepopulace.
In light of the lack of suitable data to indicate multicultural literacy, we report here onlyone small element of multicultural literacy as an interim proxy measure—the percentageof Canadians who speak both English and French fluently. According to U.S. educationalconsultants from The Metiri Group who have constructed a framework for assessingmulticultural literacy, bilingualism and multilingualism are important elements ofmulticultural literacy.69 As one analysis notes: “Language is one of the most tangiblesymbols of culture and group identity. It is not only a means of communication, but a linkwhich connects people with their past, and grounds their social, emotional, and spiritualvitality.”70
Both English and French are official languages in Canada, and bilingualism is afundamental aspect of Canada’s identity, culture, federal government policy and practice,and commitment to multiculturalism. Both of Canada’s two official languages are taughtin formal education systems across the country in order to foster bilingualism andknowledge of both English and French cultures. Moreover, the benefits of bilingualismand multilingualism go beyond the particularly Canadian dimensions of this country’sofficial two-language policy and were explored in some detail by GPIAtlantic.
Over the past four decades, the number of Canadians who speak both English and Frenchhas more than doubled to 5.2 million people. Nevertheless, most of this increase simplyreflects overall population growth, and the actual percentage of English–French bilingualCanadians has remained relatively small, increasing only marginally over time. Based onCensus data from 1991, 1996, and 2001, as illustrated in Table 2 below, 17.7 % ofCanadians identified themselves as English–French bilingual in the 2001 Census, upslightly from 17.0% in 1996 and 16.3% in 1991. In Nova Scotia, 10.1% of the populationidentified itself as bilingual in 2001, up from 9.3% in 1996 and 8.6% in 1991.71,72
The majority of bilingual Canadians live in Quebec and New Brunswick (3.4 million outof 5.2 million nationwide). These are the two provinces with the highest proportion ofnative French speakers. When the rest of Canada without Quebec is considered, only onein ten Canadians is bilingual (10.3% in 2001). This rate has remained fairly stable since1991 (10.2% in 1996, and 9.8% in 1991).
GENUINE PROGRESS INDEX Measuring Sustainable Development39
Table 2. Percentage of Canadians who are English–French bilingual, by provinceand territory, 1991, 1996, and 2001
Source: Statistics Canada. 2001 Census: Analysis Series: Profile of Languages in Canada: English, Frenchand Many Others, Catalogue no. 96F0030XIE2001005, 2002; accessed October 2006; available fromhttp://www12.statcan.ca/english/census01/Products/Analytic/companion/lang/pdf/96F0030XIE2001005.pdf .Note: Hyphens indicate that data are not available for that year (—Nunavut was founded only in 1999).
In fact, most of the overall increase in bilingualism in Canada is due to its rapid growth inQuebec, where bilingualism increased from 35.4% of the population in 1991 to 40.8% in2001. In New Brunswick, too, bilingualism increased sharply from 29.5% of thepopulation in 1991 to 34.2% in 2001, though that province’s much smaller population(750,000 in 2006 compared to 7.7 million in Quebec73) means that the impact of itsincrease on the national rate of bilingualism was only one-tenth that of Quebec.
By contrast to these two provinces, there was almost no increase in the rate ofbilingualism in Ontario and in the Prairie provinces in the decade from 1991 to 2001.Although the number of bilingual Atlantic Canadians outside New Brunswick remainssmall, it is noteworthy that in relative terms, the rate of increase in bilingualism has beenfaster in this region than in any other part of the country. Thus, between 1991 and 2001,the rate of bilingualism increased by 17% in Nova Scotia, 19% in PEI, 16% in NewBrunswick, and 24% in Newfoundland and Labrador, compared to just 3% in Ontario,1% in Manitoba, 6% in Alberta, and 9% in BC, while it declined by 2% in Saskatchewan.
In Quebec, the rate of bilingualism increased by 15% between 1991 and 2001, with thatincrease alone accounting for by far the largest absolute increase in bilingualismnationwide—with more than four in ten Quebecois now bilingual compared to an average
GENUINE PROGRESS INDEX Measuring Sustainable Development40
of just one in ten Canadians outside Quebec, as noted above.In Canada, according to the 2001 Census, English is spoken as a first language(Anglophone) by 58.5% of the population, and French is spoken as a first language(Francophone) by 22.6% of the population. Another 18.5% of Canadians speak one of themore than 100 other languages spoken in Canada as their native tongue (—these peopleare labelled as “Allophone” by Statistics Canada).74
Table 3 below shows the percentage of Canadians who are bilingual according to theirnative language. English–French bilingualism is greatly skewed towards the 22.6% ofCanadians whose native language is French. While 43.4% of Francophones speakEnglish fluently, only 9.0% of Anglophones are able to speak French fluently. This is asmaller proportion than among Allophones, of whom 11.8% are fluent in both Englishand French in addition to their ability to speak their own native language. However,English–French bilingualism among Allophones is concentrated mainly in Quebec.
Additionally, bilingualism grew at a faster rate among Francophones than amongAnglophones, increasing from 38.6% of the Francophone population in 1991 to 40.8% in1996 to 43.4% in 2001. By contrast, bilingualism among Anglophones increased by lessthan one percentage point over the decade—from just 8.2% in 1991 to 8.8% in 1996 to9.0% in 2001. Thus, the overall increase in bilingualism in the country (from 16.3% ofCanadians in 1991 to 17.7% in 2001) is mostly due to more native French speakerslearning English rather than to more English speakers learning French.
The provincial breakdowns in Table 3 below show that, between 1991 and 2001,bilingualism increased among Francophones, Anglophones, and Allophones in Quebecand New Brunswick—the two provinces with the largest proportion of native Frenchspeakers. Two-thirds (66.1%) of all Anglophones in Quebec spoke French fluently in2001, up from 58.4% in 1991, while 36.6% of Francophones in Quebec were bilingual,up from 31.3% in 1991. Half (50.4%) of all Allophones in Quebec were English–Frenchbilingual in 2001, up from 46.5% in 1991.
New Brunswick, Canada’s only officially bilingual province, saw similar rates ofincrease in bilingualism between 1991 and 2001—from 62.5% to 71.5% amongFrancophones, from 12% to 15% among Anglophones, and from 14.8% to 17.5% amongAllophones.
Outside Quebec and New Brunswick, however, the picture is very different, with onlyone in 14 Anglophones outside Quebec able to speak French fluently in 2001. Thus,while 85.1% of Canadian Francophones outside Quebec were bilingual in 2001, up from81.2% in 1991, only 7.1% of Anglophones outside Quebec spoke French fluently, upmarginally from 6.3% in 1991. While 50.4% of Allophones in Quebec are bilingual, only5.7% outside Quebec are English–French bilingual.
In Nova Scotia, only 6.4% of Anglophones were bilingual in 2001 compared to 93.7% ofFrancophones, up from 4.8% and 91.6% respectively in 1991.
GENUINE PROGRESS INDEX Measuring Sustainable Development41
Table 3. Percentage of Canadians who are English–French bilingual, by languagegroups, provinces, and territories, 1991, 1996, and 2001
Source: Statistics Canada. 2001 Census: Analysis Series: Profile of Languages in Canada: English, Frenchand Many Others, Catalogue no. 96F0030XIE2001005, 2002; accessed October 2006; available fromhttp://www12.statcan.ca/english/census01/Products/Analytic/companion/lang/pdf/96F0030XIE2001005.pdf.
Notes: Anglophone: the population with English as mother tongue; Francophone: the population withFrench as mother tongue; Allophone: the population with a non-official language as mother tongue. Thehyphens indicate that data are not available for that year (—Nunavut was founded only in 1999).
GENUINE PROGRESS INDEX Measuring Sustainable Development42
2.10 Ecological literacy: Percentage who know basic ecologicalfacts
According to U.S. educator and renowned ecologist David Orr and others, ecologicalliteracy—or knowledge of the Earth’s ecosystems and of the interrelatedness of alllife—is crucial knowledge for an educated populace in today’s world, and is essential forthe sustainability and wellbeing of the planet and all of its occupants.75 As well, theUnited Nations has identified education as “humanity’s best hope and most effectivemeans to the quest to achieve sustainable development,”76 and the overriding objective ofthe entire United Nations Decade of Education for Sustainable Development (2005-2014)may be seen as improving the ecological literacy of the world’s population.
Environment Education Ontario (EEON) defines ecologically literate citizens simply asthose who “understand ecological concepts and environmental issues,” and who “makechanges in behaviours and practices that will positively affect the environment.”77
Unfortunately—despite the vital importance of this issue—data are not currentlyavailable to construct a comprehensive indicator to assess the overall level of ecologicalliteracy in Canada. For that reason, the following indicator—knowledge of basicenvironmental facts, or the percentage of the adult population who can correctly answerquestions about basic environmental facts (which is considered to be one essentialcomponent of ecological literacy)—is used here as a proxy to begin to point toward thepossible level of ecological literacy in this country. Additional indicators that address thevalue, attitudinal, and behavioural components of ecological literacy have been exploredby GPIAtlantic for this study.
Results for the indicator reported here are drawn from the International Social SurveyProgramme (ISSP) in Cologne, Germany, which conducts annual social surveys inapproximately 41 countries on topics of interest to social science research.78 Table 4below shows the 1993 and 2000 results for 12 ISSP questions on basic environmental andscientific facts, with comparisons for Canada, the U.S., the Netherlands, and Norway.The Netherlands and Norway were chosen for comparison purposes here because thosecountries are often thought to have a relatively high level of environmental awarenessand consciousness. Unfortunately, the sample size for Canada was insufficient to provideprovincial breakdowns, so data for Nova Scotia are not available from this source.
In both its 1993 and 2000 environment questionnaires, the ISSP survey askedrespondents for their opinions on a series of statements describing basic environmentalfacts.79 Due to changes in the wording and content of the questions in 2000, only six ofthe twelve questions are comparable across the two survey years.
Canadians have a relatively low level of basic ecological knowledge.
GENUINE PROGRESS INDEX Measuring Sustainable Development43
For each of the statements given, the respondents were asked if it was definitely true,probably true, probably not true, or definitely not true. Results are presented below onlyfor those who reported the correct answer—“correct” answers here being defined as thosewhere respondents correctly identified a statement as being “definitely” true or not true,with “probably true” or “probably not true” answers excluded because these responsesmight represent guesses rather than actual knowledge.
In general, the Americans scored lower on almost all questions than the Canadians,Dutch, and Norwegians, while Canadians scored lower than the Europeans on somequestions and better on others. For the six questions asked in both 1993 and 2000,respondents in all four countries scored lower on most questions in 2000 than in 1993,which may possibly indicate that the level of ecological literacy is declining rather thanimproving, though far more rigorous and detailed sampling and analysis are necessary toassess whether this is actually the case.
For Canada, only two of the six questions that were asked in both years (1993 and 2000)show an increase in the proportion of correct answers among Canadians—from 37.6% to43.1% for the question “Every time we use coal or oil or gas, we contribute to thegreenhouse effect,” and from 36.0% to 45.3% for the question “Antibiotics can killbacteria but not viruses.” The other four questions showed a decline in the proportionanswering correctly.
In addition, only one question out of the 12 was answered correctly by more than half ofCanadian respondents—in 1993, 58.4% of respondents correctly identified as false thestatement, “Cars are not really an important cause of air pollution in Canada.” Thisquestion was not asked in 2000, in which year not one of the six questions was answeredcorrectly by more than half of Canadian respondents. These results again appear toindicate a low level of ecological knowledge among Canadians.
Nevertheless, for all questions, a higher proportion of Canadians than Americansanswered correctly. With the exception of the question on antibiotics (where correctresponses increased from 28.6% to 35.2%), there was very little change in the percentageof American respondents correctly answering the six questions that were asked in bothyears. Moreover, three of these six questions were answered correctly by only about 15%of the U.S. population, and only in five Americans knew that using coal, oil, or gascontributes to the greenhouse effect. Only one question was answered correctly by half ofthe U.S. population:—in 1993, 50.1% of Americans knew that the statement about carsnot causing air pollution was false.
GENUINE PROGRESS INDEX Measuring Sustainable Development44
Table 4. Percentage of the populace who can correctly answer questions about basicenvironmental facts, Canada, United States, Netherlands, Norway, 1993 and 2000
Canada UnitedStates
Netherlands NorwayStatement
1993 2000 1993 2000 1993 2000 1993 20001. If someone is exposed toany amount of radioactivity,they are certain to die as aresult. (incorrect) 47.3 34.2 30.2 31.0 29.5 20.9 47.6 38.82. The greenhouse effect iscaused by a hole in theearth’s atmosphere.(incorrect) 26.8 22.0 14.9 14.7 28.4 30.1 26.6 28.13. Every time we use coal oroil or gas, we contribute tothe greenhouse effect.(correct) 37.6 43.1 20.6 20.9 32.0 30.5 43.8 40.34. Some radioactive wastefrom nuclear power stationswill be dangerous forthousands of years. (correct) 44.9 - 35.2 - 46.9 - 42.5 -5. All pesticides andchemicals used on food cropscause cancer in humans.(incorrect) 21.8 - 16.4 - 27.1 - 30.0 -6. Human beings are themain cause of plant andanimal species dying out.(correct) 30.8 - 16.6 - 37.3 - 39.4 -7. Cars are not really animportant cause of airpollution in [country, e.g.,Canada]. (incorrect) 58.4 - 50.1 - 30.7 - 40.6 -8. Antibiotics can killbacteria but not viruses.(correct) 36.0 45.3 28.6 35.2 34.1 35.6 49.1 52.09. Human beings developedfrom earlier species ofanimals. (correct) 32.1 26.8 15.2 15.7 25.3 24.7 33.6 34.010. All man-made chemicalscan cause cancer if you eatenough of them. (incorrect) 17.9 12.8 14.5 15.7 20.3 14.9 22.9 18.611. All radioactivity is madeby humans. (incorrect) 43.4 - 32.3 - 36.2 - 32.6 -12. Astrology—the study ofstar signs—has somescientific truth. (incorrect) 30.6 - 23.6 - 24.6 - 27.1 -
GENUINE PROGRESS INDEX Measuring Sustainable Development45
Sources: International Social Survey Program. Codebook, ZA Study 2450, ISSP 1993, Environment I,Cologne, Germany, Zentral archiv fur Empirische Sozialforschung, 1993; accessed May 2007; availablefrom http://www.za.uni-koeln.de/data/en/issp/codebooks/s2450cdb.pdf; and International Social SurveyProgram. Codebook, ZA Study 3440, ISSP 2000, Environment II, Cologne, Germany, Zentral archiv furEmpirische Sozialforschung, 2000; accessed May 2007; available from http://www.za.uni-koeln.de/data/en/issp/codebooks/ZA3440cdb.pdf .
Notes: A hyphen ( - ) denotes that the question was not asked in that year. Percentages are based on thenumber of people who correctly answered the statements by stating they are definitely true for correctstatements and by stating they are definitely not true for incorrect statements. Questions 1–7 are consideredin the ISSP study to be environmental questions and questions 8–12 are considered to be science questions.
Of the six questions comparable across the two years, the Europeans showed an increasein the proportion answering correctly in only two of these. Unlike Canadians, there wasan increase in the proportion of both Dutch and Norwegian respondents correctlyidentifying as false the statement, “The greenhouse effect is caused by a hole in theearth’s atmosphere”—from 28.4 to 30.1% of Dutch respondents and from 26.6 to 28.1%of Norwegian respondents. By contrast, only 22% of Canadians in 2000 answered thatquestion correctly, down from 26.8% in 1993. Fewer than 15% of Americans couldanswer that question correctly in both years.
The proportion of Dutch and Norwegians answering the antibiotics question correctlyalso increased in both countries between 1993 and 2000—from 34.1 to 35.6% of Dutchrespondents and from 49.1 to 52.0% of Norwegian respondents. This question was alsothe only one answered correctly by at least half of Norwegian respondents, while noquestion was answered correctly by half of Dutch respondents. It is interesting to notethat, while the statement about cars causing pollution was the only question answeredcorrectly by at least half of North Americans, only 30.7% of Dutch respondents and40.6% of Norwegian respondents answered this question correctly.
As noted, the above data appear to indicate that Canadians have a relatively low level ofbasic ecological knowledge. Fewer than half of Canadian respondents in both 1993 and2000 correctly identified as definitely true or false several key environmental knowledgestatements. However, more recent data and responses to a wider range of questions needto be considered in order to fully assess Canadians’ understanding of ecologicalknowledge.
This low level of ecological literacy is also seen in the U.S., the Netherlands, Norway,and other countries, with the U.S. manifesting particularly low scores. In fact, accordingto the U.S.-based National Opinion Research Center, Canada actually ranked highest outof 20 countries on a composite environmental knowledge index.80 As the U.S. NationalScience Foundation notes: “Setting aside the issue of ranking, these results suggest thatthe residents of major industrial nations throughout the world have a relatively low levelof understanding of basic environmental concepts.”81
Since education is a provincial and territorial rather than federal responsibility in Canada,GPIAtlantic has made a preliminary attempt to assess provincial and territorial
GENUINE PROGRESS INDEX Measuring Sustainable Development46
commitments to supporting education for sustainable development, which includesimproving levels of ecological literacy. GPIAtlantic did this by assessing responses to aUnited Nations survey on commitments to the UN Decade on Education for SustainableDevelopment (2005-2014) that was distributed to all provincial and territorial educationdepartments by the Council of Ministers of Education, Canada (CMEC).
Among all provinces, Manitoba very clearly demonstrated the strongest commitment byfar in this area, with financial support, teacher training programs, curriculumdevelopment, a dedicated website, and other actions designed to improve education forsustainable development. Other provinces that have taken at least a few significant stepsin this direction are Quebec and Newfoundland and Labrador, while the remainingprovinces scored poorly, generally responding to the CMEC survey with only vague,general, and non-substantive statements.
Nova Scotia, unfortunately, was the only province not to respond at all to the CMECsurvey. Recent GPIAtlantic correspondence with the Nova Scotia Department ofEducation on this issue indicates that the Department is beginning to take steps to addressthe issue, though its definition and use of the term sustainability remain problematic, andits approach is far from systematic. It will be important to monitor the Department’sactions over time, as well as curriculum development, teacher training, and educationaloutcomes among Nova Scotia students in this area, to assess whether serious andsystemic efforts to improve ecological literacy and education for sustainable developmentin the province have taken root and yielded success.
2.11 Ecological Footprint
According to the Global Footprint Network, the average ecological footprint perCanadian resident is 7.6 global hectares (gha), signifying the biologically productive landand sea area required to support the average Canadian’s lifestyle and resourceconsumption.82 This is far in excess of the 1.8 gha/capita of bioproductive area globallyavailable to the world’s population, and indicates that if everyone in the world were toconsume resources at the rate that Canadians do, we would require more than threeadditional planets Earth to provide the necessary resources.
According to educator and ecologist David Orr: “We may reasonably surmise that, onaverage, those whose lifetime earnings are enhanced by [higher education] degrees domore damage to the planet than those less encumbered.”83
For the first time, in this educated populace study, data are now available on theecological footprints of Canadians based on their educational attainment. These results
Result: Those with the highest levels of educational attainment have the greatestimpact on the environment.
GENUINE PROGRESS INDEX Measuring Sustainable Development47
support Orr’s observation that higher levels of formal education lead to moreunsustainable lifestyles. Thus, those Canadians who have only some secondary educationuse 6.76 global hectares per capita, those who have completed secondary education use6.96 global hectares, while those who have a university degree use 8.67 global hectareseach in order to sustain their lifestyles (see Figure 17 below).84
Figure 17. Ecological Footprint by Educational Attainment, Canada, 2005
6.76
6.96
8.67
0 1 2 3 4 5 6 7 8 9 10
some secondary education
completed secondary education
university degree
global hectares per capita
Source: Estimates developed by Hans Messinger, HFM Consulting, are based on source data fromStatistics Canada’s Social Policy Simulation Database, National Accounts Analytical Studies Branch, andGlobal Footprint Network / International Institute for Sustainable Development data for the NationalEcological Footprint and Biocapacity Accounts, 2005 edition.
Note: The ecological Footprints by education illustrate the global hectares consumed per person for theindividual with the highest income in each household, disaggregated by that person’s level of formaleducational attainment. A global hectare is an area weighted by productivity or “the amount of biologicalmaterial useful to humans that is generated in a given area.” (Global Footprint Network, Footprint TermGlossary, 2007; accessed August 2007; available fromhttp://www.footprintnetwork.org/gfn_sub.php?content=glossary.)
This evidence has important implications for the content and processes of formaleducation in the future. If the Canadian populace is to practice sustainable living in dailylife, then—in line with the goals and objectives of the United Nations Decade ofEducation for Sustainable Development (2005-2014)—higher education should supportrather than undermine sustainability. The footprint data by educational level, assembledin detail for the first time here will be a useful tool to monitor progress and suggesteducational policy options in this area.
GENUINE PROGRESS INDEX Measuring Sustainable Development48
3. Key Findings: An Overview
Based on a close examination of the available evidence in the field of educationindicators, we have identified a number of key findings that have emerged from thisextensive body of evidence. These messages, which are additional to the summarydiscussion accompanying the key Nova Scotia results above, provide a more general andextensive overview of the GPI education component, and of some of the most importantissues in further development of this domain. These findings and messages aresummarized below.
Please note: the following key findings are not listed in order of significance. In generalfollowing some comments on data availability, formal education messages appear first,followed by key findings from the literacies. This accords with the order in which theNova Scotia results were presented above.
• Early childhood education: The need for good indicators of early childhoodeducation is widely accepted. However, at present, a comprehensive pan-Canadianassessment of early childhood education is not available. The Early DevelopmentInstrument (EDI) is an excellent model for assessing children’s readiness for school,but EDI data are presently only available for three provinces (Manitoba, Ontario, andBritish Columbia).
Research in the field of early childhood development has found that children’sengagement in co-operative play and make-believe play helps to build their capacityfor empathy towards others, which is defined as “a deeply felt, not just understood,concern for the well-being of the Earth and of all living things; the ability to see fromand appreciate multiple perspectives; a commitment to equity, justice, inclusivity, andrespect for all people; [and] skills in building, governing, and sustainingcommunities.”85 Statistics Canada’s National Longitudinal Survey of Children andYouth does broach the subject of co-operative play, and perhaps this question couldbe expanded to produce the more extensive, specific, and detailed data required todevelop and produce this indicator in future.
• Class size: According to the literature in this field, class size—particularly in theearly grades—influences educational outcomes of students, teacher workloads, andthe learning environment in general. Pan-Canadian data on class size are not availablefor any level of education. Some provinces, such as Nova Scotia, Saskatchewan,Ontario, and Alberta do collect and report data on this indicator, but even theselimited data sets are not comparable, in part because not all provinces report classsizes for all grades.
1. There is an unavailability of basic data in key areas.
GENUINE PROGRESS INDEX Measuring Sustainable Development49
Instead, pan-Canadian data are available for student–educator ratios at theelementary–secondary level, but these are often much smaller than actual class sizes,because “educators” include both teachers and administrators who may never enter aclassroom.
In Nova Scotia, the Department of Education publishes data on class size for theprovince overall and for each school board at the elementary, junior and senior levels.It also reports the number of classes by size and the percentage of classes with 25 orfewer students. For example, in 2005/2006, the province-wide average class size forthe elementary grades was 22.4, and 77.6% of all classes at that level consisted of 25or fewer students. At the junior high level, the average class size was 24.9 students,but only 53% of all classes had fewer than 25 students. At the senior high schoollevel, average class size in Nova Scotia was 23.7, but again only 53% of all classeshad 25 or fewer students in them.86
At the postsecondary level, student–faculty ratios are also available, but again theseinclude faculty who may only teach one class or who may not teach at all at theundergraduate level.
Even though student–educator ratios and student–faculty ratios therefore reveal lessabout students’ actual learning environment than class size data, consistent pan-Canadian data are available for those two indicators, whereas class size data arenot—at either the elementary, secondary, or postsecondary levels.
• Integration of sustainability concepts into school curricula: The MaritimeProvinces Education Foundation identified curriculum as one of the most challengingareas to assess and evaluate.87 Nevertheless, the content of school curricula is one ofthe most important ways that public schools, as state institutions, “reproduce theexisting culture” and reinforce “the modern mindset.”88
In 2002, the United Nations Educational, Scientific, and Cultural Organization(UNESCO) declared the period from 2005 to 2014 as the United Nations Decade ofEducation for Sustainable Development (DESD). Its basic vision is a “world whereeveryone has the opportunity to benefit from education and learn values, behaviourand lifestyles required for a sustainable future and for positive societaltransformation.”89 This relationship between curriculum, learning outcomes, andbroad societal outcomes, recognized by the U.N., is also integral to the GPI educationindicators report framework (Figure 1 above).
The U.N. Ministerial Round Table on Quality Education further argues that qualityeducation “takes into consideration the social, economic, and environmental contextsof a particular place and shapes the curriculum or programme to reflect these uniqueconditions.”90
GENUINE PROGRESS INDEX Measuring Sustainable Development50
Content analysis of school curricula should assess 1) the extent to which ecologicalliteracy and other key literacies are part of existing elementary and secondary schoolcurricula, and 2) how these literacies are presented—for example, from an economicresource / anthropocentric perspective or from an ecocentric one.
Currently, Canada does not assess school curricula in this way and it does not have anationwide strategy for integrating sustainability concepts, goals, principles, andpractices into school curricula, despite numerous calls to do so by ManitobaEducation and Training, Environment Canada, and the Canadian Institute forEnvironmental Law and Policy.
• Safety and security in public schools: The quality of the learning environment inschools can be highly influenced by the level of safety and security experienced byboth teachers and students. While there are a number of surveys on this subject,overall, consistent national data on school violence and bullying trends over time arenot available in Canada. By contrast to the paucity of available Canadian data in thisarea, the U.S. National Center for Education Statistics does collect data and reporttrends on a regular basis for 21 specific indicators of school violence, crime, andsafety. These U.S. indicators, which have been explored by GPIAtlantic, could serveas a potential model for Canada.
• Student satisfaction and engagement: The degree to which students are engaged intheir studies reflects the quality of their learning as well as the quality of their overalleducational experience. Currently, there are no pan-Canadian data available forstudent engagement at the lower grades (K–7). Questions regarding studentsatisfaction are asked in the student questionnaires that accompany the SchoolAchievement Indicators Program (SAIP) written assessments, but results are notpublished or otherwise made publicly available through SAIP. Statistics Canada’sNational Longitudinal Survey of Children and Youth (NLSCY) is developing anindicator of student engagement, which may possibly match the one we are proposinghere and which should certainly be reported here when results become available.
In Atlantic Canada, a survey of Grade 8 students assessing their satisfaction wasconducted in 1995 and studied by GPIAtlantic. However, it was not possible to assessany trends in student satisfaction over time in Atlantic Canada, since theresponsibility for any follow-up surveys or reporting of that nature was left to each ofthe four Atlantic provinces’ separate departments of education, and to date no follow-up surveys have been conducted on this subject in any of the four provinces.91
No pan-Canadian data on postsecondary student satisfaction and engagementpresently exist. Potential survey models for Canada do exist, based particularly on theU.S. National Survey of Student Engagement (NSSE), which has been administeredannually in the U.S. since 2000, and on related surveys administered by individualpostsecondary institutions in Ontario, Alberta, and British Columbia. These potentialmodels were explored in the research for this study.
GENUINE PROGRESS INDEX Measuring Sustainable Development51
• Independence of university research: There are currently no pan-Canadian dataavailable assessing the independence of research at Canadianuniversities—particularly with regard to research funded by private sources. Anational survey of research officials at more than 100 U.S. medical schools,conducted by the International Committee of Medical Journal Editors (ICMJE) toassess researchers’ independence in clinical trials sponsored by pharmaceuticalcompanies, has been studied in detail by GPIAtlantic as a potential model for Canada.
• Relative share of commercial to non-commercial research at universities: Despiteclear evidence showing an increase in the commercialization of university researchoverall, it is not certain whether or not a greater share of university research is nowcommercialized. Thus, we do not know the relative shares of commercial and non-commercial or basic / curiosity-driven research, and the degree to which this ratio hasbeen changing over time. An analysis similar to that comparing the public versusprivate share of university research funding is necessary here, based on new datacollection in this field, as the data for such an analysis currently do not exist.
• Literacies: With the exception of data for basic adult literacy, there is almost acomplete lack of data available to indicate whether the Canadian populace has theknowledge needed to be considered literate in each of the other knowledge areasexplored by GPIAtlantic for this study: arts, media, health, food and nutrition, civics,multiculturalism, Indigenous knowledge, statistics, science, and ecology. Indeed, wewere able to report findings for only three headline indicators that had time-seriesdata in just three of these areas (civics, multiculturalism, and ecology), and even thesethree indicators only included very partial elements of the literacies underconsideration.
This lack of Canadian data on the various literacies need not be so, since othercountries—especially the United States—do have extensive data on some of theseliteracies. Below we have listed civic, scientific, media, and ecological literacy asfour examples where excellent data are available in other jurisdictions. These couldserve as models for Canada. In addition, GPIAtlantic has explored developmentalwork in a number of these areas that is presently taking place both in Canada andabroad. We have also recommended developing and administering a CanadianKnowledge Survey to Canadian adults—discussed further in the next section—inorder to acquire the data needed to assess the extent of understanding in the Canadianpopulace in these and other key knowledge areas.
• Civic literacy: There is a lack of quality data on civic literacy in Canada, althoughthis is not the case internationally. The International Association for the Evaluation ofEducational Achievement (IEA), an international consortium of educational researchorganizations in almost 60 countries, has conducted the International Civic andCitizenship Education Study, called “the largest and most rigorous study of civiceducation ever conducted internationally.”92 However, Canada did not participate inthe quantitative phase of this initiative, which surveyed 2,000 to 3,000 students percountry in 28 countries on their knowledge, attitudes, and values towards
GENUINE PROGRESS INDEX Measuring Sustainable Development52
citizenship.93 The next round of this survey will be in 2009, and it is unknownwhether Canada will elect to participate.
There are also other frameworks for collecting data on civic literacy that Canadacould use as a model to collect relevant data on a regular basis. For example, in 2006,the U.S.-based National Conference on Citizenship initiated an annual Civic HealthIndex, which includes key elements of civic literacy, in order to promote publicdeliberation about civic health and to examine ways for its improvement.
In addition, the citizenship quiz that immigrants are required to take to gain Canadiancitizenship, which the Canadian Democratic Audit (CDA) calls “the benchmark forassessing democratic citizenship” in Canada,94 is probably the most comprehensivepotential measure of civic literacy currently available in Canada. But this immigrantcitizenship quiz has only once been administered in survey form to the Canadianpublic, and therefore has limited utility here, since it cannot be used to assess trendsover time. Nevertheless, those results along with other one-time survey results wereexplored by GPIAtlantic for this study to demonstrate their potential utility.
• Scientific literacy: GPIAtlantic uncovered only one national Canadian survey onadult scientific literacy, despite a rather exhaustive review. This was a 1989 studyconducted by Edna Einsiedel of the University of Calgary.
Numerous other surveys have been conducted periodically that measure some of theparticular topic areas that together might be taken to constitute scientific literacy, butthese topic-specific surveys have limited utility because they lack comprehensiveness,are inconsistent, do not yield time series, or are not publicly available. For example,public opinion surveys on biotechnology and other specific topics have beenconducted in Canada by private polling consultants, but their results are not in thepublic domain, as these surveys were privately commissioned by industry.
The OECD has a section on its website that reports the results of surveys of publicunderstanding of science by country, but Canada is not among the countries reviewed,presumably because of its lack of data in this area.
However, this data paucity is not the case in the United States or Europe and,therefore, clearly does not need to be so in Canada either. For example, the U.S.National Science Foundation (NSF) Science and Engineering Indicators series has aPublic Attitudes Toward Science and Technology (PATSAT) survey that has beenconducted in the U.S. every two years since 1979. This U.S. model also forms thebasis of the multi-national Eurobarometer survey that is regularly conducted in theEuropean Union countries, and could potentially be a model for a similar survey inCanada.
• Media literacy: Canada is a recognized international leader in media literacyeducation, with Ontario having introduced media literacy into secondary schoolcurricula as early as 1987, and with education for media literacy now included in the
GENUINE PROGRESS INDEX Measuring Sustainable Development53
K–12 curricula in most Canadian public schools. However, in Canada there is nonational or provincial data source that either assesses or evaluates actual medialiteracy in children, youth, or adults.
In the U.K., the 2003 Communications Act authorized the Office of Communications(Ofcom), the independent regulator for the U.K. communications industry, to promotemedia literacy within the population.95 This led Ofcom to administer the first annualadult Media Literacy Audit in the U.K. to a sample of 2,357 adults, with resultsreported in 2006.96 While the Ofcom media literacy audit does not include importantaspects of media literacy such as critical thinking skills in any depth, it does indicate agovernmental acknowledgement of the importance of assessing the extent of medialiteracy in the populace, and could form the basis or kernel of a more extensive andin-depth survey or audit in Canada.
• Ecological literacy: There are no reliable, recent, consistent, and publicly availablepan-Canadian or international surveys that track the ecological knowledge, values,attitudes / beliefs, and behaviour of Canadians over time. Therefore, there are nosources that can presently provide comprehensive data to assess the level ofecological literacy within the populace. For example, one 2007 study examiningcross-national environmental concern used a 1992 source,97 and another 2006 studyon general beliefs and environmental concern used 2000 data.98
Several observers have commented on the paucity of comprehensive data sources onecological literacy both in Canada and elsewhere. According to one analyst: “Thereare no survey data on public attitudes toward ‘sustainable development’ as a holisticconcept.”99 Another notes: “There is a great need for collaborative research toidentify, measure, and explain trends and changes in global sustainability values,attitudes, and behaviours over time.”100
There have been many ad hoc surveys conducted in Canada that examine theknowledge, attitudes, and behaviour of Canadians concerning specific aspects of theenvironment like global warming, or focussing on individual regions. However, all ofthese studies are too narrow to produce a comprehensive assessment of ecologicalliteracy in Canada. Nevertheless, the results of many of these ad hoc surveys wereexplored by GPIAtlantic for this study to provide at least some indication of Canadianvalues and attitudes on environmental issues.
Other countries, though, do produce more comprehensive and consistent time seriesdata in this area. For example, since 1993, the U.S.-based National EnvironmentalEducation and Training Foundation (NEETF) has annually collected nationallyrepresentative survey data on American environmental knowledge, attitudes, andbehaviour. Along with basic knowledge questions, the NEETF survey also assessesself-reported levels of knowledge in order to compare them with actual levels. Resultsof this survey are likely comparable to those that would be found in Canada if asimilar survey were to be administered here.
GENUINE PROGRESS INDEX Measuring Sustainable Development54
Graduation and drop out rates are among the most commonly used indicators ofeducational attainment and system effectiveness. However, they are not good indicatorsof school performance since they are influenced by a number of other factors that havelittle to do with actual achievement: including trends in labour market conditions, poverty(particularly child poverty), economic insecurity (including the erosion of the socialsafety net in the 1990s), family size, and teenage pregnancy, to name a few.
For example, provincial disparities indicate the potentially strong influence of labourmarket conditions in influencing decisions to stay in school or leave school. According todata from Statistics Canada’s Labour Force Survey (LFS), high school drop out rates inCanada have declined fairly steadily from 16.7% in 1990/1991 to 9.8% in 2004/2005,falling in every province in the country. The decline has been most apparent in AtlanticCanada where, on average for the 1990/1991 to 1992/1993 school years, 20% of youthbetween the ages of 20 and 24 in Newfoundland and Labrador, 19% in Prince EdwardIsland, and 17.9% in Nova Scotia were not attending school and did not graduate fromhigh school. At that time, these were the highest drop out rates in the country. Over themore recent time period (2002/2003 to 2004/2005), the drop out rate in Newfoundlandand Labrador was 8% (one of the lowest in the country), in Prince Edward Island it was10% and in Nova Scotia it was 9%. Drop out rates were highest in Manitoba (13%),Alberta (12%), and Quebec (12%).
How are these provincial disparities to be interpreted? Analysts generally attribute thehigher drop out rates in provinces like Alberta to the financially lucrative opportunitiesoffered by a booming economy that lures students out of school and into the work force.By contrast, a relative lack of such opportunities in Newfoundland and Labrador mayencourage young people to stay in school. If labour market conditions influence drop outrates to this extent, it is difficult to use that indicator as a marker of school performanceor educational system effectiveness.
Similarly, between 1997/1998 and 2002/2003, high school graduation rates acrossCanada increased from 72% to 74%. In 2002/2003, high school graduation rates werehighest in Prince Edward Island (83%), New Brunswick (82%), and Nova Scotia (81%),while the lowest provincial rate was in Alberta (67%). Though graduation rates areconventionally taken as a key indicator of educational attainment, the provincialdisparities again point to the influence of labour market conditions as a much moresalient explanatory factor.
Claims of “achievement” supposedly signified by higher graduation rates must thereforebe carefully tested against a range of other achievement indicators like literacy rates(which have not improved despite higher secondary and postsecondary graduation rates),
2. Conventional indicators of educational attainment such as graduation ratesand standardized test results are contradictory and inadequate, and do not tellus whether the Canadian populace is becoming more educated or not.
GENUINE PROGRESS INDEX Measuring Sustainable Development55
standardized test results (which show very different provincial results), the declines inpolitical knowledge among the young noted in the civic literacy section of this report, andother indicators, before an assumption of association between graduation and educationalperformance, achievement, and knowledge can be made. This is further illustrated below.
On the international, national, and provincial levels, student achievement is frequentlymeasured using standardized testing in the areas of mathematics, reading, writing, andscience, mostly for the purposes of cross-national or cross-provincial comparisons. Insome cases, standardized provincial exams also count for a portion of a student’s finalgrade. In many cases, educational achievement measurement has become synonymouswith the use of standardized examinations and test scores.
However, a key problem with relying on both test scores and graduation rates as keyindicators of student achievement and educational attainment in Canada is that test scoresand graduation rates frequently send contradictory messages. For example, in theOECD’s 2000 and 2003 Programme for International Student Assessment (PISA),Alberta’s 15-year-olds ranked the highest in the country in reading, math, and science,and yet in 2002/2003, Alberta had the lowest high school graduation rate (67%) and thesecond-highest drop out rate (12%) among the provinces. Likewise, the Maritimeprovinces have the highest graduation rates in the country but rank near the bottom instandardized test results. 101
PISA results also show that students from higher socioeconomic backgrounds tend tohave stronger literacy skills and perform better in math. The same pattern was observedin all 32 countries that participated in the PISA assessments.102 By way of example, seeFigure 18 below for a breakdown of 2003 math results by quartile for Canada and theprovinces. The results reveal a clear income-related performance gradient, with scoresincreasing with each income level in every province in the country.
In 2000, in a book analysing the PISA results, the OECD observed that “the schoolstudents attend is strongly predictive of their performance” and that “the socio-economiccomposition of schools explains far more of the differences in student performancebetween schools than do other school factors that are more easily amenable to policymakers, such as school resources and school policies.”103 In sum, do the standardized testresults reflect actual capacity, attainment, and knowledge, or do they reveal far moreabout students’ socio-economic status and the socio-economic composition of the schoolsthey attend?
2a. Standardized test results and graduation / drop out rates provide conflictingmessages.
GENUINE PROGRESS INDEX Measuring Sustainable Development56
Figure 18. Average scores in the PISA math assessment by quartile of familysocioeconomic status, 15-year-olds, Canada and provinces, 2003
Source: PCEIP, 2006. Table C4.6, p. 208.
571
585
556
559
571
584
555
559
541
565
563
546
552
524
538
540
556
523
529
517
532
532
525
539
521
524
526
531
508
510
496
516
510
507
506
477
504
503
502
483
479
469
485
486
0 100 200 300 400 500 600 700
British Columbia
Alberta
Saskatchewan
Manitoba
Ontario
Quebec
New Brunswick
Nova Scotia
Prince Edward Island
Newfoundland &Labrador
Canada
Average PISA math scores
First quartile
Second quartile
Third quartile
Fourth quartile
GENUINE PROGRESS INDEX Measuring Sustainable Development57
In addition to the contradictory messages transmitted by conventional indicators ofeducational attainment and the fact that scores often reflect and reinforce socioeconomicinequalities, educators have pointed to other key problems associated with reliance onstandardized test scores. Analysts note that these tests focus on only a few academicsubject areas—mathematics, reading / writing, and science—which have therebyassumed greater general importance than music, art, history, foreign languages, socialstudies, ecology, and other key subject areas.
As well, critics have noted instances where standardized test results have been misusedand manipulated to support misguided calls for reform, including curriculum reforms thatemphasize a “return to basics” at the expense of other key subjects and the developmentof critical thinking skills. Educators also frequently bemoan the fact that, sincestandardized tests take place every few years, they frequently do not reflect or evaluatewhat the students have actually been learning in the classroom. As well, teachers havecomplained that the pressure to perform well on the standardized math, science, andreading/writing tests can result in teaching to the test, at the expense of class discussion,creative teaching, fostering of critical skills, and focus on non-test subject areas.104
At an even more basic level, critics have questioned the utility of “output” indicators likegraduation rates, drop out rates, and standardized test results, when actual learning“outcomes” like basic adult literacy and political knowledge have not responded tochanges in educational system outputs. As noted above, Statistics Canada and theCanadian Council on Learning have expressed surprise and puzzlement that adult literacyrates have not improved nationwide since 1989 despite higher apparent rates of formaleducational attainment. As well, we noted that political knowledge among the young hasactually declined dramatically over the last two decades, despite an assumed associationbetween formal educational attainment and political knowledge.
“Access” is defined not only by physical access to a school, but by the availability ofquality education. According to some analysts, more parents are turning to privateschools because the latter offer smaller class sizes and because cuts to public educationbudgets especially in the 1990s have reduced offerings of music, art, excursions, and arange of extra-curricular activities. John Ralston Saul reflects bluntly: “It is only withgreat difficulty that I could imagine a greater betrayal of the principle of Canadiandemocracy than the piecemeal reduction of public education to private education.”105
In 1998/1999, 5.6% of all children in elementary and secondary schools in Canada wereenrolled in private schools, up from 4.6% in 1987/1988. In 1998/1999, the proportions ofprivate school students were highest in Quebec (9.2%) and British Columbia (8.8%) andlowest in the Atlantic provinces. Unfortunately, Statistics Canada stopped collecting data
3. Evidence suggests a widening gap in access to quality education amongelementary and secondary students.
GENUINE PROGRESS INDEX Measuring Sustainable Development58
on private school enrolment at the very time that private school enrolment was showingits largest increase, so the most recent year for which data are available is 1998/1999.
However, the available evidence indicates the growing emergence of a two-tierprivate–public education system in Canada based on the capacity to pay. This two-tiersystem is emerging not simply in the distinction between public and private schooling,but within the public school system itself, as an apparent increase in reliance on privatefundraising and user fees for basic school needs and activities favours schools in higherincome neighbourhoods.
In 2006, the Canadian Teachers’ Federation (CTF) released the results of the first pan-Canadian survey of its kind to collect data on a wide range of commercial andfundraising activities in schools, including the incidence of private fundraising for basiceducational needs in Canadian public elementary and secondary schools. The STF surveyfound that nearly 50% of all schools fundraise for library books, 73% fundraise forschool trips, 24% fundraise for academic programs, and 18% fundraise for supplies. Aswell, 70% of secondary schools fundraise for athletic programs.106 Similarly, Canadianschools are increasingly charging user fees for various services and activities that wereonce provided for free. Nearly 80% of all public schools charge user fees for activitiesand materials like school trips, supplies, programs, clubs, and sports teams.
In a speech to the CTF entitled “In Defence of Public Education,” John Ralston Saulargued: “The whole idea of private fundraising for public schools is the first step towardsintroducing a class-based society into Canada. Private fundraising is, in and of itself, aform of exclusion.”107
Evidence strongly suggests that the decline in provincial spending on public education inthe 1990s resulted in two simultaneous trends: 1) the increasing commercialization ofeducation, as school boards seek alternative financial support, and 2) a shift in the burdenof educational costs onto families and households.
When alternative funding comes from the corporate sector, a number of potentialconflicts may arise, as corporate funding often comes with conditions intended to benefitthe funder, but which may or may not benefit the students and the quest for genuineknowledge. This external influence can potentially erode a school’s independence,compromise the students, and, according to Henry Giroux, reduce education’s “publicand critical role.”108
The Canadian Teachers’ Federation (CTF) survey in 2003/2004 is the first ever pan-Canadian survey of its kind to collect data on a wide range of commercial activities in
4. There appears to have been an increase in the extent of commercial activity inCanadian schools in the last two decades, with public funding sources morefrequently replaced by alternative funding sources.
GENUINE PROGRESS INDEX Measuring Sustainable Development59
public schools, including advertising, partnerships and sponsorships, and corporate-sponsored educational materials. The CTF survey found that 32% of all publicelementary and secondary schools in Canada allow advertising (28% of elementaryschools and 55% of secondary schools). In Atlantic Canada, nearly 35% of all elementaryand secondary schools allow advertising. In addition, 19% of public schools in Canadahad sponsorships or partnerships with a corporation. In general, the data indicate aregional pattern in the incidence of commercial activity, with the highest rates in theWest and by far the lowest rates in Quebec.
Despite the lack of long-term pan-Canadian data on this important subject, a number ofteacher organizations and parent groups as well as educational experts have asserted,based on their own surveys, monitoring, and observations, that there has been an increasein the extent of commercial activity in Canadian schools over the last two decades.109
According to Statistics Canada, income from the commercialization of intellectualproperty (IP) at universities increased from $18.9 million in 1999 to $51.2 million in2004 (current dollars)—a very substantial relative increase (of 170%) in a very short timespan of just five years.110 In addition to these increased commercial revenues, the numberof inventions reported or disclosed by researchers to universities and hospitals increasedby 73% between 1999 and 2004, from 829 to 1,432; the number of patent applicationsfiled increased by 105%, from 616 to 1,264; and the total number of patents heldincreased by 109%, from 1,826 to 3,827.111,112 In addition, in 2004, Canadian universitiesand hospitals created 50 additional spin-off companies to commercialize theirtechnologies—bringing the total to 968 to-date, an increase of 113% since 1999.113
Observers have noted that the granting of university research funds is increasinglycontingent upon the ability of investigators to demonstrate that their research has marketpotential or can be commercialized. However, John McMurtry contends that themaintenance of “pure” or “curiosity-driven” research, which is not commercial research,is a key indicator of a society’s wellbeing and one of its most endangered spheres underthe increasing commercialization trend.114 Despite the importance of basic / curiosity-driven research, it is not tracked in the way that commercial research is, and there are nodata to indicate whether it is increasing or declining, or able to attract the same level offunding as in the past. Such an investigation must begin simply by defining andcategorizing this type of non-commercial research effectively so that it can be trackedand measured accurately.
Thus, even though the available evidence points to an increase in commercializationoverall, it is not certain whether or not a greater share of university research is nowcommercialized than in the past. Nor do we know whether the present share ofcommercial research is, overall, larger than the share of non-commercial research either
5. Commercialization of intellectual property at Canadian universities is on therise.
GENUINE PROGRESS INDEX Measuring Sustainable Development60
in funding attracted or in the proportion of university researchers engaged. An analysiscomparing commercial and non-commercial research, similar to that comparing thepublic versus the private share of university funding, is necessary here, based on new datacollection in this field.
Statistics Canada data indicate an income-related gradient in university participation.Thus, youth (18 to 24 years) whose parents had high incomes (more than $100,000annually) were most likely to attend university throughout the 1990s, whereas thosewhose parents were in the lowest income group (less than $25,000 annually) were theleast likely to attend university. However, the data also show that, despite the fact thattuition fees increased by 77% between 1993 and 2001 in real terms and that student debtlevels also increased sharply, this “participation gap” has remained fairly constant andeven narrowed marginally. For example, in 1993, 18.4% of youth whose parents hadincomes of less than $25,000 a year attended Canadian universities compared with nearly50% of youth whose parents had incomes exceeding $100,000 a year. By 2001, theparticipation rates were 19.5% and 45.6% respectively.
The retention of low-income groups could be related to higher loans (due to changes inthe maximum amount of loan receivable from the Canada Student Loans Program) andalso to more borrowing from alternative sources, therefore possibly contributing to theincreased debt levels denoted in Figure 2 above.
Since 1989, as noted, basic adult literacy levels in Canada have not risen despite risinglevels of formal educational attainment in the Canadian populace. In the area of civicliteracy, the 1984–2000 Canadian Election Study (CES) results appear to indicate that,except for those 50 and older, the level of political knowledge in the Canadian populacemay be in general decline. This is especially true of political knowledge among theyoung, as discussed below. Research explored by GPIAtlantic also reveals lowknowledge levels among the public in Canada, and in North America in general, about awide range of important social, economic, health, and environmental issues ranging frompolitical policy issues, to nutrition and medical instruction, to the connections between
6. The participation gap at Canadian universities has remained constantthrough the 1990s.
7. There is no indication that levels of knowledge are increasing in the Canadianpopulace—basic literacy is stagnant and there is evidence of low knowledgelevels in areas like politics, health, and the environment—despite the fact thatthe formal educational attainment of the Canadian populace has never beenhigher.
GENUINE PROGRESS INDEX Measuring Sustainable Development61
resource extraction, energy use, and other consumption patterns on the one hand and thehealth of the environment on the other hand.
As found in the research to this report, this lack of knowledge often manifests inuninformed action, again demonstrating the crucial nexus between learning outcomes andsocial outcomes. Thus, for example, statistics indicate increased rates of driving, gasolineuse, and use of large vehicles with low gasoline mileage, which may illustrate a lack ofknowledge and understanding of the impact of human energy use on climate change, andof the value of energy conservation, or a disregard of the consequences of globalwarming, However, there is some indication that an increase in extreme weatherevents—including droughts, heat waves and fires, or hurricanes and tornados—coupledwith the rising price of gasoline, may be changing this particular public knowledge deficitand the consequent actions.
Younger Canadians not only have less political knowledge than older age groups, but thispolitical knowledge is decreasing over time and at a faster rate than for older groups.That young people are generally less politically knowledgeable than older people isreferred to as the “life-cycle” effect, and analysts note that it is to be expected as part ofthe developmental process.115 In other words, when young people enter the workforceand have families, their priorities shift and political knowledge becomes more relevant tothem. Therefore, their interest and knowledge levels gradually increase as they age.
However, the so-called “life-cycle” effect cannot explain the apparent decline in youngpeople’s political knowledge, voting, and political engagement in recent years. Thisrecent decline is often referred to as the “generational effect,” meaning that young peopletoday tend to be less knowledgeable than young people were a generation ago. Thissuggests there is a drop in general political knowledge that will continue over time as lessinformed young adults age. Analysts like Howe argue that a low level of political interestamong youth seems to reflect the life-cycle effect, while low political knowledge seemsto indicate a generational effect.116
Correlating political knowledge with voter turnout reveals both a growing knowledge-related voter turnout gap over time and a significantly larger knowledge-related turnoutgap among younger Canadians than among older ones. The latter finding means thatolder Canadians with less political knowledge are still relatively more likely to vote thanuninformed younger Canadians. This, coupled with evidence that more young Canadiansmay be losing the motivation to be politically knowledgeable, is very disturbing both forthe long-term civic health of the country and because young people are becomingincreasingly disenfranchised in practice. Thus, Howe concludes that lower levels ofpolitical knowledge among the young are working together with the overall rising impact
8. Young people today tend to have less political knowledge than young peopledid a generation ago.
GENUINE PROGRESS INDEX Measuring Sustainable Development62
of knowledge on political participation to reduce voter turnout rates among younger agecohorts.117
The media have a profound affect on our social, economic, political, and cultural lives.Not only do the media help shape our local and national culture, including ourvocabulary, common experiences, and references, but the influences and effects ofWestern media are also widely spread globally. Therefore, as Len Masterman—theforemost British authority on media literacy—notes, it is important to understand “theways in which the media represent reality, the techniques they employ, and the ideologiesembedded within their representations.”118
In general, researchers have found that “audiences lack the more complex skills, for asufficiently discerning or critical understanding, to deal with the highly sophisticatedconstruction of media messages.”119 In an Australian media literacy assessment, less than10% of secondary school students had the critical analysis skills required for medialiteracy.120 Although these results are for Australian students, this finding appears toreflect a global phenomenon, and it is quite likely that similar results would be found inCanada if the Australian assessment were replicated here.
More than half of Canadian adults (54.7%) do not have adequate levels of health literacy.This means that most Canadians may not know how to maintain and improve their health,including following medical advice and prescription drug instructions and avoiding keyrisk factors. Also, one in five Canadians lacks even the most basic ability to read andunderstand health information, while only one in nine Canadians can digest complexhealth information. The Canadian Council on Learning (CCL) notes that health literacytends to decline with age, is directly correlated with health status, and increases withhigher education.121
Younger Canadians are somewhat more health literate than older Canadians. At least halfof Canadians aged 16–35 are classified by Statistics Canada as having adequate healthliteracy skills, and one in eight can digest complex health information. The level of healthliteracy then declines with age, with 47% of those aged 36–45, less than one-third in the
10. Canadians’ health literacy tends to decline with age, to increase with highereducation, and to be directly correlated with health status. Senior citizens, whohave the greatest medical and health care needs, have by far the lowest healthliteracy levels.
9. Youth and adults may lack the critical analysis skills needed to discern anddeal effectively with the meanings, messages, organization, and techniques ofmass media practices, including the influence of advertising in the media.
GENUINE PROGRESS INDEX Measuring Sustainable Development63
56–65 age group, and only one in eight of those over 65 having at least adequate healthliteracy skills. Fully 61% of seniors, who have the greatest health needs and problems,score at the lowest level in the health literacy scale, indicating that they do not have eventhe most basic ability to understand health information and thus to take informed actionto maintain and improve their health.
Also, in general, those with excellent and very good health score higher on the healthliteracy scale than those in poor health. There is also a gradient of health literacy by levelof formal educational attainment, with university educated Canadians having the highestlevel of health literacy, while those with less than a high school education have the lowestlevel of health literacy.
According to one analyst, the growth of organic agriculture is a knowledge-basedphenomenon. Thus, increased knowledge on the part of the public about how food isgrown and processed has been directly responsible for the development and growth of theorganic food industry.122 In Canada, the organic food market has been reporting growthof 15% to 20% per year since the late 1990s, with organic retail sales topping $3 billionin 2005. By 2010, the organic food industry’s market share is expected to increase to10% of the Canadian retail market.123 According to Alberta Agriculture, Food, and RuralDevelopment:
Much of what organic food offers speaks directly to the emerging values andtraits of the Canadian consumer, not just those identified as organic consumers.[…] Not only are organic consumers becoming mainstream, but so also are thechannels for purchasing organic products, clearly seen in trends within the US andCanada.124
The Tracking Nutrition Trends (TNT) surveys found that, in a very short period of time,there has been a marked increase in interest in and knowledge about organic food. In2004, 41% of adults indicated that organic production methods were “somewhat / veryinfluential” in their food choices, compared with 57% who said they were “not too / notat all influential.” By 2006, 50% of adults stated that organic production methods weresomewhat or very influential in their food choices compared with 48% who said theywere not too influential or not at all influential.125
The TNT surveys also found that Canadians who see themselves as heath- and nutrition-oriented more often choose organic food than those who are not health- and nutritionoriented.126 Interestingly, consistent buyers of organic food—which tends to be moreexpensive than conventionally produced food—do not have higher incomes than most
11. There has been a marked increase in interest in and knowledge aboutorganic food within a very short period of time. Interestingly, those who buyorganic food are not those with the highest incomes or formal education.
GENUINE PROGRESS INDEX Measuring Sustainable Development64
other Canadians. They tend to be somewhat more educated than the national average butare by no means the most highly educated group in terms of formal higher education. Inother words, buyers of organic food tend to be much closer to the socio-economic centreof the spectrum than might otherwise be assumed.
Indigenous knowledge systems have much to teach Western culture about sustainabilityand human interactions with the natural world, about holistic and interconnected ways ofthinking, about non-linear methods of understanding, learning, and integrating spiritualand cognitive knowledge, and about survival in general.127 One important indicator ofIndigenous knowledge literacy, therefore, is the extent to which the general populaceknows about and understands Indigenous knowledge and culture, and is willing to learnfrom it. Another aspect of Indigenous knowledge literacy, considered below, is thedegree to which this knowledge and culture is effectively transmitted among Canada’sIndigenous peoples.
The only survey in Canada that broaches the subject of general Canadian understandingof Indigenous knowledge and culture is a 2003 survey conducted by the AboriginalCultures and Tourism Working Group (ACTWG), which interviewed Aboriginal leadersrepresenting the four regions and various sectors that comprise Canada's Aboriginalcultural tourism industry. One question used in this survey was: “What level ofunderstanding do the majority of your Canadian visitors have of Aboriginal people andculture prior to their visit?” Non-Indigenous visitors were scored very poorly by theAboriginal cultural tourism leaders.
Only 12% of respondents perceived the majority of non-Indigenous visitors as having agood prior understanding of Indigenous knowledge and culture, and none at all rated thatunderstanding as excellent. By contrast, 33% of respondents thought that the majority ofnon-Indigenous visitors had only a fair understanding of Indigenous knowledge andculture prior to visiting, while 27% thought they had a poor understanding of Indigenousknowledge prior to visiting. Although this survey and these results are not nationallyrepresentative, the responses do suggest that there may be a very low level of Indigenousknowledge understanding among non-Indigenous Canadians, as perceived by Indigenouspeople themselves.
12. Non-Indigenous Canadians may have a poor understanding of Indigenousknowledge and culture.
GENUINE PROGRESS INDEX Measuring Sustainable Development65
Research indicates there are close links between language and knowledge, thatAboriginal languages express concepts not captured in other languages, and thatlanguages are a vital means of transferring oral knowledge between generations.128,129
Knowledge of Aboriginal languages in Canada is particularly vulnerable, as only three(Inuktitut, Cree, and Ojibway) out of over 50 remaining Aboriginal languages currentlyhave a sufficient base of speakers to be considered relatively secure from the threat ofextinction.130 In order for Aboriginal languages to continue flourishing over time, theremust be solid intergenerational transmission. Thus, the most crucial relationship fosteringthis transmission is that between parents and their children. According to UNESCO, alanguage is considered endangered if it is not learned by at least 30% of the children inthe community.131
Census data show that the proportion of First Nations children aged 14 and under with anAboriginal mother tongue—defined as the language first learned at home in childhoodand still understood—fell from 9% in 1996 to 7% in 2001. In addition, the percentage ofAboriginal children who use an Aboriginal language at home declined from 6% in 1996to 5% in 2001.132,133 These declines can be considered very sharp indeed considering thevery short period of time (just five years) over which they have occurred.
Inuktitut remains one of the strongest Aboriginal languages, and its decline is not as rapidas that of most other Aboriginal languages.134 In the Canadian Arctic, over 90% of Inuit,including both children and adults, can understand or speak their native language.135 Ingeneral, nearly three-quarters of Inuit children 14 and under still have an Aboriginallanguage as their mother tongue. However, overall, Inuktitut is being used at home lessoften than before. For example, in 1996, Inuktitut was the language used most often athome by 68% of Inuit, but by 2001, this percentage had declined to 64% of Inuit.
While 44% of non-reserve Aboriginal children who have a parent who has not gonebeyond elementary school can speak or understand an Aboriginal language, only 17% ofchildren with a parent who has completed some postsecondary education can do so.136
This pattern is apparent within all three major Aboriginal groups. Among Inuit children,92% of those with a parent who has not gone beyond elementary school can speak orunderstand an Aboriginal language, while just 51% who have a parent with somepostsecondary education can speak or understand their native language.
Among First Nations children, 33% with a parent who has not gone beyond elementaryschool can speak or understand an Aboriginal language, while 21% who have a parentwith some postsecondary education can do so. Finally, while 25% of Métis children witha parent who has not gone beyond elementary school can speak or understand their
13. Very few Aboriginal children are learning to speak their native language withany degree of proficiency. Moreover, fewer Aboriginal children with a parentwho has some postsecondary education can speak or understand their nativelanguage than can Aboriginal children with a parent who has not gone beyondelementary school.
GENUINE PROGRESS INDEX Measuring Sustainable Development66
Aboriginal language, only 9% of those with a parent who has some postsecondaryeducation can do so.137
Results from the Canadian Democratic Audit indicate that large numbers of Canadiansare not only uninformed about politicians, simple political facts and concepts, andpolitical parties’ stands on key issues, but they are also often misinformed about basicpolicy issues like income distribution, crime rates, pollution, and the living standards ofAboriginal peoples. This lack of knowledge and misinformation results in votingbehaviour that is often not consistent with people’s values.138
Analysts agree that ecological literacy has four components – knowledge, values,attitudes/beliefs, and behaviour. If the first three are sufficiently strong, it is assumed theywill induce behavioural change. This is generally not yet the case in Canada. In general,the vast majority of Canadians definitely express that they are concerned about theenvironment, yet for most, this concern is not reflected in their attitudes towards policy orin their personal behaviours when asked about solutions to specific ecological problems.For example, although Canadians in general terms support government leadership andregulation to protect the environment, most say they are not willing to pay higher pricesor higher taxes or to accept a cut in their standard of living in order to achieve thesegoals.
With the notable exception of recycling, the available data indicate that most Canadiansdo not engage in even the most basic pro-environmental behaviours, despite theirexpressions of concern about environmental issues. For example, while 57% ofCanadians acknowledge global warming to be a “very serious” issue and another 33%acknowledge it to be “somewhat serious,” most remain particularly attached to their carsand unwilling to reduce their driving. According to the 2006 Statistics Canada Householdand Environment Survey (HES), 80% of Canadians use private motor vehicles to get towork during the colder months and 72% do so in the warmer months, when more activetransportation options are possible. Overall, more than half of Canadians do not carpoolbut drive alone to work.139 A 2007 Angus Reid survey on climate change found that onein five Canadians drive at least 25,000 km a year, while more than half of all respondentssaid they would either never, or not in the next year, cut their driving by half.140
14. Canadians are not only often uninformed about major issues, they are alsooften misinformed.
15. While Canadians often express concern about the environment, mostCanadians do not support higher prices or taxes to protect the environment orengage in basic pro-environmental behaviours like reducing their driving.
GENUINE PROGRESS INDEX Measuring Sustainable Development67
Only one in ten respondents to the HES said they take public transportation to work. Yet,according to the 2007 Angus Reid survey on global warming, nearly three-quarters (72%)of Canadians said they actually have public transit available to them in their own area.141
Despite this availability, 56% of the Angus Reid respondents said they never presentlyuse public transit, 45% said they would never use it on a daily basis in the future, and afurther 26% said they would not do so in the next year.
Despite the fact that behaviour in matters like transportation has not yet changedsignificantly, the Centre for Research and Information on Canada (CRIC) Portrait ofCanada surveys has found a sharp increase since 1997 in the proportion of Canadiansranking the environment as a high priority for government. In 2005, 78% of Canadiansidentified the environment as a high priority for government—a higher proportion thanfor any other issue listed. 2004 and 2005 marked the first times in over 10 years of CRICsurvey questions on government priorities that the environment had ranked so high inpublic concern.142 Confirming these CRIC results, the 2007 TSN Canadian Facts surveyalso saw the environment ranking as the highest issue of public concern in Canada.
Regional differences are notable. In the 2005 CRIC survey, fully 89% of those in theNorth, and 85% of Atlantic Canadians and Quebecois considered the environment a highpriority for the federal government, as did 76% in the West and 73% in Ontario.
Results from several other surveys examined in detail by GPIAtlantic also point toCanadians’ strong support for government targets, laws, and regulations to protect theenvironment, to the importance of greater government leadership in this field, and to theneed for better educational programs aimed at both the adult and youth populations. Aswell, 90% of respondents to a 2006 Sustainability Research Initiative surveyacknowledged that Canadian lifestyles are presently unsustainable.
When the array of available evidence is considered as a whole, the detailed survey resultsseem to indicate that vigorous and strong government action may be a prerequisite andnecessary step to induce significant personal behavioural change. Thus, 80% of Canadianrespondents to the International Social Survey Program’s 2000 questionnaire agreed that:“Government should pass laws to make ordinary people protect the environment, even ifit interferes with people’s rights to make their own decisions.” And 96% agreed that:“Government should pass laws to make businesses protect the environment, even if itinterferes with businesses’ rights to make their own decisions.”143
As well, more than half of Canadian respondents to the 2007 Angus Reid climate changesurvey supported a ban on SUVs.144 And in response to an open-ended 2006Sustainability Research Initiative question on why they and other Canadians presentlybehave unsustainably, respondents listed lack of government leadership ahead of any
16. The percentage of Canadians who consider the environment as a highpriority for government action has seen a dramatic increase in the last decade.
GENUINE PROGRESS INDEX Measuring Sustainable Development68
other reason.145 In short, government action on the environment appears to be an essentialbridge to personal behavioural change.
Knowledge is essential to improve wellbeing in many spheres of life. For example,linkages between literacy and health, and between living standards and education havelong been recognized. Linkages between the array of results in this education indicatorsreport and the results in the other 19 GPI domains should now be explored in greaterdepth and detail.
For example, various studies have uncovered several disturbing trends relating toCanadian youth that may be linked: Canadian youth have experienced a decline in self-rated health and higher rates of depression; low-wage labour among youth is increasingdespite an economic boom; there are lower levels of political knowledge and votingamong young people despite increased graduation rates; and debt levels and work hoursare increasing among postsecondary students. Together these factors may point to higherlevels of financial and time stress among youth, and even to patterns of exclusion. Suchlinkages between the education and other GPI domains must be examined more fully infuture research in order to create a properly integrated Genuine Progress Index.
17. There are many key linkages between learning outcomes and the other GPIdomains.
GENUINE PROGRESS INDEX Measuring Sustainable Development69
4. Recommendations
The findings presented in this summary Nova Scotia GPI Education Indicators report andin the accompanying comprehensive list of recommended indicators, are merely a firststep in a long-term process of developing meaningful indicators for the educationcomponent of the GPI. The present inadequacy of most existing education indicators anddata sources, as discussed above, requires that new data sources be developed.
It should be noted that the indicators for which data were assembled by GPIAtlantic,including those highlighted here, explore only two of the several areasexamined—namely literacy and formal education. In fact, GPIAtlantic’s research coversa much wider range of learning and knowledge dimensions, corresponding to theframework illustrated in Figure 1 above, which together constitute key components of aneducated populace. These additional dimensions include assessments of wisdom, thelearning of values, elements of lifelong and life-wide learning, non-cognitive learning,and evaluations of the quality of information in the learning environment. Therefore,future updates of this domain should include indicators in each of these areas, which aresummarized below.
As a starting point for the longer-term development of the education domain, it issuggested that the comprehensive list of recommended indicators accompanying thisreport be used as a reference point for the construction of the new data sources and theconsiderable developmental work that will be required in this area in the years ahead.Here we briefly summarize some of the key areas—not yet covered in this summaryreport or in the foundational work assembled by GPIAtlantic that are integral to theoverarching education domain framework summarized in Figure 1 above—in which suchdevelopmental work is required.
The following very brief summary highlights just a few of the key themes from thatlarger framework and from the foundational work for this report that have been identifiedas priorities for future research and development.
GENUINE PROGRESS INDEX Measuring Sustainable Development70
4.1 Wisdom
Though extraordinarily difficult to measure by conventional means, wisdom has beendefined as the most important outcome of lifelong learning and described as the “pinnacleof successful human development.”146 It involves the ability not just to acquireinformation and possess knowledge, but to process that knowledge in such a way as todevelop deep understanding, to see reality directly and clearly, and to act effectively.147
As noted earlier, knowledge and learning without wisdom can actually be dangerous, asevidenced in their use for war and environmental destruction. According to Bassett,wisdom especially involves:
• an ability to think holistically, and to discern whether or not something isbeneficial or harmful to oneself and society
• having openness, caring and compassion, and respect for all life forms• having a commitment to action toward enhancing the common good• understanding that we are part of something larger than ourselves, and undergoing
profound transformation, or increased integration, on both individual and societallevels.148
Despite the enormous challenges involved, it should be an underlying and long-term goalto assess progress towards the higher stages of the data–wisdom hierarchy. As found inthe research for this study, analysts have defined the steps along this hierarchy as data,information, knowledge, and wisdom (in ascending order), with understanding being thefactor that connects all four levels.
GPIAtlantic examined four examples of attempts to create scales to measure elements ofwisdom through survey questionnaires. Although none of these “wisdom scales” have yetbeen used in large, public or population-wide samples, and while all of them are still invarious stages of development, they do present possibilities for incorporating a wisdomelement into education indicators if properly and reliably administered in Canada.
4.2 Values
According to Francis Heylighen, values are the moral or ethical convictions or attitudeson which a population bases its sense of purpose, goals, or directions to guide itsactions.149 The utilitarian function of values is that they can help discriminate betweenwhat is beneficial to the wellbeing and sustainability of society and what is detrimental.Values are transmitted through learning processes and are a key learning outcome, andthey also in turn determine what is learned and how information is processed.
GPIAtlantic recognizes that any measure of genuine progress is based on the implicitquestion “progress towards what?” and is therefore normative by its very nature. Ameasure of genuine progress assesses progress towards defined outcomes, thus inherentlyembodying a vision or ideal towards which society aspires. In other words, it is literallynot possible to measure progress without a clearly defined sense of what it is that society
GENUINE PROGRESS INDEX Measuring Sustainable Development71
wants to achieve, which in turn is based on fundamental values. Those values in turn arelearned and transmitted through a wide range of formal and informal educationalprocesses and structures.
GPIAtlantic is especially concerned with identifying those Canadian values thatpositively affect human and ecosystem wellbeing and found that it is widely accepted thatbroad values such as equity, compassion, and a concern for the common good, amongothers, are more likely to lead to socially valuable outcomes than values based morestrongly on individualism and self-interest. Thus, it is important for the GPI as a whole,and for the GPI education domain in particular, to assess the prevalence of particularvalues in the Canadian populace, to understand how these values are learned andtransmitted, and to determine whether or not these values are changing over time.Because learning systems play an important role in questioning and potentially provokingshifts in values, the effectiveness of these learning systems can be assessed in part by theextent to which they successfully teach and transmit values that enhance social wellbeingand ecosystem health, and the extent to which they effectively identify, examine, andcritique dominant social values and paradigms that potentially undermine wellbeing.
In sum, identifying, questioning, examining, learning, and acting on values is as critical apart of educational processes and systems as the acquisition of facts and information. Yeteducational systems are rarely assessed or evaluated according to their effectiveness inquestioning and transmitting values. Considerable developmental work is clearly requiredin this area before indicators and results in this field can be included in the GPI educationdomain.
4.3 Lifelong and life-wide learning
Lifelong learning refers to learning that does not stop with formal education, butcontinues throughout the individual’s lifetime. Life-wide learning refers to the fact thatlearning takes place in nonformal and informal modes in many settings other than schoolsand universities—including the home, workplace, and community, and throughadvertising and the media.150 Yet, due both to methodological and data challenges, and totime and resource constraints, this is another key area not yet integrated into thissummary report.
Although lifelong and life-wide learning indicators have not yet been developed for thisGPI education domain, GPIAtlantic found emerging data sources and considerable newresearch in these areas that suggest future development of indicators in the followingcategories:
1. ‘Self-regulated’ learning has been found to be an excellent predictor of the propensityfor lifelong learning and could be systematically assessed at a pan-Canadian levelusing existing instruments that could be readily adapted to population-wide surveys inorder to develop the necessary data for this indicator.
GENUINE PROGRESS INDEX Measuring Sustainable Development72
2. Nonformal learning includes work-related nonformal learning, personal interestnonformal learning, and apprenticeship or learning of skilled trades—all of which canbe tracked systematically.
3. Informal learning involves the processes by which people acquire and accumulateknowledge, skills, attitudes, and insights from daily experiences and exposures athome, work, or play; from family and friends, libraries, museums, or culturalactivities; from travel, books, television, or newspapers; and so on. Potentialindicators in some of these areas were explored in detail by GPIAtlantic.
4.4 Quality of information in the learning environment
Effective education is clearly a matter of quality rather than quantity. And yet, the qualityof much of the information available in the public domain is questionable, since a greatdeal of it is composed of irrelevant, unclear, and erroneous data fragments. Observers andcritics of this phenomenon have noted that it takes time, energy, skill, and experience toweed out the irrelevant, redundant, and low-quality information from the vast amount ofavailable information from which to choose.
Developing indicators that assess the quality of information in the public domain,including changes over time, and that address the wide array of problems concerning thequality of information currently available to the public is essential since this directlyaffects how the public forms its knowledge of important issues. The authors consider thisa vitally important area for future development, as good indicators of an educatedpopulace must consider contextual issues such as how the public is educated, where itgets its knowledge and information from, the degree to which unsubstantiatedinformation holds sway, and the degree to which the public is capable of distinguishingfact from fiction.
As well, the reliability and authenticity of information on the one hand, and its use formanipulation to sway public opinion on the other, are also crucial to monitor for thepurpose of delineating and tracking the complex relationships between learning outcomesand social outcomes. This is because such information and its manipulation are designedto influence actual behaviour, including spending patterns and health behaviours. For allthese reasons, new and effective education indicators must attempt to address and assessthe degree to which contrived and unsubstantiated opinions hold sway in the public arena,and the degree to which existing learning systems effectively teach students to identifyand see through such opinions. Potential indicators in this important area were exploredin some detail by GPIAtlantic.
GENUINE PROGRESS INDEX Measuring Sustainable Development73
4.5 Social outcomes
In addition to this education component, the GPI is composed of 19 other domains orareas of interest that affect wellbeing. Since these social, economic, and environmentaloutcomes are the subject of investigation in the other GPI components, this educationanalysis has not emphasized the social outcomes section of the domain framework(summarized in Section 1.3 of this summary report and in Figure 1 above). However, tocomplete this framework properly, it is recommended that future GPI research anddevelopment link the learning outcomes assessed in this domain—particularly thoserelated to the eleven forms of literacy examined—with the social outcomes described inthe other GPI domains.
For example, relationships have been demonstrated in the literature to exist betweeneducation on the one hand and health, living standards, work, crime and EcologicalFootprint on the other hand. As well, to illustrate the importance of these linkages, thissummary report—as noted—references a special study assessing, for the first time, theEcological Footprints of Canadians by educational level. In passing, we have alsoreferenced other relationships between learning and social outcomes whenever they havebeen clearly indicated by the evidence presented, like the link between health literacy andhealth status for example. Future work should undertake a more systematic integrationbetween such learning and social outcomes.
In presenting the GPI to Nova Scotians, the intention is not simply to present 20 stand-alone components. On the contrary, one of the most important purposes of the GPI is todemonstrate the links and relationships between its component parts. From thatperspective, education, in its broadest sense, is a key determinant of societal wellbeing,and all of the learning outcomes explored in the research for this report are determinantsof societal health, wellbeing, and sustainability. Because learning outcomes do directlyinfluence social outcomes, this education domain can serve as valuable connective tissuebetween the various GPI domains.
4.6 Canadian Knowledge Survey (CKS) and other data sources
Based on three years of extensive research and exploration of data sources, the authors ofthis report strongly recommend the development of a new Canadian Knowledge Survey(CKS) that would indicate levels of knowledge and lifelong learning in the Canadianpopulace in the specific areas of ecological literacy, scientific literacy, arts literacy,health literacy, food and nutrition literacy, civic literacy, multicultural literacy, medialiteracy, Indigenous knowledge literacy, and statistical literacy. Administered regularly,the proposed new survey would assess whether or not knowledge in these areas isimproving, deepening, and expanding. As such, its results would be of great interest toStatistics Canada and to educators, educational institutions, and policy audiencesnationwide as well as to the general public. Such a survey would effectively constitute animportant and highly practical outcome of this education research.
GENUINE PROGRESS INDEX Measuring Sustainable Development74
Presently, indicators of broader literacies and knowledge areas beyond basic adultliteracy are not systematically tracked in Canada, although these new directions are beingexplored within individual disciplines. GPIAtlantic found that there are currentlyexcellent surveys and research initiatives in place or under development designed toassess knowledge in these multiple literacy areas. As well, other jurisdictions like theU.S. and some European countries have good data on science literacy, civic literacy,ecological literacy, and other areas for which data are unfortunately unavailable inCanada.
The proposed CKS could therefore draw on these and many other internationalinitiatives, and bring them together in a systematic and integrated way to create acomprehensive instrument that could address some of the many information gaps inassessing learning outcomes. The new survey could begin to re-orient educationindicators and data in this field towards actual learning outcomes at the population level,and away from the much more limited input and output data that currently dominate theeducation indicators field and that are confined largely to the formal education context.
Indeed, such a CKS could begin to assess the effectiveness of formal education processesin improving the knowledge of the populace at large. As noted above, there is presently aserious disconnect in this area, as a result of which both Statistics Canada and theCanadian Council on Learning have expressed surprise that higher levels of formaleducational attainment have failed to improve basic literacy levels in the adultpopulation. As well, we have noted that higher levels of formal educational attainmenthave not been correlated with higher levels of political knowledge, particularly amongthe young. A well-designed Canadian Knowledge Survey could begin to address some ofthese relationships and existing gaps, and thereby provide essential information toeducation planners that would in turn affect curriculum design and teacher training.
As a preliminary first step, it is recommended that a survey template of potentialquestions be prepared that will then need to be circulated among a wide range of interestgroups, educators, and experts for commentary and feedback on content and substance.At a later stage, the draft Canadian Knowledge Survey itself would need to be carefullydesigned and tested—potentially by Statistics Canada’s Social Survey MethodsDivision—before it is ready for administration. However, we are certain that thisinitiative would fill critical existing data gaps and contribute to Statistics Canada’sreputation as one of the world’s best and most innovative statistical agencies. We are alsoconfident that such a survey would provide the country, as well as policy makers, withvital information required to improve Canadian learning processes and educationalsystems, and thereby to enhance the wellbeing and prosperity of Canadians.
GENUINE PROGRESS INDEX Measuring Sustainable Development75
4.7 Recommended comprehensive indicators for the educationindicators report
Accompanying this summary report is a comprehensive list of potential indicators thatprovides examples of the types of indicators recommended to create a broader and moremeaningful assessment of knowledge and learning in the populace than is presentlypossible. For most of these indicators, data do not presently exist, and new data sourceswill need to be developed as explored by GPIAtlantic. The attached indicator list (seeAppendix) is based on the GPI education component framework described above insection 1.3, and it illustrates a potential ideal and comprehensive education indicator setthat could effectively indicate levels of lifelong / life-wide learning in the populace if datawere available.
GENUINE PROGRESS INDEX Measuring Sustainable Development76
ENDNOTES
1 United Nations Educational, Scientific, and Cultural Organization (UNESCO). Un Decade of Educationfor Sustainable Development 2005-2014. International Implementation Scheme (Draft), UNESCO, 2005;accessed April 2005; available fromhttp://portal.unesco.org/education/admin/ev.php?URL_ID=36026&URL_DO=DO_TOPIC&URL_SECTION=201&reload=1099410445.2 Organisation for Economic Co-operation and Development (OECD). Lifelong Learning for All, Paris:OECD, 1996.3 Cartwright, Fernando, Jerry Mussio, and Chris Boughton. Developing the Composite Learning Index. AFramework, Canadian Council on Learning (CCL), 2006; accessed February 2006; available fromhttp://www.ccl-cca.ca/NR/rdonlyres/EC1499F7-2767-4D8E-AB17-B8DEC36C2FAD/0/CLI_Framework.pdf.4 Huget, Stacey. What Is an Educated Canadian?, Final Report of the Leaders' Forum held in Vancouver,B.C. on February 25-27, 2004, Toronto: Canadian Education Association, 2004.5 Wiens, John R., and David Coulter. "What Is an Educated Canadian," Education Canada, 2005, vol. 45,no. 1: 21-23.6 United Nations Educational, Scientific, and Cultural Organization (UNESCO). Educating for aSustainable Future: A Transdisciplinary Vision for Concerted Action, International Conference inThessaloniki, December 9-12, 1997, 1998; accessed March 2005; available fromhttp://unesdoc.unesco.org/images/0011/001106/110686eo.pdf. p. 18.7 Stewart, Douglas. "Purposes of Public Education: Philosophical Reflections." Education Canada,Canadian Education Association2005, 4-7.8 Ibid.9 Rychen, D.S., and L.H. Salganik. Definition and Selection of Competencies: Theoretical and ConceptualFoundations (Deseco). Summary of the Final Report: Key Competencies for a Successful Life and a Well-Functioning Society, Organisation for Co-operation and Development (OECD), 2003; accessed January2006; available from http://www.portal-stat.admin.ch/deseco/deseco_finalreport_summary.pdf. p. 2.10 Ibid., accessed. pp. 2–3.11 Ibid., accessed. p. 3.12 Formal education includes primary, secondary, and postsecondary schooling. Informal learning is theprocess of learning outside formal school settings: through friends, colleagues, or relatives; in a variety ofplaces, such as the workplace, community, library, cultural events, and home; through a variety ofactivities, including leisure (such as reading books or using the Internet) and physical activities. Nonformallearning includes taught courses or lectures that do not lead to a formal qualification in the educationalsystem. It can refer to courses taken for personal interest to enrich one’s life or to courses taken to upgradeskills or otherwise contribute to employment-related initiatives.13 McMurtry, John, Professor of Philosophy, University of Guelph, personal communication with KarenHayward, reviewer comments, email correspondence, July 27 and August 23, 2006..14 Ibid., personal communication,15 Special Study Panel on Education Indicators. Education Counts: An Indicator System to Monitor theNation's Educational Health, Washington, D.C.: National Centre for Education Statistics, 1991.16 Ibid.17 Bowers, C. A. Mindful Conservatism: Rethinking the Ideological and Educational Basis of an EcologicalSustainable Future, New York: Rowman & Littlefield Publishers, Inc., 2003.18 Delors, Jacques. Learning: The Treasure Within. Report to Unesco of the International Commission onEducation for the Twenty-First Century, Paris: UNESCO, 1996.19 Center for Ecoliteracy. Competencies, Center for Ecoliteracy, 2005; accessed February 2005; availablefrom http://www.ecoliteracy.org/education/competencies.html.
GENUINE PROGRESS INDEX Measuring Sustainable Development77
20 United Nations Educational, Scientific, and Cultural Organization (UNESCO). Education for SustainableDevelopment: United Nations Decade (2005-2014), 2005; accessed March 2005; available fromhttp://portal.unesco.org/education/en/ev.php-URL_ID=27542&URL_DO=DO_TOPIC&URL_SECTION=201.html.21 In addition to the education component, the other GPI components include: sustainable transportation,energy, population health, solid waste, forests, soils and agriculture, air quality, water quality, work time,crime, income distribution, ecological footprint, fisheries and marine environment, civic and voluntarywork, leisure time, unpaid housework and childcare, debt and assets, economic security index, andgreenhouse gas emissions. For more information on these including reports please refer tohttp://www.gpiatlantic.org.22 Maxwell, Nicholas. Do We Need an Academic Revolution, University of London, n.d.; accessed February2005; available from http://www.the-rathouse.com/maxacadrev.html.23 Bassett, Caroline. "Wisdom in Three Acts: Using Transformative Learning to Teach for Wisdom." Paperpresented at the Sixth International Transformative Learning Conference, Michigan State University, Oct.6-9, 2005; accessed April 2006; available from http://www.wisdominst.org/WisdomInThreeActs.doc.24 Orr, David. W. Ecological Literacy. Education and the Transition to a Postmodern World, Albany: StateUniversity of New York Press, 1992.25 Ibid.26 Capra, Fritjof. Ecoliteracy: The Challenge for Education in the Next Century, Schumacher Lecture,Center for Ecoliteracy, 1999; accessed August 2004; available fromhttp://www.ecoliteracy.org/pages/publications.27 For example, McAllister Opinion Research conducts the Environmental Monitor, “Canada’s longestrunning nationally syndicated poll on environmental and sustainability issues.” (Hoggan, James. GlobePresentation: Communicating Sustainability, Vancouver, James Hoggan and Associates, Inc., 2006;accessed May 2006; available fromhttp://www.hoggan.com/pdf/Hoggan_sustainability_presentation_GLOBE.pdf. p. 3. The 17-year databaseis accessible only to clients through a $15,500 yearly subscription and an agreement to keep the dataconfidential. (McAllister Opinion Research. Environmental Monitor Subscription, Vancouver, 2006;accessed May 2006; available from http://www.mcallister-research.com/EMSF2006-1.pdf.) EnvironicsResearch Group produces a number of research reports including the new Canadian EnvironmentalBarometer, a monthly syndicated research study providing ongoing public opinion poll results on climatechange and the environment, which is also available for a substantial fee.28 Statistics Canada. Class of 2000: How Are They Faring Two Years Later?, Statistics Canada, 2004;accessed August 2006; available from http://www.statcan.ca/english/freepub/81-004-XIE/200406/ngs.htm.These figures exclude graduates who have pursued Masters or Doctorate degrees.29 Maritime Provinces Higher Education Commission. 2008. Intentions of Maritime University StudentsFollowing Graduation: A Survey of the Class of 2007. Executive Summary. Available fromhttp://www2.mphec.ca/english/pdfs/Intentions2007En.pdf30 Maritime Provinces Higher Education Commission. 2007. 2005 Survey of 2003 Maritime UniversityGraduates: Selected Provincial Statistics. MPHEC. Available fromhttp://www2.mphec.ca/english/pdfs/GFU2003in2005ProvEng.pdf. Table 1.11a. Data are for all graduatesand refer to the average amount borrowed from all sources for the 2003 degree, post-2003 education, orboth, by province of graduation. Unfortunately, no time series pan-Canadian data are available forcombined public and private debt loads, and therefore provincial comparisons outside the Maritimes are notcurrently possible.31 EKOS Research Associates. Investing in Their Future. A Survey of Student and Parental Support forLearning, Ottawa: Human Resources and Social Development Canada, Canada Millennium ScholarshipFoundation, and Council of Ministers of Education, Canada, 2006. pp. 55-56.32 GPI Atlantic’s Debt Report is authored by Kim Tran and Ronald Colman and will be released in 2008.Data for levels of student debt are assessed at the household level and are from Statistics Canada’s Surveysof Financial Security.33 Canadian Education Statistics Council. Education Indicators in Canada: Report of the Pan-CanadianEducation Indicators Program, 2005, Ottawa, 2006. Canadian Education Statistics Council. EducationIndicators in Canada: Report of the Pan-Canadian Education Indicators Program, 2003, Ottawa:Statistics Canada, and Council of Ministers of Education, Canada, 2003.
GENUINE PROGRESS INDEX Measuring Sustainable Development78
34 The data on debt repayment for 1995 provided in the most recent 2006 PCEIP report do not match thedata on debt repayment for the same year provided in the 2003 PCEIP report. Therefore, only data from themost recent (2006) report are used here.35 Nova Scotia Department of Education. Media Release. October 18, 2007. N.S. Tuition Decreasing,StatsCan Report Shows. Available from http://www.gov.ns.ca/news/details.asp?id=2007101800436 Ibid.37 Cited in Brian Flinn. Fees could negate tuition cuts, students warn. Halifax Daily News. January 29,2008. Available from http://halifax.metronews.ca/index.cfm?sid=103037&sc=8938 Statistics Canada. The Daily. University Tuition Fees, 2007/2008. Thursday, October 18, 2007. Availablefrom http://www.statcan.ca/Daily/English/071018/d071018b.htm39 Maritime Provinces Higher Education Council. Trends in Maritime Higher Education. Surveying theEnrolment Landscape: Factors and Trends in Maritime University Enrolment 2000-2001 to 2006-2007.Volume 5, no. 1. June, 2007. Available from http://www2.mphec.ca/english/pdfs/TrendsSurveyingen.pdf
40 Carriere, Gisele. "Weekly Work Hours and Health-Related Behaviours in Full-Time Students," HealthReports, 2005, vol. Vol. 16, no. 4: 11-21.41 Statistics Canada, Labour Force Survey, 1976-2006.42 Ibid.43 EKOS Research Associates. Investing in Their Future. A Survey of Student and Parental Support forLearning.44 Blouin, Patric and Marie-Josee Courchesne. 2007. Research Paper: Summary Public School Indicatorsfor the Provinces and Territories, 1998/1999 to 2004/2005. Statistics Canada. Ottawa; Statistics Canada,The Daily, July 28, 2000. School board revenues and expenditures, 1993–1997. Accessed December, 2004.45 Statistical summaries for education are available from the Nova Scotia Department of Education athttp://stats-summary.ednet.ns.ca. Class size data for 2005/2006 can be found at http://stats-summary.ednet.ns.ca/publicat.shtml. Data availability confirmed by Ted Vaughn, Statistics and DataManagement, Nova Scotia Department of Education, personal communication, August 30, 2007.46 Canadian Education Statistics Council. Education Indicators in Canada: Report of the Pan-CanadianEducation Indicators Program, 2003. p. 127.47 McMurtry, John. "Education and the Market Model," Journal of Philosophy of Education, 1991, vol. 25,no. 2: 209-217. p. 214.48 Dufay, Larry, Senior Research Officer, Canadian Assocation of University Teachers (Caut), personalcommunication with Linda Pannozzo, September 14, 2006..49 Statistics Canada. Building on Our Competencies: Canadian Results of the International Adult Literacyand Skills Survey, 2003, Statistics Canada, Catalogue no. 89-617-XIE, and Human Resources and SocialDevelopment Canada, 2005; accessed January 2006; available from http://www.statcan.ca/cgi-bin/downpub/listpub.cgi?catno=89-617-XIE2005001. Ottawa. Statistics Canada catalogue no. 89-617-XIE,and Human Resources and Social Development Canada. 2005. p. 13.50 Organisation for Economic Co-operation and Development (OECD). Literacy in the Information Age:Final Report of the International Adult Literacy Survey, OECD and Statistics Canada, 2000; accessedJanuary 2005; available fromhttp://www.oecd.org/LongAbstract/0,2546,en_2649_34509_1897266_119699_1_1_1,00.html., p. 16.51 Statistics Canada. Building on Our Competencies: Canadian Results of the International Adult Literacyand Skills Survey, 2003, accessed. p. 26.52 People at level 1 (score 0–225), for example, would have a hard time understanding how to followdirections in a cookbook or on a prescription, or how to follow maps. Those at level 2 (score 226–275)would be able to read simple texts but would have difficulty with job applications or bank deposit slips, andwould have trouble learning new job skills. Level 3 (score 276–325) is the “desired threshold,” or the“minimum for persons to understand and use information contained in the increasingly difficult texts thatcharacterize the emerging knowledge society and information economy.” Individuals with a proficiency atlevel 4 or 5 (scores of 326–375 or 376–500, respectively) in prose and document literacies are able to makecomplex and high-level inferences, and use specialized and complex information.53 In 1994 data for Nova Scotia are not available, as the province did not pay to increase the sample to beable to provide provincial output. The only Atlantic province that did so was New Brunswick. Therefore,comparisons between 1994 and 2003 can only be made at the regional level.
GENUINE PROGRESS INDEX Measuring Sustainable Development79
54 Despite the major differences in definition and method, Statistics Canada did attempt an approximatecomparison between the 1989 Literacy Skills Used in Daily Activities (LSUDA) survey and the 1994 IALSresults, and also found that the basic literacy profile of Canadians had actually changed little over thatearlier 5-year period, attributing this stability to the “social and economic determinants at play.” StatisticsCanada. Reading the Future: A Portrait of Literacy in Canada, Catalogue no. 89-551-XPE, Ottawa:Minister of Industry, 1996.55 ________. "International Adult Literacy and Skills Survey." The Daily, Nov 9, 2005, accessed November2005; http://www.statcan.ca:80/Daily/English/051109/d051109a.htm, andhttp://www.statcan.ca:80/Daily/English/051130/d051130b.htm. p. 3.56 Canadian Council on Learning (CCL). Press Release: Low Literacy Rate, CCL, 2005; accessed May2006; available from http://www.ccl-cca.ca/CCL/Newsroom/Releases/11May05-Literacy.htm.57 Milner, Henry. "Civic Literacy: How Informed Citizens Make Democracy Work." Paper presented at theConference of the Society for the Advancement of Socioeconomics (SASE), Amsterdam, June, 2001;accessed July 2005; available from http://www.sase.org/conf2001/papers/milner_henry.pdf. pp. 2–3.58 ________. "Compétences Civiques, Croissance Économique Et Redistribution Sociale." Policy Options,April, 2004, 73-78. (abstract)59 ________. "Informed Citizenship: Canada in a Comparative Context," Canadian Diversity, 2003, vol. 2,no. 1. p. 5.60 Delli Carpini, Michael X. "In Search of the Informed Citizen: What Americans Know About Politics andWhy It Matters." Paper presented at the Transformation of Civic Life Conference, Middle Tennessee StateUniversity, Murfreesboro and Nashville, Tennessee, November 12-13, 1999; accessed July 2005; availablefrom http://www.mtsu.edu/~seig/paper_m_carpini.html.61 Ibid.62 Howe, Paul. "Political Knowledge and Electoral Participation in the Netherlands: Comparisons with theCanadian Case." Paper presented at the Annual conference of the Canadian Political Science Association,Winnipeg, June 3-5, 2004; accessed July 2005; available from http://www.cpsa-acsp.ca/template_e.cfm?folder=conference&page_name=agm-papers-2004.htm#h. p. 3.63 Many of the CES questions are similar in each survey and include questions pertaining to politicalknowledge, voting behaviour and other political participation, opinions on government performance andleaders, motivation and interest in political issues, and opinions on a wide variety of social, economic, andpolitical topics. The CES basic knowledge questions are quite limited and include the names of politicalparty leaders, the name of the respondent’s provincial premier, and knowledge of party positions. The data,however, are not consistent from survey to survey, since questions are time-sensitive and wordeddifferently in different surveys, and some questions are relevant only to particular elections.64 Howe. "Political Knowledge and Electoral Participation in the Netherlands: Comparisons with theCanadian Case." p. 5.65 Ibid. See pages 4 to 5 for a detailed explanation of the methodology used.66 Metiri Group. Cultural Literacy, Metiri Group in co-operation with North Central EducationalLaboratory (NCREL), 2001; accessed August 2005; available from http://www.metiri.com. p. 1.67 Saskatchewan Education. Multicultural Education: A Policy Document, Multicultural and HeritageLanguage Education Policies. Saskatchewan Education, 1994; accessed October 2005; available fromhttp://www.sasked.gov.sk.ca/docs/policy/multi/index.html.68 Canadian Heritage. Canadian Diversity: Respecting Our Differences, Department of Canadian Heritage,2004; accessed October 2005; available from http://www.pch.gc.ca/progs/multi/respect_e.cfm.69 Metiri Group. Cultural Literacy, accessed. pp. 1–2.70 Norris, Mary Jane, and Lorna Jantzen. From Generation to Generation: Survival and Maintenance ofCanada's Aboriginal Languages within Families, Communities and Cities: Why Is Language Important?,Indian and Northern Affairs Canada, 2004; accessed August 2005; available from http://www.ainc-inac.gc.ca/pr/ra/fgg/wili_e.html. p. 9.71 Statistics Canada. 2001 Census: Analysis Series: Profile of Languages in Canada: English, French andMany Others, Catalogue no. 96F0030XIE2001005, 2002; accessed October 2006; available fromhttp://www12.statcan.ca/english/census01/Products/Analytic/companion/lang/pdf/96F0030XIE2001005.pdf.
GENUINE PROGRESS INDEX Measuring Sustainable Development80
72 Language data from the 2006 Census will not be released until December 2007, and therefore cannot beincluded here. ________. Census 2006. Release Topics and Dates, 2007; accessed April 2007; availablefrom http://www12.statcan.ca/english/census06/release/index.cfm.73 ________. Population by Sex and Age Group, by Province and Territory, CANSIM, table 051-0001,2006; accessed April 2007; available from http://www40.statcan.ca/l01/cst01/demo31a.htm.74 ________. 2001 Census: Analysis Series: Profile of Languages in Canada: English, French and ManyOthers, accessed. The top five non-official languages spoken at home are Chinese (Mandarin andCantonese), Italian, German, Spanish, and Punjabi, in that order; the languages having the strongest growthare Punjabi, Arabic, and Tagalog (Philippines).75 Orr. Ecological Literacy. Education and the Transition to a Postmodern World.76 United Nations Educational. Educating for a Sustainable Future: A Transdisciplinary Vision forConcerted Action, accessed. p. 18.77 Environmental Education Ontario (EEON). Greening the Way Ontario Learns: A Public Strategic Planfor Environmental and Sustainability Education, 2003; accessed January 2006; available fromhttp://www.eeon.org/plan/index.html.78 International Social Survey Programme (ISSP). Website: General Information, ISSP, 2007; accessedMay 2007; available from http://www.issp.org/.79 According to Philip Gendal et al., of Massey University in New Zealand, it is possible to determinerespondents’ level of knowledge from these opinions.80 Smith, Tom W. Environmental and Scientific, GSS [General Social Survey] Cross-national Report. No.16. Chicago, 1996. cited in National Science Foundation (NSF). Science and Engineering Indicators.Science and Technology: Public Attitudes and Public Understanding, NSF. Chapter 7, 1996; accessed May2007; available from http://www.nsf.gov/statistics/seind96/chap_7.pdf. pp. 7–12.81 National Science Foundation (NSF). Science and Engineering Indicators. Science and Technology:Public Attitudes and Public Understanding, accessed.82 World Wildlife Fund–Canada, Canadian Living Planet Report, 2007. Available fromhttp://www.wwf.ca/LivingPlanet/livingplanet_report.asp. Accessed January 24, 2008. Data for averageCanadian ecological footprint are for 2003.83 Orr. Ecological Literacy. Education and the Transition to a Postmodern World. p. 9.84 Estimates developed by Hans Messinger (HFM Consulting), former Director of Industry Measures andAnalysis at Statistics Canada, are based on source data from Statistics Canada’s Social Policy SimulationDatabase, National Accounts Analytical Studies Branch, and Global Footprint Network / InternationalInstitute for Sustainable Development data for the National Ecological Footprint and Biocapacity Accounts,2005 edition. The ecological Footprints by education illustrate the global hectares consumed per person forthe individual with the highest income in each household disaggregated by that person’s level of formaleducational attainment. Global hectares is an area weighted by productivity or “the amount of biologicalmaterial useful to humans that is generated in a given area.” (Global Footprint Network, Footprint TermGlossary, 2007; accessed August 2007; available fromhttp://www.footprintnetwork.org/gfn_sub.php?content=glossary.)85 Centre for Ecoliteracy. Education for Sustainability: Competencies, 2006; accessed December 2006;available from http://www.ecoliteracy.org/education/competencies.html.86 Statistical summaries for education are available from the Nova Scotia Department of Education athttp://stats-summary.ednet.ns.ca. Class size data for 2005/2006 can be found at http://stats-summary.ednet.ns.ca/publicat.shtml. Data availability confirmed by Ted Vaughn, Statistics and DataManagement, Nova Scotia Department of Education, personal communication, August 30, 2007.87 Maritime Provinces Educational Foundation report cited in LeBlanc, J. Clarence. Educating Canadiansfor the New Economy, Moncton: Canadian Institute for Research and Regional Development. University ofMoncton, 1994. p. 47.88 Fain, Stephen M., Martha Barantovick, and Raquel Martin. "The Aims of Education in an Age of Stasisand Change," in Encyclopedia of Social Sciences and Humanities: Education for Sustainability inEncyclopedia of Life Support Systems (Eolss), ed. Farrell, Robert V. and George Papagiannis. Oxford,U.K.: Developed under the Auspices of the UNESCO, EOLSS Publishers, 2004, accessed June 2005;http://www.eolss.net/eolss_samplechapters_C04.aspx. p. 5.89 United Nations Educational. Un Decade of Education for Sustainable Development 2005-2014.International Implementation Scheme (Draft), accessed.
GENUINE PROGRESS INDEX Measuring Sustainable Development81
90 U.N. Ministerial Round Table on Quality Education cited in ________. Education for SustainableDevelopment: United Nations Decade (2005-2014), accessed.91 Poirier, Rheal, Secretary, Council of Atlantic Ministers of Education and Training, personalcommunication with Linda Pannozzo, telephone conversation, August 14, 2006.92 International Association for the Evaluation of Educational Achievement (IEA). Civic Education Study,IEA, 2005; accessed July 2005; available from http://www2.hu-berlin.de/empir_bf/iea_e.html.93 Torney-Purta, J., R. Lehmann, H. Oswald, and W. Schulz. Citizenship and Education in Twenty-EightCountries: Civic Knowledge and Engagement at Age Fourteen, Amsterdam: International Association forthe Evaluation of Educational Achievement (IEA), 2001.94 Gidengil, Elisabeth, André Blais, Richard Nadeau, and Neil Nevitte. Citizens, The Democratic AuditSeries, Vancouver: University of British Columbia Press, 2005. p. 41.95 Livingstone, Sonia, Elizabeth Van Couvering, and Nancy Thumim. Adult Media Literacy: A Review ofthe Research Literature, Department of Media and Communications, London School of Economics andPolitical Science; Ofcom (Office of Communications), 2005; accessed October 2005; available fromhttp://www.ofcom.org.uk/advice/media_literacy/medlitpub/medlitpubrss/?a=87101.96 U.K. Office of Communications (Ofcom). Media Literacy Audit. Report on Adult Media Literacy, 2006;accessed November 2006; available fromhttp://www.ofcom.org.uk/advice/media_literacy/medlitpub/medlitpubrss/medialit_audit/.97 Xiao, Chenyang, and Riley E. Dunlap. "Validating a Comprehensive Model of Environmental ConcernCross-Nationally: A U.S.-Canadian Comparison," Social Science Quarterly, 2007, vol. 88, no. 2: 471-493.98 Olofsson, Anna, and Susanna Öhman. "General Beliefs and Environmental Concern," Environment andBehavior, 2006, vol. 38, no. 6: 768-790.99 Leiserowitz, Anthony A., Robert W. Kates, and Thomas M. Parris. "Sustainability Values, Attitudes andBehaviors: A Review of Multinational and Global Trends," Annual Review of Environment and Resources,2006, vol. 31: 413-444. p. 418.100 ________. "Do Global Attitudes and Behaviors Support Sustainable Development?," Environment,2005, vol. 47, no. 9: 22-38.101 Alberta drop out rate is for 2002/2003 to 2004/2005 school year average.102 Council of Ministers of Education Canada (CMEC). Education Indicators in Canada: Report of thePan-Canadian Education Indicators Program, 2005, CMEC, Canadian Education Statistics Council,Statistics Canada, Catalogue no. 81-582-XIE, 2006; accessed January 2007; available fromhttp://www.statcan.ca/english/freepub/81-582-XIE/2006001/pdfdocs.htm. Table C4.6, p. 208.103 Organisation for Economic Co-operation and Development (OECD). School Factors Related to Qualityand Equity. Results from Pisa 2000, Paris: OECD, 2005.104 Critics include: Moll, Marita. Passing the Test. The False Promise of Standardized Testing, Ottawa:Canadian Centre for Policy Alternatives, 2004. In this analysis, the Canadian Centre for Policy Alternativeslists a number of variables that help to explain the link between socioeconomic status and studentachievement, as measured by test scores.; Corbett, Mike. The Learning Tower of Pisa, Canadian Centre forPolicy Alternatives, Nova Scotia Office, 2004; accessed January 4 2006; available fromhttp://www.policyalternatives.ca/index.cfm?act=news&do=Article&call=995&pA=AE5DAA5F&type=2.;Rowe, Kenneth J. Assessment, Performance Indicators, 'League Tables', 'Value-Added' Measures andSchool Effectiveness? Consider the Issues and 'Let's Get Real'!, Melbourne: Centre for AppliedEducational Research, University of Melbourne, 1999.; Linn, Robert L. "Educational Assessment:Expanded Expectations and Challenges," Educational Evaluation and Policy Analysis, vol. 15, no. 1, 1993:1-16.105 Saul, John Ralston, In Defence of Public Education, Speech given to the Canadian Teachers’ Federation,Whitehorse, Yukon, 2001.106 Canadian Teachers' Federation. News Release: National Survey Reveals Trend of Commercialism andFundraising Schemes in Canadian Schools, Ottawa: Canadian Teachers' Federation, July 15, 2005.Unpublished summary was provided by CTF researcher Bernie Froese-Germain in a personalcommunication of September 16, 2005, prior to the release of the full CTF report in spring 2006. Thesurvey and report were joint initiatives of CTF, CCPA, and CSQ. All data are for the 2003/2004 schoolyear.
GENUINE PROGRESS INDEX Measuring Sustainable Development82
107 Saul, John Ralston. In Defence of Public Education, Speech given to the Canadian Teachers' Federation,Whitehorse, Yukon, 2001; accessed October 13 2005; available fromhttp://www.gg.ca/media/doc.asp?lang=e&DocID=1366.108 Giroux, Henry A. "Youth, Higher Education, and the Crisis of Public Time: Educated Hope and thePossibility of a Democratic Future," Social Identities, 2003, vol. 9, no. 2: 141-168. p. 147. Giroux'sresearch focuses mainly on higher education; however, much of it is also relevant to the public schoolsystem.109 Canadian Teachers' Federation. Commercialism in Canadian Schools: Who's Calling the Shots?,Canadian Teachers' Federation, Canadian Centre for Policy Alternatives and the Federation des syndicatsde l'enseignement, 2006; accessed September 2006; available from http://www.policyalternatives.ca.;Toronto Parent Network. Tracking Publicly Funded Education: The Fifth Report: Toronto Highlights,Toronto Parent Network, 2002; accessed December 2005; available from http://torontoparent.tripod.ca.;British Columbia Society for Public Education. Vancouver Secondary Schools Tracking Survey, 2004-2005, BC Society for Public Education, 2005; accessed November 2006; available fromhttp://www.bcspe.ca/assets/BCSPE%20Tracking%20Survey2005.pdf.; and Saul. In Defence of PublicEducation, accessed.110 Statistics Canada. Intellectual Property Commercialization in the Higher Education Sector, 2001, 2003;accessed 2005 July; available from http://www.statcan.ca/Daily/English/031020/d031020d.htm.; StatisticsCanada. "Commercializing the Results of Research in Canadian Universities and Hospitals: An Update for2004." Innovation Analysis Bulletin2006, accessed January 2007;http://www.statcan.ca/english/freepub/88-003-XIE/88-003-XIE2006003.pdf.111 Statistics Canada. "Commercializing the Results of Research in Canadian Universities and Hospitals:An Update for 2004." p. 14.112 Canadian Education Statistics Council. Education Indicators in Canada: Report of the Pan-CanadianEducation Indicators Program, 2003. Table D4.9.113 Statistics Canada. "Commercializing the Results of Research in Canadian Universities and Hospitals:An Update for 2004."114 McMurtry, John, Professor of Philosophy, University of Guelph, personal communication with LindaPannozzo, reviewer comments, email correspondence, September 25, 2006 and January 5, 2007..115 Gidengil, Blais, Nadeau, and Nevitte. Citizens.116 Howe, Paul. Electoral Participation and the Knowledge Deficit, Elections Canada. Electoral Insight,2003; accessed July 2005; available fromhttp://www.elections.ca/eca/eim/article_search/article.asp?id=50&lang=e&frmPageSize=&textonly=false.117 Ibid., accessed. p. 3.118 Masterman, Len. "The Media Education Revolution," Canadian Journal of EducationalCommunication, 1993, vol. 22, no. 1: 5-14. pp. 11–12.119 Livingstone, Couvering, and Thumim. Adult Media Literacy: A Review of the Research Literature,accessed. p. 3.120 Quin, Robyn, and Barrie McMahon. Groundbreaking Assessment from Australia, Media LiteracyReview, Media Literacy Online Project, University of Oregon, 1994; accessed October 2005; availablefrom http://interact.uoregon.edu/MediaLit/mlr/readings/articles/standard.html. p. 2.121 Canadian Council on Learning (CCL). State of Learning in Canada: No Time for Complacency, 2007;accessed January 2007; available from http://www.ccl-cca.ca/NR/rdonlyres/5ECAA2E9-D5E4-43B9-94E4-84D6D31BC5BC/0/NewSOLR_Report.pdf.122 Brewster, Christopher, Hugh Glaser, and Barny Haughton. Aktive [Advanced Knowledge Technologies]Food: Semantic Web Based Knowledge Conduits for the Organic Food Industry, U.K. Engineering andPhysical Sciences Research Council, 2005; accessed January 2007; available fromhttp://eprints.ecs.soton.ac.uk/11565/01/Brewster_SWCASE.pdf.123 Saskatchewan Agriculture and Food. Organics: Overview, 2005; accessed April 2007; available fromhttp://www.agr.gov.sk.ca/docs/organics/OrganicsSector.asp.124 Alberta Agriculture, Food and Rural Development. Organic Consumer Profile, 2001; accessed January2007; available from http://www.biorganic.ca/articles/Organic_Consumer_Profile.pdf. pp. 4, 7.125 Canadian Council of Food and Nutrition (CCFN). Tracking Nutrition Trends Vi, Woodbridge, Ontario:Canadian Council of Food and Nutrition (Previously the National Institute of Nutrition), 2006.126 Ibid.
GENUINE PROGRESS INDEX Measuring Sustainable Development83
127 Dei, George J. Sefa, Budd L. Hall, and Dorothy Goldin-Rosenberg. "Introduction," in IndigenousKnowledges in Global Contexts: Multiple Readings of Our World, ed. Dei, G.J.S., B. Hall and D. Goldin-Rosenberg, 3-17. Toronto: University of Toronto Press, 1999.128 Taylor, Eli, quoted in Brockman, Aggie. When All Peoples Have the Same Story, Humans Will Cease toExist: Protecting and Conserving Traditional Knowledge: A Report for the Biodiversity Convention Office,Dene Cultural Institute, 1997; accessed December 2005; available fromhttp://www.nativemaps.org/abstracts/all_peoples.pdf. cited in Hunter, Anna. Traditional and WesternSystems of Knowledge, University of Saskatchewan, 2002; accessed January 2006; available fromhttp://uarctic.org/bcs/BCS100/index.htm. p. 6.129 Battiste, Marie. Indigenous Knowledge and Pedagogy in First Nations Education: A Literature Reviewwith Recommendations, National Working Group on Education and the Minister of Indian Affairs, Indianand Northern Affairs Canada (INAC), 2002; accessed January 2006; available from http://www.ainc-inac.gc.ca/pr/pub/krw/ikp_e.html. p. 2.130 Canada Council for the Arts (CCA). Overview of Key Demographic Trends - Possible Impact onCanadian Arts Attendance, The Canada Council for the Arts, 2002; accessed August 2005; available fromhttp://www.canadacouncil.ca/NR/rdonlyres/7ABE4A9B-798B-4262-8AFF-FD45E9A5089A/0/demographse.pdf. p. 21.131 United Nations Educational, Scientific, and Cultural Organization (UNESCO), ed. Atlas of the World'sLanguages in Danger of Disappearing, Edited by Wurm, Stephen A. Paris / Canberra, UNESCOPublishing / Pacific Linguistics, 1996. cited in Norris, and Jantzen. From Generation to Generation:Survival and Maintenance of Canada's Aboriginal Languages within Families, Communities and Cities:Why Is Language Important?, accessed.132 O'Donnell, Vivian, and Heather Tait. Aboriginal Peoples Survey 2001–Initial Findings: Well-Being ofthe Non-Reserve Aboriginal Population, Statistics Canada, Catalogue no. 89-589-XIE, 2003; accessedNovember 2006; available from http://www.statcan.ca/english/freepub/89-589-XIE/89-589-XIE2003001.pdf.133 The 2006 Aboriginal language data for both the Aboriginal People’s Survey (APS) and the 2006 Censuswill not be available until January 2008. Statistics Canada. Census 2006. Release Topics and Dates,accessed.134 O'Donnell, and Tait. Aboriginal Peoples Survey 2001–Initial Findings: Well-Being of the Non-ReserveAboriginal Population, accessed.135 Berger, Thomas. Conciliator's Final Report: Nunavut Land Claims Agreement Implementation PlanningContract Negotiations for the Second Planning Period, Indian and Northern Affairs Canada, 2006;accessed April 2007; available from http://www.ainc-inac.gc.ca/pr/agr/nu/lca/index_e.html.136 Portrait of Aboriginal Children Living in Non-Reserve Areas: Results from the 2001 Aboriginal PeoplesSurvey. Statistics Canada, Catalogue no. 89-597-X1E, 2004; accessed November 2006; available fromhttp://130.15.161.74/webdoc/ssdc/cdbksnew/aps/aps2001portrait-children.pdf.137 Ibid., accessed. p. 20.138 Gidengil, Elisabeth, André Blais, Richard Nadeau, and Neil Nevitte. Citizens, The Democratic AuditSeries, Vancouver: University of British Columbia Press, 2005.139 Statistics Canada. Households and the Environment Survey: Detailed Information for 2006, 2006;accessed May 2007; available from http://www.statcan.ca/cgi-bin/imdb/p2SV.pl?Function=getSurvey&SDDS=3881&lang=en&db=IMDB&dbg=f&adm=8&dis=2.140 Angus Reid Strategies. News Release: Angus Reid Climate Change Survey: Rich and Educated LessLikely to Act Green, Today or Tomorrow, March 27, 2007; accessed May 2007; available fromhttp://www.angusreidstrategies.com/uploads/pages/pdfs/2007.03.27%20Enviro%20Behaviour%20Release.pdf.141 Ibid., accessed.142 Centre for Research and Information on Canada (CRIC). Portraits of Canada Survey (1997–2005),2005; accessed May 2006; available from http://www.cric.ca/.143 International Social Survey Program. Codebook, ZA Study 2450, ISSP 1993, Environment I, Cologne,Germany, Zentral archiv fur Empirische Sozialforschung, 1993; accessed May 2007; available fromhttp://www.za.uni-koeln.de/data/en/issp/codebooks/s2450cdb.pdf; and International Social SurveyProgram. Codebook, ZA Study 3440, ISSP 2000, Environment II, Cologne, Germany, Zentral archiv fur
GENUINE PROGRESS INDEX Measuring Sustainable Development84
Empirische Sozialforschung, 2000; accessed May 2007; available from http://www.za.uni-koeln.de/data/en/issp/codebooks/ZA3440cdb.pdf.144 Angus Reid Strategies. Public Release: Canadian's Trust Liberals over Tories on Climate ChangePolicy, April 10, 2007; accessed May 2007; available fromhttp://www.angusreidstrategies.com/uploads/pages/pdfs/2007.04.10%20Enviro%20Political%20Release.pdf.145 Hoggan, James. Globe Presentation: Communicating Sustainability, Vancouver, James Hoggan andAssociates, Inc., 2006; accessed May 2006; available fromhttp://www.hoggan.com/pdf/Hoggan_sustainability_presentation_GLOBE.pdf.146 Ardelt, M. "Antecedents and Effects of Wisdom in Old Age: A Longitudinal Perspective on AgingWell," Research on Aging, 2000, vol. 22, no. 4: 360-394. p. 360, cited in Bassett. "Wisdom in Three Acts:Using Transformative Learning to Teach for Wisdom." p. 1.147 Bassett. "Wisdom in Three Acts: Using Transformative Learning to Teach for Wisdom."148 Ibid.149 Heylighen, Francis. "What Is a World View?," in Principia Cybernetica Web, ed. Heylighen, F., C.Joslyn and V. Turchin. Brussels: Principia Cybernetica, accessed January 2005, available fromhttp://pespmc1.vub.ac.be/WORLVIEW.html, 2002.150 Colardyn, Danielle, and Jens Bjornavold. "Validation of Formal, Non-Formal and Informal Learning:Policy and Practices in E.U. Member States," European Journal of Education, 2004, vol. 39, no. 1: 69-89.
GENUINE PROGRESS INDEX Measuring Sustainable Development85
REFERENCES
Alberta Agriculture, Food and Rural Development. Organic Consumer Profile, 2001;accessed January 2007; available fromhttp://www.biorganic.ca/articles/Organic_Consumer_Profile.pdf.
Angus Reid Strategies. News Release: Angus Reid Climate Change Survey: Rich andEducated Less Likely to Act Green, Today or Tomorrow, March 27, 2007; accessed May2007; available fromhttp://www.angusreidstrategies.com/uploads/pages/pdfs/2007.03.27%20Enviro%20Behaviour%20Release.pdf.
Ardelt, M. "Antecedents and Effects of Wisdom in Old Age: A Longitudinal Perspectiveon Aging Well," Research on Aging, 2000, vol. 22, no. 4: 360-394.
Bassett, Caroline. "Wisdom in Three Acts: Using Transformative Learning to Teach forWisdom." Paper presented at the Sixth International Transformative LearningConference, Michigan State University, Oct. 6-9, 2005; accessed April 2006; availablefrom http://www.wisdominst.org/WisdomInThreeActs.doc.
Battiste, Marie. Indigenous Knowledge and Pedagogy in First Nations Education: ALiterature Review with Recommendations, National Working Group on Education andthe Minister of Indian Affairs, Indian and Northern Affairs Canada (INAC), 2002;accessed January 2006; available from http://www.ainc-inac.gc.ca/pr/pub/krw/ikp_e.html.
Berger, Thomas. Conciliator's Final Report: Nunavut Land Claims AgreementImplementation Planning Contract Negotiations for the Second Planning Period, Indianand Northern Affairs Canada, 2006; accessed April 2007; available fromhttp://www.ainc-inac.gc.ca/pr/agr/nu/lca/index_e.html.
Bowers, C. A. Mindful Conservatism: Rethinking the Ideological and Educational Basisof an Ecological Sustainable Future, New York: Rowman & Littlefield Publishers, Inc.,2003.
Brewster, Christopher, Hugh Glaser, and Barny Haughton. Aktive [Advanced KnowledgeTechnologies] Food: Semantic Web Based Knowledge Conduits for the Organic FoodIndustry, U.K. Engineering and Physical Sciences Research Council, 2005; accessedJanuary 2007; available fromhttp://eprints.ecs.soton.ac.uk/11565/01/Brewster_SWCASE.pdf.
GENUINE PROGRESS INDEX Measuring Sustainable Development86
British Columbia Society for Public Education. Vancouver Secondary Schools TrackingSurvey, 2004-2005, BC Society for Public Education, 2005; accessed November 2006;available from http://www.bcspe.ca/assets/BCSPE%20Tracking%20Survey2005.pdf.
Brockman, Aggie. When All Peoples Have the Same Story, Humans Will Cease to Exist:Protecting and Conserving Traditional Knowledge: A Report for the BiodiversityConvention Office, Dene Cultural Institute, 1997; accessed December 2005; availablefrom http://www.nativemaps.org/abstracts/all_peoples.pdf.
Canada Council for the Arts (CCA). Overview of Key Demographic Trends - PossibleImpact on Canadian Arts Attendance, The Canada Council for the Arts, 2002; accessedAugust 2005; available from http://www.canadacouncil.ca/NR/rdonlyres/7ABE4A9B-798B-4262-8AFF-FD45E9A5089A/0/demographse.pdf.
Canadian Council of Food and Nutrition (CCFN). Tracking Nutrition Trends Vi,Woodbridge, Ontario: Canadian Council of Food and Nutrition (Previously the NationalInstitute of Nutrition), 2006.
Canadian Council on Learning (CCL). Press Release: Low Literacy Rate, CCL, 2005;accessed May 2006; available from http://www.ccl-cca.ca/CCL/Newsroom/Releases/11May05-Literacy.htm.
________. State of Learning in Canada: No Time for Complacency, 2007; accessedJanuary 2007; available from http://www.ccl-cca.ca/NR/rdonlyres/5ECAA2E9-D5E4-43B9-94E4-84D6D31BC5BC/0/NewSOLR_Report.pdf.
Canadian Education Statistics Council. Education Indicators in Canada: Report of thePan-Canadian Education Indicators Program, 2003, Ottawa: Statistics Canada, andCouncil of Ministers of Education, Canada, 2003.
________. Education Indicators in Canada: Report of the Pan-Canadian EducationIndicators Program, 2005, Ottawa, 2006.
Canadian Heritage. Canadian Diversity: Respecting Our Differences, Department ofCanadian Heritage, 2004; accessed October 2005; available fromhttp://www.pch.gc.ca/progs/multi/respect_e.cfm.
Canadian Teachers' Federation. News Release: National Survey Reveals Trend ofCommercialism and Fundraising Schemes in Canadian Schools, Ottawa: CanadianTeachers' Federation, July 15, 2005.
________. Commercialism in Canadian Schools: Who's Calling the Shots?, CanadianTeachers' Federation, Canadian Centre for Policy Alternatives and the Federation dessyndicats de l'enseignement, 2006; accessed September 2006; available fromhttp://www.policyalternatives.ca.
GENUINE PROGRESS INDEX Measuring Sustainable Development87
Capra, Fritjof. Ecoliteracy: The Challenge for Education in the Next Century,Schumacher Lecture, Center for Ecoliteracy, 1999; accessed August 2004; available fromhttp://www.ecoliteracy.org/pages/publications.
Carriere, Gisele. "Weekly Work Hours and Health-Related Behaviours in Full-TimeStudents," Health Reports, 2005, vol. Vol. 16, no. 4: 11-21.
Cartwright, Fernando, Jerry Mussio, and Chris Boughton. Developing the CompositeLearning Index. A Framework, Canadian Council on Learning (CCL), 2006; accessedFebruary 2006; available from http://www.ccl-cca.ca/NR/rdonlyres/EC1499F7-2767-4D8E-AB17-B8DEC36C2FAD/0/CLI_Framework.pdf.
Center for Ecoliteracy. Competencies, Center for Ecoliteracy, 2005; accessed February2005; available from http://www.ecoliteracy.org/education/competencies.html.
Centre for Ecoliteracy. Education for Sustainability: Competencies, 2006; accessedDecember 2006; available from http://www.ecoliteracy.org/education/competencies.html.
Colardyn, Danielle, and Jens Bjornavold. "Validation of Formal, Non-Formal andInformal Learning: Policy and Practices in E.U. Member States," European Journal ofEducation, 2004, vol. 39, no. 1: 69-89.
Corbett, Mike. The Learning Tower of Pisa, Canadian Centre for Policy Alternatives,Nova Scotia Office, 2004; accessed January 4 2006; available fromhttp://www.policyalternatives.ca/index.cfm?act=news&do=Article&call=995&pA=AE5DAA5F&type=2.
Council of Ministers of Education Canada (CMEC). Education Indicators in Canada:Report of the Pan-Canadian Education Indicators Program, 2005, CMEC, CanadianEducation Statistics Council, Statistics Canada, Catalogue no. 81-582-XIE, 2006;accessed January 2007; available from http://www.statcan.ca/english/freepub/81-582-XIE/2006001/pdfdocs.htm.
Dei, George J. Sefa, Budd L. Hall, and Dorothy Goldin-Rosenberg. "Introduction," inIndigenous Knowledges in Global Contexts: Multiple Readings of Our World, ed. Dei,G.J.S., B. Hall and D. Goldin-Rosenberg, 3-17. Toronto: University of Toronto Press,1999.
Delli Carpini, Michael X. "In Search of the Informed Citizen: What Americans KnowAbout Politics and Why It Matters." Paper presented at the Transformation of Civic LifeConference, Middle Tennessee State University, Murfreesboro and Nashville, Tennessee,November 12-13, 1999; accessed July 2005; available fromhttp://www.mtsu.edu/~seig/paper_m_carpini.html.
GENUINE PROGRESS INDEX Measuring Sustainable Development88
Delors, Jacques. Learning: The Treasure Within. Report to Unesco of the InternationalCommission on Education for the Twenty-First Century, Paris: UNESCO, 1996.
Dufay, Larry, Senior Research Officer, Canadian Assocation of University Teachers(Caut), personal communication with Linda Pannozzo, September 14, 2006.
EKOS Research Associates. Investing in Their Future. A Survey of Student and ParentalSupport for Learning, Ottawa: Human Resources and Social Development Canada,Canada Millennium Scholarship Foundation, and Council of Ministers of Education,Canada, 2006.
Environmental Education Ontario (EEON). Greening the Way Ontario Learns: A PublicStrategic Plan for Environmental and Sustainability Education, 2003; accessed January2006; available from http://www.eeon.org/plan/index.html.
Fain, Stephen M., Martha Barantovick, and Raquel Martin. "The Aims of Education in anAge of Stasis and Change," in Encyclopedia of Social Sciences and Humanities:Education for Sustainability in Encyclopedia of Life Support Systems (Eolss), ed. Farrell,Robert V. and George Papagiannis. Oxford, U.K.: Developed under the Auspices of theUNESCO, EOLSS Publishers, 2004, accessed June 2005;http://www.eolss.net/eolss_samplechapters_C04.aspx.
Gidengil, Elisabeth, André Blais, Richard Nadeau, and Neil Nevitte. Citizens, TheDemocratic Audit Series, Vancouver: University of British Columbia Press, 2005.
Giroux, Henry A. "Youth, Higher Education, and the Crisis of Public Time: EducatedHope and the Possibility of a Democratic Future," Social Identities, 2003, vol. 9, no. 2:141-168.
Heylighen, Francis. "What Is a World View?," in Principia Cybernetica Web, ed.Heylighen, F., C. Joslyn and V. Turchin. Brussels: Principia Cybernetica, accessedJanuary 2005, available from http://pespmc1.vub.ac.be/WORLVIEW.html, 2002.
Howe, Paul. Electoral Participation and the Knowledge Deficit, Elections Canada.Electoral Insight, 2003; accessed July 2005; available fromhttp://www.elections.ca/eca/eim/article_search/article.asp?id=50&lang=e&frmPageSize=&textonly=false.
________. "Political Knowledge and Electoral Participation in the Netherlands:Comparisons with the Canadian Case." Paper presented at the Annual conference of theCanadian Political Science Association, Winnipeg, June 3-5, 2004; accessed July 2005;available from http://www.cpsa-acsp.ca/template_e.cfm?folder=conference&page_name=agm-papers-2004.htm#h.
GENUINE PROGRESS INDEX Measuring Sustainable Development89
Huget, Stacey. What Is an Educated Canadian?, Final Report of the Leaders' Forum heldin Vancouver, B.C. on February 25-27, 2004, Toronto: Canadian Education Association,2004.
Hunter, Anna. Traditional and Western Systems of Knowledge, University ofSaskatchewan, 2002; accessed January 2006; available fromhttp://uarctic.org/bcs/BCS100/index.htm.
International Association for the Evaluation of Educational Achievement (IEA). CivicEducation Study, IEA, 2005; accessed July 2005; available from http://www2.hu-berlin.de/empir_bf/iea_e.html.
International Social Survey Programme (ISSP). Website: General Information, ISSP,2007; accessed May 2007; available from http://www.issp.org/.
LeBlanc, J. Clarence. Educating Canadians for the New Economy, Moncton: CanadianInstitute for Research and Regional Development. University of Moncton, 1994.
Leiserowitz, Anthony A., Robert W. Kates, and Thomas M. Parris. "Do Global Attitudesand Behaviors Support Sustainable Development?," Environment, 2005, vol. 47, no. 9:22-38.
________. "Sustainability Values, Attitudes and Behaviors: A Review of Multinationaland Global Trends," Annual Review of Environment and Resources, 2006, vol. 31: 413-444.
Livingstone, Sonia, Elizabeth Van Couvering, and Nancy Thumim. Adult MediaLiteracy: A Review of the Research Literature, Department of Media andCommunications, London School of Economics and Political Science; Ofcom (Office ofCommunications), 2005; accessed October 2005; available fromhttp://www.ofcom.org.uk/advice/media_literacy/medlitpub/medlitpubrss/?a=87101.
Masterman, Len. "The Media Education Revolution," Canadian Journal of EducationalCommunication, 1993, vol. 22, no. 1: 5-14.
Maxwell, Nicholas. Do We Need an Academic Revolution, University of London, n.d.;accessed February 2005; available from http://www.the-rathouse.com/maxacadrev.html.
McMurtry, John. "Education and the Market Model," Journal of Philosophy ofEducation, 1991, vol. 25, no. 2: 209-217.
________, Professor of Philosophy, University of Guelph, personal communication withKaren Hayward, reviewer comments, email correspondence, July 27 and August 23,2006.
GENUINE PROGRESS INDEX Measuring Sustainable Development90
________, Professor of Philosophy, University of Guelph, personal communication withLinda Pannozzo, reviewer comments, email correspondence, September 25, 2006 andJanuary 5, 2007.
Metiri Group. Cultural Literacy, Metiri Group in co-operation with North CentralEducational Laboratory (NCREL), 2001; accessed August 2005; available fromhttp://www.metiri.com.
Miller, John P. The Holistic Curriculum, Toronto: OISE Press, 1996.
Milner, Henry. "Civic Literacy: How Informed Citizens Make Democracy Work." Paperpresented at the Conference of the Society for the Advancement of Socioeconomics(SASE), Amsterdam, June, 2001; accessed July 2005; available fromhttp://www.sase.org/conf2001/papers/milner_henry.pdf.
________. "Informed Citizenship: Canada in a Comparative Context," CanadianDiversity, 2003, vol. 2, no. 1.
________. "Compétences Civiques, Croissance Économique Et Redistribution Sociale."Policy Options, April, 2004, 73-78.
Moll, Marita. Passing the Test. The False Promise of Standardized Testing, Ottawa:Canadian Centre for Policy Alternatives, 2004.
National Science Foundation (NSF). Science and Engineering Indicators. Science andTechnology: Public Attitudes and Public Understanding, NSF. Chapter 7, 1996; accessedMay 2007; available from http://www.nsf.gov/statistics/seind96/chap_7.pdf.
Norris, Mary Jane, and Lorna Jantzen. From Generation to Generation: Survival andMaintenance of Canada's Aboriginal Languages within Families, Communities andCities: Why Is Language Important?, Indian and Northern Affairs Canada, 2004;accessed August 2005; available from http://www.ainc-inac.gc.ca/pr/ra/fgg/wili_e.html.
O'Donnell, Vivian, and Heather Tait. Aboriginal Peoples Survey 2001–Initial Findings:Well-Being of the Non-Reserve Aboriginal Population, Statistics Canada, Catalogue no.89-589-XIE, 2003; accessed November 2006; available fromhttp://www.statcan.ca/english/freepub/89-589-XIE/89-589-XIE2003001.pdf.
Olofsson, Anna, and Susanna Öhman. "General Beliefs and Environmental Concern,"Environment and Behavior, 2006, vol. 38, no. 6: 768-790.
Organisation for Economic Co-operation and Development (OECD). Lifelong Learningfor All, Paris: OECD, 1996.
GENUINE PROGRESS INDEX Measuring Sustainable Development91
________. Literacy in the Information Age: Final Report of the International AdultLiteracy Survey, OECD and Statistics Canada, 2000; accessed January 2005; availablefromhttp://www.oecd.org/LongAbstract/0,2546,en_2649_34509_1897266_119699_1_1_1,00.html.
________. School Factors Related to Quality and Equity. Results from Pisa 2000, Paris:OECD, 2005.
Orr, David. W. Ecological Literacy. Education and the Transition to a PostmodernWorld, Albany: State University of New York Press, 1992.
Poirier, Rheal, Secretary, Council of Atlantic Ministers of Education and Training,personal communication with Linda Pannozzo, telephone conversation, August 14, 2006.
Portrait of Aboriginal Children Living in Non-Reserve Areas: Results from the 2001Aboriginal Peoples Survey. Statistics Canada, Catalogue no. 89-597-X1E, 2004; accessedNovember 2006; available fromhttp://130.15.161.74/webdoc/ssdc/cdbksnew/aps/aps2001portrait-children.pdf.
Quin, Robyn, and Barrie McMahon. Groundbreaking Assessment from Australia, MediaLiteracy Review, Media Literacy Online Project, University of Oregon, 1994; accessedOctober 2005; available fromhttp://interact.uoregon.edu/MediaLit/mlr/readings/articles/standard.html.
Rowe, Kenneth J. Assessment, Performance Indicators, 'League Tables', 'Value-Added'Measures and School Effectiveness? Consider the Issues and 'Let's Get Real'!,Melbourne: Centre for Applied Educational Research, University of Melbourne, 1999.
Rychen, D.S., and L.H. Salganik. Definition and Selection of Competencies: Theoreticaland Conceptual Foundations (Deseco). Summary of the Final Report: Key Competenciesfor a Successful Life and a Well-Functioning Society, Organisation for Co-operation andDevelopment (OECD), 2003; accessed January 2006; available from http://www.portal-stat.admin.ch/deseco/deseco_finalreport_summary.pdf.
Saskatchewan Agriculture and Food. Organics: Overview, 2005; accessed April 2007;available from http://www.agr.gov.sk.ca/docs/organics/OrganicsSector.asp.
Saskatchewan Education. Multicultural Education: A Policy Document, Multicultural andHeritage Language Education Policies. Saskatchewan Education, 1994; accessed October2005; available from http://www.sasked.gov.sk.ca/docs/policy/multi/index.html.
Saul, John Ralston. In Defence of Public Education, Speech given to the CanadianTeachers' Federation, Whitehorse, Yukon, 2001; accessed October 13 2005; availablefrom http://www.gg.ca/media/doc.asp?lang=e&DocID=1366.
GENUINE PROGRESS INDEX Measuring Sustainable Development92
Smith, Tom W. Environmental and Scientific, GSS [General Social Survey] Cross-national Report. No. 16. Chicago, 1996.
Special Study Panel on Education Indicators. Education Counts: An Indicator System toMonitor the Nation's Educational Health, Washington, D.C.: National Centre forEducation Statistics, 1991.
Statistics Canada. Reading the Future: A Portrait of Literacy in Canada, Catalogue no.89-551-XPE, Ottawa: Minister of Industry, 1996.
________. 2001 Census: Analysis Series: Profile of Languages in Canada: English,French and Many Others, Catalogue no. 96F0030XIE2001005, 2002; accessed October2006; available fromhttp://www12.statcan.ca/english/census01/Products/Analytic/companion/lang/pdf/96F0030XIE2001005.pdf.
________. Intellectual Property Commercialization in the Higher Education Sector,2001, 2003; accessed 2005 July; available fromhttp://www.statcan.ca/Daily/English/031020/d031020d.htm.
________. Class of 2000: How Are They Faring Two Years Later?, Statistics Canada,2004; accessed August 2006; available from http://www.statcan.ca/english/freepub/81-004-XIE/200406/ngs.htm.
________. Building on Our Competencies: Canadian Results of the International AdultLiteracy and Skills Survey, 2003, Statistics Canada, Catalogue no. 89-617-XIE, andHuman Resources and Social Development Canada, 2005; accessed January 2006;available from http://www.statcan.ca/cgi-bin/downpub/listpub.cgi?catno=89-617-XIE2005001.
________. "International Adult Literacy and Skills Survey." The Daily, Nov 9, 2005,accessed November 2005;http://www.statcan.ca:80/Daily/English/051109/d051109a.htm, andhttp://www.statcan.ca:80/Daily/English/051130/d051130b.htm.
________. "Commercializing the Results of Research in Canadian Universities andHospitals: An Update for 2004." Innovation Analysis Bulletin2006, accessed January2007; http://www.statcan.ca/english/freepub/88-003-XIE/88-003-XIE2006003.pdf.
________. Households and the Environment Survey: Detailed Information for 2006,2006; accessed May 2007; available from http://www.statcan.ca/cgi-bin/imdb/p2SV.pl?Function=getSurvey&SDDS=3881&lang=en&db=IMDB&dbg=f&adm=8&dis=2.
GENUINE PROGRESS INDEX Measuring Sustainable Development93
________. Population by Sex and Age Group, by Province and Territory, CANSIM, table051-0001, 2006; accessed April 2007; available fromhttp://www40.statcan.ca/l01/cst01/demo31a.htm.
________. Census 2006. Release Topics and Dates, 2007; accessed April 2007; availablefrom http://www12.statcan.ca/english/census06/release/index.cfm.
Stewart, Douglas. "Purposes of Public Education: Philosophical Reflections." EducationCanada, Canadian Education Association2005, 4-7.
Torney-Purta, J., R. Lehmann, H. Oswald, and W. Schulz. Citizenship and Education inTwenty-Eight Countries: Civic Knowledge and Engagement at Age Fourteen,Amsterdam: International Association for the Evaluation of Educational Achievement(IEA), 2001.
Toronto Parent Network. Tracking Publicly Funded Education: The Fifth Report:Toronto Highlights, Toronto Parent Network, 2002; accessed December 2005; availablefrom http://torontoparent.tripod.ca.
U.K. Office of Communications (Ofcom). Media Literacy Audit. Report on Adult MediaLiteracy, 2006; accessed November 2006; available fromhttp://www.ofcom.org.uk/advice/media_literacy/medlitpub/medlitpubrss/medialit_audit/.
United Nations Educational, Scientific, and Cultural Organization (UNESCO). Educatingfor a Sustainable Future: A Transdisciplinary Vision for Concerted Action, InternationalConference in Thessaloniki, December 9-12, 1997, 1998; accessed March 2005;available from http://unesdoc.unesco.org/images/0011/001106/110686eo.pdf.
________. Education for Sustainable Development: United Nations Decade (2005-2014),2005; accessed March 2005; available from http://portal.unesco.org/education/en/ev.php-URL_ID=27542&URL_DO=DO_TOPIC&URL_SECTION=201.html.
________. Un Decade of Education for Sustainable Development 2005-2014.International Implementation Scheme (Draft), UNESCO, 2005; accessed April 2005;available fromhttp://portal.unesco.org/education/admin/ev.php?URL_ID=36026&URL_DO=DO_TOPIC&URL_SECTION=201&reload=1099410445.
________, ed. Atlas of the World's Languages in Danger of Disappearing, Edited byWurm, Stephen A. Paris / Canberra, UNESCO Publishing / Pacific Linguistics, 1996.
Wiens, John R., and David Coulter. "What Is an Educated Canadian," Education Canada,2005, vol. 45, no. 1: 21-23.
GENUINE PROGRESS INDEX Measuring Sustainable Development94
Xiao, Chenyang, and Riley E. Dunlap. "Validating a Comprehensive Model ofEnvironmental Concern Cross-Nationally: A U.S.-Canadian Comparison," Social ScienceQuarterly, 2007, vol. 88, no. 2: 471-493.
GENUINE PROGRESS INDEX Measuring Sustainable Development95
APPENDIX
IDEAL COMPREHENSIVE INDICATORS
Education Component – Genuine Progress Index Atlantic
The following list of indicators has emerged from the background work conducted byGPI Atlantic for its education indicators report. The list is an example of the types ofindicators recommended to create a broader and more meaningful assessment ofknowledge and learning in the populace than is presently possible. It is based on theframework described in section 1.3 of the accompanying Summary. It illustrates apotential ideal and comprehensive indicator set that could effectively indicate levels oflifelong / lifewide learning in the populace if data were available.
Unfortunately data for most of these indicators are not presently available. So thefollowing list actually represents a potential summary template for longer-termdevelopment this domain, indicating the types of data that will need to be collected andassembled in the future to populate the following recommended indicators.
For reference, the framework chart—which integrates the following indicators into acoherent whole—is included as Figure 1 in the Summary Report. The sections belowinclude a brief explanation of the rationale for the indicator and/or key elements thatcomprise the main comprehensive indicator for each knowledge area or literacy. All ofthese areas, including potential data sources, are discussed further in the backgroundresearch. The following is therefore simply a summary list.
GENUINE PROGRESS INDEX Measuring Sustainable Development96
Educated Populace Framework
A. POPULACE
1. Wisdom• Extent of wisdom in the populace based on an accepted wisdom scale
Wisdom scales have been designed by various researchers to indicate dimensions ofwisdom such as: commitment to the common good; the ability to think holistically; theability to discern whether or not something is beneficial or harmful to society; andattitudes of openness, caring, compassion, and respect for all life forms. Four suchwisdom scales are explored in the background materials.
2. Values• Prevalence of values in the populace that positively affect human wellbeing and
ecosystem health
Values can illuminate a vision for a healthy and sustainable society and help discriminatebetween what is beneficial to the wellbeing and sustainability of society and what isdetrimental. Broad values that have been identified in the literature as positively affectinghuman and ecosystem wellbeing include equity, compassion, concern for the commongood, and ecocentrism, among others. In Canada, it is widely accepted that such valuesare more likely to lead to socially valuable outcomes than values based more strongly onindividualism and self-interest. Because values are learned, it is important—as part of theGPI education indicators report—to assess the prevalence of particular values in theCanadian populace, to examine how these values are learned, and to determine whetheror not these values are changing over time. Because learning systems play an importantrole in questioning and potentially provoking shifts in values, the effectiveness of theselearning systems can be assessed in part by the extent to which they successfully teachand transmit values that enhance social wellbeing and ecosystem health.
B. CONTEXT 1: Learning environments
3. Quality of the informal learning environment in the public commons• Effects of popular culture and mass media on knowledge and learning
The quality of the informal learning environment in the public commons includes, in part,the effects of television viewing or other entertainment, omnipresent advertising, andnoise levels in the public commons on learning (e.g., ability to concentrate), knowledge(e.g., ability to detect misinformation), and behaviour (e.g., violent / empatheticbehaviour, stress / anxiety levels, and consumerism).
GENUINE PROGRESS INDEX Measuring Sustainable Development97
4. Quality of information in the learning environment / influence of the media as akey instrument of informal learning• Extent of:
o Media independence: censorship and bias in news reportingo Misinformation / disinformation / propagandao Information availability and information overload
The quality of information in the media directly affects how the public forms itsknowledge of important issues. Observers and critics of this phenomenon have noted thatit takes time, energy, skill, and experience to weed out irrelevant, redundant, and lowquality information from the vast amount of available information from which to choose.Therefore, it is important to assess the reliability, independence, and authenticity ofinformation, and to consider how the public is educated by its exposure to the media,where it gets its knowledge and information from, the degree to which unsubstantiatedinformation holds sway, and the degree to which the public is capable of distinguishingfact from fiction.
5. Educational systems and learning processes (nonformal / informal / formal)
Lifelong and lifewide learning
Characteristics of lifelong learners• Extent to which individuals exhibit the characteristics needed to be lifelonglearners—particularly self-regulated learning skills
Characteristics of lifelong learners that need to be assessed include interest andparticipation levels, learner conceptions of knowledge and learning processes, learningstyles, and skills needed to self-regulate learning. Self-regulated learning skills includecognitive learning strategies (critical reasoning and thinking skills), metacognitive skills(ability to reflect on and regulate one’s own learning, good management skills), affectskills (low test anxiety, persistence, confidence in learning), and motivation to learn.
Mental health influences on the ability to be lifelong learners• Extent of mental health factors in the populace that affect learning capacity,
educational attainment, and the ability to be lifelong learners
Mental health influences on the ability to be lifelong learners include factors such asstress, depression, anxiety, and attention deficit hyperactivity disorders (especially inchildren). The prevalence of these and other afflictions that may adversely affect learningcan mostly be assessed through existing instruments and data sources.
GENUINE PROGRESS INDEX Measuring Sustainable Development98
Nonformal learning
Work-related nonformal learning• Participation in adult education programs for work-related skill development• Extent of match / mismatch between worker skills and job requirements
Work-related nonformal learning involves areas such as: the need for skill development;the incidence, frequency, duration, and place of work-related adult education and trainingparticipation; sources and types of support for training; access and barriers to increasingparticipation; motivations of participants; past and future expectations of participation;subject matter of courses taken and the self-perceived usefulness of the courses; andoutcomes of adult nonformal learning. Some of these areas are included in the AdultEducation and Training Survey conducted by Statistics Canada in partnership withHuman Resources and Social Development Canada.
Apprenticeships / learning skilled trades• Learning outcomes of apprenticeship programs• Success of apprenticeship graduates in entering related skilled trades
Potential indicators to assess the effectiveness of learning through apprenticeships andlearning of skilled trades include learning outcomes of apprenticeship programs; trends innumbers of registered apprentices; program completion rates; incentives, support, andregulations for apprenticeship programs; and public attitudes toward apprenticeshiptraining and skilled trades.
Personal interest nonformal learning• Extent of participation in nonformal courses and programs for personal interest
Potential indicators in the field of personal interest nonformal learning include learningoutcomes, interest in and rates of participation in courses and programs, venues ofcourses, and types of courses taken.
Informal learning
• Extent of participation in informal learning and learning outcomes
All of the multiple literacy areas listed below contain elements of informal learning.Informal learning also includes participation in and outcomes related to learning incultural environments—such as libraries, museums and galleries, natural parks andbotanical gardens, zoos and aquaria, performing arts venues and festivals; through themedia (e.g., periodicals, books, films, television, or the Internet); in the workplace andhome; through community volunteer activities; and through other general interest areas(e.g., sports and recreation, cultural traditions and customs, leisure and hobby skills,health and wellbeing activities, etc.).
GENUINE PROGRESS INDEX Measuring Sustainable Development99
Formal learning
Safety and security in schools• The frequency of teacher / student victimization or bullying in Canadian schools
The degree to which students and teachers are physically safe and secure in Canada’selementary and secondary schools influences the quality of the learning environment andthe ability of teachers and students to attend fully to the tasks of teaching and learning.The 21 indicators of school violence, crime, and safety tracked regularly by the U.S.National Center for Education Statistics could serve as a model for Canada.
Positive classroom climate• Extent of positive classroom climate in Canadians schools
Positive classroom climate, which has been found to have a large and positive affect onthe knowledge and skills of students, is measured in the International Association for theEvaluation of Educational Achievement (IEA) Civic and Citizenship Education Study.The IEA defines positive classroom climate as a classroom that encourages criticalthinking, freedom of expression, and open discussion.
Service learning in schools• Extent to which Canadian schools incorporate service learning into their curricula
Service learning in schools, which is assessed in the IEA Civic and Citizenship EducationStudy, is measured as the extent to which schools integrate classroom instruction withcommunity service activities for which academic credit is given.
Independence: Commercialism in educationCorporate influences on formal education: K–12• Prevalence of corporate funding in the form of advertising, sponsorships /
partnerships, and corporate-sponsored educational materials in K–12 schools
The 2003/04 Canadian Teachers’ Federation survey on commercial activities in Canadianpublic schools provides the first pan-Canadian evidence in this area.
Corporate influences on formal education: Higher education• Public versus private share of sponsored research at Canadian universities• Prevalence of privately funded research independent of the sponsor• Research and development funds for basic or curiosity-driven research• Research and development expenditures by major field of study
Educational analysts tend to agree that anything which restricts or limits the educationalhorizons of students or prevents them from an unhindered pursuit of truth and knowledgeis counter to what the role of the education system should be. The literature on this
GENUINE PROGRESS INDEX Measuring Sustainable Development100
subject indicates that, when funding comes from the corporate sector, potential conflictsmay arise between educational and corporate goals, since conditions tied to funding areintended to benefit the funder and may or may not benefit the students.
C. CONTEXT 2: Formal education structural elements
6. Early childhood education• Degree to which Canadian learning processes and systems effectively develop
empathy in young children
This includes the percentage of time young children are engaged in co-operative play andmake-believe play. Research in the field of family literacy and literacy in children hasfound that creative play and make-believe play are not only important building blocks indeveloping literacy in children, but they also help build a child’s capacity for empathytowards others, which is in turn a key sign of effective emotional and social development.Statistics Canada’s National Longitudinal Survey of Children and Youth broaches thesubject of co-operative play, and this question could possibly be expanded to producedata required for this indicator in future.
It is highly recommended that a more complete set of indicators for early childhooddevelopment (ECD) be developed that recognizes the social, community, economic, andhealth influences on ECD. The Early Development Instrument (EDI) is an excellentmodel for assessing children’s readiness for school, but data are presently only availablefor three provinces (Manitoba, Ontario, and British Columbia).
7. Elementary and secondary education
Structure• Average number of students in each classroom
Class size—particularly in the early grades—has many influences on the educationaloutcomes of students, the learning environment, and teachers’ workloads. It has also beenstrongly associated with student achievement. Presently a number of provinces, includingSaskatchewan, Ontario, and Alberta collect and report data on this indicator, but thesedata are currently not comparable.
• Degree to which concepts of sustainability and ecology, Indigenous knowledge, arts,civics, multiculturalism, media literacy, science, health, and physical activity areintegrated into elementary and secondary school curricula
The content of school curricula is one of the most important ways that public schools, asstate institutions, “reproduce the existing culture” and reinforce the “modern mind set.”150
For this reason, while it is exceedingly difficult to measure, content analysis of school
GENUINE PROGRESS INDEX Measuring Sustainable Development101
curricula should assess 1) the extent to which ecology and other key literacies are part ofthe existing elementary and secondary school curricula, and 2) how they arepresented—e.g., from an economic resource / anthropocentric perspective or from anecocentric one. The incorporation of sustainability goals, principles, and practices intoschool curricula is a priority of the United Nations Decade of Education for SustainableDevelopment (DESD: 2005-2014). Within Canada, Manitoba has taken the lead in thisarea.
• Extent to which teachers have been specifically trained to teach the subjects they areteaching
The success of any school program depends on the quality of the teachers, which includestheir level of knowledge and understanding of the subjects they teach, and the trainingthey are given to develop this expertise.
• Extent to which schools specifically incorporate elements of transformative andholistic learning
Transformative or holistic learning relates to education of the whole person, or in thewords of the Centre for Ecoliteracy, education for the spirit, heart, head, and hands.150
Ontario Institute for Studies in Education (OISE) educator John P. Miller notes thatholistic learning seeks to integrate the personal with the social, linear thinking withintuition, mind with body, expert with lay knowledge, and the economy with theenvironment.150 It includes a sense of the sacred in the world and the need that humanshave to transcend narrow and overly specialized boundaries.
Access and opportunities• Extent of elementary and secondary student enrolment in private schools or home
schooling programs
This indicator may point to a potential gap in access to quality education in Canada, asthe public school system continues to face increased competition for scarce financialresources. Growing enrolment in private schools may indicate greater inequities and maythreaten equal access to quality education. As well, both private school enrolment andhome schooling may signal dissatisfaction with the quality of education offered in thepublic school system.
• Extent to which public schools engage in fundraising
The use of private fundraising initiatives to finance public school-based activities raisesserious concerns about access and equity issues in the public school system and canpotentially be a form of exclusion.
• Prevalence of user fees for a variety of services and programs in public schools
GENUINE PROGRESS INDEX Measuring Sustainable Development102
The charging of user fees threatens equitable access to public education, particularlywhen students are required to purchase supplies and materials and to pay for activitiesformerly provided for free. The charging of user fees sharpens disparities betweendifferent schools in different neighbourhoods, making the quality of public educationincreasingly dependent on income and ability to pay. The 2003/04 Canadian Teachers’Federation survey on commercial activities in Canadian public schools provides the firstpan-Canadian evidence on fundraising and user fees in Canadian public schools.
Financial investment in learning and education• Total public expenditures on elementary and secondary education for each full-time
equivalent student, per capita, and in relation to GDP
Financing of the education system is a key proxy measure for assessing basic issues suchas independence and access. However, the limitation of input indicators, such as funding,is that they cannot directly assess educational outcomes. Nevertheless, there is a definiteand proven link between what is put into a system and what comes out of it. Thus, theresources invested in public education can reasonably be expected to influence the extentand quality of school library resources, computers, athletic facilities, the availability ofart and music supplies, extra-curricular activities and school trips, and other more basicconditions of educational quality including class size, teacher training, adequate staffing,and safe and hygienic facilities.
• Household spending on educational needs, such as textbooks, school supplies, andtuition costs
Trends in household spending on education can help to indicate whether there is awidening gap in access to educational resources in Canada based on the capacity to pay.
Motivation and satisfaction with learning• Prevalence of elementary and secondary students who are positively stimulated by,
satisfied with, and engaged in their learning
Active student engagement typically denotes that the school work has stimulated thestudent’s curiosity and creativity and has resulted in more meaningful learning. It is alsoan important outcome measure of the relevance and quality of education systems, as wellas an indicator of the degree to which learners are likely to participate voluntarily inlifelong learning upon completion of their formal schooling. Questions on studentsatisfaction appear in the School Achievement Indicators Program (SAIP) writtenassessments, but results are not presently published. Statistics Canada’s NationalLongitudinal Survey of Children and Youth (NLSCY) is also developing a new indicatorof student engagement.
GENUINE PROGRESS INDEX Measuring Sustainable Development103
8. Postsecondary education
Structure• Average number of students in each class section at universities and colleges
Reducing class size at the postsecondary level may increase student learning as well asthe level of student participation in and satisfaction with the classroom experience.Presently pan-Canadian data are available on faculty-student ratios (which include non-teaching faculty) but not on class size.
• Extent to which universities close or merge research units, departments, and facultiesin the liberal arts
Critics have argued that funding for university research has increasingly been targeted atspecific kinds of research programs, which frequently involve private sector partnershipswith a potential for commercial application or projects that are more practical and thatdeal with matters of social policy. A changing focus given to the research awards andfunding of the liberal arts at universities may imperil units and departments that are seenas having less commercial or practical utility, can indicate shifting public policypriorities, and may have profound implications for the fabric, nature, shape, and future ofCanadian society. Closures or mergers of research units and departments may indicate theextent to which such trends are in fact occurring.
Access• Average amount of government postsecondary student debt at graduation• Average amount of total and private postsecondary student debt at graduation• Effect of student debt on post-graduation quality of life• Average undergraduate university tuition fees• Participation in postsecondary education based on family characteristics• Average hours full-time postsecondary students with jobs work per week during the
school year• Time stress levels among postsecondary students
Socially constructed barriers to participation in postsecondary education may includegender, class, socioeconomic status, and ethnicity. While there has been limited successat dismantling some barriers, evidence indicates that financial, socioeconomic, and classbarriers persist and have possibly worsened as student tuition fees and debt levels haveskyrocketed. Students who work long hours for pay during the school year mayexperience severe time stress and be disadvantaged by reduced study time compared withstudents who do not work long hours. As well, high levels of accumulated debt maycontribute to continuing financial stress after graduation.
Student satisfaction and engagement• Proportion of postsecondary students who are positively stimulated by, satisfied with,
and engaged in their learning
GENUINE PROGRESS INDEX Measuring Sustainable Development104
The degree to which students are engaged in their studies reflects the quality of theirlearning as well as the quality of their overall educational experience. Student satisfactionand engagement is also an important outcome measure of the relevance and quality ofeducational systems, as well as an indicator of the degree to which students are likely toparticipate voluntarily in lifelong learning after completing their formal schooling. Somepostsecondary institutions in Ontario, Alberta, and British Columbia currently assessstudent satisfaction and engagement using questions from the U.S. National Survey ofStudent Engagement (NSSE), which has been administered annually since 2000.
Financing postsecondary education• Total public versus private share of university and community college revenues• Public postsecondary education funding per student
There are many different influences on formal education quality and outcomes, includinglevel of funding. Government funding levels also affect the extent of reliance on tuitionfees and therefore have implications for access. As well, an increasing share of privaterather than public funding may potentially compromise the independence and academicintegrity of postsecondary institutions. In Canada, there are marked inter-provincialdifferences in government funding commitments to postsecondary education, so it isimportant to report this indicator by province.
D. LEARNING OUTCOMES
It is recommended that comprehensive, composite indicators be developed for each of thefollowing literacies or knowledge areas. For example, ideally it would be desirable tohave a composite score for Canadians’ scientific literacy, civic literacy, ecologicalliteracy, etc. that is the aggregate of a range of assessments or survey responses. Sincecompetence in each of the literacies or knowledge areas described below involves morethan just the acquisition of knowledge, these comprehensive indices should include fouressential elements—knowledge, values, attitudes / beliefs, and action / behaviour—foreach of the literacies. These four elements correspond to the four Delors pillars oflearning: to know, to be, to live together, and to do, respectively.150
The individual indicators listed after each of the recommended composite indices beloware actually all components of the potential comprehensive, composite literacy index foreach knowledge area. However, they are listed separately because—in the absence of acomposite, comprehensive index for each literacy—these separate indicators represent afew concrete steps that can be taken toward the eventual development of that ideal set ofcomposite indices. Also, key elements of the comprehensive indices are described afterthe individual indicator lists.
GENUINE PROGRESS INDEX Measuring Sustainable Development105
In addition, although this learning outcomes section focuses on multiple literacyoutcomes in the adult populace, these outcomes also reflect and include formal schoolingoutcomes.
9. Basic adult literacy• Extent to which the Canadian adult populace has attained adequate levels of basic
literacy (Level 3 in the prose, document, numeracy, and problem solving scales)• Average prose literacy scores• Average document, numeracy, and problem solving scores• Degree to which the distribution of literacy scores is narrowing (thus reducing basic
literacy inequalities)
The accumulated evidence points to the central role of basic adult literacy as a keydeterminant of both social and economic wellbeing.
10. Ecological literacy• Extent of ecological literacy in the Canadian populace based on a composite index• Basic knowledge of local and bioregional ecological issues• Emotional and / or spiritual connectedness to the natural world• Proportion of Canadian secondary school students who are ecologically literate based
on a composite index of school-age ecological literacy
Ecological literacy includes having knowledge and general awareness of significantecological concepts, facts, problems, and issues, including an understanding ofbiodiversity; of the connections between consumption patterns, extraction of the Earth’sresources, and sustainability; of the interconnections between people / societies andnatural systems, including causes of climate change and species loss; of the ecologicalprocesses of local bioregions and ecosystems; and of the principles and practices ofsustainability. Ecological literacy also includes environmental sensitivity, ecologicalvalues, attitudes conducive to environmental protection, and environmentally responsiblebehaviour.
11. Arts literacy• Extent of arts literacy in the Canadian populace based on a composite index• Personal engagement in creative leisure activities• Importance that individuals place on the arts in terms of enhancing their quality of life• Extent to which the populace shows depth of creativity and aesthetic experience• Effectiveness of Canadian formal arts education in enabling and encouraging students
to engage in the creative, expressive, and responsive processes of the arts throughouttheir lives and in developing high levels of arts literacy
Arts literacy is concerned more with the extent and depth of arts literacy within thegeneral populace than with professional artists and art, per se. It includes learning,valuing / appreciating, understanding, and creating a broad range of arts, including (butnot limited to) visual arts, crafts, music, drama and other spoken arts, dance, literature,
GENUINE PROGRESS INDEX Measuring Sustainable Development106
and film. It also includes the incorporation of arts activities and appreciation into dailylife and culture, rather than confining arts participation to a set of elite activities to bewitnessed and experienced as separate from daily life.
12. Indigenous knowledge literacy• Degree to which the Canadian populace is literate in Indigenous knowledge based on
a composite index• Extent to which the Canadian populace understands the basic principles and values of
Indigenous knowledge and worldviews• Extent to which Indigenous knowledge is effectively integrated with Western science
and education in Canada• Extent to which Indigenous knowledge and languages are flourishing and enduring
Indigenous knowledge literacy includes the strength and protection of Indigenousknowledge and languages, and is also assessed by the extent of its influence onconventional educational systems, structures, and processes, as well as the degree andextent of its penetration into the larger Canadian society. Considerations in the protectionof Indigenous knowledge that are also amenable to indicator development include theextent to which the role and work of Indigenous elders is adequately resourced andreceives sufficient support. In relation to formal education structures, indicators canpotentially assess the extent to which Indigenous knowledge and worldviews areincorporated into mainstream educational curricula and learning systems. A study by theInternational Development Research Centre in Ottawa was also concerned to assess theextent of inclusion of grassroots indicators in conventional decision-making processes asa marker of the use of traditional knowledge systems.
13. Scientific literacy• Extent of scientific literacy in the Canadian populace based on a composite index• Extent to which the public understands scientific concepts and processes that enable
them to participate fully in personal, economic, social, cultural, and environmentalarenas
Scientific literacy involves understanding the nature (norms and methods) of scientificinquiry, key scientific terms and concepts, attitudes toward and interest in science andtechnology, and contextual issues such as awareness of the moral, social, economic, andenvironmental impacts of science and technology on society. The U.S. National ScienceFoundation (NSF) survey on Public Attitudes Toward Science and Technology, whichhas been conducted in the U.S. every two years since 1979, and which forms the basis ofthe multi-national Eurobarometer survey that is regularly conducted in the EuropeanUnion countries, could potentially be a model for a similar survey in Canada.
14. Health literacy• Extent of health literacy in the Canadian populace based on a composite index• Degree to which the populace understands the social determinants of health and acts
on community health concerns
GENUINE PROGRESS INDEX Measuring Sustainable Development107
• Extent to which the public has access to reliable health information• Proportion of Canadian high school students who are health literate based on a
composite index of school-age health literacy
Health literacy includes the extent to which the public knows and understands what isneeded to live a healthy life, to prevent disease, and to seek and act upon appropriatemedical care when needed. It also includes the ability to discriminate between accuratehealth information and health information that may be misleading, outdated, or biased. Inaddition, it involves public understanding of how broad determinants of health—forexample, social, economic, environmental, and lifestyle factors—affect health status andhealth outcomes, both individually and in the larger community. Public knowledge ofspecific issues such as the precautionary principle, biotechnology, nanotechnology, andbasic pharmacology are also considered part of health literacy.
15. Food and nutrition literacy• Extent of food and nutrition literacy in the Canadian populace based on a composite
index• Extent to which the public knows and understands the sources, ingredients, quality,
and impacts of the food that is consumed on a daily basis• Extent to which the public understands and uses labels on food products to find out
specific information about issues such as nutritional content, additives, growingmethods, or manufacturing processes
Food and nutrition literacy includes awareness of one’s own nutritional behaviour and anunderstanding of the relationship between nutrition, food production, and one’s ownhealth, as well as the health of the environment and society as a whole. In addition, itinvolves knowledge not only of where food comes from, but also of the impacts of theentire food system on personal, social, and environmental health.
Some particular knowledge issues in the assessment of food and nutrition literacyinclude: food safety and regulatory systems, the implications of long-distancetransportation of food products, the nature and impact of food additives, the actualnutritional values of foods, the implications of agri-business production for local andglobal farmers and economies, the treatment of farm animals, and the environmentalimpacts created by food production systems, including understanding of the toxicresidues of chemical farming and potential soil degradation resulting from intensiveagriculture practices. Knowledge of topical issues, such as genetically engineered foodproducts and organic foods, is also considered integral to food and nutrition literacy.
16. Civic literacy• Extent of civic literacy in the Canadian populace based on a composite index• General political knowledge based on age cohort• Extent of understanding of the complexity of social, economic, and ecological policy
issues as a global citizen
GENUINE PROGRESS INDEX Measuring Sustainable Development108
Four areas of civic literacy are commonly distinguished by analysts in this field—thecivil, political, socioeconomic, and cultural or collective dimensions. Ideally, the mostvalid and useful indicator of civic literacy would be a composite measure based on allfour of these elements. However, because such a measure would involve considerableoverlap with the other 19 GPI domains, the main focus here is on the political area, whichstill includes a knowledge and understanding of policy issues in a wide range of areas.
In this more restrictive definition, civic literacy involves, in part, the extent to whichcitizens are interested in and informed about political and other issues, understand civicand political processes, and participate in civic or political activities. Indicators of civicliteracy also need to distinguish between citizens who are uninformed (e.g., aboutpolitical actors, political facts and concepts, and political party stands on key issues) fromthose who are misinformed on basic policy issues (like income distribution, crime rates,pollution, and the living standards of Aboriginal peoples).
17. Multicultural literacy• Extent of multicultural literacy in the Canadian populace based on a composite index• Extent of public knowledge, appreciation, and understanding of key intellectual,
social, and cultural contributions of the world’s diverse cultures• Prevalence of Canadians who are fluent in both English and French• Prevalence of Canadians who are multilingual
Multicultural literacy includes the extent to which the populace has knowledge,understanding, and appreciation of the diversity of cultures in Canadian society and oftheir respective contributions to Canadian society, as well as an understanding of issuesof equity, access, social cohesion, racism and discrimination, and other social justiceissues that are particularly relevant to a multicultural society. Multicultural literacy alsoinvolves indications of the extent to which cultural heritages and knowledge are beingsaved or lost, which is sometimes measured by the effective transmission of mothertongues to the descendants of immigrants, and the use and retention of mother tongues bythese descendants. Also important as a key component of multicultural literacy is theability to critically analyze the values and attitudes of the dominant culture and to viewissues from the perspectives of diverse cultural groups rather than from the perspective ofthe dominant culture alone.
18. Media literacy• Extent of media literacy in the Canadian populace based on a composite index• Degree to which Canadians are critically aware of the promotional practices and
influences of advertising in the media• Extent to which the public can recognize bias and misinformation in the media and
avoids acting based on erroneous information• Effectiveness of formal media literacy education to enhance the media literacy skills
of school-age children and youth
GENUINE PROGRESS INDEX Measuring Sustainable Development109
Media is the term used to refer to any medium or method that communicates, including(but not limited to) books, newspapers, magazines, computers and the Internet, video, art,music, television, radio, film, and billboards. Media literacy includes publicunderstanding of the ways in which the media represent reality, the techniques theyemploy, and the ideologies embedded within their representations.
19. Statistics literacy• Extent of statistics literacy in the Canadian populace based on a composite index
Statistics literacy involves the ability to understand statistical data, including how theyare constructed, how to interpret statistical validity, and how to use statistics in daily lifeto understand matters such as medical advice, crime rates, population growth, diseaseincidence, or energy use. In addition to understanding key statistical issues such asdistribution, association, and sampling, statistical literacy also requires specificknowledge and skills such as mathematical knowledge, context / world knowledge, andcritical questioning and reasoning skills that enable the use of statistics in daily life.
E. SOCIAL OUTCOMES
Although there is no direct path from learning to actual use of knowledge and toparticular social outcomes, the GPI education indicators, in common with the CanadianCouncil on Learning’s Composite Learning Index (CLI) recognizes that linkages betweenlearning and social outcomes do exist and will ideally explore the extent to whichlearning outcomes in each of the areas examined are effectively translated into desiredsocial outcomes. In the GPI framework, these social outcomes will be reflected in theresults of the other 19 GPI domains or areas of interest.
F. ECOLOGICAL INTEGRITY AND SUSTAINABILITY
Because human and social wellbeing are dependent on the health of the encompassingecosystem, ecological integrity and sustainability represent the desired outcome of all ofthe domains—not just those concerned with the natural environment. Thus, it forms theoutermost concentric circle in the GPI educated populace framework depicted in Figure1. Learning systems teach behaviours that either support or undermine ecosystem health,sustainability, and human wellbeing. Ideally, therefore, a comprehensive set of indicatorsfor the GPI education indicator report, will therefore assess the degree to which existinglearning processes and educational systems in Canada contribute to maintaining andenhancing ecological integrity and sustainability and thereby to enabling the needs of thepresent to be met without jeopardizing the ability of future generations to meet their ownneeds.