MEASURING THE EFFECTIVENESS OF BANKING E-BUSINESS SYSTEMS IN SOUTH AFRICA by Jacobus Peenz U14210968 Submitted in fulfilment of the requirements for the degree Master in Commerce (Informatics) in the DEPARTMENT OF INFORMATICS of the FACULTY OF ECONOMIC AND MANAGEMENT SCIENCES at the UNIVERSITY OF PRETORIA Supervisor: Professor C De Villiers Date of submission December 2017
Transcript
MEASURING THE EFFECTIVENESS OF BANKING E-BUSINESS
SYSTEMS IN SOUTH AFRICA
by
Jacobus Peenz
U14210968
Submitted in fulfilment of the requirements for the degree
Master in Commerce (Informatics)
in the
DEPARTMENT OF INFORMATICS
of the
FACULTY OF ECONOMIC AND MANAGEMENT SCIENCES
at the
UNIVERSITY OF PRETORIA
Supervisor:
Professor C De Villiers
Date of submission
December 2017
Page ii of 130
Declaration regarding Plagiarism
The Department of Informatics emphasises integrity and ethical behaviour with regard to the
preparation of all written assignments.
Although the lecturer will provide you with information regarding reference techniques, as
well as ways to avoid plagiarism, you also have a responsibility to fulfil in this regard. Should you at
any time feel unsure about the requirements, you must consult the lecturer concerned before
submitting an assignment.
You are guilty of plagiarism when you extract information from a book, article, web page or
any other information source without acknowledging the source and pretend that it is your own work.
This doesn’t only apply to cases where you quote verbatim, but also when you present someone
else’s work in a somewhat amended (paraphrased) format or when you use someone else’s
arguments or ideas without the necessary acknowledgement. You are also guilty of plagiarism if you
copy and paste information directly from an electronic source (e.g., a web site, e-mail message,
electronic journal article, or CD ROM), even if you acknowledge the source.
You are not allowed to submit another student’s previous work as your own. You are
furthermore not allowed to let anyone copy or use your work with the intention of presenting it as
his/her own.
Students who are guilty of plagiarism will forfeit all credits for the work concerned. In addition,
the matter will be referred to the Committee for Discipline (Students) for a ruling. Plagiarism is
considered a serious violation of the University’s regulations and may lead to your suspension from
the University. The University’s policy regarding plagiarism is available on the Internet at
1. I understand what plagiarism entails and am aware of the University’s policy in this regard.
2. I declare that this assignment is my own, original work. Where someone else’s work was used (whether from a printed source, the Internet or any other source) due acknowledgement was given and reference was made according to departmental requirements.
3. I did not copy and paste any information directly from an electronic source (e.g., a web page, electronic journal article or CD ROM) into this document.
4. I did not make use of another student’s previous work and submitted it as my own.
5. I did not allow and will not allow anyone to copy my work with the intention of presenting it as his/her own work.
• I thank my God Almighty every day for the talents, skills and above all His favour over
me, allowing me to study further and to accomplish these life dreams, even at a
somewhat late stage in my life.
• My dearest wife who supported, cheered, urged and sometimes threatened me to
continue and achieve this milestone. Her support and hundreds of prayers carried me
all the way to the end of road.
• The absolute best supervisor that a postgraduate student can wish for, Professor Carina
De Villiers. She has so much patience, deep knowledge of her subject areas, punctuality
and discipline, all packaged into a friendly and helpful personality. Without her
assistance and support, this work will have been much more complex than what it
became in the end.
• The support staff at the University of Pretoria need special mention. Rhona and Cathy
by name, always ready to assist in getting information and filing the needed
documentation along the route. Their work made the journey so much easier and faster.
Your helpfulness is not unnoticed.
• I also need to express my gratitude to the University of Pretoria for supporting me with a
bursary. Not having financial concerns contributes hugely to trouble-free concentration
on the task at hand.
• Lastly, but certainly not the least, Dr Jonathan Miller needs special mention as the
catalyst who sowed fertile seeds when I occupied my first management position. His
presentation at the then Computer Society of South Africa on measuring the
effectiveness of information systems had such a deep and profoundly lasting impact on
me, that I still apply it in more than one area of my professional life. I hope that the work
I present here can prove a homage of the hard work that he had done over many years.
I trust he now enjoys his pension and catching up the hours lost not being on the golf
course. He left an indelible mark in my curious mind, creating questions which I still hope
to answer. I therefore dedicate this research to him without hesitation.
Page iv of 130
Table of Contents ACKNOWLEDGEMENTS .................................................................................................................. iii
ABSTRACT .......................................................................................................................................... ix
systems, typically designed and executed using the internet through
browser or APP interfaces.
IT A generally used abbreviation for Information Technology.
IS A general abbreviation for Information Systems, sometimes erroneously
used as a synonym for IT.
MIS Management Information Systems
TAM Technology Acceptance Model
Page 18 of 130
TRA Theory of Reasoned Action
UTAUT Unified Theory of Acceptance and Use of Technology
TPB Theory of Planned Behaviour
1.9 SIGNIFICANCE
Based on the study of existing literature, it is reasonable that the effectiveness measurement
of systems, and specifically e-business systems, is particularly biased towards the originator
or supplier of the system. This leaves a gap to measure the effectiveness of the same
systems, but from the perspective of the clients who are using these e-banking systems.
These clients are often businesses in various economic sectors. Unless there are clear and
direct advantages for the client, there may be resistance to using such systems, thus
diminishing the effectiveness thereof. Many studies were done considering the satisfaction
of the individual. Relatively few studies were done concentrating specifically on business
banking needs and satisfaction.
Page 19 of 130
1.10 SUMMARISED CHAPTERS OVERVIEW
Figure 1 - Overview of chapters and contents
What?
Chapter 1 is setting the scene by describing the focus area of research, describing the
research problem and stating the research questions. The contribution of this research is
also described, as well as currently known limitations with the proposed study.
Why?
Chapter 2 is a review of the literature. This literature review aims to deepen the
understanding of the origin of the current position, and to define the context within which the
research is being conducted.
Chapter 3 extends the literature research done in Chapter 2 by considering different
theoretical models to find a suitable method to use in this research. It further defines
concepts, describes research previously conducted with the findings thereof, and focuses
the proposed research.
Page 20 of 130
How?
Chapter 4 describes the research method, ontology, the theoretical basis of the research
and epistemology which is chosen for this research paper. The ethical foundation is also
described, as well as the survey questions and a cover letter discussed.
Findings
Chapter 5 contains a systematic literature review, the detailed discussion and explanations
of the research conducted and the findings thereof. A survey distributed is also processed
and discussed, then compared to the findings of the systematic literature review and to an
old research paper where system effectiveness was measured with an objective instrument.
This instrument served as the original starting point to develop the instrument used in the
survey used in this research paper.
Conclusion
Chapter 6 will summarise the findings, draw a conclusion and describe future
recommendations for research.
Page 21 of 130
2 LITERATURE REVIEW
2.1 INTRODUCTION
To conduct meaningful research on e-business, it is firstly necessary to understand what e-
business is. It is also necessary to understand what research had previously been done,
narrowed down to the subject which is chosen for further research. To this end, substantial
research had been done in the past concerning business-to-business (B2B) and business-
to-consumer (B2C) e-commerce systems as discussed below. It was also found that a clear
differentiation has been made between e-commerce and e-business. E-commerce is mostly
concerned with trading between commercial parties, be it individual or corporate, whereas
e-business had been extended to include many other business functions that do not
necessarily involve trading but include intra- and inter-company functions of source and
supply of goods, information and services. These concepts are further explored in the
following discussion.
2.2 BUSINESS-TO-BUSINESS E-COMMERCE (E-BUSINESS)
2.2.1 DEFINING E-BUSINESS
Several different definitions of e-business can be put forward. What does need to be clear
is that e-business is not e-commerce. E-commerce is defined as being narrower in scope
than e-business, and is often confined to selling and buying online (Chaffey, 2015). E-
business was first coined by IBM in 1997 who described it as "the process of extending or
transforming the business processes by making use of internet technologies". This definition
by IBM seems to imply that all business processes are potential candidates for e-business
extension or development in some way, or at least impacting thereon. By considering the
extension of business processes, the coverage of e-business solutions is by default much
broader and deeper than the solutions offered by e-commerce internet solutions.
2.2.2 POSITIONING E-BUSINESS IN THE GENERAL BUSINESS STRATEGY
Business strategy had been described and discussed in numerous publications and by many
authors over many years (Porter, 1980, Pretorius and Maritz, 2010, Williams, 2007, Miles et
al., 1978, Chetty, 2010, Ackoff, 1990). The most prolifically quoted and influential work
seems to come from Michael Porter, who had written many works on business strategy
formulation and execution. One of his most quoted seminal works is titled "Competitive
Strategy" (Porter, 1980). It contains a description of the competitive forces driving industries,
Page 22 of 130
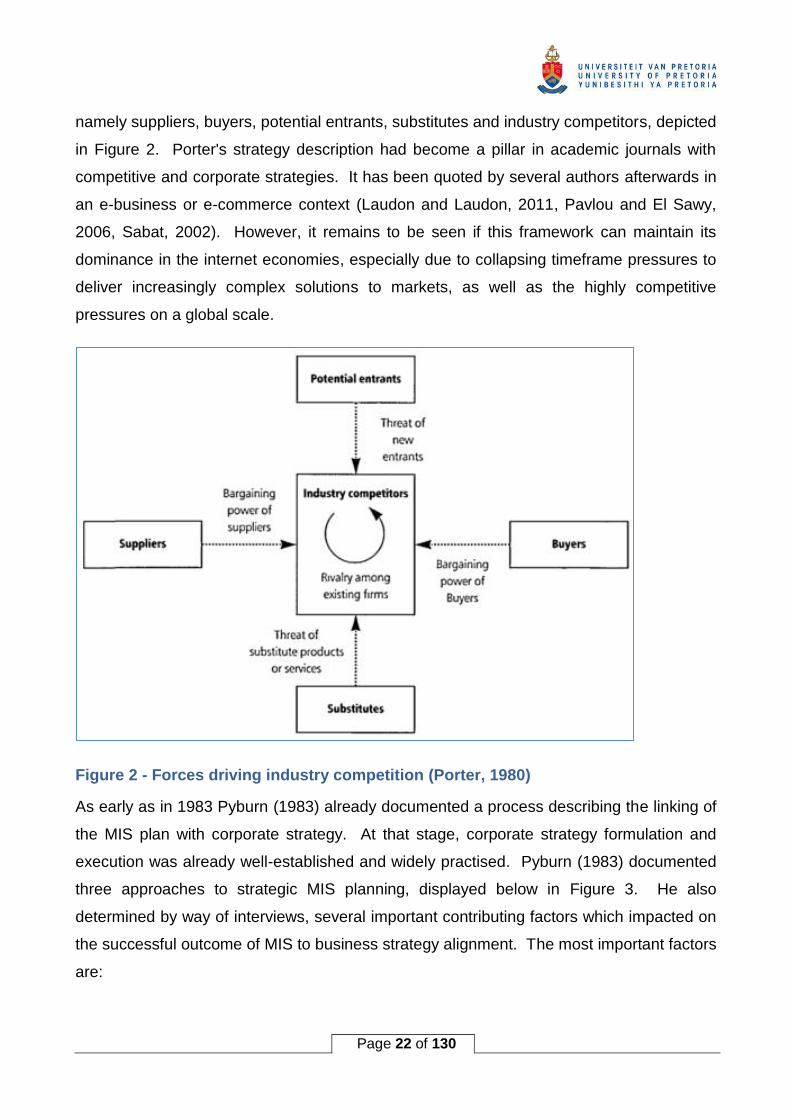
namely suppliers, buyers, potential entrants, substitutes and industry competitors, depicted
in Figure 2. Porter's strategy description had become a pillar in academic journals with
competitive and corporate strategies. It has been quoted by several authors afterwards in
an e-business or e-commerce context (Laudon and Laudon, 2011, Pavlou and El Sawy,
2006, Sabat, 2002). However, it remains to be seen if this framework can maintain its
dominance in the internet economies, especially due to collapsing timeframe pressures to
deliver increasingly complex solutions to markets, as well as the highly competitive
pressures on a global scale.
Figure 2 - Forces driving industry competition (Porter, 1980)
As early as in 1983 Pyburn (1983) already documented a process describing the linking of
the MIS plan with corporate strategy. At that stage, corporate strategy formulation and
execution was already well-established and widely practised. Pyburn (1983) documented
three approaches to strategic MIS planning, displayed below in Figure 3. He also
determined by way of interviews, several important contributing factors which impacted on
the successful outcome of MIS to business strategy alignment. The most important factors
are:
Page 23 of 130
• The status of the IS Manager,
• The business' volatility,
• The degree of IS environment complexity,
• The personal styles of the IS manager, and
• The physical closeness or proximity of the IS managers to user management.
Figure 3 - Approaches to strategic MIS planning (Pyburn, 1983)
Luftman, in a series of articles over several years, further described the process of aligning
IS strategy to corporate or business strategy. The first work described a number of factors
that either enabled or inhibited business and IT alignment (Luftman et al., 1999). In the
same year he documented methods to achieve and sustain business and IT alignment
(Luftman and Brier, 1999). These two works were followed up with the development of a
methodology to measure the successes of IT to business alignment (Luftman, 2003,
Luftman et al., 2010). This methodology is based upon the Capability Maturity Model
(CMM). CMM is a set of guidelines based on best-practices which are aimed at delivering
stable and repeatable software development projects (Bamberger, 1997). It was, over the
years since its conception by the Carnegie-Mellon Institute, been adapted and used in
Page 24 of 130
various applications and environments (Zhong et al., 2014, Reichner, 1996, Van Baaren et
al., 2014, Tiku et al., 2007).
Although e-business profiles vary based on the strategic orientation of businesses, it was
found by Raymond and Bergeron (2008) that e-business alignment to business strategy had
positive performance outcomes for manufacturing businesses of small to medium size.
These positive outcomes were in financial, growth and productivity performance, regardless
of whether the businesses were defender, analyser or prospector strategic types. The
strategic types defender, analyser and prospector was first described in detail by Miles
(1978). The three strategic types are defined as follows:
Defender: An organisation which focuses on a small specialised niche market, limiting
product offerings and keeping competition out with a mix of aggressive pricing,
product quality and efficient production methods.
Prospector: An organisation which displays an ability to find and exploit new market or
product opportunities. The Prospector organisation is typically highly
innovative.
Analyser: An organisation that attempts to minimise risk while maximising profit.
Damanpour and Damanpour (2001) concluded five points which expresses both the urgency
and concerns around e-business. These are:
• E-business is no longer an alternative, but essential,
• There is no standard model that fits all companies or industries,
• The major benefits are:
o to gain competitive advantage,
o increase efficiency,
o integrate suppliers / vendors and clients,
o improve distribution,
o lower costs and
o broaden market penetration
• At the time of this study, e-business was concentrated amongst wealthy nations with a
lack of funds being the reason for the lack of e-business presence in developing and
poorer nations,
Page 25 of 130
• Internet security and vulnerability was a major concern.
Evans (2001) identified two major issues that require to be addressed sufficiently in order to
implement a successful e-business migration, namely
1) that business processes need to be changed to become customer-centric,
2) the right technology must be acquired at the right time.
Both these issues have a profound impact on the business strategy which in turn impacts
the IT strategy. Sharma and Gupta (2004) concur in their study with Evans (2001) in finding
amongst other issues that the processes, people and systems must function in a closely
integrated ("symbiotic") manner to meet and exceed expectations of stakeholders. They
also state that customer-focused staff is required, with processes which are simple to
execute, yet flexible enough to change with requirements.
2.2.3 AREAS OF E-BUSINESS APPLICATION
The use of e-business systems is already widely applied in various disciplines (Palmer,
2002). Examples are:
• e-learning (Muse, 2007, Foster and Lin, 2003),
• online ordering and purchasing of books (Amazon.com), electronic goods (Dell, Apple,
takealot.com), groceries and clothing (inthebag.co.za, spree.co.za), digital entertainment
including movies and music (Sony Professional Entertainment, iTunes),
• e-government services (Kerr and Bryant, 2008, Morgeson and Mithas, 2009, Rashid and
Othman, 2017) at both local and central level. Such services include submission of tax
returns, payment of utility bills and various regulatory submissions as may be required
by governments. Lately applications for identity documents and passports are becoming
increasingly electronic,
• banking (Levenstein, 2001, Sehgal, 2017, Rahi et al., 2017, Ozlen and Djedovic, 2017,
Mou et al., 2017, Low et al., 2017, Sheikhi and Sheriff, 2016, Tat and Nor, 2015, Martins
et al., 2014, Hanafizadeh et al., 2014, Ezzi, 2014) which had been at the forefront of e-
business for some time,
• tourism, including accommodation reservation and travel bookings such as airline flight
bookings (Wang and Cheung, 2004).
Page 26 of 130
E-business functions are continuously extending into the delivery of information using the
internet to remote clients, suppliers and staff who are not office-bound, including functions
such as the capturing and tracking of supplier and customer orders, updating of personal
information, delivery of management reports (Strydom, 2013, Kwak et al., 2012, Dixit and
Prakash, 2011, Muse, 2007, Presley, 2006, Fynes and Marshall, 2005, Siau and
Messersmith, 2003, Ash and Burn, 2003, Loos, 2000). New functionalities are discovered,
designed and added daily.
2.2.4 E-BUSINESS IN THE BANKING SECTOR
One of the business sectors that rapidly embraced e-business is banking. With the large
number of clients that banks normally need to deal with, as well as clients’ need to perform
certain functions and transactions “on the go”, it is worthwhile for banks to invest substantial
development into online, self-service applications and web sites for clients. Together with
the adoption of these technologies followed the need to determine the value offered by these
systems to clients. These research projects have been conducted for more than two
decades now and yields varying results. It possibly depends on the state of technology at
the time that the research is conducted. Searching for electronic banking (e-banking)
systems in a variety of databases and document sources, one gets a rich set of results. This
clearly has its own challenges when these research articles need to be read, understood
and consumed. While some e-banking research is relatively old (Tan and Teo, 2000,
Gerrard and Barton Cunningham, 2003, Akinci et al., 2004, Pikkarainen et al., 2004), there
are already conference papers published this year, indicating that the popularity of the
subject has not subsided (Ozlen and Djedovic, 2017, Low et al., 2017, Sheikhi and Sheriff,
2016).
Many international studies were concluded where the effectiveness of e-banking systems is
attempted to be determined in several ways. It is also not always obvious, as the titles and
contents do not necessarily contain the keyword “effectiveness”, but is implied by measuring
“adoption”, “acceptance”, etc. A rather large list of research works is quoted and is
considered in Chapter 5 in detail (AbuShanab et al., 2010, Akinci et al., 2004, Al-Qeisi, 2009,
Amin, 2009, Ayo et al., 2010, Cheng et al., 2006, Eriksson et al., 2008, Ezzi, 2014, Gerrard
and Barton Cunningham, 2003, Gikandi and Bloor, 2010, Hanafizadeh et al., 2014, Lee,
2009, Linstone and Turoff, 1975, Loonam and O'loughlin, 2008, Martins et al., 2014, Naimi
Baraghani, 2008, Pikkarainen et al., 2004, Polasik and Piotr Wisniewski, 2009, Shon and
Page 27 of 130
Swatman, 1998, Tan et al., 2010, Tan and Teo, 2000, Tat and Nor, 2015, Xue et al., 2011,
Yu, 2012).
Research done where South Africa is specifically targeted or included as a geographical
area is available. A number of articles where the current state of online electronic banking
systems is the subject is considered later in this research paper (Sabharwal, 2016, Mujinga
et al., 2016, Maduku, 2013, Masocha et al., 2011, Porteous, 2006).
2.2.5 BENEFITS OF E-BUSINESS
Soliman and Youssef (2003) found the list below to be the most considered benefits to be
achieved using e-business systems.
• Cost reduction
• Simplification of processes
• Customer service improvement
• Generation of new income streams
• Quicker decision-making cycle
Other, but similar findings were reported by Beheshti and Salegi-sangari (2007) as listed
below:
• Reduced unit cost of goods and services - less staff needed
• Efficiency improvement
• Improved operational flexibility
• Improved responsiveness to client and supplier needs
• Data collection which allows improved marketing strategies, higher sales and better
customer service
Youlong and Lederer (2003) devised an instrument consisting of 27 items which measure
five distinctly identifiable factors, namely back-end efficiency, market expansion, inventory
management, cost reduction and customer service levels. It provides a common measure
for independent and dependent variables, aimed at making it easier for practitioners to make
decisions around business-to-consumer (B2C) e-commerce solutions. Like many others,
this study pivots around the supplier of the e-commerce service with an almost total
Page 28 of 130
exclusion of the customer and the possible benefits to be derived by the customer through
the use of a supplier's e-business systems.
Sanders (2007) concentrated his study on using e-business integration between suppliers
and manufacturers. Although he found that suppliers, by virtue of being financially smaller,
thus limited in ability compared to the larger manufacturing businesses, stood to gain
substantially in several integration points.
From the above publications one can summarise the main areas of benefit which includes:
• Efficiency gain,
• Possible cost reductions,
• Improved communications internally and externally,
• Improved customer service,
• Increased flexibility, and
• Quicker decision-making cycles.
Several academic studies on e-business systems concentrated on e-banking, a specific and
focussed type of e-business system (AbuShanab et al., 2010, Amin, 2009, Hanafizadeh et
al., 2014, Lee, 2009, Martins et al., 2014, Pikkarainen et al., 2004, Tan et al., 2010, Xue et
al., 2011). The contents of these articles are discussed in Chapter 5 in more detail.
2.3 NOTES ON EFFECTIVENESS
2.3.1 DEFINING EFFECTIVENESS
There seems to be a wide array of definitions in many publications as to what "effectiveness"
encapsulates. The standard dictionary definitions below seem to all imply that a specific
result must have been achieved successfully. The difficulty lies in how “successful” is
defined and measured. There seems to be no consensus on this matter.
• Effectiveness is defined in the Oxford dictionary (2017) as:
"The degree to which something is successful in producing a desired result."
• According to the Cambridge online dictionary (2017) effectiveness is described as:
"successful or achieving the results that you want"
Page 29 of 130
• The business dictionary website (2017) describes effectiveness as:
"The degrees to which objectives are achieved and the extent to which targeted
problems are solved. In contrast to efficiency, effectiveness is determined without
reference to costs and, whereas efficiency means ‘doing the thing right’, effectiveness
means ‘doing the right thing.’”
For this study, the third definition as described by the business dictionary website above will
be used as defining more precisely the outcome which needs to be achieved. As in
described in detail in Chapter 4, the difference in scoring between Importance and Actual
ratings reported by clients will determine the degree to which a set of factors are effective in
addressing a business requirement (problem).
2.3.2 CRITICISM ABOUT EFFECTIVENESS
In a number of seminal works in which Cameron contributed substantially (Cameron, 1978,
Cameron, 2010, Cameron, 1986, Quinn and Cameron, 1983), the difficulties and obstacles
in defining effectiveness is discussed in-depth. In the first of these works (Cameron, 1978)
these difficulties are described. Cameron grouped these difficulties into two major groups,
namely the type of criteria used to measure effectiveness and the sources of the criteria.
Cameron then further elaborated into these two groups. The type of criteria used to measure
effectiveness was described at the hand of four aspects that influence the measuring. The
four aspects are:
i. The culture of the organisation,
ii. If the criteria are universal or specific,
iii. Whether the criteria are normative or descriptive in nature, and
iv. If the criteria quality is static or dynamic.
As for the sources of criteria Cameron stated three aspects that need to be considered.
These are:
i. The groups of influencers which Cameron describes as “constituencies”,
ii. The level of analysis conducted,
iii. The objectivity of using organisational records in contrast to the subjectivity of
perceptions.
Page 30 of 130
In most instances, the degree of success is a subjective judgement. However, many
academic research studies, definitions and theories were developed, culminating in
methodologies that allow some degree of defined measurement to determine if a system or
solution is indeed effective (Hinton and Barnes, 2009, Newkirk and Lederer, 2006, Wu and
Chen, 2006, Ha and Forgionne, 2006, Liebmann, 2001).
The typical research study concentrates on measuring or determining effectiveness within
an organisation, typically this is the organisation that created, or advocates use of the
specific solution. By volume, few studies involve the measure or determination of
effectiveness of solutions that apply beyond the boundaries of the originating organisation,
in other words e-business systems.
2.3.3 MEASURING THE EFFECTIVENESS OF COMPUTER SYSTEMS
One of the very significant works to measure the effectiveness of information systems was
conducted and published in South Africa by Miller and Doyle (1987) in which they studied
the effectiveness of computer systems in the financial services sector. This work is quoted
by several international researchers since 1987 (DeLone and McLean, 1992, Seddon and
Kiew, 1996, Shih, 2004a, Nelson et al., 2005). Additional research was published by Miller
to measure the systems effectiveness in different industry sectors (Miller, 1987, Miller,
1993). These studies were based on a statistical instrument consisting of 38 attributes of
information systems, designed to measure the perceptions in six major dimensions of
information systems’ activities being:
• Type 1 Information Work,
• Type 2 Information Work,
• IS Staff Characteristics,
• IS Strategic Issues,
• User Participation,
• IS Responsiveness to Changing User Needs.
Type 1 and type 2 information work is sub-categorised as follows. Type 1 information work
includes measurement of accuracy, currency, completeness, user confidence, relevance,
timeliness, cost-effectiveness, reliability, availability and security. It thus measures the
operational attributes of information systems. Type 2 information work is concerned with
Page 31 of 130
the availability and usefulness of decision-support data analysis capability and modelling
ability to analyse and evaluate business alternatives. This measures the strategic support
of the information systems for management. It can also be categorised as Type 1
information work describing low-cost, high volume data related transactions, while Type 2
information work defines high-cost, low volume data related transactions aimed more
towards managers and other higher level analytical professionals.
2.3.4 MEASURING THE EFFECTIVENESS OF E-BUSINESS
Liebman (2001) states that the end-user moved from the traditional internal staff to include
the external customer. His article extends to a particularly technical level of monitoring
functions and facilities for being active, responsive and accurate to retain the goodwill of the
customer visiting the e-business site. He contends that it is necessary to consider
automated monitoring tools to support this function.
A comprehensive and complex Decision Making Support System (DMSS) was developed in
order to predict e-business success using simulation modelling (Ha and Forgionne, 2006).
In the discussion and conclusion, the authors clearly find that the DMSS and eventual model
is determined by the actual problem under investigation and not the other way around.
Several limitations were encountered which affected the outcome of the study and
simulation. The conclusion is that for a company to gain competitive advantage in e-
business, the e-business strategy needs to be established effectively and timely. They admit
that substantial validation and expansion is required in the developed software before it can
make a significant contribution to developing and supporting the e-business strategies of
organisations.
Mahmood et al (2008) describe the evidence of the benefits of e-commerce as "anecdotal"
with "little" empirical evidence to support the perceived evidence of e-commerce ventures.
By using diffusion theory to analyse the use of e-commerce, they attempt to create an
exploratory model grounded in IT business value and productivity literature.
Hinton and Barnes (2009) set out to determine effective performance measurement criteria
for e-business. They determined four wider areas of performance which needs
consideration, being:
• Performance of the web site,
Page 32 of 130
• Performance of the business processes,
• Performance of the customers, and
• Linking of the e-business performance to the general business strategy.
The researchers proceeded to establish a set of organisations within which case studies
were conducted to determine performance measurement criteria common to these. Twelve
organisations were identified and engaged for this study, representing a spread of industry
segments and services, from healthcare through port management, legal services and trade
union activities. They concluded that most companies have a tentative and experimental
approach to measuring the performance and effectiveness of their e-business solutions, with
little evidence to prove an underlying framework or methodology of measurement.
2.3.5 MEASURING THE EFFECTIVENESS OF E-BANKING SYSTEMS
There were several studies found which were conducted and published over a period of
more than twenty years. These studies are focussing on the externally facing electronic
banking systems (e-banking). Not all these solutions were necessarily internet based. It
also seems that there is no clear delineation between retail, wholesale and business clients
in these studies. Retail are the normal, single person who owns and uses a bank account
to conduct financial transactions on a regular basis through it. The monetary value of these
are typically low in comparison to that of business and wholesale banking clients. Business
clients are normally not necessarily a person, but is rather a legal entity, using a banking
system to conduct financial transactions focussed towards conducting the day-to-day
business requirements. These transactions are typically of a much higher monetary value
than those conducted by retail clients, and there may be hundreds, if not thousands of
transactions per day. Wholesale clients are normally the clients who conduct transactions
with very high monetary values, e.g. bank branches and cash processing centres. Selected
research articles are listed in Table 28 in Appendix C. These are further discussed, analysed
and summarised in Chapter 5.
2.4 SUMMARY AND CONCLUSION
From the foregoing analysis of available research conducted which includes measurement
paradigms and models, it becomes clear that there seems much disparity and inconsistency
in determining the effectiveness of e-business solutions. Valuable work has been done in
measuring the effectiveness of internal information systems within the traditional boundaries
Page 33 of 130
of organisations, such as the early work done by Miller (Miller, 1987). These works still need
to be extended to include the testing of e-business systems' effectiveness and performance
against the perceptions of external business partners, which include clients, suppliers and
other external stakeholders. It is planned that this research will extend into the realms of
the customer's benefits realisation, proving that past measurement research done and the
underlying methodologies and models, can be extended and applied outside the self-
imposed boundaries of the organisation whose e-business systems are being measured.
Chapter 4 expands from the literature studied here to form a research approach, hypotheses
and to describe the paradigm followed.
Page 34 of 130
3 DISCUSSION OF THEORETICAL MODELS
3.1 OVERVIEW OF MODELS
It stands to reason that it will be difficult to consider and describe the host of theoretical
models in this paper. There are literally hundreds, if not thousands of theoretical models. A
list of 103 theories is published as had been used in Information Systems studies alone
(Larsen et al., 2015). To remain relevant and limit the volume of this paper, only the theories
encountered in the articles researched are considered in this chapter.
In some cases, is should be noted that research was not always conducted with a specific
theoretical model in mind. This is particularly true of research done in Information Systems
during the 1970 to 1990 period. There were occasionally research methods used and
applied from other research disciplines. It also seems to depend to an extent on whether
the research was positivist or otherwise.
3.1.1 TECHNOLOGY ACCEPTANCE MODEL (TAM)
According to Legris et al (2003), one of the most used theories in IT research is the
Technology Acceptance Model (TAM), which is derived from the original Theory of
Reasoned Action (TRA). The TAM theoretical model is displayed in Figure 4. This model
was initially defined by Davis (1989).
It is based on the psychological perceptions of users regarding the usefulness (PU) and
ease of use (PEOU) of a system. A positive outcome in PU and PEOU tends to lead to
positive outcomes in the attitude (AT) towards a system, and the behavioural intention (BI)
to use the system. Based on the simplicity and ease of applying in a research setting, it is
often favoured by researchers.
Page 35 of 130
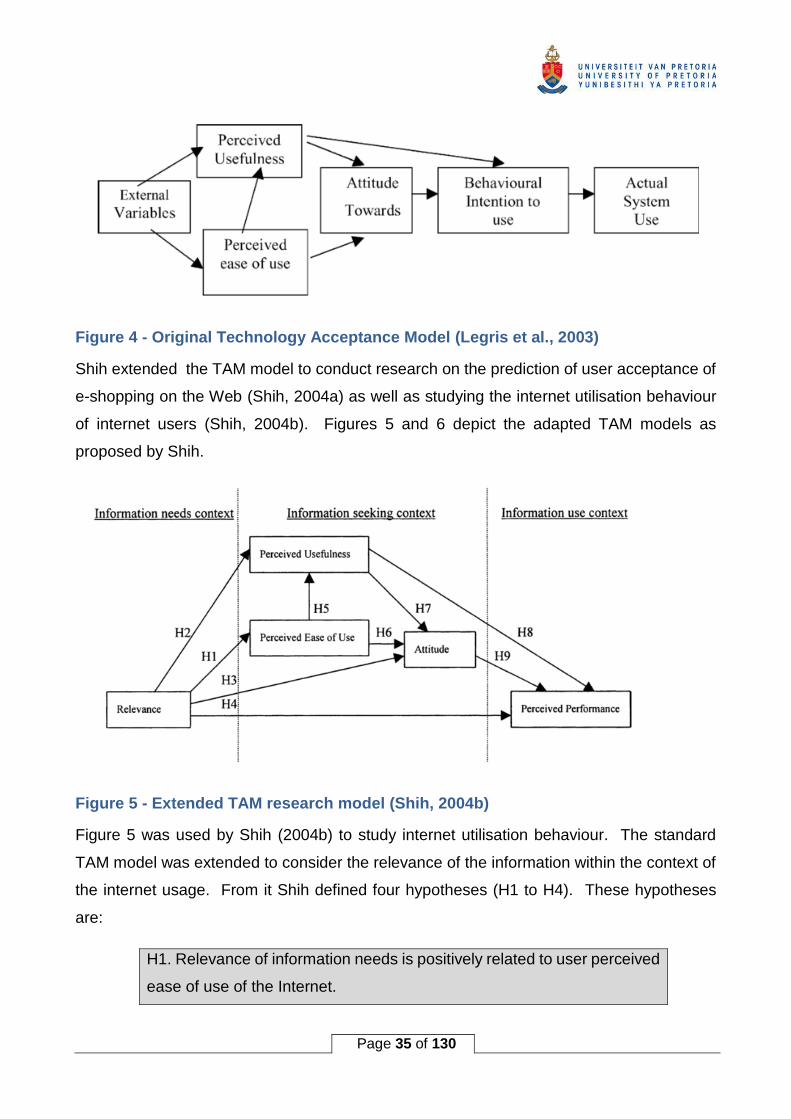
Figure 4 - Original Technology Acceptance Model (Legris et al., 2003)
Shih extended the TAM model to conduct research on the prediction of user acceptance of
e-shopping on the Web (Shih, 2004a) as well as studying the internet utilisation behaviour
of internet users (Shih, 2004b). Figures 5 and 6 depict the adapted TAM models as
proposed by Shih.
Figure 5 - Extended TAM research model (Shih, 2004b)
Figure 5 was used by Shih (2004b) to study internet utilisation behaviour. The standard
TAM model was extended to consider the relevance of the information within the context of
the internet usage. From it Shih defined four hypotheses (H1 to H4). These hypotheses
are:
H1. Relevance of information needs is positively related to user perceived
ease of use of the Internet.
Page 36 of 130
H2. Relevance of information needs is positively related to user perceived
usefulness of the Internet.
H3. Relevance of information needs is positively related to user attitudes
toward using the Internet.
H4. Relevance of information needs is positively related to user perceived
performance of the Internet.
The research result showed that relevance was a strong determinant for perceived
usefulness, perceived ease of use, attitude and perceived performance.
Figure 6 - Extended TAM (Shih, 2004a)
Shih extended the TAM model again in 2004 (Figure 6) when he conducted research into
predicting user acceptance of e-shopping using the web as the medium (2004a). In this
research he used work done by Davis (1993) to include web environmental factors for
quality, security and access cost. Shih defined many hypotheses which tested both the
Perceived Ease of Use (PEOU) and Perceived Usefulness (PU). PEOU was further
subdivided into Perceived Ease of Use of the Internet / Web (PEOUW) and Perceived Ease
of Use of Trading online (PEOUT).
Page 37 of 130
Another extension of the traditional TAM was performed by Mathieson (2001) with the
introduction of a construct which he named "Perceived Resources" (PR) presented in Figure
7. This measures the extent to which an end-user believes they have access to the required
resources to use an information system.
Figure 7 - Extended Technology Acceptance Model (Mathieson et al., 2001)
Mathieson’s (2001) argument is that by isolating Perceived Resources (PR), researchers
have some insight into factors over which users have a degree of control. The research by
Mathieson showed that where a user perceived sufficient resources available, the outcome
of the model did not change from the standard TAM PU and PEOU outcomes. However,
where a user had doubts with regards to the sufficient availability of several resources
needed to use a system, the correlation between PR and Behavioural Intention to Use (BI)
was very strong. PR did not influence Actual System Use (SU) in Mathieson’s extended
TAM model since the required resources are already in place with the system being in use.
The above descriptions of the adaptations to the TAM theory by Shih and Mathieson,
displays the way it can be used and the ease of extending the model to conduct research.
This is especially valuable where the effectiveness or usefulness of information systems, of
which e-business systems forms a specific category, can be studied and documented.
Of the articles researched, the following articles are some using TAM or adaptations thereof
as the theoretical model of choice:
Page 38 of 130
• An analysis of online banking usage intentions: An extension of the Technology
Acceptance Model (Amin, 2009)
• The state of e-banking implementation in Nigeria: A post-consolidation review (Ayo et
al., 2010)
• Adoption of internet banking: an empirical study in Hong Kong (Cheng et al., 2006)
• Users’ Loyalty towards Mobile Banking in Malaysia (Low et al., 2017)
3.1.1.1 TAM2
In 2000, Venkatesh and Davis (Venkatesh and Davis, 2000) published a revision to TAM
called TAM2. This extension is visualised below in Figure 8. The revised TAM model
included two additional constructs being social influence processes and cognitive
instrumental processes. The social influence processes contain constructs such as
“subjective norm”, “voluntariness” and “image”. Cognitive instrumental processes contain
the constructs “job relevance”, “output quality”, “result demonstrability” and “perceived ease
of use”. The authors then explained the purpose and content of each of these constructs.
The definitions are summarised below.
Table 7 - Determinants of Perceived Usefulness (Venkatesh and Bala, 2008)
Determinants Definitions
Perceived Ease of Use The degree to which a person believes that using an IT will be free of effort
(Davis, 1989).
Subjective Norm The degree to which an individual perceives that most people who are
important to him think he should or should not use the system (Fishbein &
Ajzen, 1975, Venkatesh & Davis, 2000).
Image The degree to which an individual perceives that use of an innovation will
enhance his or her status in his or her social system (Moore & Benbasat,
1991).
Job Relevance The degree to which an individual believes that the target system is
applicable to his or her job (Venkatesh & Davis, 2000).
Output Quality The degree to which an individual believes that the system performs his or
her job tasks well (Venkatesh & Davis, 2000).
Result Demonstrability The degree to which an individual believes that the results of using a system
are tangible, observable, and communicable (Moore & Benbasat, 1991).
Page 39 of 130
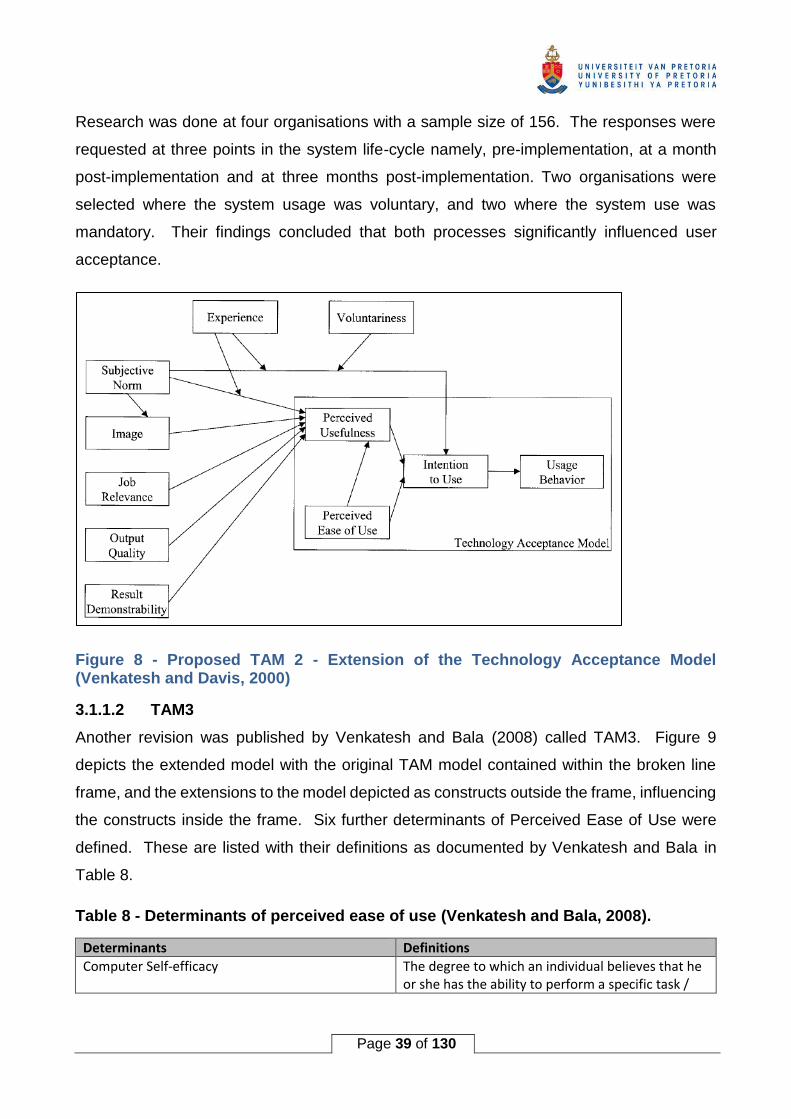
Research was done at four organisations with a sample size of 156. The responses were
requested at three points in the system life-cycle namely, pre-implementation, at a month
post-implementation and at three months post-implementation. Two organisations were
selected where the system usage was voluntary, and two where the system use was
mandatory. Their findings concluded that both processes significantly influenced user
acceptance.
Figure 8 - Proposed TAM 2 - Extension of the Technology Acceptance Model (Venkatesh and Davis, 2000)
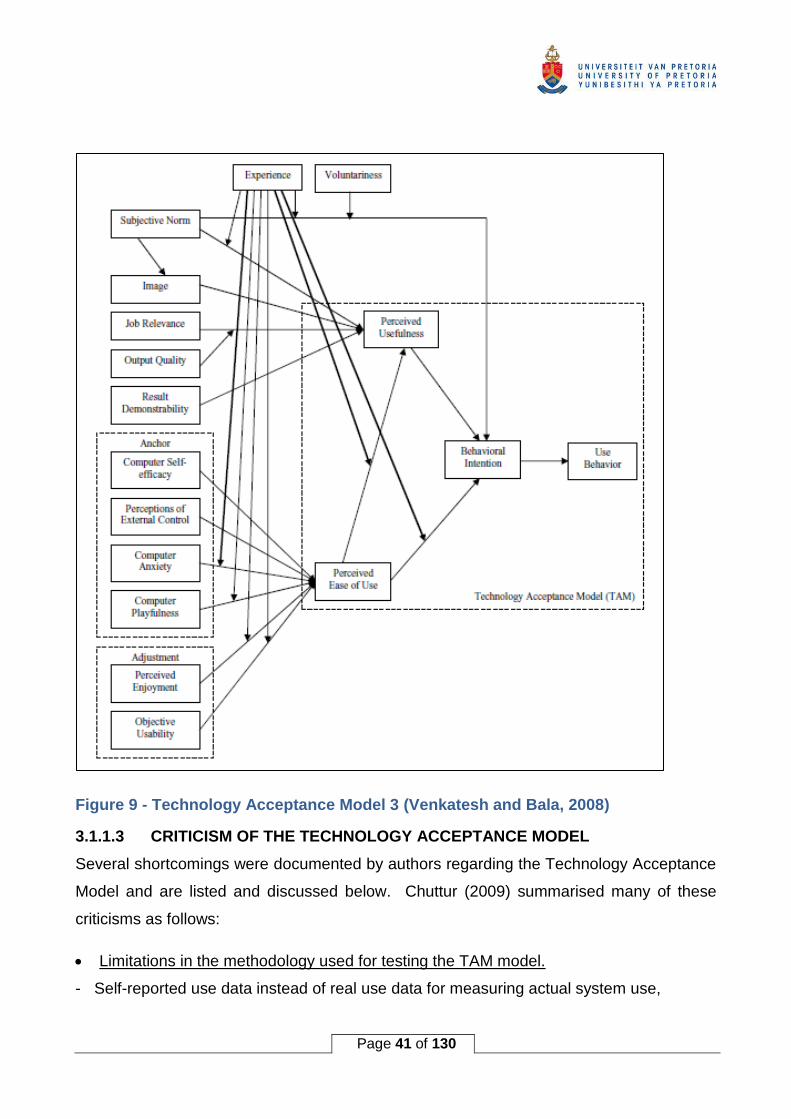
3.1.1.2 TAM3
Another revision was published by Venkatesh and Bala (2008) called TAM3. Figure 9
depicts the extended model with the original TAM model contained within the broken line
frame, and the extensions to the model depicted as constructs outside the frame, influencing
the constructs inside the frame. Six further determinants of Perceived Ease of Use were
defined. These are listed with their definitions as documented by Venkatesh and Bala in
Table 8.
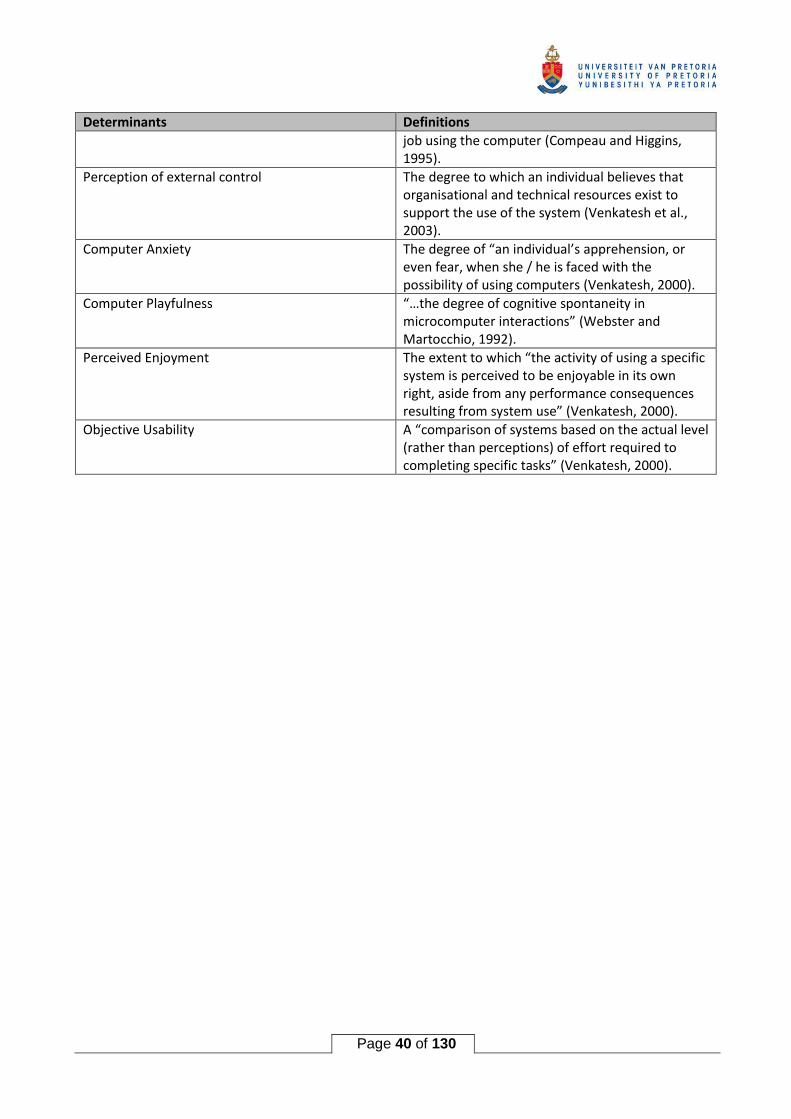
Table 8 - Determinants of perceived ease of use (Venkatesh and Bala, 2008).
Determinants Definitions
Computer Self-efficacy The degree to which an individual believes that he or she has the ability to perform a specific task /
Page 40 of 130
Determinants Definitions
job using the computer (Compeau and Higgins, 1995).
Perception of external control The degree to which an individual believes that organisational and technical resources exist to support the use of the system (Venkatesh et al., 2003).
Computer Anxiety The degree of “an individual’s apprehension, or even fear, when she / he is faced with the possibility of using computers (Venkatesh, 2000).
Computer Playfulness “…the degree of cognitive spontaneity in microcomputer interactions” (Webster and Martocchio, 1992).
Perceived Enjoyment The extent to which “the activity of using a specific system is perceived to be enjoyable in its own right, aside from any performance consequences resulting from system use” (Venkatesh, 2000).
Objective Usability A “comparison of systems based on the actual level (rather than perceptions) of effort required to completing specific tasks” (Venkatesh, 2000).
Page 41 of 130
Figure 9 - Technology Acceptance Model 3 (Venkatesh and Bala, 2008)
3.1.1.3 CRITICISM OF THE TECHNOLOGY ACCEPTANCE MODEL
Several shortcomings were documented by authors regarding the Technology Acceptance
Model and are listed and discussed below. Chuttur (2009) summarised many of these
criticisms as follows:
• Limitations in the methodology used for testing the TAM model.
- Self-reported use data instead of real use data for measuring actual system use,
Page 42 of 130
- Several studies commission students as participants in a controlled environment.
Students are motivated by other factors to real-life motivations, thus the results cannot be
generalised to the real world,
- Most TAM studies consider voluntary use of systems. Most organisations do not offer
the users an alternative but to use the systems prescribed.
• Limitations in the variables and relationships present within the TAM model.
- Perceived Ease Of Use seems to become more important than Perceived Usefulness in
settings where the use of a particular system is mandatory (Brown et al., 2002).
- Burton-Jones and Hubona (2006) found that some external factors like system
experience, age and education level may have a direct influence on system usage.
• Limitations in the theoretical foundation of the TAM model.
It is argued that TAM being presented as a deterministic model assuming that intention
to behave in a specific manner will lead to such behaviour. Bagozzi postulates that an
individual may change his or her mind considering other factors not included in the model
and may take a different course altogether (Bagozzi, 2007).
3.1.2 THEORY OF PLANNED BEHAVIOUR (TPB)
The Theory of Planned Behaviour was described in 1985 by Ajzen (1985) as an extension
of Theory of Reasoned Action (TRA) (Ajzen and Fishbein, 1977). TPB has been the
dominant theoretical model used in human behaviour research for more than thirty years. A
revision of TRA became necessary due to limitations experienced in the original model. The
underlying principal of TPB is that intention leads to behaviour. The stronger the intention,
the more likely that the subject will behave in a predictable manner.
The list of articles in Appendix C, Table 28, includes the following research using TPB as
the underlying theoretical model:
• Factors influencing the adoption of internet banking: An integration of TAM and TPB with
perceived risk and perceived benefit (Lee, 2009)
• Factors influencing the adoption of internet banking (Naimi Baraghani, 2008)
Page 43 of 130
Figure 10 - Theory of Planned Behaviour (Ajzen, 2011)
3.1.2.1 CRITICISM OF THE THEORY OF PLANNED BEHAVIOUR
In a discussion document, Sniehotta et al (2014) listed many objections and criticisms
against TPB. They suggested that, although many of the criticisms are in fact relevant, the
debates on TPB should concentrate on two aspects of the model, namely:
• Concerns about validity
Sniehotta et al (2014) argued that TPB does not sufficiently explain variability in the
behaviour of individuals. They went further by stating that some of the theory’s
propositions are patently false.
• Concerns about utility
In this second aspect of concern, the argument is raised that the TPB does not help
practitioners to create or design useful interventions to human behaviour. It also does
not lend itself to experimental testing. The main point raised is that TPB fails in the
primary function of a theory, namely, not accurately communicating empirical evidence.
Page 44 of 130
3.1.3 UNIFIED THEORY OF ACCEPTANCE AND USE OF TECHNOLOGY
The Unified Theory of Acceptance and Use of Technology (UTAUT) was first described by
Venkatesh et al (2003). UTAUT quickly found favour amongst researchers of Information
Technology topics. The conceptual diagram is depicted in Figure 11.
Figure 11 - Diagram of UTAUT theory (Venkatesh et al., 2003)
The origin of UTAUT came from the study and review of eight theoretical models, being the
Theory of Reasoned Action (TRA), Technology Acceptance Model (TAM), Keller’s
Motivational Model, the Theory of Planned Behaviour (TPB), a combination of TAM and
TPB, the Model of PC Utilisation (MPCU), Innovation Diffusion Theory and Social Cognitive
Theory. Elements from across these eight theoretical models were integrated into the
UTAUT model after obtaining data from four organisations over a six-month period and
applied to the eight models. After design of UTAUT, the same data was applied to the new
model which demonstrated the ability of UTAUT to outperform the eight individual models in
predicting intention and usage.
Of the research articles studied for this paper, the research articles after 2000 seem to favour
using UTAUT as the model of choice. The articles are quoted below.
• Internet banking and customers' acceptance in Jordan: the unified model's perspective
(AbuShanab et al., 2010)
Page 45 of 130
• Understanding the Internet banking adoption: A unified theory of acceptance and use of
technology and perceived risk application (Martins et al., 2014)
• Factors affecting individuals to adopt mobile banking: Empirical evidence from the
UTAUT model (Yu, 2012)
• Measuring the role of website design, assurance, customer service and brand image
towards customer loyalty and intention to adopt internet banking (Rahi et al., 2017)
• Online banking acceptance: The influence of perceived system security on perceived
system quality (Ozlen and Djedovic, 2017)
3.1.3.1 CRITICISMS AGAINST UTAUT
One of the most published and cited authors, Bagozzi (2007) noted that UTAUT is presented
as a model meaning well and being thoughtful. However, it contains “at least” 41
independent variables to predict intention to use and a further eight independent variables
to predict behaviour. He states that these models are increasingly becoming a complex quilt
of piecemeal variables added without due consideration of the impact of these variables
upon one another. Bagozzi (2007)further states that there may be other variables which
were not tested by Venkatesh et al. (2003) which may also be credible. He concludes his
critique by stating five points where the TAM, TPB, TRA and UTUAT methodologies fail on,
namely:
• He identified two critical gaps in the theories: firstly, the intention-behaviour linkage and
secondly, the linkage between individual reactions to using systems.
• The absence of a solid theory and method to identify the determinants of perception.
• The group, social and cultural aspects are not considered in the model.
• The notions of affect and emotions are over-simplified.
• No consideration of self-regulating processes in the deterministic framework.
3.1.4 OTHER METHODOLOGIES USED
3.1.4.1 RANDOM UTILITY MODELS
Random Utility Models (RUM) were developed from probabilistic choice models. It was
developed by psychologists characterise inconsistencies observed in human behaviour
(Manski, 1977). McFadden embraced these models in the late 1960’s, and used then in
Page 46 of 130
econometric representations. His development work continued over several decades
(McFadden, 1980).
It is not a methodology or model used often in information systems research. Of the articles
studied, one was found to use the RUM model (Xue et al., 2011).
3.1.4.2 DELPHI
Delphi started off for military use in the 1950’s (Project Delphi), to obtain the input from
experts on particular subjects. This research technique was documented by Linstone et al.
in 1972, and subsequently revised by the same authors in 2002 (Linstone and Turoff, 2002).
Delphi is a forecasting method which utilises questionnaires sent out to a panel of experts
at separate intervals. The results are aggregated anonymously and shared with a group.
One of the research articles studied, used Delphi as the underlying methodology, namely
Identifying effectiveness criteria for Internet payment systems (Shon and Swatman,
1998). The study was done in Australia using 19 experts, conducting two rounds of
questionnaires to determine a clear and concise set of effectiveness indicators.
The strengths, weaknesses or critiques on Delphi were not explored as it seems not to be
used often for Information Systems research.
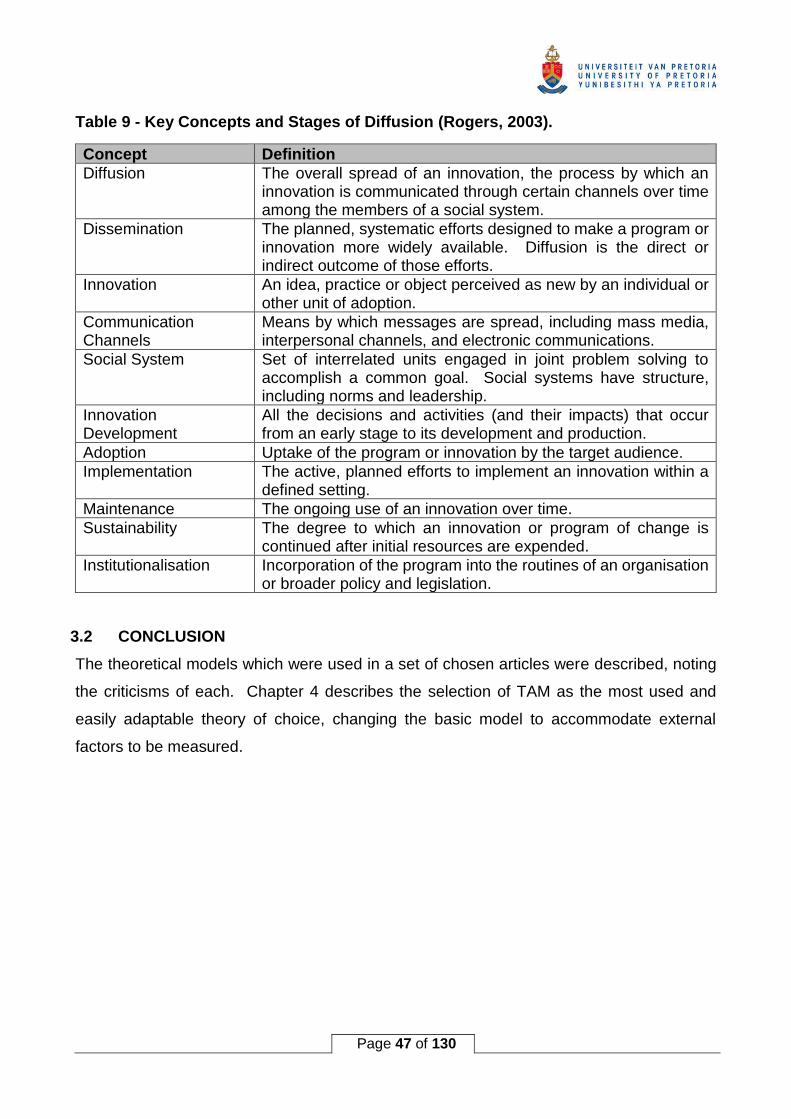
3.1.4.3 INNOVATION ADOPTION THEORY
This theory is not used frequently with Information Systems research, when compared to
the well-known theories such as TAM and UTAUT. Described by Rogers and Shoemaker
(1983) originally, Rogers published several revisions. The fifth edition was published (2003)
describing many clarifications, extensions and in particular, the application of the theory in
multiple disciplines. The key concepts are reflected in Table 9. The innovation Adoption
Theory is primarily concerned with the dissemination and diffusion of innovations in social
groups. It was borne by the fact that it often takes extra-ordinarily long to introduce new
innovations into the mainstream. The theory describes characteristics which need to be
considered, as well phases which innovations pass through during adoption. By being
aware of these and actively planning and executing the requirements, an innovation can be
disseminated much more rapidly than what is customary.
Page 47 of 130
Table 9 - Key Concepts and Stages of Diffusion (Rogers, 2003).
Concept Definition
Diffusion The overall spread of an innovation, the process by which an innovation is communicated through certain channels over time among the members of a social system.
Dissemination The planned, systematic efforts designed to make a program or innovation more widely available. Diffusion is the direct or indirect outcome of those efforts.
Innovation An idea, practice or object perceived as new by an individual or other unit of adoption.
Communication Channels
Means by which messages are spread, including mass media, interpersonal channels, and electronic communications.
Social System Set of interrelated units engaged in joint problem solving to accomplish a common goal. Social systems have structure, including norms and leadership.
Innovation Development
All the decisions and activities (and their impacts) that occur from an early stage to its development and production.
Adoption Uptake of the program or innovation by the target audience.
Implementation The active, planned efforts to implement an innovation within a defined setting.
Maintenance The ongoing use of an innovation over time.
Sustainability The degree to which an innovation or program of change is continued after initial resources are expended.
Institutionalisation Incorporation of the program into the routines of an organisation or broader policy and legislation.
3.2 CONCLUSION
The theoretical models which were used in a set of chosen articles were described, noting
the criticisms of each. Chapter 4 describes the selection of TAM as the most used and
easily adaptable theory of choice, changing the basic model to accommodate external
factors to be measured.
Page 48 of 130
4 RESEARCH CONSIDERATIONS AND STRUCTURE
4.1 BACKGROUND
In Chapter three, the various theoretical methodologies encountered in the literature
reviewed, was described, together with criticisms of the mostly used methodologies. In this
chapter, the various research considerations are covered. Each concept is described
shortly, and the selected concept is described. The reasons for choosing specific
approaches, theories and paradigms is also stated in the descriptions.
4.2 OVERVIEW OF RESEARCH PARADIGMS
4.2.1 INTERPRETIVISM
More recently the interpretive approach seems to gain in favour (Myers, 2009). The
outcomes are based on the interpretation of respondents in their respective environments
and based on their personal perceptions of the concepts studied in each environment. They
attempt to understand phenomena through the meanings that people assign to them.
4.2.2 POSITIVISM
With positivism, objective numbers are studied, whether these numbers are measurable
properties, e.g. counts, values, ordinal values, etc. This approach normally starts with a
theory, and then attempts to prove the theory.
4.2.3 CRITICAL RESEARCH
Critical research studies the social interaction, identifying patterns of power and control in
a social setting. This study is not a social interaction study, but indicative of the perceptions
of a community of users of a specific class of systems (e-business systems), and how these
perceptions impact the attitudes and behaviour of the users of this class of systems.
4.2.4 INDUCTIVE VERSUS DEDUCTIVE REASONING
It is also necessary to differentiate between inductive and deductive reasoning. Inductive
reasoning is where the researcher starts from the “bottom up”, analysing and studying the
data collected, recognises patterns and trends, then formulates theories based on the
findings. Deductive reasoning, closely related to the positivist approach, is the process
where the researcher works from the “top down” by stating a problem, starts with a theory,
forms one or more hypotheses, then conducts the research to either prove or disprove the
theory and one or more hypotheses.
Page 49 of 130
4.2.5 PREFERRED PARADIGM
This research study will use the positivist approach as the underlying paradigm during the
research design and execution. Since this research starts with a problem, not knowing the
effectiveness of e-banking systems used in South Africa, the reasoning is deductive. The
selected paradigm is not chosen for any reason other than the convenience and fitting the
available research and the research conducted for this paper.
4.3 RESEARCH METHODOLOGY
The Technology Acceptance Model (TAM) was chosen as the theoretical model of choice,
despite various criticisms against it. The reasons to use TAM as the methodological basis
for this research is:
• It is a relatively easy methodology to understand and use,
• It is easy to change, extend or modify the methodology without losing meaning,
• It is adaptable enough to fit into several research paradigms without enforcing a
specific approach.
4.4 HYPOTHESES
Aside from the normal Perceived Usefulness and Perceived Ease of Use presented by the
TAM methodology, seven external variables were identified which would provide
understanding of the importance and actual performance of e-banking systems used by
South African businesses. These seven variables are based on 32 factors, each of which
belongs to one of the seven variables listed below. The source and selection of the 32
factors in the survey is described below in Paragraph 4.6.1.
i. Accuracy of e-business functions.
ii. The speed at which functions are executed.
iii. The availability of the needed functions.
iv. The cost-effectiveness of functions required from the e-business solution.
v. The security and privacy capabilities of the e-business function.
vi. The responsiveness of the bank / supplier to support the e-business solution.
vii. Innovativeness displayed by the bank considered.
The hypotheses decided upon are:
Page 50 of 130
H1: The perceived usefulness (PU) of the e-business solution positively impacts the
intention to continue using the e-banking solution.
H2: The perceived ease of use (PEOU) of the e-business positively impacts the intention to
continue using the e-banking solution.
H3: The positive experiences of the e-business solution's external variables, positively
affects the intention to continue using the e-business solution. The external variables
are sub-hypothesised by refining to the following variables:
H3a: Accuracy of information
H3b: Speed of execution
H3c: Availability of functions
H3d: Cost effectiveness
H3e: Security to Access and protection of privacy
H3f: Responsiveness to requests
H3g: Innovativeness
Page 51 of 130
4.5 RESEARCH MODEL
The research model derived by modifying the standard TAM model is pictorially described
below.
Figure 12 - Adapted TAM model
Apart from including the seven external factors playing a role in the research model, the item
“Intention to use” is changed to “Intention to continue using”. The reason for this change is
because of the studied e-banking systems already being in use by clients, in many cases
for many years. The purpose of the research is to determine how effective the systems in
use are.
4.6 RESEARCH INSTRUMENTS
The data used to validate this research was obtained by using a three-pronged approach.
Firstly, data was obtained directly using a research survey distributed via e-mail to South
African businesses using e-banking. Secondly, data was extracted from a set of research
articles done for a similar purpose with matching hypotheses or research objectives. The
third source of research data was obtained by conducting a direct comparison of the data
received and analysed in this research to the results obtained by Miller and Doyle (1987).
Page 52 of 130
4.6.1 SURVEY
A copy of the survey distributed for completion is available in Appendix B. The survey items
were derived by using the research survey designed by Miller and Doyle (1987) to determine
the effectiveness of information systems of financial institutions. The Miller and Doyle
research survey was modified by removing all factors related directly to internal information
systems, and by adding 7 factors related to modern, outward facing e-banking systems. The
32 subject-related questionnaire factors, reflected in appendix B, were designed to measure
values on a Likert scale between one and seven, with one being particularly low and seven
being very high. A score of four is considered as neutral. The 32 factors are aimed at
providing measurements for the seven identified external variables as listed above in
paragraph 4.4, as well as for the two additional variables, Perceived Usefulness and
Perceived Ease of Use, as per the adjusted TAM model proposed. A section requesting
additional data is also included to provide demographic context to the survey, requesting the
economic sector, retail business type, geographical region in which the retailer resides, and
other contributing factors of interest. The results obtained from the survey answers are
analysed using elementary statistical analysis to determine the mean scores in different
dimensions, the standard deviation between associated variables, and to calculate the
Pearson’s correlation coefficient (r) at different levels of aggregation. The correlation
between the two sets of scores, Importance and Actual, is of specific importance as a
measure of determining the effectiveness of the e-banking systems used by external clients.
The advantages and disadvantages of using a questionnaire to obtain input have often been
debated. Hackett (1981) states that surveys may be subjected to the following weaknesses
and limitations:
• It may be easy to misuse,
• The depth obtained from interviews is not achieved,
• It can be applied inappropriately,
• It can become expensive in money and time to conduct,
• The information collected may be superficial or inadequate, and
• It may be subjected to low response rates.
Page 53 of 130
Despite the above disadvantages, it is still the best means to reach a relatively large
population group within a limited time. If the questions are formulated properly and validated
well enough, the results need not be biased or inadequate.
Advantages of using survey questionnaires include:
• A wide coverage can be achieved for the results to be used to form generalised
conclusions.
• A lot of data can be assembled and interpreted in a short period of time at relatively low
cost.
• It is easy to replicate the research for validation or in later longitudinal studies with an
expected consistent outcome.
• Interviewer bias is eliminated.
4.6.2 SYSTEMATIC LITERATURE REVIEW
A second source of data was obtained by conducting a systematic review of the literature,
specifically limited to e-banking acceptance or satisfaction. The process of selecting
relevant research literature is described in Paragraph 5.2 in Chapter five.
4.6.3 DIRECT COMPARISON TO MILLER AND DOYLE (1987)
This third leg of research was done to validate the outcome of this research against the
findings by Miller and Doyle (1987), and to ensure that the survey was independent, robust,
reliable and complies to the rigour requirements of research.
4.7 DATA COLLECTION
Data collection was done using the internet survey facility, Qualtrics, to publish the survey.
Clients were invited by sending mass e-mail to independently sourced clients to participate
in the survey, with a link to the specific website included, which routed the clients to the
correct survey page directly and effortlessly. The processing and outcome of the data
collection is described in Chapter 5.
4.8 DATA ANALYSIS
The analysis of the data collected from various sources and using a variety of measures, is
discussed in Chapter 5. The factor analysis is done on the results obtained from a research
survey distributed via e-mail businesses in South Africa. The substantially improved and
Page 54 of 130
advanced statistical functions in Microsoft Excel 2016TM were used to determine the mean
scores, calculate the correlation coefficients and standard deviations.
4.9 ETHICS
4.9.1 LEGAL
The researcher intends to protect all legal rights as may be relevant of all participants and
affected stakeholders during the research process. This includes the right to the protection
of personal information, protecting possible copyrights and patents, and not divulging trade
secrets or strategies which are used to commercially benefit any participant contributing to
this research.
4.9.2 BUSINESSES’ RIGHTS
The rights of the businesses participating will not be compromised as to remaining
anonymous. This right will be honoured throughout the research process. Furthermore, the
research results in all forms will be presented upon request to the businesses for scrutiny
and comment before distributing, submitting or publishing.
4.9.3 INDIVIDUALS' RIGHTS
As per Oates (2005), the rights of individuals are:
• All individuals will have the right to decline participation in interviews.
• Individuals have the right to withdraw from an interview if they wish to not participate any
longer.
• Individuals are given the opportunity to provide informed consent.
• All individuals have the right to remain anonymous.
• All individuals have the right to confidentiality.
The rights described above will be honoured throughout the research project and thereafter.
4.9.4 RESEARCHER UNDERTAKING
The researcher undertakes the following:
• The researcher will not unnecessarily intrude upon the activities of the participants.
• The researcher will behave with integrity throughout the research. This means not
manipulating data obtained to support the researcher’s case and by recording the data
fully and accurately as supplied by the participants.
Page 55 of 130
• The researcher will follow appropriate, laid down professional codes of conduct as may
be prescribed by professional bodies, as well as the ethics committee of the university.
• The researcher will ensure that no plagiarism is committed, intentionally or otherwise.
If it is required of the researcher to review or participate in the research of another
researcher, to always act ethically by being prompt in reviewing and maintaining
confidentiality of the work reviewed, and by reviewing in a professional manner.
Page 56 of 130
5 DATA ANALYSIS AND FINDINGS
5.1 INTRODUCTION
Since data acquisition was done from three dimensions, the description, analysis and
presentation of the data is discussed in this chapter. Comparisons are done between a
limited set of questionnaire responses as part of this research paper, information obtained
from a set of articles with previous similar research completed, as well as a comparison
between the research data and previous research done in South Africa on Information
System effectiveness in the Financial Sector by Miller and Doyle (1987). Once all this data
is compared, a conclusion is drawn regarding the hypotheses which were presented in
Chapter 4. The analysis of the number of responses (sample size = 47) is not done
exhaustively. Only a limited set of statistical values were calculated and used to compare
to the previous studies as listed above. This was decided since most of the comparative
previous research listed and discussed here, already did exhaustive statistical analysis.
5.2 DATA COLLECTION: A SYSTEMATIC LITERATURE REVIEW
5.2.1 OBTAINING RELEVANT PREVIOUS RESEARCH
Protocol Development
- Research questions
The main research question stated in Chapter 1 was:
“How effective are current electronic banking systems used in South Africa,
based on client experience?”.
From this question one can deduce some keywords to find previous research which can be
used as comparative input. The main keywords decided upon were “e-banking”, “adoption”
and “effectiveness”. Applying these keywords on academic research articles is described
below.
- Search strategy
All the initial searches were initiated from the library portal of the University of Pretoria, using
the link to Google Scholar. Keyword searching was used with an initial broad search and
continuously refined by adding more required keywords until a manageable result set was
obtained. The list of results was then subjected to additional selection steps and criteria.
Importance Actual Linear (Importance) Linear (Actual)
Page 70 of 130
Figure 18 - Group factors - mean scores
• Perceived Usefulness:
Davis (1989) defines PU as: "the degree to which a person believes that using a
particular system would enhance his or her job performance.”
The four factors which were included into this group were:
- Volume of Information Received
- Completeness of Information
- E-business system support in your own strategic planning
- E-business system ability to adapt to your changing needs
The PU score was 5.70 on Importance, but only 4.80 on Actual performance. The
difference between Importance and Actual is fairly large and may indicate that e-banking
systems still lack certain required or useful functionality, which the clients may require. It
may also indicate that some functions are more cumbersome to perform by the clients, than
what they are expected to be.
The r value for PU is 0.87, which is a very strong positive correlation between Importance
and Actual scores for this category. The other statistical results for PU is shown below in
Table 18. It is noted that the Actual scores are persistently lower than the Importance
0.01.02.03.04.05.06.07.0
Graphical representation of scores
Importance Actual
Page 71 of 130
scores. The standard deviation for the Actual scores is significantly larger than the standard
deviation for the Importance scores.
Table 18 - Statistical results for Perceived Usefulness
Measure Importance Actual
Average 5.70 4.80
Mean 5.70 4.78
Median 5.61 4.69
Standard Deviation 0.28 0.46
It could become a worthwhile market research project for banks to determine what is
required by clients that the e-banking systems do not currently cater for sufficiently,
particularly considering the present high competitiveness amongst South African banks with
their e-banking systems and functionality.
From the above calculations and discussion, it is deduced that hypothesis H1 is supported.
• Perceived Ease of Use:
PEOU is defined by Davis in the same paper as: "the degree to which a person believes
that using a particular system would be free of effort.”.
Six factors were used in this group. These are:
- Ease of access to e-business system
- Ease of retrieving information
- Effective training in use of e-business system
- Degree of control over which functions and services are received
- Your own feelings of participation
- Amount of effort to integrate external e-business system into your systems
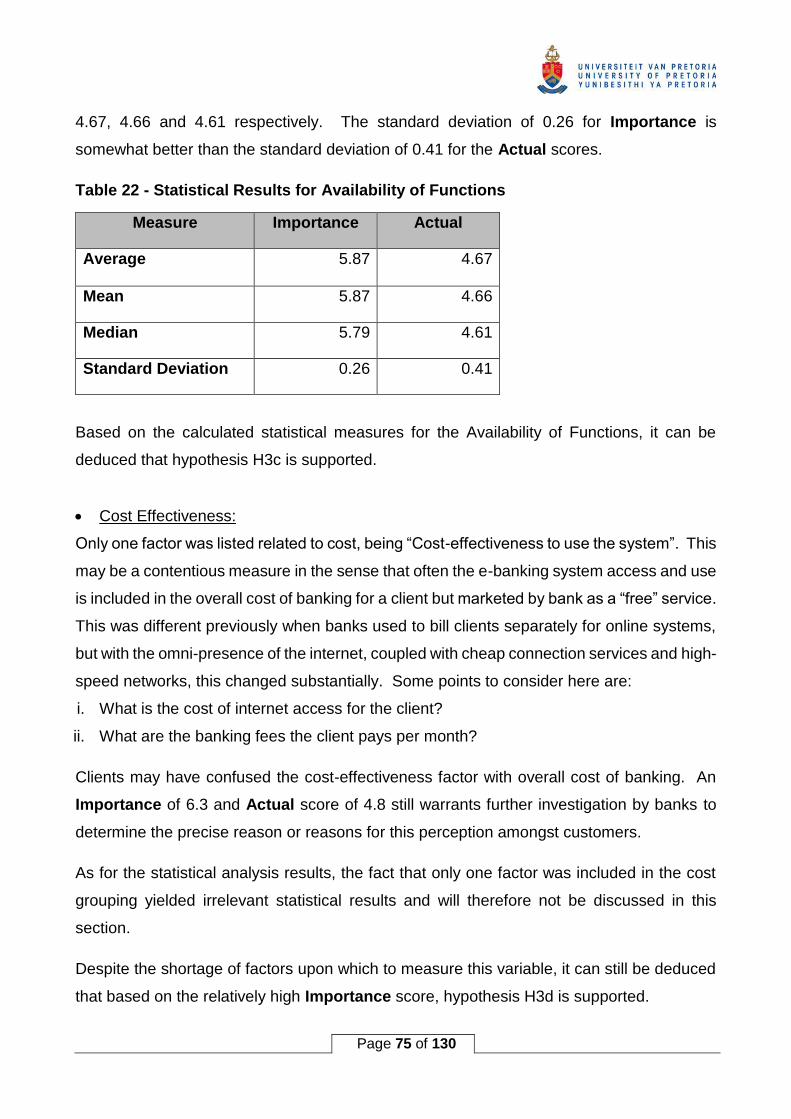
The PEOU Importance score received 5.87 with the Actual score being 4.67, calculated as
an average score for each. The difference of 1.2 points in scoring may be an indication that
Page 72 of 130
clients place a premium on the e-banking systems being easy to use, but that these systems
may be more complex to navigate, understand, and to conclude desired transactions than
what is expected.
An r value of 0.97 between PEOU Importance and Actual scores indicate an almost perfect
positive linear relationship. The rest of the statistical results are shown below in Table 19.
The same trend is noted as for PU, where the Actual scores are consistently lower than the
Importance scores. The standard deviation for Importance at 0.26 but 0.41 for Actual
scores, is like the PU scoring. Although the deviation difference is not exceptionally large,
it is still worth noting. It may indicate actual differences between the e-banking systems of
different banks, but may also be the result of individual differences in scoring due to the
small sample size from which the results are obtained.
Table 19 - Statistical results for Perceived Ease of Use
Measure Importance Actual
Average 5.87 4.67
Mean 5.87 4.66
Median 5.79 4.61
Standard Deviation 0.26 0.41
A further discussion of the differences in score between PU and PEOU is reflected below
against research done by Brown et al (2002).
From the above discussion and findings, it can be deduced that hypothesis H2 is supported.
• Accuracy of information:
Three factors were used to determine and measure, namely “Currency of information”,
“Accuracy of Information” and “Relevance of information for intended use”. Of note is the
fact that clients of e-banking systems scored the Importance rating at 6.1. The Actual
score is only 5.3. These scores are derived from the means of the individual scores for the
three factors for both Importance and for Actual. The difference of 0.8 in actual experience
Page 73 of 130
versus the perception of importance thus means that clients feel that e-banking systems
lack somewhat in the accuracy, currency and relevance regarding the availability of
information against their expectations.
The r value for measuring Accuracy is 0.99. This is a very close correlation between
Importance and Actual scores. Considering the rest of the statistical results in Table 20
below, the standard deviation of 0.33 for Importance compared to 0.32 for Actual scores
are almost identical. It indicates that the clients’ accuracy expectations are generally in line
with actual accuracy delivered.
Table 20 - Statistical Results for Accuracy
Measure Importance Actual
Average 6.11 5.33
Mean 6.10 5.32
Median 5.96 5.13
Standard Deviation 0.33 0.32
Based on the responses and statistical outcome, it is deduced that hypothesis H3a holds
true and is supported.
• Speed of Execution:
The two factors included to define Speed of Execution are “System availability and reliability”
and “Quick and flexible access to required information”. The combination of these two
factors enables clients to fulfil the required tasks with a minimum of delay. It is clear from
the average score on the two factors that productivity and a minimum delay is very important
to clients with the Importance measure at 6.3. With Actual score at 5.0, there seems to be
a rather large difference between what clients want and what they receive. The overall
performance of a system is reliant on various technologies. The reliability of a system, as
well as the quick and flexible access to a system are mostly within the control of the banks.
Availability and network speed is subject to external influences, thus not being entirely within
the control of the banks. Overall it seems that clients generally desire better system
performance then what they receive.
Page 74 of 130
The r value for system speed is a perfect 1.00. This indicates a perfect linear uphill
relationship. It could be caused by the factor grouping consisting only of two factors. This
leaves little room for statistical variance. Standard deviation is particularly low at 0.09.
Table 21 - Statistical results for Speed
Measure Importance Actual
Average 6.30 5.02
Mean 6.29 5.02
Median 6.30 5.02
Standard Deviation 0.21 0.09
Even though only two variables were present in this hypothesis item, the calculated results
lead to accepting that hypothesis H3b is supported.
• Availability of Functions:
Availability of Functions consists of three variables, namely “Availability of Information”,
“Flexibility of information received” and “Ability to support decision-making”. The first two
variables were aimed at measuring the operational performance and delivery aspects of an
e-banking system, while the third factor intends to measure the degree of support at a
strategic decision-making level in the clients’ businesses. The overall score was 5.9 for
Importance, with Actual performance scoring 4.9. Both Importance and Actual scores
were lower in comparison to other groups. It may indicate that clients have alternative
means of obtaining the required information from their own internal systems, and only use
e-banking systems to confirm or reconcile that which they have available.
The Pearson coefficient (r) for the Availability of Functions group of factors is 0.84. This is
a very strong positive correlation between Importance and Actual scores. The average,
mean and median figures for the Functionality group also run very close in both result sets,
i.e. Importance scores are 5.87, 5.87 and 5.79 respectively, while the Actual scores are
Page 75 of 130
4.67, 4.66 and 4.61 respectively. The standard deviation of 0.26 for Importance is
somewhat better than the standard deviation of 0.41 for the Actual scores.
Table 22 - Statistical Results for Availability of Functions
Measure Importance Actual
Average 5.87 4.67
Mean 5.87 4.66
Median 5.79 4.61
Standard Deviation 0.26 0.41
Based on the calculated statistical measures for the Availability of Functions, it can be
deduced that hypothesis H3c is supported.
• Cost Effectiveness:
Only one factor was listed related to cost, being “Cost-effectiveness to use the system”. This
may be a contentious measure in the sense that often the e-banking system access and use
is included in the overall cost of banking for a client but marketed by bank as a “free” service.
This was different previously when banks used to bill clients separately for online systems,
but with the omni-presence of the internet, coupled with cheap connection services and high-
speed networks, this changed substantially. Some points to consider here are:
i. What is the cost of internet access for the client?
ii. What are the banking fees the client pays per month?
Clients may have confused the cost-effectiveness factor with overall cost of banking. An
Importance of 6.3 and Actual score of 4.8 still warrants further investigation by banks to
determine the precise reason or reasons for this perception amongst customers.
As for the statistical analysis results, the fact that only one factor was included in the cost
grouping yielded irrelevant statistical results and will therefore not be discussed in this
section.
Despite the shortage of factors upon which to measure this variable, it can still be deduced
that based on the relatively high Importance score, hypothesis H3d is supported.
Page 76 of 130
• Security and Protection:
Security and Protection is measured against two factors, namely “Confidence in System”
and “System Security and Privacy”. The “Confidence in System” addresses the aspect of
Trust, whilst the “System Security and Privacy” considers the safety within the system to
safely and securely conduct financial transactions and other functions free from
interceptions by cyber-crime. It also addresses the fact that clients require their information
to be securely and safely protected from digital theft and for illicit purposes. This group of
factors is the group that obtained the highest Importance rating at 6.5. The Actual score
ended at 5.6 which is much lower than expected. It possibly indicates a detectable
scepticism in the protection of personal details by clients. It warrants further research to
determine the reasons why there is such a difference in scores. As in the case of Speed of
Execution, this group only consisted of 2 factors to measure. This resulted in insufficient
statistical results, with an r value of 1.00. There is also almost no difference between
average, mean and median scoring.
The high score for the Importance measurements still leads to support for hypothesis H3e.
• Responsiveness to requests:
Seven factors relate to Responsiveness to Requests and include the following:
i. “Understanding of the e-business system”,
ii. “Quality and competence of Bank support staff”,
iii. “Communication from Bank staff”,
iv. “Responsiveness to requests for change”,
v. “Quality and competence of bank technical staff”,
vi. “Bank knowledge of your business”, and
vii. “Bank’s positive attitude”.
Although seven factors may seem excessive, considering the number of factors in the other
groups, these seven factors tend to represent the main factors influencing a client’s
perception of the level of client service which is expected or experienced. An Importance
measure of 6.1 means that it is a very important group of factors to clients. However, an
Page 77 of 130
Actual score of 4.7 is much lower than what can be expected from such a set of critical
business functions. Considering the score on each of the seven factors individually, we see
the individual factor score values in Table 23.
Table 23 - Breakdown of Scores for Responsiveness
Factor Importance Actual Difference
Understanding of the e-business system 5.96 5.19 -0.77
Quality and competence of Bank support staff 6.36 4.89 -1.47
Communication from Bank staff 6.09 4.64 -1.45
Responsiveness to requests for change 6.06 4.43 -1.63
Quality and competence of bank technical staff 6.19 4.74 -1.45
Bank knowledge of your business 5.85 4.23 -1.62
Bank’s positive attitude 6.04 4.64 -1.40
It can be noted that from the above breakdown of the response scores, the highest
Importance score was placed on the “Quality and competence of Bank support staff”.
These are the people facing the client and is expected. The biggest difference between
Importance and Actual scores is for the factor “Responsiveness to requests for change” at
-1.63 (Actual lower than Importance). Of the seven factors included in this group, “Bank
knowledge of your business” was rated the lowest in Importance by clients, but still relatively
high at 5.85. An Actual score of 4.23 is still concerning as banks should endeavour to
understand a client’s business better to supply the best possible e-banking experience for
the client.
The r value of 0.37 indicates a weak positive linear relationship between Importance and
Actual scores. In Table 24 one can see that the average, mean and median scores for both
Importance and Actual scores are very close. A standard deviation of 0.15 for Importance
against 0.29 for Actual is also not significant.
Table 24 – Statistical Results for the Responsiveness Group of Scores
Measure Importance Actual
Average 6.08 4.68
Mean 6.08 4.67
Page 78 of 130
Measure Importance Actual
Median 6.06 4.64
Standard Deviation 0.15 0.29
From the above discussion and calculated statistical results it can thus be deduced that
hypothesis H3f is supported.
• Innovativeness:
Innovativeness consists of “The use of modern look and feel interfaces”, “Availability of
models to evaluate alternatives”, “Involvement in future development” and “Regularity of new
functions and features” representing four aspects of continuous renewal and improvement.
This is the group which scored the lowest in both Importance and in Actual at 5.3 and 4.5
respectively. Although it scored lowest of all nine groups, it does not make it insignificant.
A score of 5.3 in Importance is above the neutral point of 4.0, and an Actual score raises
the question whether banks in South Africa are doing enough to satisfy their clients’ desire
for more innovative solutions than the current solutions in place.
Viewing the results from the statistical analysis yields the following results. The r value of
0.92 indicates a very strong positive correlation between the values for Importance and
Actual. The difference in standard deviation of 0.09 for Importance and 0.50 for Actual
indicates that most responses were similar in rating the Importance of innovation. The
standard deviation of 0.50 for Actual tends to indicate that not all clients experience the
innovativeness of the e-banking solutions the same. By further analysing the individual
responses in this group, it was noted that none of the demographic factors influenced the
score specifically. It was found that the Actual scores on factor 17 (Availability of models
to analyse alternatives) and factor 22 (Involvement in future developments) were
substantially lower than the Importance scores. These two factors were scored an average
5.24 for Importance, but just above an average 4.1 for Actual. There was also substantial
variation in scoring with a notable number of respondents scoring 1, 2 and 3 for Actual,
while scoring 5 and above for Importance. This accounts for the higher standard deviation
on Actual scoring. This finding provides sufficient justification for banks to become more
innovative, without increasing risk, to generate new functionalities in conjunction with clients
Page 79 of 130
to solve client business problems. The statistical results for Innovativeness is displayed in
Table 25.
Table 25 - Statistical results for Innovativeness
Measure Importance Actual
Average 5.31 4.51
Mean 5.31 4.48
Median 5.29 4.43
Standard Deviation 0.09 0.50
Based on the relatively high score for the Innovativeness variable, it is deduced that
hypothesis H3g is supported.
• PU and PEOU score: Additional discussion
Brown et al (2002) found that where systems were used for a period, and was mandatory to
use in an organisation, the Perceived Ease of Use score seems to consistently be higher
than the Perceived Usefulness score. They concluded that this may be due to the PU factors
becoming less important as they do not have a choice to use the system, thus reverting to
place more value on the PEOU aspects of the system. Viewing the results obtained in Figure
16, the Importance factors of the questionnaire results obtained, supports this finding where
the PEOU score is 5.9 while the PU score is 5.7. This may be due to the fact, that in all
cases the e-banking system had already been in use for several years, and that there is no
possibility of operating without it anymore. It therefore became a “mandatory” system to use
in client businesses. However, the Actual scores were the other way around with the
Perceived Usefulness scoring 4.8 and the Perceived Ease of Use factors scored at 4.7. The
difference is not significantly high but may indicate that developers of e-banking systems
concentrate a little more on Usefulness instead of Ease of Use functionality. In general
industry terms, this is referred to as building “value-add” into the presented product. In this
research, the Brown et al findings are therefore contradicted.
Page 80 of 130
5.3.2 CONCLUSIONS FROM OWN RESEARCH CONDUCTED
Based on the strong correlations obtained from the elementary analysis done on the
research as documented above, it can be concluded that all the hypotheses as stated in
Chapter 4 are all supported. Each hypothesis was also indicated as supported individually
in the detailed discussion above.
5.4 COMPARISON TO PREVIOUS RESEARCH ARTICLES
5.4.1 BACKGROUND
Since this research is conducted using TAM, it makes sense to first look at the research
papers that also used TAM as the theoretical model. Of the papers, nine international and
one South African paper used TAM. Of the nine international papers, three could not be
used with reasons as listed in 5.2.1. There were thus seven research articles which can
used to compare directly on at least Perceived Usefulness and Perceived Ease of Use.
The rest of the articles were scanned to determine if any of the hypotheses correspond to
the hypotheses formulated for this research. These are listed, and the outcome compared
to the outcomes obtained from this research done. If wide differences are found between
corresponding measures, these will be noted as possible later research subjects.
5.4.2 FACTOR COMPARISONS
Of the nine listed factors in this research, no reference of measure could be found for any
of the three concepts, being Accuracy of the system, Functionality or Responsiveness of the
bank staff. Quality of the Internet connection was originally included in the original research
by Pikkarainen et al (2004). This corresponds with the System Speed factor of this research.
After the initial factor analysis, Pikkarainen et al decided to exclude their variable for Quality
of Internet Connection. The five remaining factors had corresponding research questions
or variable against which a comparison can be ventured.
The most likely and best documented variables are Perceived Usefulness and Perceived
Ease of Use. Nine TAM research articles measured these two items, and in all cases both
concepts were supported by the outcomes obtained from the research. By considering the
high mean scores received for both Importance and Actual performance in this research,
the scores also support both variables.
Page 81 of 130
The only research that included variables to measure the cost of the e-banking system
solution was the work done by Tan et al (2010). Their finding supported the research that
the cost of the solution impacts the client’s intent to use the system. The corresponding
factor measurement in this research also supports the impact of cost on the client’s intent to
continue using the system. Importance scored a mean score of 6.34 while Actual
performance scored 4.77
Security and Protection was also measured by eight of the research articles considered.
Only Ayo et al (2010) documented research where this variable was not supported. The
other seven articles all supported the various hypotheses regarding Security and Protection
(also known as Risk) negatively impacting the clients’ intention to use the system. The very
high mean scores of Importance at 6.5 and Actual performance at 5.6 reported for this
research paper also corresponds to the findings of the articles used.
The last factor which had corresponding research is that of Innovativeness. Al-Jabri and
Sohail (2012) considered the acceptance of mobile banking by clients in Saudi-Arabia. They
concluded that innovation positively impacts the clients’ intention to use new technology for
the perceived benefits it may hold. The mean scores for this research is an Importance
value of 5.3 and an Actual performance of 4.5. It corresponds to the research finding of Al-
Jabri and Sohail.
5.5 COMPARISON SPECIFICALLY TO MILLER AND DOYLE
Since the initial work done by Miller (Miller, 1987, Miller, 1993), and specifically the work
done by Miller and Doyle in the Financial Sector (1987), regarding the measurement of
Information Systems effectiveness in use by businesses, played a significant role in forming
the questionnaire and hypotheses of this research, it warrants a separate section to compare
the outcomes of the historical Miller and Doyle findings to the findings of this research. For
this comparison to be meaningful, the factors used by Miller and Doyle needed to be mapped
to the similar factors used in the questionnaire for this research. This mapping allows the
e-banking questionnaire results to be compared within the same seven groups that Miller
and Doyle grouped and reported their findings. The Miller and Doyle questionnaire
consisted of 38 factors which had to be rated by internal users of companies in two
dimensions, being Importance and Actual performance. The questionnaire for this
research consisted of 32 factors which required to be scored in the same two dimensions
Page 82 of 130
by clients using e-banking systems in their businesses. The scoring was on a Likert scale
from one to seven with one representing an irrelevant factor, four being a neutral position
and seven being a critically required factor. Two of the Miller and Doyle factors (eight and
fourteen) were not allocated to a specific group, thus were not considered in the results
calculated. This questionnaire had six factors not originally in the Miller and Doyle
questionnaire. This is due to client-facing e-banking systems in the modern internet era has
additional relevant factors to consider. These factors are 4, 9, 15, 17, 23 and 32. These
were allocated into the matching Miller and Doyle groups for consideration, just as some
Miller and Doyle factors were excluded from this research questionnaire since they are not
relevant in client-facing e-banking solutions. The mapping of the questionnaire factors used
in this research to the factors as per the Miller and Doyle questionnaire is presented below
in Table 26.
Table 26 - Miller Questionnaire to E-banking Questionnaire mapping
Miller
#
Miller Factor Miller
Grouping
E-banking
#
E-Banking Factor
1 Availability & Timeliness of
reports
1 1 Availability of Information
4 Volume of output provided 1 2 Volume of Information received
11 Currency of output information 1 5 Currency of available information
18 Accuracy of output information 1 8 Accuracy of information
26 Completeness of output 1 12 Completeness of information
30 Relevance of report content 1 14 Relevance of information for
intended use
35 Development of more monitoring
systems
1
36 Development of more exception
systems
1
7 Use of steering committee 2
19 Preparation of a strategic plan for
IS development
2
28 Setting of system priorities in line
with organisational objectives
2 26 E-business system support in
own strategic planning
32 Modern database technology 2
Page 83 of 130
Miller
#
Miller Factor Miller
Grouping
E-banking
#
E-Banking Factor
33 Top management involvement in
defining and monitoring IS
policies
2
34 Overall cost effectiveness for IS 2 16 Cost effectiveness to use the
system
3 Communication between IS and
Management
3 20 Communication from bank staff
17 User confidence in systems 3 7 Confidence in system
21 Degree of personal control for
which IS services are received
3 28 Degree of control over which
functions and services are
received
22 User's feeling of participation 3 29 Your own feelings of
"participation"
27 Users’ understanding of systems 3 13 Understanding of the e-business
system
5 Prompt processing of change
requests
4 21 Responsiveness to requests for
change
9 IS support for new user proposals 4 22 Involvement in future
developments
12 Short lead time required for new
systems development
4
23 Flexibility of data/reports
available
4 10 Quick and flexible access to
information
29 System responsiveness to
changing user needs
4 31 E-business system's ability to
adapt to your changing needs
10 Ease of access for users to
computer facilities
5 3 Ease of access to e-business
system
16 Effective user training programs 5 25 Effective training in use of e-
business system
37 Development of more analysis
systems
5 18 Ability to support decision-
making
38 Development of more enquiry
systems
5
5 4 Ease of retrieving information
5 9 Flexibility of information received
Page 84 of 130
Miller
#
Miller Factor Miller
Grouping
E-banking
#
E-Banking Factor
5 17 Availability of models to analyse
alternatives
5 32 Effort to integrate external e-
business system in your own
systems
2 Quality & Competence of
Systems Analysts employed
6 19 Quality and Competence of bank
support staff
15 High degree of technical
competence in IS
6 24 Quality and competence of bank
technical staff
20 User-oriented Systems Analysts
who know user operations
6 27 Bank knowledge of your
business
24 Positive IS attitude towards users 6 30 Bank's positive attitude towards
clients
31 Increasing IS department effort
for new systems
6
6 15 Use of modern look and feel
interfaces
6 23 Regularity of new functions and
features added
6 Efficient running of current
systems
7
13 Low % downtime 7 6 System availability and reliability
25 Data security & privacy 7 11 System security and privacy
8 IS Department profitability
14 Improving of new systems
development
The main comparison was done in the seven groups of scores as defined by Miller and
Doyle, and using the corresponding factor mapping of Table 26, the results were calculated
using the mean of scores for both Miller and Doyle and for this research’s responses.
Page 85 of 130
Table 27 - Means comparison between Miller and Doyle, and this research
Miller This Research
Group Description Importance Actual Importance Actual
1 Operational Systems 5.50 4.85 5.95 5.08
2 Strategic Issues 5.31 4.43 5.66 4.26
3 End User Involvement 5.47 4.23 5.80 4.44
4 Responsiveness 5.33 4.09 5.56 4.07
5 End User Computing 5.42 3.97 5.61 4.39
6 IS/Bank Staff Quality 5.54 4.58 5.68 4.36
7 Reliability of Service 5.83 4.71 6.44 5.21
The correlation between the two sets of results is astounding for the Importance rated by
clients, and strong for the Actual performance achieved. The Miller and Doyle study was
published in 1987, exactly 30 years ago at the time of this writing. The outcome in Table 27
does indicate that although technology had advanced substantially, the basic elements are
still almost equally important, albeit for Miller and Doyle using internal users to complete
their survey, whereas this research concentrates externally to clients using e-banking
systems. The correlation coefficient for the Importance factors calculates to 0.91, and for
the Actual performance factors to 0.75. It indicates an exceptionally strong correlation on
the Importance factors, and a very strong correlation on the Actual performance factors.
The Reliability of Service measurement indicates a much higher score for both
Importance and Actual performance. This can possibly be indicative of the modern usage
and aspects, as well as omnipresence of information systems, particularly e-business, which
is becoming a core requirement to companies, indicating that reliability has become much
more important than three decades ago.
5.6 FINAL RESEARCH CONCLUSION
This chapter started by discussing the steps to be taken to analyse the research. The search
strategy to obtain articles specifically applicable to the research objective was also described
in detail. This indicated how the number of articles were decided upon.
The next section analysed the results obtained from the survey distributed to e-banking
clients in South Africa. The responses received were processed based on elementary
Page 86 of 130
statistical analysis. The results for every variable measured supported all the hypotheses
stated in Chapter 4.
The third section then compared the research findings for similar variables as for this
research paper from the selected articles in the first section to the findings of this research.
It was found that the variables Perceived Usefulness, Perceived Ease of Use, Cost
Effectiveness, Security and Protection and Innovativeness were addressed. In all cases the
supported hypotheses of this research were also supported for similar variables in the
articles studied.
The final section cast the individual factors from the survey into the different groups as were
defined by Miller and Doyle (1987). The hypotheses findings by Miller and Doyle were then
compared to the findings from this research. The comparison between the groups were
remarkably correlated. In all cases the Importance and Actual performance scores for this
research were higher than the findings from Miller and Doyle. Considering that their
research was done thirty years ago, and conducted on internal staff using internal
information systems, can account for the general higher scores for this research.
Technology had moved on, and information system, both external and internal, are more
integrated in businesses than were the case in 1987. This comparison and positive
correlation between the two sets of research results seems to support the Miller and Doyle
research, as well as lends support and credibility for this research effort.
Page 87 of 130
6 CONCLUSION AND SUGGESTED FUTURE RESEARCH
6.1 ANSWERING THE RESEARCH QUESTIONS
The main research question was:
How effective are current electronic banking systems used in South
Africa, based on client experience?
Based on the research conducted, as well as comparison of these results against previous
research, supplies a measurable and repeatable answer to the main research question.
Since the mean values on all variables for the Actual performance of e-banking systems
was 4.91, it can be accepted that the current e-banking systems are effective in supplying
solutions to standard banking requirements. It needs to be noted that there is substantial
room to improve the effectiveness of e-banking systems, based on the Importance mean
score of 6.01 on all variables combined. The Pearson correlation coefficient between
Importance and Actual scores is 0.69, which is a strong positive correlation between the
Importance and Actual performance scores.
Two sub-questions which were formulated are:
• How can "effectiveness" of e-banking systems be quantified in a standardised and
understandable manner?
• Can an objective method of measuring effectiveness guide the creators of e-banking
solutions, to create outward facing electronic banking systems with an increased
probability of acceptance by a wider business audience?
These two sub-questions are also answered satisfactorily. Despite general pessimism and
reservations held regarding the measurement of systems effectiveness as described in
Chapter 2 by Cameron (2010), it is possible to devise instruments that supply an objective
and measurable means to determine the effectiveness of e-banking systems. The tool
developed and used in this research made use of two approaches namely, the well-known
Technology Acceptance Model which was adapted for use with systems already used for
some time, and a relatively old technique which was used to determine effectiveness of
information systems thirty years ago, adapted to evaluate more modern externally facing
client-oriented electronic banking systems.
Page 88 of 130
The research objectives listed in Chapter 1 were:
• Determine the effectiveness of e-banking systems from the perspective of the end-user,
represented by a mix of businesses in South Africa.
• Correlate these effectiveness findings with similar findings obtained from previous
research.
• Obtain an understanding of the different methods used to measure effectiveness of
systems, particularly considering the reliability and repeatability of each method.
In all three cases, the objectives were satisfied. As described above, an instrument was
developed and used, based on previous research, that contained comparative
measurement criteria. This instrument was also plied into the TAM methodology, adjusted
to cater for the fact that e-banking systems had been in use for many years. Intent to use
is thus no longer applicable but is replaced with Intent to continue using. The findings
from this research was compared to previous similar research. This comparison yielded
strong positive correlation for all variables measured. An understanding was formed of
previous methods used to determine effectiveness of e-business systems. The benefits and
shortfalls of each was covered and described in Chapter 2.
6.2 CONTRIBUTION TO THE BODY OF RESEARCH
It is believed that this research study has proven that an objective, measurable and
repeatable instrument can be devised to establish the effectiveness and shortcomings of
externally facing systems. Although this research concentrated only on e-banking systems,
it is believed that the factors measured and scored are of a sufficient generic means, such
that these research steps and methodology can be replicated in other industry sectors
without compromising any of the quality.
6.3 PRACTICAL CONTRIBUTIONS
The research conducted has a practical application also. It is easy to apply by banks to
determine the clients’ importance to e-banking systems factors, and to determine in a
measurable manner the performance of the systems currently deployed by the bank. The
results also indicate several aspects where banks may improve their products, or can
identify specific shortcomings for which additional in-depth investigation may identify the root
cause of a lower than expected result.
Page 89 of 130
From a client perspective, the client can use the same research structure to measure the
performance of the e-banking system they are currently using, and to establish a baseline
of performance required from the e-banking system when they consider changing banks.
6.4 FUTURE RESEARCH SUGGESTIONS
Due to the limitations already discussed in this research, a few further research suggestions
are proposed:
a. Repeat this research with an acceptable number of responses to verify the conclusions
reached with this research. The number of responses was already indicated as a
limitation.
b. Using the same research approach, expand the research to other industries and e-
business systems in use to determine if the conclusions reached for e-banking applies
to other types of e-business systems.
c. Conduct a longitudinal study after five or more years to determine if the Actual scoring
had improved in relation to the Importance scoring as reported in this research.
d. Conduct a longitudinal research study, repeating the research conducted by Miller and
Doyle, to determine if the scoring of internal Information Systems had become more
positive in comparison to the original study. Also include finding the reasons for
increases in satisfaction or effectiveness and determine if this is applicable to this
research.
e. Consider executing the same research, but using an alternative, more suitable,
methodology instead of TAM.
6.5 CONCLUDING REMARKS
The first concluding remark is that TAM may not have been the most suitable research
methodology for this study. However, TAM stood up well in determining the measures on
the variables defined, by being flexible enough to adapt to the requirements of different
research demands.
A popular saying goes: “Don’t throw out the baby with the bath water!”. Old
methodologies and academic studies that were used to research concepts, can still be
applied where applicable with great benefit. It may be necessary to adjust and possibly
redefine some aspects due to technological changes over time as was done in this research
with the work conducted by Miller and Doyle (1987). The end results are worth the effort.
Page 90 of 130
REFERENCES ABSA. 2017. ABSA Business [Online]. Available: https://www.absa.co.za/business/ [Accessed 2017]. ABUSHANAB, E., PEARSON, J. M. & SETTERSTROM, A. J. 2010. Internet banking and customers' acceptance in
Jordan: the unified model's perspective. Communications of the Association for Information Systems, 26, 23.
ACKOFF, R., L 1990. Strategy. Systems Practice, 3, 521-524. AJZEN, I. 1985. From intentions to actions: A theory of planned behavior. Action control. Springer. AJZEN, I. 2011. The theory of planned behaviour: reactions and reflections. Taylor & Francis. AJZEN, I. & FISHBEIN, M. 1977. Attitude-behavior relations: A theoretical analysis and review of empirical
research. Psychological bulletin, 84, 888. AKINCI, S., AKSOY, Ş. & ATILGAN, E. 2004. Adoption of internet banking among sophisticated consumer
segments in an advanced developing country. International journal of bank marketing, 22, 212-232. AL-AJAM, A. S. & NOR, K. M. 2013. Influencing factors on behavioral intention to adopt Internet banking
service. World Applied Sciences Journal, 22, 1652-1656. AL-JABRI, I. M. & SOHAIL, M. S. 2012. Mobile banking adoption: Application of diffusion of innovation theory. AL-QEISI, K. I. 2009. Analyzing the use of UTAUT model in explaining an online behaviour: Internet banking
adoption. Brunel University Brunel Business School PhD Theses. AMIN, H. 2009. AN ANALYSIS OF ONLINE BANKING USAGE INTENTIONS: AN EXTENSION OF THE TECHNOLOGY
ACCEPTANCE MODEL. International Journal of Business & Society, 10, 27-40. AMIT, R. & ZOTT, C. 2001. Value creation in e‐business. Strategic management journal, 22, 493-520. ASH, C. G. & BURN, J. M. 2003. A strategic framework for the management of ERP enabled e-business change.
European journal of operational research, 146, 374-387. AYO, C., ADEWOYE, J. & ONI, A. A. 2010. The state of e-banking implementation in Nigeria: A post-
consolidation review. Journal of emerging trends in economics and management sciences, 1, 37-45. BAGOZZI, R. P. 2007. The legacy of the technology acceptance model and a proposal for a paradigm shift.
Journal of the association for information systems, 8, 3. BAMBERGER, J. 1997. Essence of the capability maturity model. Computer, 30, 112-114. BEHESHTI, H. M. & SALEHI-SANGARI, E. 2007. The benefits of e-business adoption: an empirical study of
Swedish SMEs. Service Business, 1, 233-245. BROWN, S. A., MASSEY, A. P., MONTOYA-WEISS, M. M. & BURKMAN, J. R. 2002. Do I really have to? User
acceptance of mandated technology. European journal of information systems, 11, 283-295. BURTON-JONES, A. & HUBONA, G. S. 2006. The mediation of external variables in the technology acceptance
model. Information & Management, 43, 706-717. BUSINESSTECH. 2017. Battle of the banks: how SA’s big five banks compare [Online]. BusinessTech. Available:
CAMBRIDGE. 2017. Meaning of “effective” in the English Dictionary [Online]. Cambridge University Press. Available: http://dictionary.cambridge.org/dictionary/english/effective [Accessed 2017].
CAMERON, K. 1978. Measuring organizational effectiveness in institutions of higher education. Administrative science quarterly, 604-632.
CAMERON, K. 2010. Organizational effectiveness, Wiley Online Library. CAMERON, K. S. 1986. Effectiveness as paradox: Consensus and conflict in conceptions of organizational
effectiveness. Management science, 32, 539-553. CHAFFEY, D. 2015. Digital business and E-commerce management : strategy, implementation and practice,
Harlow :, Pearson Education Limited. CHENG, T. E., LAM, D. Y. & YEUNG, A. C. 2006. Adoption of internet banking: an empirical study in Hong Kong.
Decision support systems, 42, 1558-1572. CHETTY, T. 2010. THE drivers and inhibitors of strategy execution. Master of Business Administration,
CHIGAMBA, C. & FATOKI, O. 2011. Factors influencing the choice of commercial banks by university students in South Africa. International Journal of Business and Management, 6, 66.
CHUTTUR, M. Y. 2009. Overview of the technology acceptance model: Origins, developments and future directions. Working Papers on Information Systems, 9, 9-37.
COMPEAU, D. R. & HIGGINS, C. A. 1995. Computer Self-Efficacy: Development of a Measure and Initial Test. MIS Quarterly, 19, 189-211.
DAMANPOUR, F. & DAMANPOUR, J. A. 2001. E-business e-commerce evolution: perspective and strategy. Managerial finance, 27, 16-33.
DAVIS, F. D. 1989. Perceived usefulness, perceived ease of use, and user acceptance of information technology. MIS quarterly, 319-340.
DAVIS, F. D. 1993. User acceptance of information technology: system characteristics, user perceptions and behavioral impacts. International journal of man-machine studies, 38, 475-487.
DELONE, W. H. & MCLEAN, E. R. 1992. Information systems success: The quest for the dependent variable. Information systems research, 3, 60-95.
DIXIT, A. K. & PRAKASH, O. 2011. A study of issues affecting ERP implementation in SMEs. Researchers World, 2, 77.
ERIKSSON, K., KEREM, K. & NILSSON, D. 2008. The adoption of commercial innovations in the former Central and Eastern European markets: The case of internet banking in Estonia. International Journal of Bank Marketing, 26, 154-169.
EVANS, C. 2001. An e-strategy for online e-business. Information Systems Management, 18, 8-21. EZZI, S. W. 2014. A theoretical Model for Internet banking: beyond perceived usefulness and ease of use.
Archives of Business Research, 2, 31-46. FNB. 2017. First National Bank Business Banking [Online]. First National Bank. Available:
https://www.fnb.co.za/business-banking/ [Accessed 2017]. FOON, Y. S. & FAH, B. C. Y. 2011. Internet banking adoption in Kuala Lumpur: an application of UTAUT model.
International Journal of Business and Management, 6, 161-167. FOSTER, J. & LIN, A. 2003. Individual Differences in Learning Entrepreneurship and Their Implications for Web-
Based Instruction in E-Business and E-Commerce. British Journal of Educational Technology, 34, 455-65.
FYNES, B. & MARSHALL, D. 2005. Strategic technology adoption: extending ERP across the supply chain. Journal of Enterprise Information Management, 18, 427-440.
GERRARD, P. & BARTON CUNNINGHAM, J. 2003. The diffusion of internet banking among Singapore consumers. International journal of bank marketing, 21, 16-28.
GIKANDI, J. W. & BLOOR, C. 2010. Adoption and effectiveness of electronic banking in Kenya. Electronic commerce research and applications, 9, 277-282.
HA, L. & FORGIONNE, G. 2006. Econometric simulation for e-business strategy evaluation. International Journal of E-Business Research, 2, 38+.
HACKETT, G. 1981. Survey Research Methods. Personnel & Guidance Journal, 59, 599. HANAFIZADEH, P., KEATING, B. W. & KHEDMATGOZAR, H. R. 2014. A systematic review of Internet banking
adoption. Telematics and informatics, 31, 492-510. HINTON, M. & BARNES, D. 2009. Discovering effective performance measurement for e-business.
International Journal of Productivity and Performance Management, 58, 329-345. INC., W. F. 2017. Effectiveness [Online]. Web Finance Inc. Available:
http://www.businessdictionary.com/definition/effectiveness.html [Accessed]. KERR, D. V. & BRYANT, K. 2008. A Survey of Current e-Business (E-Government). AUSTRALASIAN JOURNAL OF
INFORMATION SYSTEMS, 15, 109-132. KWAK, Y. H., PARK, J., CHUNG, B. Y. & GHOSH, S. 2012. Understanding end-users’ acceptance of enterprise
resource planning (ERP) system in project-based sectors. IEEE Transactions on Engineering Management, 59, 266-277.
LARSEN, K. R., ALLEN, G., VANCE, A. & EARGLE, D. 2015. Theories Used in IS Research Wiki [Online]. Available: http://IS.TheorizeIt.org [Accessed 2017/09/26 2017].
LAUDON, K. C. & LAUDON, J. P. 2011. Essentials of management information systems, Pearson Upper Saddle River.
LEE, M.-C. 2009. Factors influencing the adoption of internet banking: An integration of TAM and TPB with perceived risk and perceived benefit. Electronic commerce research and applications, 8, 130-141.
LEGRIS, P., INGHAM, J. & COLLERETTE, P. 2003. Why do people use information technology? A critical review of the technology acceptance model. Information & management, 40, 191-204.
LEVENSTEIN, E. 2001. Banking on the Internet? - watch out : e-business. Network times, 11, 22. LIEBMANN, L. 2001. Defining e-business performance. Communications News, 38, 92. LINSTONE, H. A. & TUROFF, M. 1975. The Delphi method: Techniques and applications, Addison-Wesley
Reading, MA. LINSTONE, H. A. & TUROFF, M. 2002. The Delphi method: Techniques and applications, Addison-Wesley
Publishing Company, Advanced Book Program. LOONAM, M. & O'LOUGHLIN, D. 2008. Exploring e-service quality: a study of Irish online banking. Marketing
Intelligence & Planning, 26, 759-780. LOOS, P. 2000. Advanced information technology application in ERP systems. AMCIS 2000 Proceedings, 175. LOW, Y. M., GOH, C. F., TAN, O. K. & RASLI, A. 2017. Usersâ Loyalty towards Mobile Banking in Malaysia. The
Journal of Internet Banking and Commerce, 2017. LUFTMAN, J. 2003. ASSESSING IT/BUSINESS ALIGNMENT. Information Systems Management, 20, 9-15. LUFTMAN, J., BEN-ZVI, T., DWIVEDI, R. & RIGONI, E. H. 2010. IT Governance: An Alignment Maturity
Perspective. International Journal on IT/Business Alignment and Governance, 1, 13-25. LUFTMAN, J. & BRIER, T. 1999. Achieving and Sustaining Business-IT Alignment. California Management
Review, 42, 109-122. LUFTMAN, J., PAPP, R. & BRIER, T. 1999. Enablers and inhibitors of business-IT alignment. Commun. AIS, 1, 1. MADUKU, D. 2013. Predicting retail banking customers' attitude towards Internet banking services in South
Africa. Southern African Business Review, 17, 76-100. MAHMOOD, M. A., GEMOETS, L., HALL, L. L., LÓPEZ, F. J. & MARIADAS, R. 2008. Measuring E-Commerce
Technology Enabled Business Value: An Exploratory Research. International Journal of E-Business Research, 4, 48-68.
MANSKI, C. F. 1977. The structure of random utility models. Theory and Decision : An International Journal for Multidisciplinary Advances in Decision Science, 8, 229-254.
MARTINS, C., OLIVEIRA, T. & POPOVIČ, A. 2014. Understanding the Internet banking adoption: A unified theory of acceptance and use of technology and perceived risk application. International Journal of Information Management, 34, 1-13.
MARWAHA, S. Y. K. 2017. E-Banking in Himachal Pradesh and its Impact on Job Satisfaction. Imperial Journal of Interdisciplinary Research, 3.
MASOCHA, R., CHILIYA, N. & ZINDIYE, S. 2011. E-banking adoption by customers in the rural milieus of South Africa: A case of Alice, Eastern Cape, South Africa. African Journal of Business Management, 5, 1857.
MASSILAMANY, M. & NADARAJAN, D. 2017. Factors That Influencing Adoption of Internet Banking in Malaysia. International Journal of Business and Management, 12, 126.
MATHIESON, K., PEACOCK, E. & CHIN, W. W. 2001. Extending the technology acceptance model: the influence of perceived user resources. SIGMIS Database, 32, 86-112.
MCFADDEN, D. 1980. Econometric models for probabilistic choice among products. Journal of Business, S13-S29.
MILES, R. E., SNOW, C. C., MEYER, A. D. & COLEMAN, J. H. J. 1978. Organizational Strategy, Structure, and Process. Academy of Management Review, 3, 546-562.
MILLER, J. 1987. Information Systems Effectiveness an Inter-industry Comparison, University of Cape Town. MILLER, J. 1993. Measuring and aligning information systems with the organization: A case study. Information
MILLER, J. & DOYLE, B. A. 1987. Measuring the effectiveness of computer-based information systems in the financial services sector. MIS Q., 11, 107-124.
MORGESON, F. V. & MITHAS, S. 2009. Does E-Government Measure Up to E-Business? Comparing End User Perceptions of U.S. Federal Government and E-Business Web Sites. Public Administration Review, 69, 740-752.
MOU, J., SHIN, D.-H. & COHEN, J. F. 2017. Trust and risk in consumer acceptance of e-services. Electronic Commerce Research, 17, 255-288.
MUJINGA, M., ELOFF, M. M. & KROEZE, J. H. Online banking users' perceptions in South Africa: An exploratory empirical study. IST-Africa Week Conference, 2016, 2016. IEEE, 1-7.
MUSE, E. 2007. Ian Roffe, Innovation and e-Learning: e-Business for an Educational Enterprise. WELSH JOURNAL OF EDUCATION, 14, 138-139.
MYERS, M. D. 2009. Qualitative research in business and management, Los Angeles :, SAGE. NAIMI BARAGHANI, S. 2008. Factors influencing the adoption of internet banking. NEDBANK. 2017. Nedbank Business [Online]. Available:
https://www.nedbank.co.za/content/nedbank/desktop/gt/en/business.html [Accessed 2017]. NELSON, R. R., TODD, P. A. & WIXOM, B. H. 2005. Antecedents of information and system quality: an empirical
examination within the context of data warehousing. Journal of management information systems, 21, 199-235.
NEWKIRK, H. E. & LEDERER, A. L. 2006. The effectiveness of strategic information systems planning under environmental uncertainty. Information & Management, 43, 481-501.
OATES, B. J. 2005. Researching information systems and computing, Sage. OZLEN, M. K. & DJEDOVIC, I. 2017. Online banking acceptance: The influence of perceived system security on
perceived system quality. Journal of Accounting and Management Information Systems, 16, 164-178. PALMER, R. 2002. There's no business like e-business. Qualitative Market Research, 5, 261-267. PAVLOU, P. A. & EL SAWY, O. A. 2006. From IT leveraging competence to competitive advantage in turbulent
environments: The case of new product development. Information Systems Research, 17, 198-227. PIKKARAINEN, T., PIKKARAINEN, K., KARJALUOTO, H. & PAHNILA, S. 2004. Consumer acceptance of online
banking: an extension of the technology acceptance model. Internet research, 14, 224-235. POLASIK, M. & PIOTR WISNIEWSKI, T. 2009. Empirical analysis of internet banking adoption in Poland.
International Journal of Bank Marketing, 27, 32-52. PORTEOUS, D. 2006. The enabling environment for mobile banking in Africa. Department for International
Development - United Kingdom. PORTER, M. 1980. Corporate strategy. Harv. Bus. Rev.(May/June 1987), 55. PRESLEY, A. 2006. ERP investment analysis using the strategic alignment model. Management Research
News, 29, 273-284. PRETORIUS, M. & MARITZ, R. 2010. Strategy-making approach matters a great deal. Journal of Business
Strategy, Draft issue, 9. PRICEWATERHOUSECOOPERS 2017. Balancing resilience and growth South Africa – Major banks analysis.
PricewaterhouseCoopers Inc. PYBURN, P. J. 1983. Linking the MIS Plan with Corporate Strategy: An Exploratory Study. MIS Quarterly, 7, 1-
14. QUINN, R. E. & CAMERON, K. 1983. Organizational life cycles and shifting criteria of effectiveness: Some
preliminary evidence. Management science, 29, 33-51. RAHI, S., YASIN, N. & ALNASER, F. 2017. Measuring the role of website design, assurance, customer service
and brand image towards customer loyalty and intention to adopt interent banking. The Journal of Internet Banking and Commerce, 22.
RASHID, M. A. A. & OTHMAN, M. N. A. 2017. User Adoption and Use of E-government Online Service. Gading Journal for the Social Sciences, 14.
RAYMOND, L. & BERGERON, F. 2008. Enabling the business strategy of SMEs through e-business capabilities: a strategic alignment perspective. Industrial Management & Data Systems, 108, 577-595.
REICHNER, A. 1996. Supplier Selection Using Capability Maturity Model. INCOSE International Symposium, 6, 1058-1062.
ROGERS, E. M. 2003. The diffusion of innovation 5th edition. New York: Free Press. ROGERS, E. M. & SHOEMAKER, F. 1983. Diffusion of innovation: A cross-cultural approach. New York. SABAT, H. K. 2002. The evolving mobile wireless value chain and market structure. Telecommunications
Policy, 26, 505-535. SABHARWAL, M. 2016. The Assessment of Concerns, Opinions and Perceptions of Bank Customers to find the
Significant Metrics for Deployment of Biometrics in E-Banking. Assessment, 140. SANDERS, N. R. 2007. THE BENEFITS OF USING E-BUSINESS TECHNOLOGY: THE SUPPLIER PERSPECTIVE.
Journal of Business Logistics, 28, 177-207. SARB. 2017. South African Registered Banks and Representative Offices [Online]. Pretoria: South African
SBSA. 2017. Standard Bank Business [Online]. Standard Bank of South Africa. Available: http://www.standardbank.co.za/standardbank/Business [Accessed 2017].
SEDDON, P. & KIEW, M.-Y. 1996. A partial test and development of DeLone and McLean's model of IS success. Australasian Journal of Information Systems, 4.
SEHGAL, R. 2017. A STUDY OF INTERNET BANKING SERVICE QUALITY AND CUSTOMER SATISFACTION OF PRIVATE SECTOR BANKS IN NORTHERN INDIA. Indian Journal of Commerce & Management Studies, 8, 46-56.
SHARMA, S. K. & GUPTA, J. N. 2004. E-strategy model for creating flexible organizations. Global Journal of Flexible Systems Management, 5, 1.
SHEIKHI, B. & SHERIFF, A. M. 2016. INTERNET BANKING SERVICE QUALITY AND ITS IMPACT ON CUSTOMER SATISFACTION. International Journal of Research in Commerce, Economics & Management, 6, 12-18.
SHIH, H.-P. 2004a. An empirical study on predicting user acceptance of e-shopping on the Web. Information & Management, 41, 351-368.
SHIH, H.-P. 2004b. Extended technology acceptance model of Internet utilization behavior. Information & Management, 41, 719-729.
SHON, T.-H. & SWATMAN, P. M. 1998. Identifying effectiveness criteria for Internet payment systems. Internet Research, 8, 202-218.
SIAU, K. & MESSERSMITH, J. 2003. Analyzing ERP implementation at a public university using the innovation strategy model. International Journal of Human-Computer Interaction, 16, 57-80.
SNIEHOTTA, F. F., PRESSEAU, J. & ARAÚJO-SOARES, V. 2014. Time to retire the theory of planned behaviour. Taylor & Francis.
SOLIMAN, F. & YOUSSEF, M. A. 2003. Internet-based e-commerce and its impact on manufacturing and business operations. Industrial Management & Data Systems, 103, 546-552.
STRYDOM, I. 2013. Towards an understanding of the strategic use of mobile ICT in small and medium enterprises. University of Pretoria.
TAN, G. W.-H., CHONG, C.-K., OOI, K.-B. & CHONG, A. Y.-L. 2010. The adoption of online banking in Malaysia: an empirical analysis. International Journal of Business and Management Science, 3, 169.
TAN, M. & TEO, T. S. 2000. Factors influencing the adoption of Internet banking. Journal of the AIS, 1, 5. TAT, H. H. & NOR, K. M. 2015. Predictors of intention to continue using internet banking services: An empirical
study of current users. International Journal of Business and Information, 3. TIKU, S., AZARIAN, M. & PECHT, M. 2007. Using a reliability capability maturity model to benchmark
electronics companies. International Journal of Quality & Reliability Management, 24, 547-563. UNIVERSITY, O. 2017. Effectiveness [Online]. Oxford University Press. Available:
VAN BAAREN, R. J., CURRAN, R., TH ANNUAL, R., MAINTAINABILITY SYMPOSIUM, R. T. A. R. & MAINTAINABILITY SYMPOSIUM, R. C. S. C. O. U. S. A. 2014. A capability maturity model for R&M engineering. Proceedings - Annual Reliability and Maintainability Symposium.
VENKATESH, V. 2000. Determinants of Perceived Ease of Use: Integrating Control, Intrinsic Motivation, and Emotion into the Technology Acceptance Model. Information Systems Research [Online], 11.
VENKATESH, V. & BALA, H. 2008. Technology acceptance model 3 and a research agenda on interventions. Decision sciences, 39, 273-315.
VENKATESH, V. & DAVIS, F. D. 2000. A theoretical extension of the technology acceptance model: Four longitudinal field studies. Management science, 46, 186-204.
VENKATESH, V., MORRIS, M. G., DAVIS, G. B. & DAVIS, F. D. 2003. User Acceptance of Information Technology: Toward a Unified View. MIS Quarterly, 27, 425-478.
WANG, S. & CHEUNG, W. 2004. E-Business Adoption by Travel Agencies: Prime Candidates for Mobile e-Business. International Journal of Electronic Commerce, 8, 43-63.
WEBSTER, J. & MARTOCCHIO, J. J. 1992. Microcomputer Playfulness: Development of a Measure with Workplace Implications. MIS Quarterly, 16, 201-226.
WU, I.-L. & CHEN, J.-L. 2006. A hybrid performance measure system for e-business investments in high-tech manufacturing: An empirical study. Information & Management, 43, 364-377.
XUE, M., HITT, L. M. & CHEN, P.-Y. 2011. Determinants and outcomes of internet banking adoption. Management science, 57, 291-307.
YEOW, P. H., YUEN, Y. Y., TONG, D. Y. K. & LIM, N. 2008. User acceptance of online banking service in Australia. Communications of the IBIMA, 1, 191-197.
YOULONG, Z. & LEDERER, A. L. 2003. An Instrument for Measuring the Business Benefits of E-Commerce Retailing. International Journal of Electronic Commerce, 7, 65-99.
YU, C.-S. 2012. Factors affecting individuals to adopt mobile banking: Empirical evidence from the UTAUT model. Journal of Electronic Commerce Research, 13, 104.
ZHONG, L., LEUNG, D., LAW, R., WU, B. & SHAO, J. 2014. An Application of the Capability Maturity Model for Evaluating Attraction Websites in Mainland China. International Journal of Tourism Research, 16, 429-440.
31 E-business systems ability to adapt to your changing needs
1 2 3 4 5 6 7 1 2 3 4 5 6 7
32 Amount of effort to integrate external e-business systems in your own systems
1 2 3 4 5 6 7 1 2 3 4 5 6 7
Page 101 of 130
APPENDIX C - PREVIOUS E-BANKING RESEARCH OUTCOMES
Page 102 of 130
Table 28 - List of Internet Banking Acceptance Research
Reference Title Methodology Sample size Hypotheses Findings
(AbuShanab et al., 2010) Internet banking and customers'
acceptance in Jordan: the unified
model's perspective
UTAUT 523 H1a: Customers with high performance expectancy will have a greater intention to adopt Internet banking. H1b: Customers with high effort expectancy will have a greater intention to adopt Internet banking. H1c: Customers perceiving high social influence from significant others will have a greater intention to adopt Internet banking. H1d: The influence of performance expectancy will be moderated by gender, such that the effect will be stronger for men; the influence of effort expectancy will be moderated by gender, such that the effect will be stronger for women; and the influence of social influence will be moderated by gender, such that the effect will be stronger for women. H1e: The influence of performance expectancy will be moderated by age, such that the effect will be stronger for younger individuals; the influence of effort expectancy will be moderated by age, such that the
Supported Supported Supported Supported Partial Support
Page 103 of 130
Reference Title Methodology Sample size Hypotheses Findings
effect will be stronger for younger individuals; and the influence of social influence will be moderated by age, such that the effect will be stronger for older individuals. H2a: Perceived facilitating conditions will have a significant positive relationship with behavioural intention to adopt Internet banking. H2b: Self-efficacy will have a significant positive relationship with behavioural intention to adopt Internet banking. H2c: Anxiety toward using the Internet will have a significant negative relationship with behavioural intention to adopt Internet banking. H2d: Personal innovativeness will have a significant positive relationship with behavioural intention to adopt Internet banking. H2e: Perceived trust will have a significant positive relationship with behavioural intention to adopt Internet banking. H2f: Perceived risk will have a significant positive relationship with behavioural intention to adopt Internet
Not supported Supported Not supported Not supported Supported Not supported
Page 104 of 130
Reference Title Methodology Sample size Hypotheses Findings
banking. H2g: Internal LOC will have a significant positive relationship with behavioural intention to adopt Internet.
Supported
(Akinci et al., 2004) Adoption of internet banking among
sophisticated consumer segments in
an advanced developing country
140 . to understand the demographic characteristics of the users and non-users of IB services in the highly educated market segment; . to describe the preferences for various delivery channels by IB users and non-users; . to compare the attitudes of users and non-users towards IB with respect to a number of factors such as technology, security, convenience, and costs; . to identify the major sub-segments among highly educated IB consumers; and, . to search the similarities between various IB transactions and group these services in homogenous categories.
(Al-Ajam and Nor, 2013) Influencing factors on behavioural
intention to adopt Internet banking
service
TAM 1286 H1: Perceived relative advantage of using Internet banking positively affects the attitude toward using the technology.
Supported
Page 105 of 130
Reference Title Methodology Sample size Hypotheses Findings
H2: Perceived ease of use of using Internet banking positively affects the attitude toward using the technology. H3: Perceived compatibility of Internet banking with one’s values positively affects attitude toward using the technology. H4: Trialability of Internet banking positively affects attitude toward using the technology. H5: Attitude about Internet banking positively affects the intention to use the technology.
Supported Supported Supported Supported
(Amin, 2009) An analysis of online banking usage
intentions: An extension of the
Technology Acceptance Model
TAM 206 H1: Perceived usefulness has a positive effect on consumer acceptance of online banking H2: Perceived ease of use has a positive effect on consumer acceptance of online banking H3: Perceived credibility has a positive effect on consumer acceptance of online banking H4: Perceived enjoyment has a positive effect on consumer acceptance of online banking
Supported Supported Supported Not supported Supported
Page 106 of 130
Reference Title Methodology Sample size Hypotheses Findings
H5: Social norm has a positive effect on consumer acceptance of online banking
(Ayo et al., 2010) The state of e-banking
implementation in Nigeria: A post-
consolidation review
TAM 369 H1: There is a positive relationship between customers' perceived usefulness of e-banking system and their continued intention to use it. H2: There is a positive relationship between customers' perceived ease of use of e-banking and their continued intention to use it. H3: There is a positive relationship between customers’ perceived risk and their continued intention to use the e-banking system. H4: Trusts in e-banking channels have positive relationship with customers’ intention to continue using e-banking. H5: There is a positive relationship between customers’ perceived organizational reputation and their intention to use e-banking services.
Supported Supported Not supported Supported Supported
(Cheng et al., 2006) Adoption of internet banking: an
empirical study in Hong Kong TAM 203 H1: Customers’ Attitude positively
influences their Intention. H2a: Perceived Usefulness has a direct positive relationship with customers’ Intention.
Supported Supported
Page 107 of 130
Reference Title Methodology Sample size Hypotheses Findings
H2b: Perceived Usefulness has a direct positive relationship with customers’ Attitude. H3: Perceived Ease of Use has a direct positive relationship with customers’ Attitude. H4a: Perceived Ease of Use has an indirect positive relationship with customers’ Intention via Perceived Usefulness. H4b: Perceived Ease of Use has an indirect positive relationship with customers’ Attitude via Perceived Usefulness. H5a: Perceived Web Security has a direct positive relationship with customer’s Intention. H5b: Perceived Web Security has a direct positive relationship with customer’s Attitude.
Supported Not supported Supported Supported Supported Not supported
(Eriksson et al., 2008) The adoption of commercial
innovations in the former Central
and Eastern European markets: The
case of internet banking in Estonia
Innovation Adoption Theory
1831 H1: If a consumer perceives an Internet bank as offering relative advantage, the consumer will be more willing to use the Internet bank. H2: If a consumer perceives Internet banking to be relatively easy to use and understand, the consumer will be more willing to use Internet banking.
Strong influence Strong influence
Page 108 of 130
Reference Title Methodology Sample size Hypotheses Findings
H3: Compatibility will have a positive influence on consumers’ use of an Internet bank but will probably be less influential than relative advantage and complexity. H4: Perceived risk will not influence consumers’ use of an Internet bank.
Significant, but weak influence Significant, but weak influence
(Ezzi, 2014) A theoretical Model for Internet
banking: beyond perceived
usefulness and ease of use
TAM Theoretical only
Exclude?
(Foon and Fah, 2011) Internet banking adoption in Kuala
Lumpur: an application of UTAUT
model
UTAUT 200 No hypotheses Exclude?
(Gerrard and Barton Cunningham, 2003)
The diffusion of internet banking
among Singapore consumers Innovation Adoption Theory
240 H1: Adopters and non-adopters differ on the basis of their perceptions of Internet banking. As compared to non-adopters, adopters rate Internet banking as being more convenient (H1a), more accessible (H1b), less risky - in relation to breaches of confidentiality (H1c), more compatible (H1d), requiring a higher level of PC proficiency (H1e), more economical beneficial (H1f), more socially desirable (H1g) and less complex (H1h). H2: Adopters as compared to non-adopters, will be more financially innovative.
TAM / TPB 368 H1: Perceived usefulness positively influences the intention to use online banking. H2: Attitude positively influences the intention to use online banking. H3: Subjective norm has positively influences the intention to use online banking. H4: Perceived behaviour control positively influences the intention to use online banking. H5: Perceived usefulness positively influences attitudes towards the use of online banking. H6: Perceived ease of use positively influences attitudes towards the use of online banking. H7: Perceived ease of use positively influences the perceived usefulness of the use of online banking. H8a: Performance risk negatively influences the perceived usefulness of using online banking.
Reference Title Methodology Sample size Hypotheses Findings
H8b: Performance risk negatively influences attitudes towards the use of online banking. H9a: Financial risk negatively influences attitudes towards the use of online banking. H9b: Financial risk negatively influences intentions towards the use of online banking. H10a: Social risk negatively influences attitudes towards the use of online banking. H10b: Social risk negatively influences the subjective norm regarding the use of online banking. H11: Time risk negatively influences attitudes towards the use of internet banking. H12a: Security/privacy risk negatively influences attitudes towards the use of online banking. H12b: Security/privacy risk negatively influences intentions to use online banking.
Supported Supported Not discussed Not supported Supported Supported Supported Supported
Page 111 of 130
Reference Title Methodology Sample size Hypotheses Findings
H13: Perceived benefit has a positive effect on attitude to use online banking. H14: Perceived benefit has a positive effect on intention to use online banking.
Not discussed Not discussed
(Loonam and O'loughlin, 2008)
Exploring e-service quality: a study
of Irish online banking Qualitative 20 randomly
selected None listed Exclude?
(Martins et al., 2014) Understanding the Internet banking
adoption: A unified theory of
acceptance and use of technology
and perceived risk application
UTAUT 249 H1: The influence of Performance Expectancy (PE) on Behavioural Intention (BI) will be positive and moderated by age and gender, such that it will be stronger for young and men. H2: The influence of Effort Expectancy (EE) on Behavioural Intention (BI) will be positive and moderated by age and gender, such that it will be stronger for young and women. H3: The influence of Social Influence (SI) on Behavioural Intention (BI) will be positive and moderated by age and gender, such that it will be stronger for older and women. H4: The influence of Facilitating Conditions (FC) on Usage Behaviour (UB) will be positive and moderated by age, such that it will be stronger for older.
Partially supported Partially supported Partially supported Not supported
Page 112 of 130
Reference Title Methodology Sample size Hypotheses Findings
H5: Behavioural Intention (BI) will have a significant positive influence on Usage Behaviour (UB). H6: Perceived Risk (PCR) is a second order factor of seven risks. H6a: Perceived Risk (PCR) will positive influence Performance Risk (PFR). H6b: Perceived Risk (PCR) will positive influence Financial Risk (FR). H6c: Perceived Risk (PCR) will positive influence Time Risk (TR). H6d: Perceived Risk (PCR) will positive influence Psychological Risk (PSR). H6e: Perceived Risk (PCR) will positive influence Social Risk (SR). H6f: Perceived Risk (PCR) will positive influence Privacy Risk (PR). H6g: Perceived Risk (PCR) will positive influence Overall Risk (OR). H7: Perceived Risk (PCR) will negative influence Behaviour Intention (BI). H8: Perceived Risk (PCR) will negative influence Performance Expectancy (PE).
Reference Title Methodology Sample size Hypotheses Findings
H9: Effort Expectancy (EE) will negative influence Perceived Risk (PCR).
Supported
(Naimi Baraghani, 2008) Factors influencing the adoption of
internet banking ETAM + TPB 240 Hypothesis 1: Attitude has positive
impact on intention to use Internet banking. Hypothesis 2: Perceived behaviour control positively influences intention to use Internet banking. Hypothesis 3: Subjective norm has positive effect on intention to use Internet banking. Hypothesis 4: Trust has positive effect on attitude to use Internet banking. Hypothesis 5: Trust has positive impact on perceived behaviour control to use Internet banking. Hypothesis 6: Trust positively influences subjective norm to Internet banking. Hypothesis 7: Trust has positive effect on intention to use Internet banking. Hypothesis 8: Trust has positive effect on PU to use Internet banking. Hypothesis 9: PEOU has positive impact on PU to use Internet banking.
Supported Not supported Supported Supported Supported Supported Supported Supported Supported
Page 114 of 130
Reference Title Methodology Sample size Hypotheses Findings
Hypothesis 10: PEOU positively influences trust in using Internet banking. Hypothesis 11: PEOU positively influences attitude to use Internet banking. Hypothesis 12: PU has positive impact on attitude to use Internet banking. Hypothesis 13: PU has positive effect on intention to use Internet banking.
Supported Supported Supported Supported
(Pikkarainen et al., 2004) Consumer acceptance of online
banking: an extension of the
technology acceptance model
ETAM 268 H1. Perceived usefulness (PU) has a positive effect on consumer acceptance of online banking H2. Perceived ease of use (PEOU) has a positive effect on consumer acceptance of online banking H3. Perceived enjoyment (PE) has a positive effect on consumer acceptance of online banking H4. The amount of information a consumer has about online banking has a positive effect on consumer acceptance of online banking H5. Security and privacy have a positive effect on consumer acceptance of online banking
Supported Not supported Not supported Supported Not supported
Page 115 of 130
Reference Title Methodology Sample size Hypotheses Findings
H6. The quality of the Internet connection has a positive effect on consumer acceptance of online banking
Not supported
(Polasik and Piotr Wisniewski, 2009)
Empirical analysis of internet
banking adoption in Poland Binomial Logistic Regression
3519 H1: The higher the individually perceived security of Internet transactions, the higher the probability of using online banking services. H2: Familiarity with the Internet medium, as measured by the duration of past usage, application of Internet at work and prior experience with online transactions, will have a positive effect on the usage of Web-based banking. H3: Exposure to online banking advertisements increases the likelihood of Internet banking adoption. H4: Use of other banking products, such as mobile phone banking, as well as debit, credit and virtual cards raises the odds that a respondent opens an online account. H5: Access to broadband Internet connection increases the probability of using Internet banking. H6: Demographic characteristics, such as age, gender, income, education, place of residence and work-related attributes jointly determine the adoption status.
Reference Title Methodology Sample size Hypotheses Findings
(Shon and Swatman, 1998)
Identifying effectiveness criteria for
Internet payment systems Delphi 14 No stated hypothesis Exclude?
(Tan et al., 2010) The adoption of online banking in
Malaysia: an empirical analysis TAM 231 H1: Perceived usefulness of online
banking services will have a positive effect on online banking services use in Malaysia. H2: Perceived ease of use has a positive effect on online banking services use in Malaysia. H3: Perceived security risk will have a positive effect on online banking services use in Malaysia. H4: Social Influence has a positive effect on online banking services use in Malaysia. H5: Perceived financial cost will have negative effect on online banking services use in Malaysia. H6: Consumer trust in online banking will have a positive effect on online banking services use in Malaysia.
True True Rejected True Rejected True
(Tan and Teo, 2000) Factors influencing the adoption of
Internet banking DTPB / diffusion of innovations theory
454 H1A: The greater the perceived relative advantage of using Internet banking services, the more likely that Internet banking will be adopted. H1B: The greater the perceived compatibility of Internet banking with
Supported Supported
Page 117 of 130
Reference Title Methodology Sample size Hypotheses Findings
one’s values, the more likely that Internet banking will be adopted. H1C: The greater the experience with using the Internet, the more likely that Internet banking will be adopted. H1D: The greater the use of banking products and services, the more likely that Internet banking will be adopted. H1E: The lower the perceived complexity of using Internet banking, the more likely that Internet banking will be adopted. H1F: The greater the trial-ability of Internet banking, the more likely that Internet banking will be adopted. H1G: The lower the perceived risk of using Internet banking, the more likely that Internet banking will be adopted. H2: The beliefs associated with subjective norms are significantly related to an individual’s intention to adopt Internet banking. H3A: The greater the self-efficacy toward using Internet banking, the more likely that Internet banking will be adopted.
Supported Supported Not supported Supported Supported Not supported Supported
Page 118 of 130
Reference Title Methodology Sample size Hypotheses Findings
H3B: The greater the extent of perceived technological support for Internet banking, the more likely that Internet banking will be adopted. H3C: The greater the extent of perceived government support for electronic commerce, the more likely that Internet banking will be adopted.
Not supported Supported
(Tat and Nor, 2015) Predictors of intention to continue
using internet banking services: An
empirical study of current users
No hypotheses Exclude?
(Xue et al., 2011) Determinants and outcomes of
internet banking adoption RUM 28,945 Hypothesis 1 (H1): Higher transaction
volume is associated with faster Internet banking adoption. Hypothesis 2a (H2a): A lower density of offline channels (branches and ATMs) near the customer is associated with faster Internet banking adoption. Hypothesis 2b (H2b): The effect of offline channel density on Internet banking adoption is larger (in absolute value) for customers with higher income. Hypotheses 3a (H3a): Higher customer efficiency is associated with faster Internet banking adoption. Hypotheses 3b (H3b): The rate that Internet banking adoption increases
Supported Not supported Not supported Supported Not supported
Page 119 of 130
Reference Title Methodology Sample size Hypotheses Findings
with service demand is increasing in customer efficiency. Hypothesis 4 (H4): Higher local penetration is associated with faster adoption of Internet banking (after suitably controlling for geographic and time-series heterogeneity). Hypothesis 5(H5): Internet banking adoption is associated with increasing product acquisition from the bank. Hypothesis 6a (H6a): Internet banking adoption is associated with increased total transaction activity. Hypothesis 6b (H6b): Internet banking adoption is associated with decreased usage of other channels. Hypothesis 7 (H7): Internet banking adoption is associated with an increase in a customer’s profitability. Hypothesis 8 (H8): Internet banking adoption is associated with lower likelihood of customer departure from the bank. Hypothesis 9 (H9): Adoption correlates that are likely to affect cross-sell potential (local penetration, branch density and service demand) are
Supported Supported Supported Not supported Not supported Supported Partial support
Page 120 of 130
Reference Title Methodology Sample size Hypotheses Findings
associated with greater product use after online banking adoption. Hypothesis 10 (H10): Adoption correlates that increase channel substitution (service demand and customer efficiency) are associated with less usage of non-Internet channels and greater profits after online banking adoption.
Partial support
(Yeow et al., 2008) User acceptance of online banking
service in Australia UTAUT 190 No hypotheses Excluded due to predatory
publisher
(Yu, 2012) Factors affecting individuals to
adopt mobile banking: Empirical
evidence from the UTAUT model
UTAUT 441 H1: Performance expectance significantly affects individual intention to use mobile banking. H2: Effort expectation significantly affects individual intention to use mobile banking. H3: Social influence significantly affects individual intention to use mobile banking. H4: Perceived credibility significantly affects individual intention to use mobile banking. H5: Perceived financial cost significantly affects individual intention to use mobile banking.
No hypotheses findings. Summarised by several categories.
Page 121 of 130
Reference Title Methodology Sample size Hypotheses Findings
H6: Facilitating conditions significantly affect individual behaviour of using mobile banking. H7: Perceived self-efficacy significantly affects individual behaviour of using mobile banking. H8: Behavioural intention significantly affects individual behaviour of using mobile banking. H9: The influence of performance expectance on individual intention will be moderated by age. H10: The influence of effort expectance on individual intention will be moderated by age. H11: The influence of social influence on individual intention will be moderated by age. H12: The influence of perceived credibility on individual intention will be moderated by age. H13: The influence of facilitating conditions on individual behaviour will be moderated by age.
Page 122 of 130
Reference Title Methodology Sample size Hypotheses Findings
H14: The influence of perceived self-efficacy on individual behaviour will be moderated by age. H15: The influence of performance expectance on individual intention will be moderated by gender. H16: The influence of effort expectance on individual intention will be moderated by gender. H17: The influence of social influence on individual intention will be moderated by gender. H18: The influence of perceived credibility on individual intention will be moderated by gender. H19: The influence of facilitating conditions on individual behaviour will be moderated by gender. H20: The influence of perceived self-efficacy on individual behaviour will be moderated by gender.
Page 123 of 130
APPENDIX D –RIGOUR AND CREDIBILITY INSPECTION OF SELECTED ARTICLES
Page 124 of 130
Table 29 - Rigour and Credibility Inspection of Articles Selected
Reference Journal Title Search Source
Research Methodology
Sample size
Publisher
1 (AbuShanab et al., 2010)
Communications of the Association for Information Systems
Internet banking and customers' acceptance in Jordan: the unified model's perspective
UP UTAUT 523 Emerald
2 (Akinci et al., 2004)
International journal of bank marketing
Adoption of internet banking among sophisticated consumer segments in an advanced developing country
UP 140 Emerald
†3 (Al-Ajam and Nor, 2013)
World Applied Sciences Journal
Influencing factors on behavioural intention to adopt Internet banking service
Google Scholar
TAM 1286 IDOSI Publications
4 (Amin, 2009) International Journal of Business & Society
AN ANALYSIS OF ONLINE BANKING USAGE INTENTIONS: AN EXTENSION OF THE TECHNOLOGY ACCEPTANCE MODEL
UP TAM 206 ProQuest
5 (Ayo et al., 2010)
Journal of emerging trends in economics and management sciences
The state of e-banking implementation in Nigeria: A post-consolidation review
UP TAM 369 Sabinet
6 (Cheng et al., 2006)
Decision Support Systems
Adoption of internet banking: an empirical study in Hong Kong
UP TAM 203 Elsevier
7 (Eriksson et al., 2008)
International Journal of Bank Marketing
The adoption of commercial innovations in the former Central and Eastern European markets: The case of internet banking in Estonia
UP Innovation Adoption Theory
1831 Emerald
Page 125 of 130
Reference Journal Title Search Source
Research Methodology
Sample size
Publisher
8 (Ezzi, 2014) Archives of Business Research
A theoretical Model for Internet banking: beyond perceived usefulness and ease of use
Google Scholar
TAM Theoretical only
Society for Science and Education, United Kingdom
†9 (Foon and Fah, 2011)
International Journal of Business and Management
Internet banking adoption in Kuala Lumpur: an application of UTAUT model
Google Scholar
UTAUT 200 ResearchGate
10 (Gerrard and Barton Cunningham, 2003)
International journal of bank marketing
The diffusion of internet banking among Singapore consumers
UP Innovation Adoption Theory
240 Emerald
11 (Gikandi and Bloor, 2010)
Electronic commerce research and applications
Adoption and effectiveness of electronic banking in Kenya
UP Not stated Not stated Elsevier
12 (Hanafizadeh et al., 2014)
Telematics and informatics
A systematic review of Internet banking adoption
UP 165 articles
Elsevier
13 (Lee, 2009) Electronic commerce research and applications
Factors influencing the adoption of internet banking: An integration of TAM and TPB with perceived risk and perceived benefit
UP TAM / TPB 368 Elsevier
14 (Loonam and O'loughlin, 2008)
Marketing Intelligence & Planning
Exploring e-service quality: a study of Irish online banking
UP 20 randomly selected
Elsevier
15 (Martins et al., 2014)
International Journal of Information Management
Understanding the Internet banking adoption: A unified theory of acceptance and use of technology and perceived risk application
UP UTAUT 249 Elsevier
16 (Naimi Baraghani, 2008)
Lulea University of Technology
Factors influencing the adoption of internet banking
Academia.edu
ETAM + TPB 240 Lulea University of Technology
Page 126 of 130
Reference Journal Title Search Source
Research Methodology
Sample size
Publisher
17 (Pikkarainen et al., 2004)
Internet research Consumer acceptance of online banking: an extension of the technology acceptance model
UP ETAM 268 Emerald
18 (Polasik and Piotr Wisniewski, 2009)
International Journal of Bank Marketing
Empirical analysis of internet banking adoption in Poland
UP Binomial Logistic Regression
3519 Emerald
19 (Shon and Swatman, 1998)
Internet Research Identifying effectiveness criteria for Internet payment systems
UP Delphi 14 Emerald
20 (Tan et al., 2010)
International Journal of Business and Management Science
The adoption of online banking in Malaysia: an empirical analysis
UP TAM 231 ProQuest
21 (Tan and Teo, 2000)
Journal of the AIS Factors influencing the adoption of Internet banking
Google Scholar
DTPB / diffusion of innovations theory
454 ACM DL
22 (Tat and Nor, 2015)
International Journal of Business and Information
Predictors of intention to continue using internet banking services: An empirical study of current users
23 (Xue et al., 2011)
Management science Determinants and outcomes of internet banking adoption
UP RUM 28,945 EBSCOHost
†24 (Yeow et al., 2008)
Communications of the IBIMA
User acceptance of online banking service in Australia
Google Scholar
UTAUT 190 IBIMA
25 (Yu, 2012) Journal of Electronic Commerce Research
Factors affecting individuals to adopt mobile banking: Empirical evidence from the UTAUT model
UP UTAUT 441 ProQuest
Page 127 of 130
Reference Journal Title Search Source
Research Methodology
Sample size
Publisher
26 (Sabharwal, 2016)
International Journal of Computer Applications
The Assessment of Concerns, Opinions and Perceptions of Bank Customers to find the Significant Metrics for Deployment of Biometrics in E-Banking
UP ProQuest
27 (Mujinga et al., 2016)
IST-Africa Week Conference, 2016
Online banking users' perceptions in South Africa: An exploratory empirical study
Google Scholar
None International Information Management Centre
28 (Maduku, 2013)
Southern African Business Review
Predicting retail banking customers' attitude towards Internet banking services in South Africa
UP TAM 394 Sabinet
29 (Masocha et al., 2011)
African Journal of Business Management
E-banking adoption by customers in the rural milieus of South Africa: A case of Alice, Eastern Cape, South Africa
Google Scholar
None Academic Journals
†30 (Chigamba and Fatoki, 2011)
International Journal of Business and Management
Factors influencing the choice of commercial banks by university students in South Africa
Google Scholar
Theory of Constraints
Canadian Centre of Science and Education
31 (Porteous, 2006)
The enabling environment for mobile banking in Africa
Google Scholar
Market Research Document
Department for International Development, United Kingdom
32 (Sehgal, 2017)
Indian Journal of Commerce & Management Studies
A STUDY OF INTERNET BANKING SERVICE QUALITY AND CUSTOMER SATISFACTION OF PRIVATE SECTOR BANKS IN NORTHERN INDIA
Google Scholar
250 Educational Research Multimedia & Publications
Page 128 of 130
Reference Journal Title Search Source
Research Methodology
Sample size
Publisher
33 (Rahi et al., 2017)
The Journal of Internet Banking and Commerce
Measuring the role of website design, assurance, customer service and brand image towards customer loyalty and intention to adopt internet banking
Google Scholar
UTAUT 500
34 (Ozlen and Djedovic, 2017)
Journal of Accounting and Management Information Systems
Online banking acceptance: The influence of perceived system security on perceived system quality
UP UTAUT 120 The Central and Eastern European Online Library
35 (Mou et al., 2017)
Electronic Commerce Research
Trust and risk in consumer acceptance of e-services
UP Meta-analysis SpringerLink
†36 (Massilamany and Nadarajan, 2017)
International Journal of Business and Management
Factors That Influencing Adoption of Internet Banking in Malaysia
Google Scholar
200 Canadian Center of Science and Education
†37 (Marwaha, 2017)
Imperial Journal of Interdisciplinary Research
E-Banking in Himachal Pradesh and its Impact on Job Satisfaction
Google Scholar
100 Imperial Journals
38 (Maruping et al., 2017)
Journal of the Association for Information Science and Technology
Going beyond intention: Integrating behavioral expectation into the unified theory of acceptance and use of technology
UP UTAUT 720 Wiley Online Library
39 (Low et al., 2017)
The Journal of Internet Banking and Commerce
Users’ Loyalty towards Mobile Banking in Malaysia
Google Scholar
TAM 261 www.icommercecentral.com
†Articles shown in red in the table above were found to have been published in journals believed to be predatory publications. They were therefore
13 September 2016 Strictly confidential Prof C de Villiers Department of Informatics Dear Professor de Villiers Project: Measuring the effectiveness of e-business systems used by retailers in
South Africa Researcher: JM Peenz Student No: 14210968 Supervisor: Prof C de Villiers Department: Informatics Thank you for submitting the information requested in our letter dated 25 August 2016. I have pleasure in informing you that, after reviewing the information and documents submitted, the above study was approved on an ad hoc basis on 12 September 2016. The approval is subject to the candidate abiding by the principles and parameters set out in the application and research proposal in the actual execution of the research. The approval does not imply that the researcher, student or lecturer is relieved of any accountability in terms of the Codes of Research Ethics of the University of Pretoria if action is taken beyond the approved proposal. The Committee requests that you convey this approval to the researcher. We wish you success with the project. Sincerely
pp PROF RS RENSBURG CHAIR: COMMITTEE FOR RESEARCH ETHICS cc: Student Administration