WORKING PAPER SERIES Number 46 Southern Africa Labour and Development Research Unit by Leonard Smith and Vimal Ranchhod Measuring the impact of Educational Interventions on the Academic Performance of Academic Development Students in Second-Year Microeconomics
Transcript
WORKING PAPER SERIESNumber 46
Southern Africa Labour and Development Research Unit
byLeonard Smith and Vimal Ranchhod
Measuring the impact of Educational Interventions on the Academic Performance of
Academic Development Students in Second-Year Microeconomics
About the Author(s) and Acknowledgments
We thank Corné van Walbeek, June Pym, Wiedaad Dollie, and two anonymous referees for the Eco-nomic Research Southern Africa (ERSA) working paper series whose comments improved this paper. We also thank Fiona Gibbons for her patience in meeting our numerous requests for data. Financial support from ERSA is gratefully acknowledged. An earlier version of this paper has been published as an ERSA working paper. All errors are, of course, our responsibility.
Corresponding author: Leonard Smith, Centre for Higher Education Development, University of Cape Town, and SALDRU Research Associate. Private Bag, Rondebosch, 7701, South Africa. E-mail: [email protected] Ranchhod, Southern Africa Labour and Development Research Unit (SALDRU), University of Cape Town. Email: [email protected]
Working Papers can be downloaded in Adobe Acrobat format from www.saldru.uct.ac.za. Printed copies of Working Papers are available for R15.00 each plus vat and postage charges.
Contact DetailsLeonard SmithEmail Addy: [email protected] may be directed to: The Administrative Officer, SALDRU, University of Cape Town, Private Bag, Rondebosch, 7701, Tel: (021) 650 5696, Fax: (021) 650 5697, Email: [email protected]
1
MEASURING THE IMPACT OF EDUCATIONAL
INTERVENTIONS ON THE ACADEMIC
PERFORMANCE OF ACADEMIC
DEVELOPMENT STUDENTS IN SECOND-YEAR
MICROECONOMICS
LEONARD C. SMITH* and VIMAL RANCHHOD†
Abstract This paper analyses the impact of educational interventions made in the first- and second-year microeconomics courses on academic development students’ final mark in the second-year course. It also addresses issues of methodology, specification, and statistical analysis with respect to other studies in the field. The results suggest that the educational interventions in the first-year had a positive impact on the academic performance of the academic development cohort, relative to the mainstream cohort for the first period (2000−2002). The results also suggest that the educational interventions introduced in the second period (2003−2005), in the form of voluntary workshops for the academic development cohort, also improved the academic performance of this cohort relative to that of mainstream students. JEL Classification: I21 Keywords: academic development, academic performance, economic education, educational interventions, microeconomics, multivariate analysis, propensity score matching, South Africa
2
1. INTRODUCTION
The poor academic performance of students at South African tertiary institutions is cause for concern and is reflected in low graduation rates across the sector (Scott et al. 2007). Of particular concern is the low graduation rate achieved by students who come from socially and educationally disadvantaged backgrounds. In response to this situation tertiary institutions have introduced a variety of academic development programmes and courses designed to enable such students to realise their full academic potential (Smith 2004).
The purpose of an academic development course in economics is to enable disadvantaged students to develop their learning, writing, quantitative and study skills, so that they are able to achieve success in a particular course and in subsequent courses in mainstream1 economics (Edwards 2000, Smith 2004, Smith and Edwards 2007, Smith 2009). In addition they are also designed to facilitate the students’ understanding of the subject.
However, despite the use of educational interventions in economics and other courses at South African tertiary institutions, it is fair to say that relatively little research has been carried out to test the efficacy of these interventions in improving the performance of students doing academic development courses in economics (Edwards 2000, Smith 2004, Smith and Edwards 2007, Smith 2009).
The empirical aim of this study is to measure the impact of educational interventions in first- and second-year microeconomics on the academic performance of academic development students in the second-year mainstream microeconomics course (ECO2003F), relative to the performance of mainstream students. We begin by estimating the effect of the educational interventions in the first-year academic development microeconomics course (ECO1010H) on students’ academic performance in ECO2003F. Insofar as the academic performance of the ECO1010H cohort is improved, relative to mainstream students, it suggests that there may be long-run
* Corresponding author: Centre for Higher Education Development, University of Cape Town, and SALDRU Research Associate. Private Bag, Rondebosch, 7701, South Africa. E-mail: [email protected] † Southern Africa Labour and Development Research Unit (SALDRU), University of Cape Town. Email: [email protected] We thank Corné van Walbeek, June Pym, Wiedaad Dollie, and two anonymous referees for the Economic Research Southern Africa (ERSA) working paper series whose comments improved this paper. We also thank Fiona Gibbons for her patience in meeting our numerous requests for data. Financial support from ERSA is gratefully acknowledged. An earlier version of this paper has been published as an ERSA working paper. All errors are, of course, our responsibility. 1 “Mainstream” refers to those courses that make-up the standard three- and four-year degree programmes in the humanities and commerce faculties. 2 The data set for this estimation only included students who had passed the first-year course in 2001, and who wrote the final examination in second-year microeconomics the following year.
3
benefits that follow from the educational interventions included in the ECO1010H course. We also estimate the effect of voluntary workshops on the academic performance of the ECO1010H cohort doing ECO2003F. This exercise enables us to isolate the short-run benefit that may result from the educational interventions designed to enable students to deal with the particular difficulties they may encounter in ECO2003F.
Equally important in this paper is the methodology, specification, and statistical analysis used to ensure a robust set of results. In particular, specific attention is paid to addressing the sample selection problem highlighted by Smith and Edwards (2007).
They used the cohort for a single year to test the efficacy of an academic development course in first-year microeconomics on students’ academic performance in the first-year course and in subsequent courses in macroeconomics and microeconomics, relative to a control group drawn from the mainstream, using the usual control variables. In the context of this paper the key finding was that students who did the academic development course in microeconomics outperformed the mainstream control group by an average of 12 percentage points for the structured/essay questions in the second-year microeconomics examination.2 This result suggests that the skills acquired in a first-year academic development course in microeconomics persist into further years.
The Smith and Edwards’ (2007) study was characterised by a number of methodological problems, which this paper seeks to address, and in so doing makes five advances to the existing empirical literature in this area. Firstly, each student is tracked until such time as they pass, withdraw from, or are excluded from ECO2003F. Secondly, this analysis is conducted for six cohorts including over 5000 observations covering the years 2000−2005; thus the effect of the interventions over the longer term is investigated. Thirdly, the Heckman two-part procedure is used to account for the sample selection problem that arises as not all the students who start the course write the final examination.3 The larger sample size and the Heckman two-part procedure make it possible to generate a more robust set of results than is previously the case (Smith 2009). Fourthly, propensity score matching is used to generate a mainstream control group and so offers an alternative methodology to multivariate analysis. Finally, the effect of the educational interventions on the throughput rate for ECO2003F is calculated for the academic development cohort.
The structure of the paper is as follows. In Section 2 the academic development course in first-year microeconomics (ECO1010H) and the mainstream course in second-year microeconomics (ECO2003F) are described, as are the nature of the educational interventions. In Section 3 the empirical methodology and specification used in this paper is presented. Section 4 considers the data used and discusses the results, and Section 5 concludes the paper.
3 See Parker (2007) and Smith (2009) for an explanation of how to use this procedure in a similar context.
4
2. CHARACTERISTICS OF THE ACADEMIC DEVELOPMENT AND MAINSTREAM COURSES IN MICROECONOMICS
The academic development (ECO1010H) course in first-year microeconomics is described in Smith and Edwards’ 2007 paper. In summary, the ECO1010H course includes short modules on quantitative techniques, graphical analysis and introductory macroeconomics in addition to the core first-year microeconomics course. The theoretical content of the microeconomics course mirrors that of the shorter single-semester mainstream course in microeconomics (ECO1010F) and tests and examinations are set to the same standard.
There are several important differences between the academic development and mainstream courses with respect to the structure, content and teaching approach. The ECO1010H course runs over two semesters as opposed to a single semester, five lectures are offered per week as opposed to four, and classes are small (80 to 120 students) relative to the size of mainstream lecture groups (150 to 400 students). Greater emphasis is placed on using the tutorial system as a vehicle to develop students’ meta-learning skills. A weekly double-period (90 minute) language and communication tutorial is used to improve students’ essay writing skills and their referencing and comprehension techniques. Students also take a double-period (90 minute) economics tutorial, where they are required to complete and submit written answers to a set tutorial made up of multiple-choice, paragraph/structured/essay, true/false, fill-in, calculation, and case-study questions. The grades received for these assignments contribute towards their final mark. Tutors for both the economics and language and communication tutorials are chosen on the basis of their subject knowledge, their ability to facilitate learning and transmit knowledge, and on the degree of their commitment to enabling academic development students to make a success of their microeconomics course.
The ECO1010F economics tutorials pay less attention to the development of students’ meta-learning skills. Each week, students attend a single-period (45 minute) tutorial during which various multiple-choice and structured/essay-type questions are discussed. Students are required to submit written work less frequently and the grades for these assignments do not count towards their final mark. Further, no language and communication tutorials are offered. Tutors receive less training and support compared to those running the ECO1010H tutorials.
The assessment of the students undertaking the academic development course also differs from the mainstream course. In addition to the tutorials, students are required to complete three essays during the year, and write four tests in addition to the final examination.4 The tests include multiple-choice and structured/essay questions in the ratio of about 30 to 70. In contrast, students in the mainstream economics courses are
4 The final mark is made up as follows: three essays at 5% each (15%), three tests at 5% each (15%), one test at 10%, 20 written economics tutorials (5%) and the final examination (55%).
5
not required to submit essays and their tests consist solely of multiple-choice questions.5
Prior to 2003 (first period)6 academic development students who successfully completed ECO1010H went on to the second-year mainstream microeconomics course (ECO2003F) where they were left to “sink or swim”. Starting in 2003 (second period) a fundamental change was made to the ECO2003F course. Although the content remained much the same7, a strong emphasis was placed on the use of mathematical techniques, rather than graphical analysis, to solve for equilibrium conditions under a variety of circumstances; for example, utility maximisation, cost minimisation and profit maximisation. Students were also expected to use calculus to solve the Cournot, Stackelberg and Bertrand oligopoly models.
In general, academic development students have a low level of mathematical ability as measured by their grades for mathematics and physical science in the matriculation examination. Therefore, it was decided to offer voluntary workshops to academic development students undertaking ECO2003F, which ran once a week for two hours. Two activities predominated; the lecturer revised the key topics and concepts and students were led through a series of exercises, which gave them the opportunity to practise the key mathematical techniques.
In the following section we discuss the empirical methodology used to identify the extent to which the academic performance of the ECO1010H cohort doing ECO2003F is enhanced by the academic development course, ECO1010H. This enables us to identify the long-run benefit of the educational interventions incorporated in ECO1010H on the academic performance of the ECO1010H cohort in ECO2003F. Further, we outline the empirical methodology used to determine the extent to which the introduction of workshops for former ECO1010H students undertaking ECO2003F enabled them to improve their performance in second-year microeconomics. This makes it possible for us to identify the short-run benefit of the educational interventions offered to academic development students doing ECO2003F.
5 The ECO1010F final mark is made up of the marks gained in two or three multiple-choice tests and the final examination. The tests count 45% of the final mark. 6 The first period includes the cohorts for the years, 2000−2002, and the second period the cohorts for years, 2003−2005. 7 Consumer demand theory, theory of the firm, market structure, labour markets, and welfare economics.
6
3. EMPIRICAL METHODOLOGY AND SPECIFICATION
(a) Specification
The purpose of this paper is to test whether the educational interventions are effective in improving the academic performance of academic development students, and to refine the methodology and statistical analysis used to address the sample selection problem. Observations are only included for ECO1010H and ECO1010F students of the 2000–2005 cohorts, registered in the humanities and commerce faculties, and who wrote the South African matriculation examination.8
The cohorts for each of the first and second periods are pooled, and the Heckman two-part procedure is applied. International literature is followed to identify the conditional relationship between membership of ECO1010H and performance in ECO2003F; economics education is viewed as a production process whereby educational performance is a function of a variety of inputs (Edwards 2000). This relationship can be represented as:
D 1010H is a dummy variable that equals 1 for the ECO1010H cohort;
STUDENT includes variables measuring students’ characteristics;
MATRICULATION PERFORMANCE includes variables measuring academic performance in school-leaving subjects;
SCHOOL includes the type of school attended;
OTHER includes other relevant variables such as faculty programme.
The first objective is to assess the effectiveness of the educational interventions incorporated in ECO1010H in the first period on students’ academic performance in ECO2003F. This relationship is identified through the use of a dummy variable, D
8 More than 95% of the ECO1010H students are South African citizens who wrote that country’s matriculation examination, and more than 85% of them were registered in either the humanities or commerce faculties. To improve the match between the ECO1010H and ECO1010F cohorts, international students and students who wrote other matriculation examinations, and students from other faculties, are excluded.
7
1010H, which equals 1 for the ECO1010H cohort. A positive sign for the coefficient of D 1010H suggests that the educational interventions have a positive effect on ECO1010H students’ academic performance relative to the mainstream cohort.
The second objective is to estimate the joint effect of the educational interventions in ECO1010H, and the ECO2003F workshops in the second period, on the academic performance of the ECO1010H cohort relative to the mainstream cohort. A positive sign for the coefficient of D 1010H suggests that the educational interventions have a positive influence on ECO1010H students’ academic performance relative to the mainstream cohort.
The third objective is to estimate the effect of the voluntary workshops on the academic performance of the academic development cohort in the second period. The number of workshops attended (WSHOP) is included as a continuous independent variable. A positive sign for the coefficient of this variable suggests that workshop attendance has a positive impact on the student’s final mark in ECO2003F. A positive sign for the ECO1010H dummy variable, D 1010H, suggests that the educational interventions included in the ECO1010H course also have a positive impact on the academic performance of the academic development cohort relative to the mainstream cohort.
Multivariate analysis is used to estimate the effect of the educational interventions on the academic performance of the ECO1010H cohort relative to the ECO1010F cohort for both periods. In particular, it makes possible the investigation of the effect of workshop attendance on the academic performance of the ECO1010H cohort in the second period conditional on the independent variables discussed above.
Propensity score matching is used to construct a mainstream control group. In essence, this approach estimates the probability that each of the observations in the control group (ECO1010F) falls into the treatment group (ECO1010H) across a set of identified independent variables. The performance of the ECO1010H cohort is then estimated relative to the control group constructed using this matching process for each of the two periods. This method is used to estimate whether the educational interventions in both the first- and second-year microeconomics courses enable the ECO1010H cohort to outperform the ECO1010F cohort in the two periods, conditional on the independent variables.
To obtain the conditional impact of ECO1010H on academic performance, a number of other variables that may explain students’ academic performance in ECO2003F are included; variables for academic performance in school-leaving subjects, and course and student characteristics, which are selected on the basis of international and South African literature.9 These are listed in table 1 below and are now briefly discussed.
Proxies for academic preparedness are important in explaining students’ academic performance at university. Following Edwards (2000) the matriculation points score
9 Edwards (2000), Van Walbeek (2004), Smith (2004), Van der Merwe (2006), Parker (2006), Parker (2007), and Smith and Edwards (2007).
8
calculated by the University of Cape Town10 as a measure of academic preparedness is adjusted as mathematics (HG), English first language (HG) and physical science (HG) are treated as independent variables. The points allocated to mathematics (HG) and (SG), English first language (HG), English second language (HG), and physical science (HG) are deducted from the matriculation points score to calculate the adjusted matriculation points score. Smith and Edwards (2007) report that the coefficient for the adjusted matriculation points score in the ECO2003F multiple-choice component of the final examination is 1.84 percentage points, and for the structured questions, 1.45 percentage points, both statistically significant at the one percent level.
School-leaving subjects that are thought to capture students’ ability, knowledge and skills that facilitate economics understanding are included as independent variables (Smith and Edwards 2007, Smith 2009). These include English first language (HG), mathematics (HG) and physical science (HG). The results for English are mixed; Smith and Edwards (2007) report that the coefficients for this variable, for the multiple choice and structured questions in the final ECO2003F examination, are statistically insignificant at the five percent level. Competence in mathematics is generally found to be strongly associated with academic performance in economics (Van Walbeek 2004, Parker 2006, Smith and Edwards 2007, Smith 2009). Smith and Edwards (2007) report a coefficient for mathematics (HG) of 6.0 percentage points, statistically significant at the one percent level, for the multiple-choice questions. Completion of physical science (physics and chemistry) has been shown to be positively correlated with economics understanding for South African students (Edwards 2000, Smith 2004, Van Walbeek 2004, Smith and Edwards 2007, Smith 2009) but to the authors’ knowledge has not been analysed in the international literature. Smith and Edwards (2007) report coefficients of 6.75 and 3.84 percentage points for the multiple-choice and structured questions, respectively, in the final ECO2003F examination. Both coefficients are statistically significant at the one percent level.
Dummy variables, equal to 1, are included for English first language (HG) and physical science (HG). For mathematics (HG) dummies are included for the grade combinations A+B+C and D+E+F.
10 The University of Cape Town allocates points to matriculation subjects in the following manner. Higher Grade: A=8, B=7, C=6, D=5, E=4, F=3. Standard Grade: Two points less for each symbol.
9
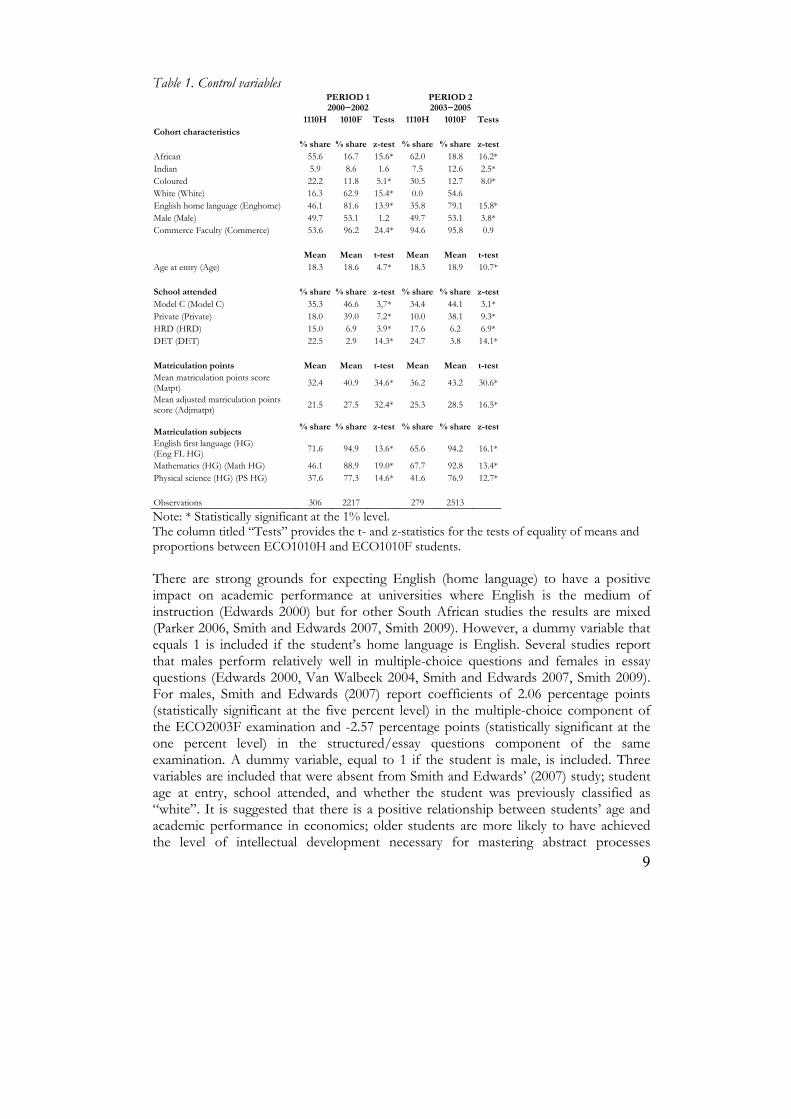
Table 1. Control variables
PERIOD 12000−2002
PERIOD 22003−2005
1110H 1010F Tests 1110H 1010F TestsCohort characteristics % share % share z-test % share % share z-testAfrican 55.6 16.7 15.6* 62.0 18.8 16.2*Indian 5.9 8.6 1.6 7.5 12.6 2.5*Coloured 22.2 11.8 5.1* 30.5 12.7 8.0*White (White) 16.3 62.9 15.4* 0.0 54.6 English home language (Enghome) 46.1 81.6 13.9* 35.8 79.1 15.8*Male (Male) 49.7 53.1 1.2 49.7 53.1 3.8*Commerce Faculty (Commerce) 53.6 96.2 24.4* 94.6 95.8 0.9 Mean Mean t-test Mean Mean t-testAge at entry (Age) 18.3 18.6 4.7* 18.3 18.9 10.7* School attended % share % share z-test % share % share z-testModel C (Model C) 35.3 46.6 3,7* 34.4 44.1 3.1*Private (Private) 18.0 39.0 7.2* 10.0 38.1 9.3*HRD (HRD) 15.0 6.9 3.9* 17.6 6.2 6.9*DET (DET) 22.5 2.9 14.3* 24.7 3.8 14.1* Matriculation points Mean Mean t-test Mean Mean t-testMean matriculation points score (Matpt) 32.4 40.9 34.6* 36.2 43.2 30.6*
Note: * Statistically significant at the 1% level. The column titled “Tests” provides the t- and z-statistics for the tests of equality of means and proportions between ECO1010H and ECO1010F students. There are strong grounds for expecting English (home language) to have a positive impact on academic performance at universities where English is the medium of instruction (Edwards 2000) but for other South African studies the results are mixed (Parker 2006, Smith and Edwards 2007, Smith 2009). However, a dummy variable that equals 1 is included if the student’s home language is English. Several studies report that males perform relatively well in multiple-choice questions and females in essay questions (Edwards 2000, Van Walbeek 2004, Smith and Edwards 2007, Smith 2009). For males, Smith and Edwards (2007) report coefficients of 2.06 percentage points (statistically significant at the five percent level) in the multiple-choice component of the ECO2003F examination and -2.57 percentage points (statistically significant at the one percent level) in the structured/essay questions component of the same examination. A dummy variable, equal to 1 if the student is male, is included. Three variables are included that were absent from Smith and Edwards’ (2007) study; student age at entry, school attended, and whether the student was previously classified as “white”. It is suggested that there is a positive relationship between students’ age and academic performance in economics; older students are more likely to have achieved the level of intellectual development necessary for mastering abstract processes
10
(McConnell 1980). However, the evidence regarding students’ ages is inconclusive (Park and Kerr 1990, Tay 1994, Van Walbeek 2004, Parker 2006, Smith 2009). Age is included as a continuous variable measured in years to the first decimal place. Dummy variables, equal to 1, are included for each of the following types of school: schools that formerly fell under the Department of Education and Training (DET); and schools that formerly fell under the Houses of Representatives and Delegates (HRD). There is little evidence to suggest that students from former DET and HRD schools underperform students from other schools and colleges (Edwards 2000, Smith 2004, Smith 2009) conditional on the usual range of independent variables.
A dummy variable, equal to 1, is included for students previously classified as “white” on the grounds that many advantages accrued to members of the white population under the apartheid regime (Terreblanche 2002). These advantages make it more likely that white children in South Africa have access to material resources that are unavailable to other children. They are more likely to have parents who themselves have a tertiary qualification. Also, they are more likely to come from family backgrounds where it is expected that they will go to university. Smith (2009) reports positive and statistically significant coefficient of 3.43 percentage points for the multiple-choice component of the first-year microeconomics examination.
Finally, many students attend the course more than once before they finally pass, fail or are excluded from the course. A continuous variable is included, which details the number of times each student attended the course.
(b) Estimation issues and limitations
In this study an attempt is made to deal with some of the sample selection issues identified in Smith and Edwards’ (2007) paper. Important variables such as students’ effort, attitude and motivation are still omitted as it is difficult to find suitable proxies. The omission of these variables may result in biased estimates of the coefficients. In particular, if these omitted variables are correlated with doing the ECO1010H course their effect on academic performance may be erroneously attributed to the ECO1010H dummy variable.
An important consideration is the sample-selection problem. Firstly, not all students who start the course go on to write the final examination and complete the course. The main reason is that they do not meet the requirements to do so. For example, students are generally required to write all the tests, hand in a certain number of tutorial assignments, and attend a certain number of their tutorials. The exclusion of these students in the estimations may lead to sample-selection bias (Douglas and Sulock 1995, Parker 2006). This problem applies to both the ECO1010H and ECO1010F cohorts: 5.2% of the ECO1010H cohort and 2.0% of the ECO1010F cohort never wrote the final examination in the first period; and 5.4% of the ECO1010H cohort and 2.0% of the ECO1010F cohort in the second period.
As previously noted the Heckman two-part procedure is used to account for the fact that not all students who started the course wrote the final examination. The first step
11
is to construct a probit estimation to identify the importance of selected variables in explaining whether students wrote the final examination, or not. The variables included are age, schools, English as a home language, and whether the student was classified as “white” under the old dispensation. All these variables are discussed above. In addition a dummy variable, equal to 1, is included if the student passed the first test. This the unique variable used in the probit, but not in the multivariate, estimation. Older students, who were previously classified as “white”, and who have English as their home language are expected to experience less difficulty in adapting to the academic demands made of them at university, and therefore, are more likely to write the final examination. Students who make a success of their first test are also deemed to be more likely to qualify for the final examination and complete the course. However, students from former DET and HRD schools are expected to be less likely to write the final examination and complete the course.
Secondly, the ECO1010F cohort can only act as a control group if it is drawn from the same population as the ECO1010H cohort.11 It may not be possible to make the assumption that students undertaking ECO1010H and ECO1010F are drawn from the same population measured across a broad range of characteristics. The difference in the academic performance of the ECO1010H cohort might be due to their differing set of characteristics rather than the effectiveness of the educational interventions embodied in the ECO1010H course. To test for the extent of the similarity between the two cohorts, differences of means and proportions tests were conducted for each of the continuous and discrete variables. The results of this analysis are presented in table 1 above.
It is clear that the two cohorts differ markedly from one another; in nearly all cases the null hypothesis of equal means or proportions can be rejected. For example, the mean matriculation points score for the ECO1010F cohort is greater than the mean score for the ECO1010H cohort, and is statistically significant at the one percent level. The proportion of students with English as their home language is greater for the ECO1010F cohort, and African students make up a larger proportion of the ECO1010H cohort. Importantly, the ECO1010F cohort shows a strong bias towards mathematics (HG), English first language (HG) and physical science (HG). All these differences are statistically significant at the one percent level.12
Multivariate analysis and propensity score matching are used to control for the independent variables so as to isolate the effect of the educational interventions on the academic performance of the academic development cohort in second-year
11 There is an extensive literature on sample-selection problems – this literature includes Park and Kerr (1990), and Raimondo, Esposito and Gershenberg (1990). 12 Smith and Edwards (2007) used the cohort of students who were repeating the first-year microeconomics course in the second semester (ECO1010S) as a control group. However, in this study the performance of the ECO1010H cohort is compared to that of all the students who took the ECO1010F course in the first semester; it may be that the performance of the ECO1010S cohort in ECO2003F is negatively affected as they failed ECO1010F at their first attempt.
12
microeconomics course. That said, due consideration must still be given to the sample-selection problems when interpreting the results.
4. DATA AND RESULTS (a) Analysis of data This section compares course performance, final course marks, and throughput rates for the ECO1010H and ECO1010F cohorts for each of the two periods. The data are presented in table 2. Table 2. ECO2003F course performance, final course mark and throughput rates
ECO2003F Registered for ECO2003F 306 2217 279 2513 Pass first time 113 1674 13.9* 129 1898 10.4* Percent pass first time 36.9 75.5 46.2 75.5 Pass 205 1987 11.0* 186 2318 13.3* Percent pass 67.0 89.6 66.7 92.2 Did not write final examination 16 45 3.4* 15 51 3.6* Percent did not write 5.2 2.0 5.4 2.0 t-stat t-stat Mean final mark (excluding those who did not write final examination) 50.6% 58.7% 12.7* 50.1% 60.3% 14.4*
Note: * statistically significant at the 1% level. The overall pass rate for ECO2003F is 89.6% for the ECO1010F cohort in the first period, which is 22.6 percentage points greater than that for the ECO1010H cohort. In the second period the difference is 25.5 percentage points. In both periods a greater proportion of the ECO1010H cohort did not write the final examination, and a smaller proportion passed the course at the first attempt. Also, the ECO1010H cohort’s mean final mark for ECO2003F is 8.1 percentage points lower than that achieved by the ECO1010F cohort in the first period and 10.2 percentage points lower in the second period. Finally, a much smaller proportion of the cohort who started ECO1010H passed ECO2003F relative to the ECO1010F cohort. These findings are not surprising given that the ECO1010H cohort has a lower level of academic preparedness as measured by their performance in the matriculation examination. However, the throughput rate for both the ECO1010H and ECO1010F cohorts improved in the second period. The improvement for the ECO1010H cohort is 11.3 percentage points and for ECO1010F, 9.9 percentage points.
13
(b) Estimation results13
(i) Multivariate analysis
The first set of estimations involves the use of ordinary least squares (OLS) multivariate analysis to evaluate the impact of the academic development course (ECO1010H) and workshop attendance on students’ academic performance in the second-year microeconomics course, relative to the mainstream (ECO1010F) cohort.
The results of the estimations for the first period are presented in table 3 below. As a first step only those students who wrote the final examination are included in the estimation (equation 1). The equation is estimated using the highest final course mark as the dependent variable and a selection of the variables in table 1 as explanatory, or independent, variables. Equations (2) and (3) are for the Heckman two-part estimation.
Table 3. Results of the OLS and Heckman two-part estimation for the first period (2000−2002)
Variable (1)
OLS1 (1)
Std Err
(2)Probit
WRITE2
(3) OLS3
(3) Std Err
D 1010H 2.15* 0.84 1.90 5.66 Adjmatpt 1.06** 0.07 0.90 0.46 D Eng FL HG -1.53 0.98 -1.22 6.61 D Math HG ABC 2.67** 0.60 2.08 4.05 D Math HG DEF 0.02 0.25 0.13 1.66 D PSHG 2.16** 0.48 1.68 3.26 Age -0.06 0.18 -0.07 0.68 1.36 D English home 0.11 0.59 -0.17 1.25 4.21 D Male 0.66 0.39 -0.04 2.69 D White 2.62** 0.50 0.27 0.71 3.71 D HRD 1.01 0.77 0.00 1.23 5.49 D DET -0.40 1.10 0.06 -0.15 7.71 D Commerce -0.35 0.77 -0.27 5.21 Course repeated -1.09** 0.38 0.27 2.66 D Pass Test 1 0.88** D Year 2001 0.25 0.51 0.46 3.49 D Year 2002 -1.19* 0.52 -1.71 3.59 IMR -66.1 34.7 C 28.3** 4.46 2.92** 21.6 31.2 R2 0.246 F-stat. 49.8** Chi2 (21 df) 16.1 Prob>Chi2 0.766 Observations 2462 2523 2462
Notes: 1 OLS estimation excluding students who did not write the final examination. 2 Probit estimation for the first part of the Heckman two-part procedure. 3 OLS estimation for the second part of the Heckman two-part procedure. ** and * represent statistical significance at 1% and 5% levels, respectively. Equation 1 reveals that the ECO1010H cohort (D 1010H) outperform their peers on the mainstream by 2.15 percentage points, on average, conditional on the other
13 The statistical programme, STATA, is used for all the estimations.
14
explanatory variables (statistically significant at the five percent level). Equation (2) has a binary dependent variable, WRITE, (did write the final examination). It is estimated to identify the importance of the selected variables in explaining whether students wrote the final examination or not. The result of this estimation is used to calculate the inverse Mills ratio (IMR), which is included as an additional explanatory variable in equation (3). The coefficient for the ECO1010H dummy is 1.90, but is statistically insignificant (equation 3). The chief reason for the statistical insignificance of this, and the other variables, is that the standard error for these variables is very much greater than they are in equation 1.
Together the results of equations (1) and (3) suggest that the educational interventions, designed primarily to improve ECO1010H students quantitative, comprehension and writing skills in first-year microeconomics, also improved their performance in ECO2003F, where assessment is conducted using multiple-choice and structured questions in tutorials, tests and examinations.
We also included two quadratic terms, Adjmatpt2 and AGE2 to establish the returns to age and academic ability, as measured by the adjusted matriculation points score. The returns to academic ability are positive and statistically significant at the one percent level, although the coefficient is very small (0.07). The returns to age are positive, but statistically insignificant at the 10% level.
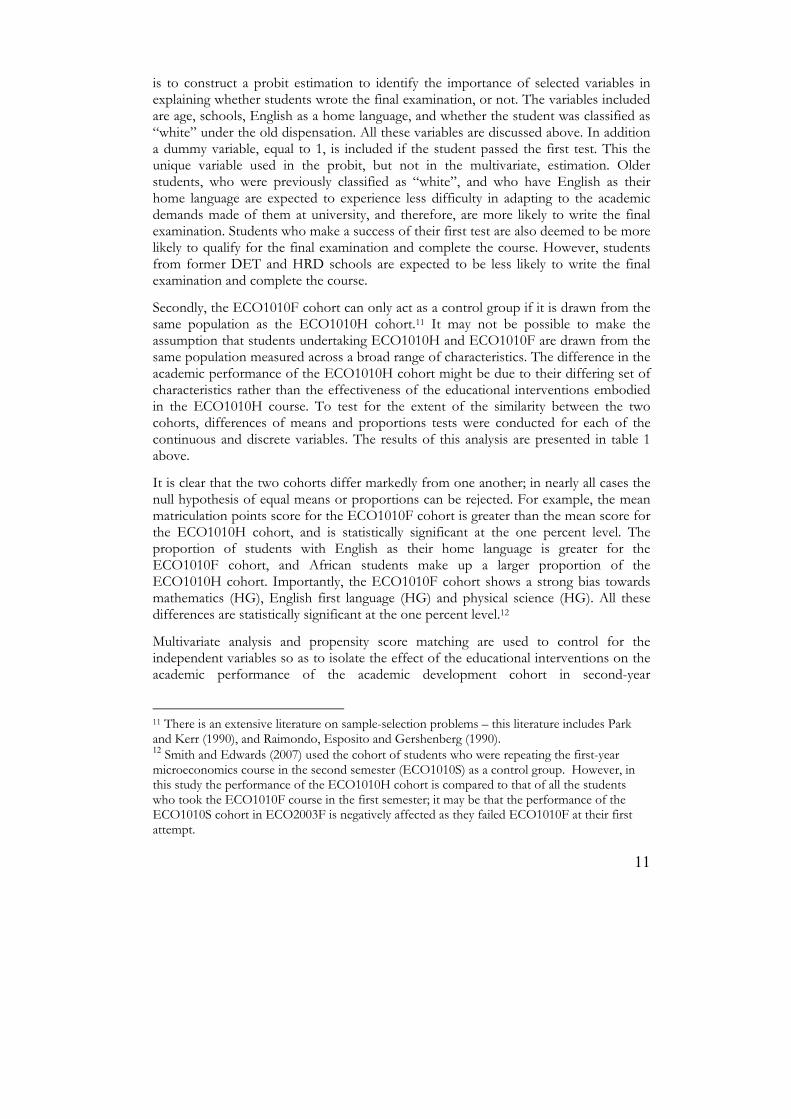
The results for the same set of estimations in respect of the second period are presented in table 4. The variable for workshop attendance is excluded as we wish to estimate the effect of the educational interventions in both the first- and second-year microeconomics courses on academic performance of the ECO1010H cohort in ECO2003F.
15
Table 4. Results of the OLS and Heckman two-part estimation for the second period without workshops
Variable (1)
OLS1 (1)
Std Err
(2)Probit
WRITE2
(3) OLS3
(3) Std Err
D 1010H -1.43 0.81 1.16 3.30 D WSHOP Adjmatpt 0.94** 0.07 0.90** 0.29 D Eng FL HG 0.19 1.02 0.46 4.19 D Math HG ABC 5.28** 0.79 4.51 3.18 D Math HG DEF 0.84 0.85 0.79 3.40 D PSHG 3.40** 0.51 3.19 2.08 Age -0.41 0.24 -0.04 -0.17 1.01 D English home -1.04 0.57 -0.08 -1.17 2.40 D Male -0.40 0.40 -0.42 1.63 D White 2.49** 0.48 0.13 2.08 2.02 D HRD 0.25 0.78 0.08 -0.31 3.33 D DET 0.01 1.12 0.50 -1.30 4.72 D Commerce -0.66 1.00 -0.43 4.05 Course repeated -2.57** 0.40 -0.67 1.72 D Pass Test 1 1.19** IMR -42.8** 14.8 D year 2004 -1.97* 0.51 -2.92 2.11 D Year 2005 1.22* 0.47 0.34 1.96 C 37.5** 5.47 2.15 35.3 22.8 R2 0.234 F-stat. 51.7** Chi2 (21 df) 36.8 Prob>Chi2 0.018 Observations 2726 2792 2726
Notes: 1 OLS estimation excluding students who did not write the final examination. 2 Probit estimation for the first part of the Heckman two-part procedure. 3 OLS estimation for the second part of the Heckman two-part procedure ** and * represent statistical significance at 1% and 5% levels, respectively. The coefficients for the ECO1010H dummy (equations 1 and 3) are statistically insignificant at the 10% level. This finding suggests that the educational interventions in both the first- and second-year microeconomics courses had no discernable effect on the academic performance of the academic development cohort, relative to the mainstream cohort, conditional on the control variables.
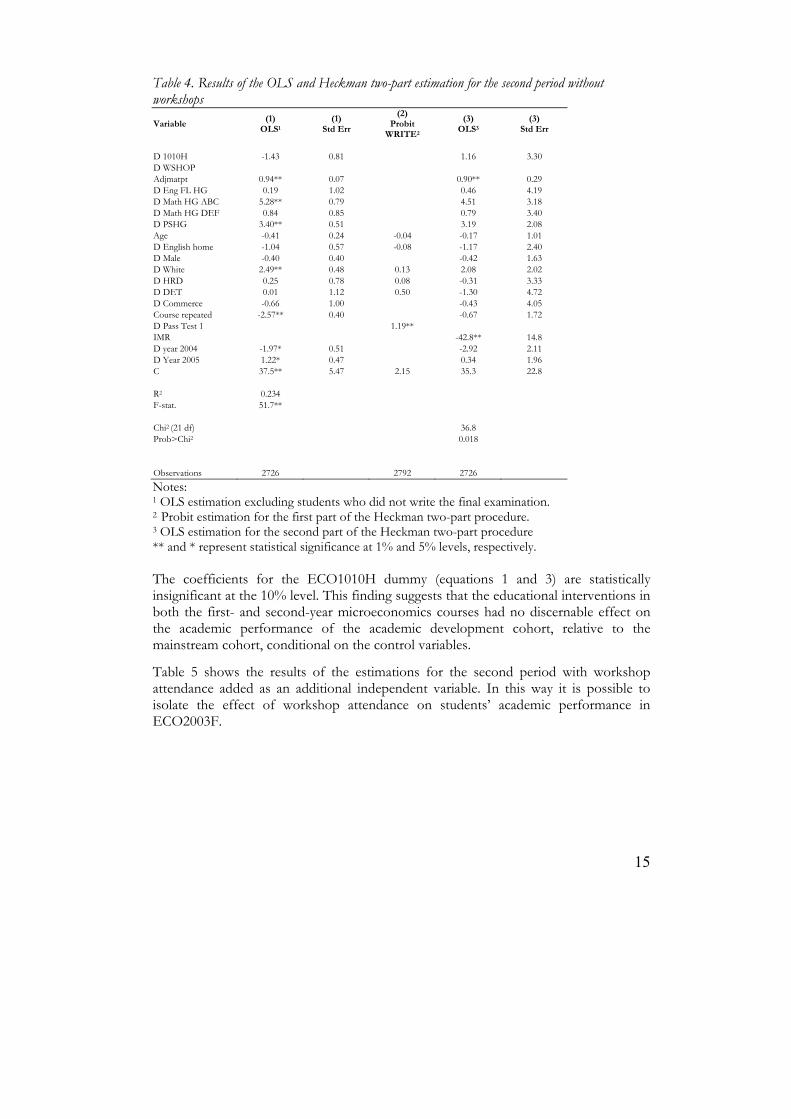
Table 5 shows the results of the estimations for the second period with workshop attendance added as an additional independent variable. In this way it is possible to isolate the effect of workshop attendance on students’ academic performance in ECO2003F.
16
Table 5. Results of the OLS and Heckman two-part estimation for the second period with workshops
Variable (1)
OLS1 (1)
Std Err
(2)Probit
WRITE2
(3) OLS3
(3) Std Err
D 1010H -3.13** 0.97 -2.76 3.88 D WSHOP 0.49** 0.15 0.46 0.62 Adjmatpt 0.94** 0.07 0.89** 0.21 D Eng FL HG 0.41 1.02 0.67 4.18 D Math HG ABC 5.34** 0.79 4.57 3.17 D Math HG DEF 0.99 0.85 0.93 3.39 D PSHG 3.41** 0.51 3.21 2.08 Age -0.40 0.24 -0.04 -0.16 1.01 D English home -0.91 0.57 0.08 -1.04 2.40 D Male -0.41 0.40 -0.43 1.62 D White 2.41** 0.76 0.13 2.01 2.02 D HRD 0.08 0.79 0.08 -0.46 3.33 D DET -0.39 1.12 0.50 -1.67 4.72 D Commerce -0.69 1.00 -0.46 4.04 Course repeated -2.57** 0.40 -0.67 1.71 D Pass Test 1 1.19** IMR -42.6** 14.8 D Year 2004 -1.98** 0.51 -2.92 2.10 D Year 2005 1.20* 0.47 0.33 1.95 C 37.2** 5.46 2.15 35.0 22.8 R2 0.237 0.272 F-stat. 49.5** 59.6** Chi2 (21 df) 37.7 Prob>Chi2 0.198 Observations 2462 2523 2726
Notes: 1 OLS estimation excluding students who did not write the final examination. 2 Probit estimation for the first part of the Heckman two-part procedure. 3 OLS estimation for the second part of the Heckman two-part procedure ** and * represent statistical significance at 1% and 5% levels, respectively. The coefficient for the ECO1010H dummy (D 1010H) is -3.13 and is statistically significant at the one percent level. This result suggests that the educational interventions incorporated in the ECO1010H course did not have a positive effect on the academic performance of the ECO1010H cohort in ECO2003F conditional on workshop attendance and the other explanatory variables. The main reason for the relatively poor academic performance of the ECO1010H cohort may lie in the changes made to the content of the second-year microeconomics course in 2003, which is described in section 2. In short, the first-year microeconomics course (ECO1010H) did not equip students with the mathematical skills required to make a success of ECO2003F.14
However, the coefficient for workshop attendance is 0.49 and is statistically significant at the one percent level. This implies that the students’ course mark increases by 0.49 percentage points, on average, for each of the 12 workshops attended on average. This
14 It is noted that, in general, these findings differ from those made by Smith and Edwards (2007). They used data for a single year’s cohort, a control group of students who had failed the first-semester course in microeconomics, and the performance of students at their first attempt at the ECO2003F. In short, the two studies are not comparable.
17
result suggests that the educational interventions, specifically the focus on improving students’ understanding of mathematical concepts and the application of mathematical techniques, enabled those students who attended the workshops to outperform their peers, conditional on the independent variables. However, it is possible that workshop attendance is a function of the students’ level of motivation. Students who are motivated to succeed may be more likely to attend the workshops; they may have achieved good results whether they attended the workshops or not. In this regard it is worth noting that the ECO1010H students who achieved higher marks in the final examination of the first-year microeconomics course tended to attend more of the ECO2003F workshops.15 This finding may suggest that it is the more academically able academic development students who are more likely to attend the workshops.
We included the quadratic terms, Adjmatpt2, WSHOP2 and AGE2, in our second period estimation to estimate the returns academic ability, workshop attendance and age. There are increasing returns to age (0.11) and academic ability (0.02), and diminishing returns to workshop attendance (-0.10). However, with the exception of academic ability, as measured by the adjusted matriculation points score, the results are statistically insignificant at the 10% level.
Looking at the other variables, the results are generally consistent with Smith and Edwards’ (2007) findings. A background in mathematics (HG) improves academic performance. For example, students who achieved an A, B or C in mathematics (HG) (D Math HG ABC) scored on average 2.67 percentage points more in the first period than students who achieved lower grades for mathematics (HG), or had done mathematics (SG). The size of the coefficient increases to 5.34 percentage points in the second period. This finding is consistent with the fact that the course content became more mathematically orientated in the second period. Similarly, the coefficient for physical science (HG) (D PSHG) increased from 2.16 to 3.41 percentage points. The coefficient for the adjusted matriculation points score averages 1.00; a one point increase in the adjusted matriculation points score results in a one percentage point increase in the final course mark, on average, conditional on the independent variables. As in the Smith and Edward’s (2007) study all these results are statistically significant at the one percent level.
Turning to the remaining variables, the coefficient of English home language (D Enghome) is positive in the first period and negative in the second period, but statistically insignificant. In previous studies (Edwards 2000, Smith and Edwards 2007, Smith 2009) contradictory results have also been obtained for this variable. The coefficients for male are also statistically insignificant. Students who would have been previously classified as “white” enjoy an average premium of 2.55 percentage points. The type of school attended does not seem to be an important factor in determining performance conditional on the other independent variables. The coefficient for the inverse Mills ratio (IMR) is negative in both periods. It is statistically insignificant in the first period and statistically significant, at the one percent level, in the second period. This suggests
15 The mean mark achieved in first-year microeconomics by the academic development students who attended between seven and 12 workshops is 62.7%, between one and six workshops, 58.2%, and no workshops, 56.4%, and the correlation coefficient is 0.25.
18
that excluding those students who did not write the final examination from the estimations only leads to a biased set of results in the second period. That said, the Heckman is not particularly well specified as there is only one exclusion restriction, whether the student passed test 1, or not. Also, relatively few students did not write the final examination. Therefore, given that the OLS and Heckman two-part estimations give a similar set of coefficients for the independent variables the best approach may be to rely on the OLS estimation that only includes students who wrote the final examination.
Finally, the R2’s vary between 0.234 and 0.246. This implies that at least 23.4% of the variation in the final course mark is explained by the independent variables included in the estimations. This also suggests that there are omitted variables that may have a significant role in explaining the variation in the final course mark.
(ii) Propensity score matching
We now turn to the propensity score matching (PSM) estimations. The purpose of PSM is to construct a control group that shows a greater similarity to the treated group (ECO1010H cohort) across the range of independent variables. It is noted that in the second period no students previously classified as “white” did the ECO1010H course. Therefore, the variable “white” is excluded in the matching process. The results of the estimations for both periods are presented in tables 6 and 7.16
16 “Epan” is the kernel type used in the two estimations.
19
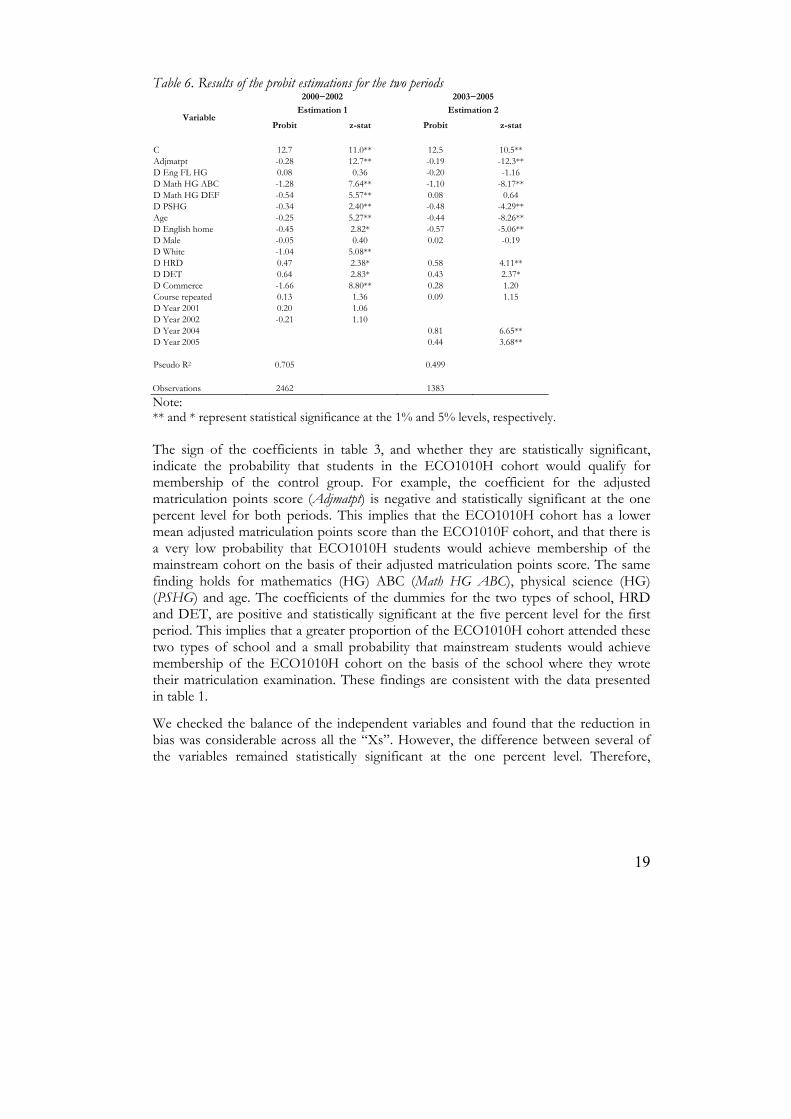
Table 6. Results of the probit estimations for the two periods 2000−2002 2003−2005
Variable Estimation 1 Estimation 2
Probit z-stat Probit z-stat
C 12.7 11.0** 12.5 10.5** Adjmatpt -0.28 12.7** -0.19 -12.3** D Eng FL HG 0.08 0.36 -0.20 -1.16 D Math HG ABC -1.28 7.64** -1.10 -8.17** D Math HG DEF -0.54 5.57** 0.08 0.64 D PSHG -0.34 2.40** -0.48 -4.29** Age -0.25 5.27** -0.44 -8.26** D English home -0.45 2.82* -0.57 -5.06** D Male -0.05 0.40 0.02 -0.19 D White -1.04 5.08** D HRD 0.47 2.38* 0.58 4.11** D DET 0.64 2.83* 0.43 2.37* D Commerce -1.66 8.80** 0.28 1.20 Course repeated 0.13 1.36 0.09 1.15 D Year 2001 0.20 1.06 D Year 2002 -0.21 1.10 D Year 2004 0.81 6.65** D Year 2005 0.44 3.68** Pseudo R2 0.705 0.499 Observations 2462 1383
Note: ** and * represent statistical significance at the 1% and 5% levels, respectively. The sign of the coefficients in table 3, and whether they are statistically significant, indicate the probability that students in the ECO1010H cohort would qualify for membership of the control group. For example, the coefficient for the adjusted matriculation points score (Adjmatpt) is negative and statistically significant at the one percent level for both periods. This implies that the ECO1010H cohort has a lower mean adjusted matriculation points score than the ECO1010F cohort, and that there is a very low probability that ECO1010H students would achieve membership of the mainstream cohort on the basis of their adjusted matriculation points score. The same finding holds for mathematics (HG) ABC (Math HG ABC), physical science (HG) (PSHG) and age. The coefficients of the dummies for the two types of school, HRD and DET, are positive and statistically significant at the five percent level for the first period. This implies that a greater proportion of the ECO1010H cohort attended these two types of school and a small probability that mainstream students would achieve membership of the ECO1010H cohort on the basis of the school where they wrote their matriculation examination. These findings are consistent with the data presented in table 1.
We checked the balance of the independent variables and found that the reduction in bias was considerable across all the “Xs”. However, the difference between several of the variables remained statistically significant at the one percent level. Therefore,
20
although the treated and untreated populations are now more alike, it cannot be said that the two groups come from the same population.17
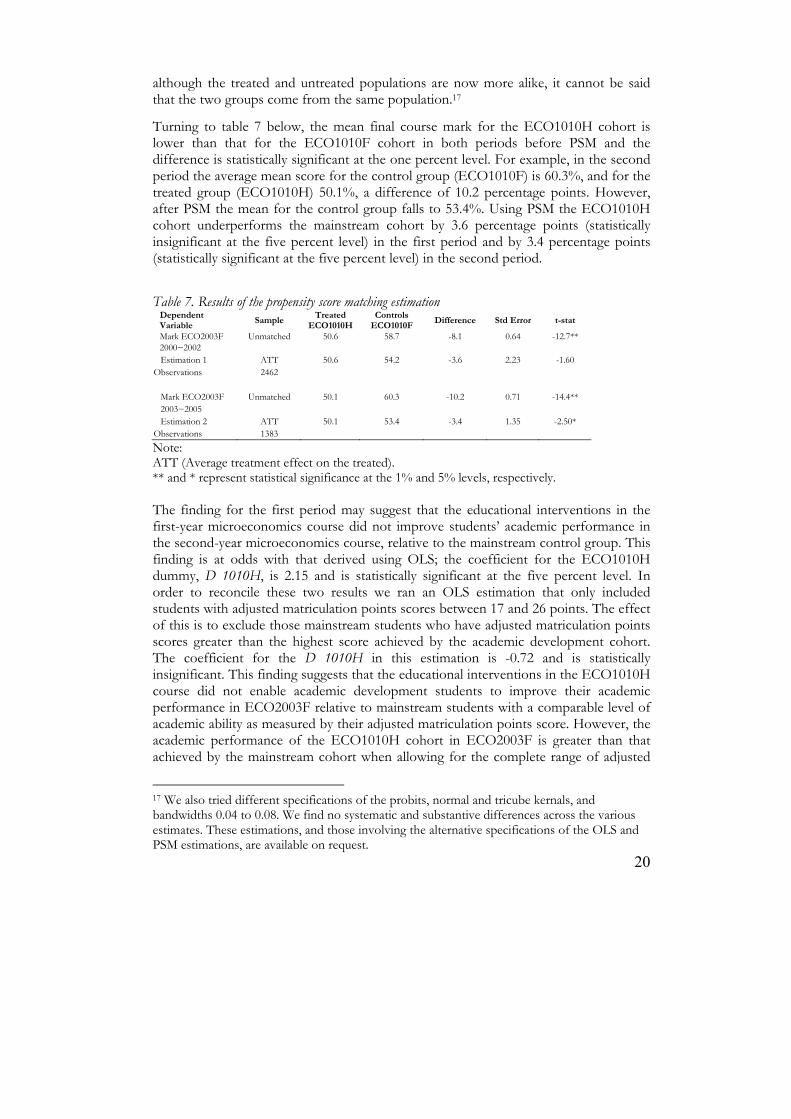
Turning to table 7 below, the mean final course mark for the ECO1010H cohort is lower than that for the ECO1010F cohort in both periods before PSM and the difference is statistically significant at the one percent level. For example, in the second period the average mean score for the control group (ECO1010F) is 60.3%, and for the treated group (ECO1010H) 50.1%, a difference of 10.2 percentage points. However, after PSM the mean for the control group falls to 53.4%. Using PSM the ECO1010H cohort underperforms the mainstream cohort by 3.6 percentage points (statistically insignificant at the five percent level) in the first period and by 3.4 percentage points (statistically significant at the five percent level) in the second period.
Table 7. Results of the propensity score matching estimation
Dependent Variable
Sample Treated
ECO1010H Controls
ECO1010F Difference Std Error t-stat
Mark ECO2003F Unmatched 50.6 58.7 -8.1 0.64 -12.7** 2000−2002
Estimation 1 ATT 50.6 54.2 -3.6 2.23 -1.60 Observations 2462 Mark ECO2003F Unmatched 50.1 60.3 -10.2 0.71 -14.4** 2003−2005 Estimation 2 ATT 50.1 53.4 -3.4 1.35 -2.50* Observations 1383
Note: ATT (Average treatment effect on the treated). ** and * represent statistical significance at the 1% and 5% levels, respectively. The finding for the first period may suggest that the educational interventions in the first-year microeconomics course did not improve students’ academic performance in the second-year microeconomics course, relative to the mainstream control group. This finding is at odds with that derived using OLS; the coefficient for the ECO1010H dummy, D 1010H, is 2.15 and is statistically significant at the five percent level. In order to reconcile these two results we ran an OLS estimation that only included students with adjusted matriculation points scores between 17 and 26 points. The effect of this is to exclude those mainstream students who have adjusted matriculation points scores greater than the highest score achieved by the academic development cohort. The coefficient for the D 1010H in this estimation is -0.72 and is statistically insignificant. This finding suggests that the educational interventions in the ECO1010H course did not enable academic development students to improve their academic performance in ECO2003F relative to mainstream students with a comparable level of academic ability as measured by their adjusted matriculation points score. However, the academic performance of the ECO1010H cohort in ECO2003F is greater than that achieved by the mainstream cohort when allowing for the complete range of adjusted
17 We also tried different specifications of the probits, normal and tricube kernals, and bandwidths 0.04 to 0.08. We find no systematic and substantive differences across the various estimates. These estimations, and those involving the alternative specifications of the OLS and PSM estimations, are available on request.
21
matriculation points scores, conditional on the explanatory variables. As regards this finding we are inclined to accept the results that follow from using the estimation that includes all the observations. The adjusted matriculation points score is only one of many control variables that may influence the size of the coefficient of the ECO1010H dummy variable.
Turning to the second period the OLS and PSM estimations also give different results. The coefficient of the ECO1010H dummy variable is -1.43 (statistically insignificant) for the OLS estimation, and -3.40 (statistically significant at the five percent level) for the PSM estimation. However, these results can be reconciled. If the variable for students previously classified as “white”, White, is excluded from the OLS estimation the coefficient for D 1010H is -1.80 and statistically significant at the five percent level. Also, if the variable White is excluded as a matching variable from the PSM estimation the coefficient for D 1010H is -2.47 and statistically insignificant. Controlling for white students in the OLS estimation, and excluding them as a matching variable from the PSM estimation, leads us to the same conclusion; the educational interventions included in the first- and second-year microeconomics courses did not have a statistically significant effect on the academic performance of the academic development cohort in ECO2003F.
(c) Effect of the interventions on pass rates
In this section the effect of the premium earned by the ECO1010H cohort in the first period, and by those students who attended the workshops in the second period, on the overall pass rate in these two courses, is calculated.
Table 8 shows the effect of the premium of 2.15 percentage points (table 3, equation 1) on the pass rate for the ECO1010H cohort in ECO2003F in the first period.18
Table 8. Pass rates for the ECO1010H cohort for 2000−2002 Total Percentage Number of students 306 100 Pass (premium of 2.15percentage points)
191 62.4
Pass (no premium) 156 51.0
The average pass rate for the three-year period is 62.4%. However, if these same students had attended the ECO1010F course, they would not have enjoyed a premium of 2.15 percentage points, and their pass rate would have fallen to 51.0%. In other words, 35 students may be said to have passed the course they otherwise would not have passed. This represents 11.4% of the cohort.
18 We choose to use the coefficient derived using the first estimation as the Heckman two-part estimation is not particularly well specified and only a small proportion of the cohort did not write the final examination.
22
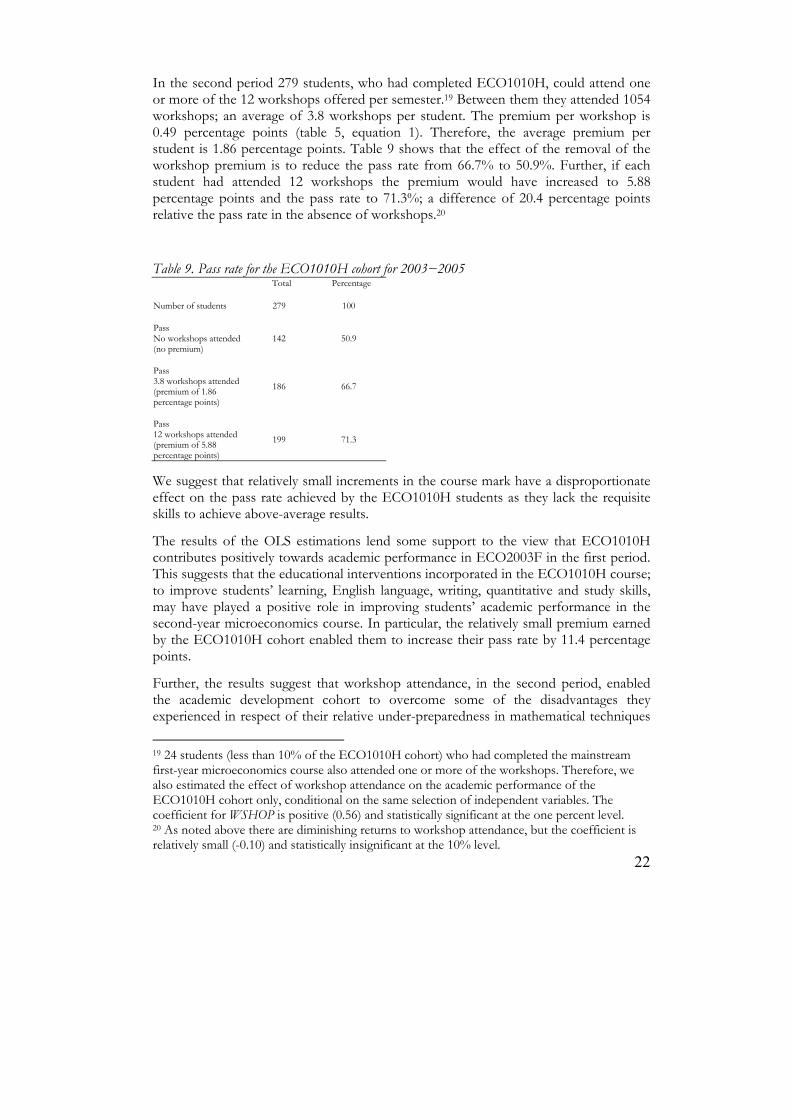
In the second period 279 students, who had completed ECO1010H, could attend one or more of the 12 workshops offered per semester.19 Between them they attended 1054 workshops; an average of 3.8 workshops per student. The premium per workshop is 0.49 percentage points (table 5, equation 1). Therefore, the average premium per student is 1.86 percentage points. Table 9 shows that the effect of the removal of the workshop premium is to reduce the pass rate from 66.7% to 50.9%. Further, if each student had attended 12 workshops the premium would have increased to 5.88 percentage points and the pass rate to 71.3%; a difference of 20.4 percentage points relative the pass rate in the absence of workshops.20
Table 9. Pass rate for the ECO1010H cohort for 2003−2005 Total Percentage Number of students 279 100 Pass No workshops attended (no premium)
142 50.9
Pass 3.8 workshops attended (premium of 1.86 percentage points)
186 66.7
Pass 12 workshops attended (premium of 5.88 percentage points)
199 71.3
We suggest that relatively small increments in the course mark have a disproportionate effect on the pass rate achieved by the ECO1010H students as they lack the requisite skills to achieve above-average results.
The results of the OLS estimations lend some support to the view that ECO1010H contributes positively towards academic performance in ECO2003F in the first period. This suggests that the educational interventions incorporated in the ECO1010H course; to improve students’ learning, English language, writing, quantitative and study skills, may have played a positive role in improving students’ academic performance in the second-year microeconomics course. In particular, the relatively small premium earned by the ECO1010H cohort enabled them to increase their pass rate by 11.4 percentage points.
Further, the results suggest that workshop attendance, in the second period, enabled the academic development cohort to overcome some of the disadvantages they experienced in respect of their relative under-preparedness in mathematical techniques
19 24 students (less than 10% of the ECO1010H cohort) who had completed the mainstream first-year microeconomics course also attended one or more of the workshops. Therefore, we also estimated the effect of workshop attendance on the academic performance of the ECO1010H cohort only, conditional on the same selection of independent variables. The coefficient for WSHOP is positive (0.56) and statistically significant at the one percent level. 20 As noted above there are diminishing returns to workshop attendance, but the coefficient is relatively small (-0.10) and statistically insignificant at the 10% level.
23
and applications. We suggest that the reason for the statistical insignificance of the ECO1010H dummy in the second period in both the PSM and OLS estimations is that the ECO1010H course no longer prepared students for the more mathematically orientated second-year microeconomics course. Also, too few of the academic development students attended the workshops, and of those that did, too many attended relatively few workshops.21
5. CONCLUSION
In this paper the effectiveness of educational interventions in first- and second-year microeconomics courses on the academic performance of academic development students in the second-year microeconomics course is investigated. Equally important, is the methodology, specification, and statistical analysis used to ensure a robust set of results. In particular, specific attention is paid to addressing the sample selection problem.
As regards the latter, the use of the Heckman two-part procedure, the tracking of students through their second-year microeconomics career, and the pooling of cohorts, results in a more robust set of findings than is previously the case. In addition both multivariate analysis and propensity score matching are used as means to control for the effect of a selection of independent variables on the value of the dependent variable.
To the extent that the academic development cohort outperformed the mainstream cohort in the first period, conditional on the independent variables, it is possible to conclude, leaving aside the problem of sample-selection bias, that the educational interventions included in the academic development course (ECO1010H) had a positive impact on students’ academic performance in the second-year microeconomics course (ECO2003F). Although the premium is relatively small it has the effect of raising the ECO2003F pass rate of the ECO1010H cohort by some 11 percentage points.
The results also suggest that the educational interventions included in the ECO1010H and ECO2003F courses did not improve the academic performance of the academic development cohort, relative to the ECO1010F cohort, in the second period. Firstly, the educational interventions included in the ECO1010H course did not enable students to cope with the increased mathematical nature of the second-year course. Secondly, too few students attended the voluntary workshops that were introduced to improve their competence in applying mathematical techniques. However, the results do suggest that for each workshop attended the final course mark increased by 0.49 percentage points on average, conditional on the independent variables. This translates
21 102 of the 279 students making up the ECO1010H cohort, or 36.6%, did not attend a single workshop.
24
into an average premium of 1.86 percentage points, and an improvement in the pass rate for the ECO1010H cohort of some 16 percentage points.
The key variables that may explain the relative success of the educational interventions included in ECO1010H in the first period are the tutorials in economics, and language and communication, and the module designed to develop students’ quantitative and graphical skills. The time that students spent in the workshops honing their ability to use mathematics in economic applications may have been beneficial in improving students’ performance in the second-year microeconomics course.
25
REFERENCES
EDWARDS, L. (2000). An econometric evaluation of academic development programmes in economics. South African Journal of Economics, 68 (3): 455–483. MCCONNELL, C. (1980). Economics 101: Where do we stand? Journal of Economic Education, 12 (1): 15–22. PARK, K.H. and KERR, P. (1990). Determinants of academic performance: A multinomial approach. Journal of Economic Education, 21 (2): 101–111. PARKER, K. (2006). The effect of student characteristics on achievement in introductory microeconomics in South Africa. South African Journal of Economics, 74 (1): 137–149. –––––– (2007). Correcting for sampling bias in education production functions. South African Journal of Economics, 75 (1): 118–124. RAIMONDO, H.J., ESPOSITO, L. and GERSHENBERG, I. (1990). Introductory class size and student performance in intermediate theory courses. Journal of Economic Education, 21 (4): 369–381. SCOTT, I., N. Yeld and J. Hendry. (2007). A case for improving teaching and learning in South African higher education. HE Monitor 6 (October). SMITH, L.C. (2004). A multivariate evaluation of mainstream and academic development courses in first-year microeconomics at the University of Cape Town: A comparative study. Unpublished Masters dissertation, School of Economics, University of Cape Town. –––––– and EDWARDS, L.E. (2007). A multivariate evaluation of mainstream and academic development courses in first-year microeconomics. South African Journal of Economics, 75 (1): 99–117. –––––– (2009). An analysis of the impact of pedagogic interventions in first-year academic development and mainstream courses in microeconomics. South African Journal of Economics, 77 (1): 162–178. TAY, R. (1994). Students’ performance in economics: Does the norm hold across cultural and institutional settings? Journal of Economic Education, 25 (4): 291–301. TERREBLANCHE, S. (2002). A History of Inequality in South Africa 1652-2002. University of Natal Press, Scottsville and KMM Review Publishing, Sandton. VAN DER MERWE, A. (2006). Identifying some constraints in first year economics teaching at a typical South African university of technology. South African Journal of Economics, 74 (1): 150–159. VAN WALBEEK, C. (2004). Does lecture attendance matter? Some observations from a first-year economics course at the University of Cape Town. South African Journal of Economics, 72 (3): 11–32.
The Southern Africa Labour and Development Research UnitThe Southern Africa Labour and Development Research Unit (SALDRU) conducts research directed at improving the well-being of South Africa’s poor. It was established in 1975. Over the next two decades the unit’s research played a central role in documenting the human costs of apartheid. Key projects from this period included the Farm Labour Conference (1976), the Economics of Health Care Conference (1978), and the Second Carnegie Enquiry into Poverty and Development in South Africa (1983-86). At the urging of the African Na-tional Congress, from 1992-1994 SALDRU and the World Bank coordinated the Project for Statistics on Living Standards and Development (PSLSD). This project provide baseline data for the implementation of post-apartheid socio-economic policies through South Africa’s first non-racial national sample survey. In the post-apartheid period, SALDRU has continued to gather data and conduct research directed at informing and assessing anti-poverty policy. In line with its historical contribution, SALDRU’s researchers continue to conduct research detailing changing patterns of well-being in South Africa and assessing the impact of government policy on the poor. Current research work falls into the following research themes: post-apartheid poverty; employment and migration dynamics; family support structures in an era of rapid social change; public works and public infrastructure programmes, financial strategies of the poor; common prop-erty resources and the poor. Key survey projects include the Langeberg Integrated Family Survey (1999), the Khayelitsha/Mitchell’s Plain Survey (2000), the ongoing Cape Area Panel Study (2001-) and the Financial Diaries Project.
Southern Africa Labour and Development Research UnitSchool of Economics
University of Cape TownPrivate Bag, Rondebosch, 7701