36
Measuring the Quality of Hospital Care Min Hua Jen Imperial College London
| Date post: | 27-Dec-2015 |
| Category: |
Documents |
| Upload: | donald-parsons |
| View: | 218 times |
| Download: | 2 times |
Measuring the Quality of Hospital Care
Min Hua JenImperial College London

Contents
Background
English Hospital Statistics
Case-mix adjustment
Presentation of performance data• League tables• Bayesian ranking• Statistical process Control Charts
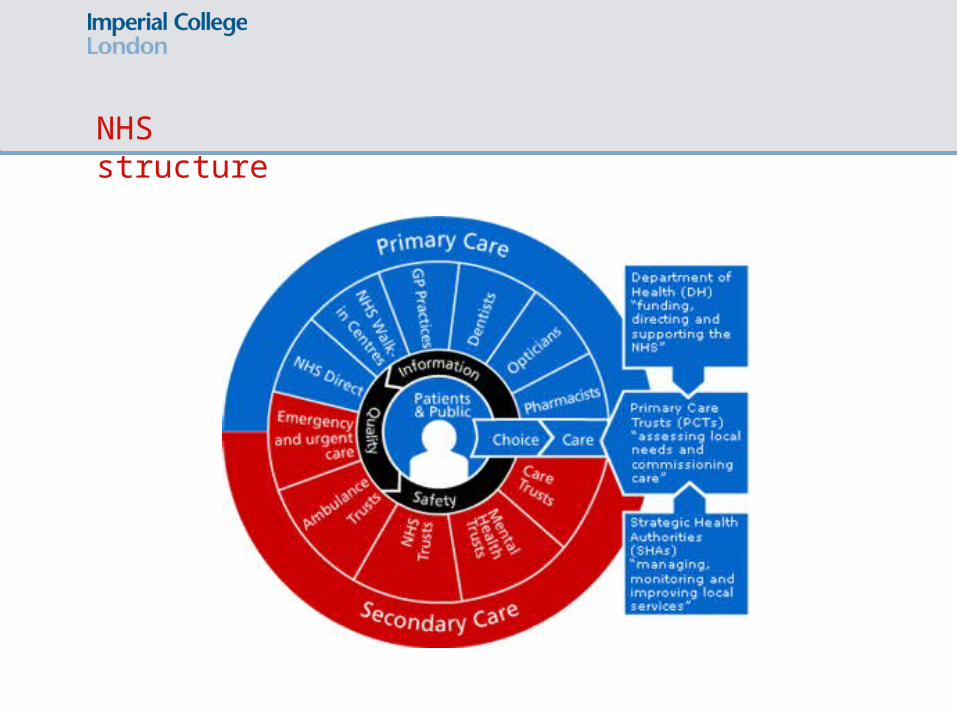
NHS structure
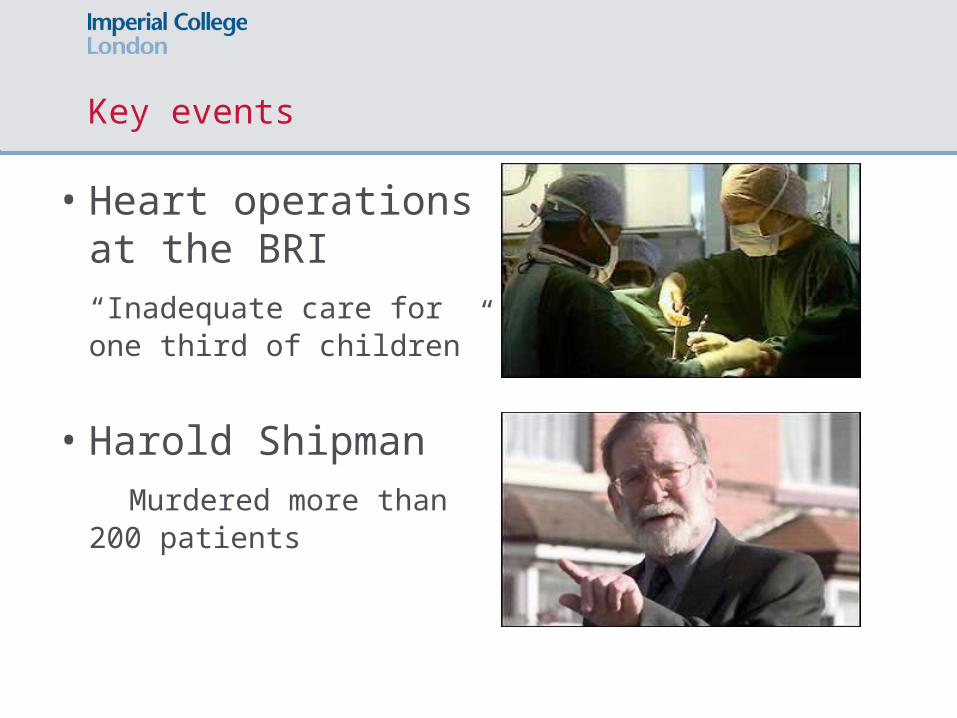
• Heart operations at the BRI “Inadequate care for one third of children”
• Harold Shipman Murdered more than 200
patients
Key events

Bristol (Kennedy) Inquiry Report Data were available all the time
“From the start of the 1990s a national database existed at the Department of Health (the Hospital Episode Statistics database) which among other things held information about deaths in hospital. It was not recognised as a valuable tool for analysing the performance of hospitals. It is now, belatedly.”
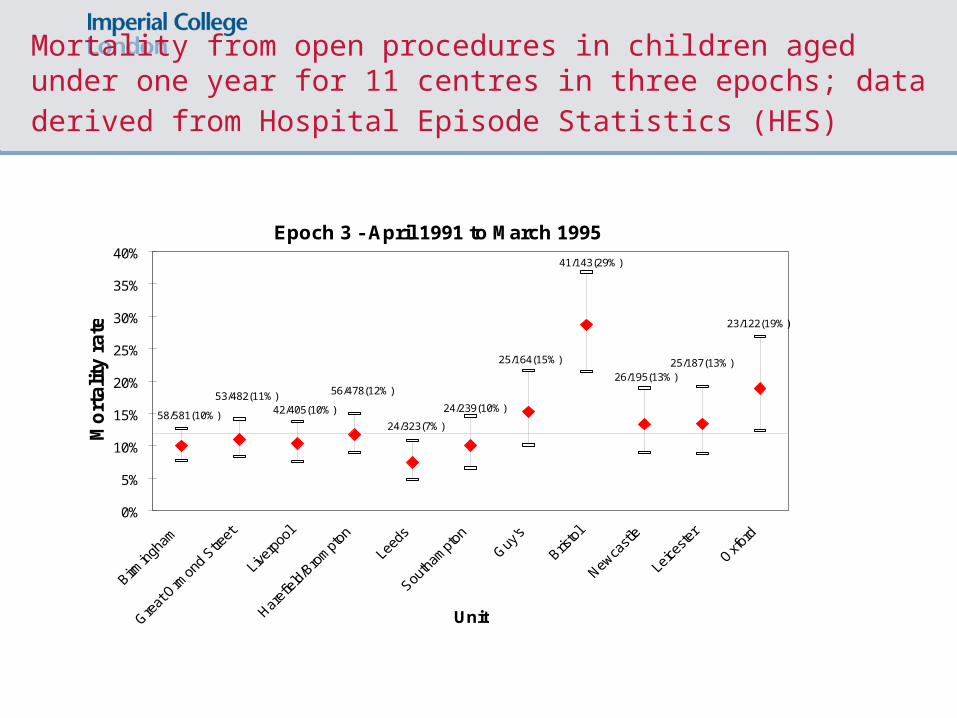
Mortality from open procedures in children aged under one year for 11 centres in three epochs; data derived from Hospital Episode Statistics (HES)
Epoch 3 - April 1991 to March 1995
58/581(10%)
53/482(11%)42/405(10%)
56/478(12%)
24/323(7%)
24/239(10%)
25/164(15%)
41/143(29%)
26/195(13%)25/187(13%)
23/122(19%)
0%
5%
10%
15%
20%
25%
30%
35%
40%
Unit
Mo
rta
lity
ra
te
------- Mortality for 11 centres combined = 397/3,319(12%)
Following the Bristol Royal Infirmary Inquiry
• Commission for Health Improvement (now Healthcare Commission) - regularly inspect Britain's hospitals and publish some limited performance figures.
• National Clinical Assessment Authority – investigates any brewing crisis.
• National Patient Safety Agency collates information on medical errors.
• Annual appraisals for hospital consultants• Revalidation, a system in which doctors have to
prove they are still fit to practice every five years
Hospital Episode Statistics
Electronic record of every inpatient or day case episode of patient care in every NHS (public) hospital14 million records a year300 fields of information including
• Patient details such as age, sex, address• Diagnosis using ICD10• Procedures using OPCS4• Admission method• Discharge method
Why use Hospital Episode Statistics
• Comprehensive – collected by all NHS trusts across country on all patients
• Coding of data separate from clinician• Access• Updated monthly from SUS (previously NHS Wide Clearing Service)
Case mix adjustment
Limited within HES?• Age• Sex• Emergency/Elective

Risk adjustment models using HES on 3 index procedures
• CABG• AAA• Bowel resection for colorectal cancer
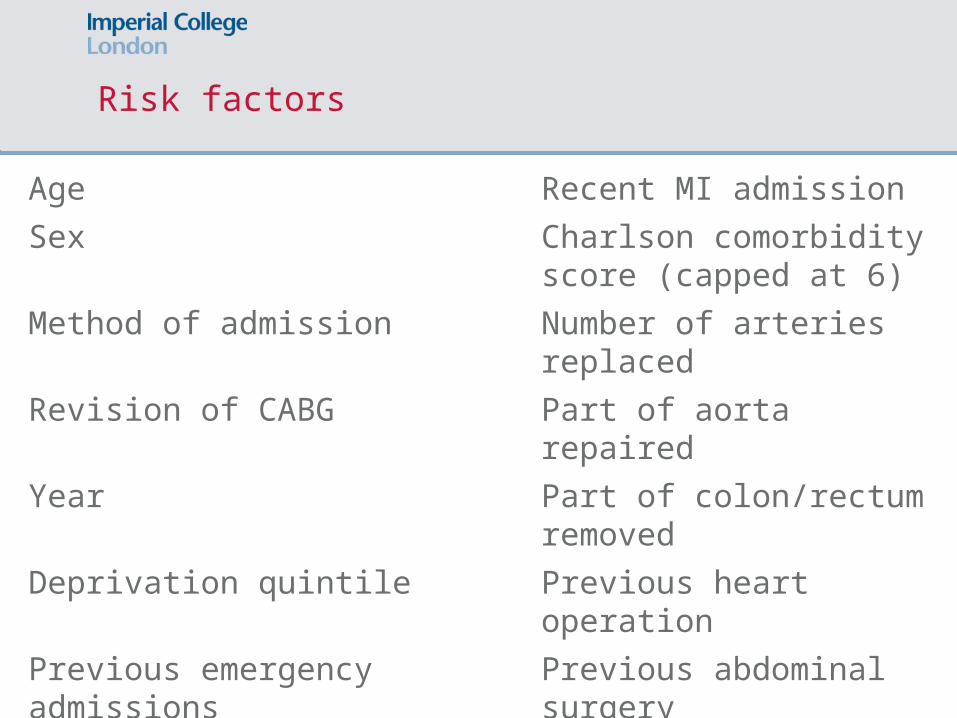
Risk factors
Age Recent MI admission
Sex Charlson comorbidity score (capped at 6)
Method of admission Number of arteries replaced
Revision of CABG Part of aorta repaired
Year Part of colon/rectum removed
Deprivation quintile Previous heart operation
Previous emergency admissions Previous abdominal surgery
Previous IHD admissions
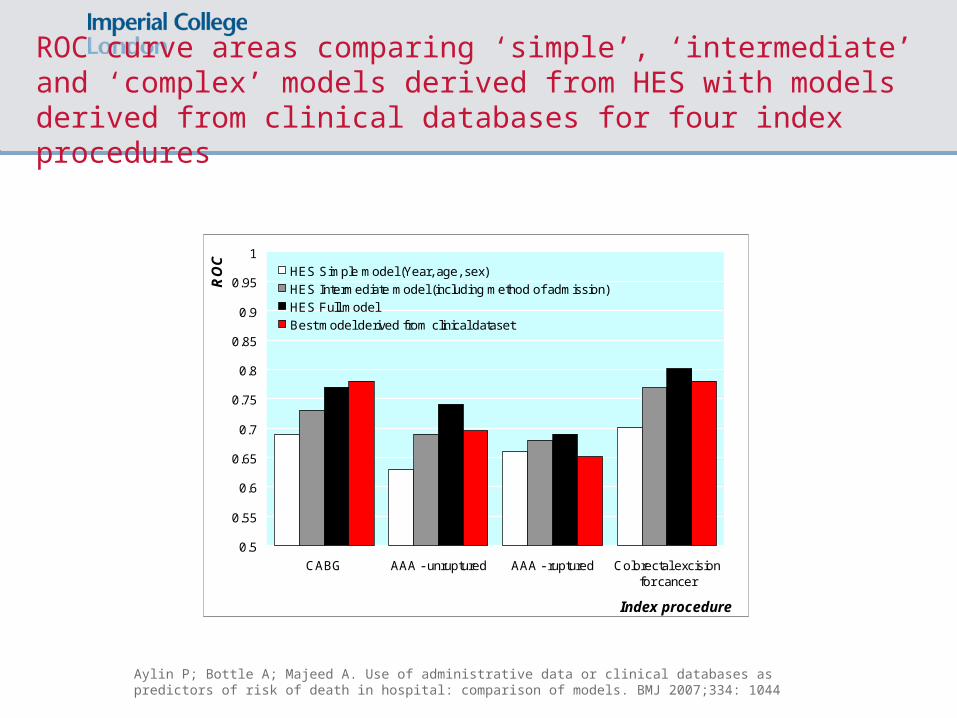
ROC curve areas comparing ‘simple’, ‘intermediate’ and ‘complex’ models derived from HES with models derived from clinical databases for four index procedures
0.5
0.55
0.6
0.65
0.7
0.75
0.8
0.85
0.9
0.95
1
CABG AAA - unruptured AAA - ruptured Colorectal excisionfor cancer
Index procedure
RO
C
HES Simple model (Year, age, sex)
HES Intermediate model (including method of admission)
HES Full model
Best model derived from clinical dataset
Aylin P; Bottle A; Majeed A. Use of administrative data or clinical databases as predictors of risk of death in hospital: comparison of models. BMJ 2007;334: 1044
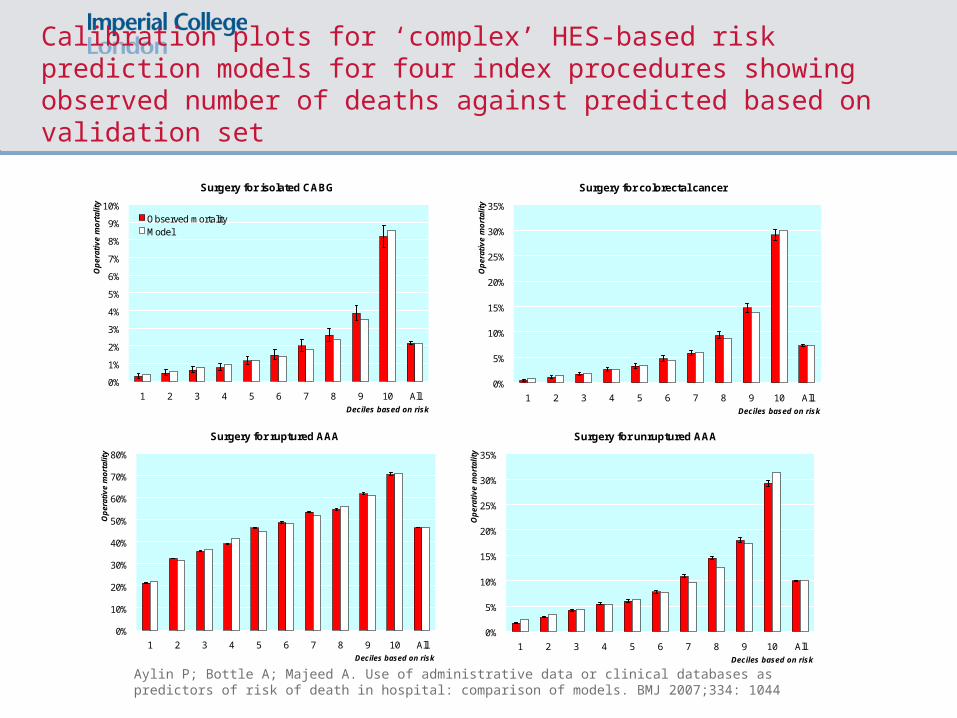
Calibration plots for ‘complex’ HES-based risk prediction models for four index procedures showing observed number of deaths against predicted based on validation set
Surgery for isolated CABG
0%
1%
2%
3%
4%
5%
6%
7%
8%
9%
10%
1 2 3 4 5 6 7 8 9 10 AllDeciles based on risk
Op
erat
ive
mo
rtal
ity
Observed mortalityModel
Surgery for colorectal cancer
0%
5%
10%
15%
20%
25%
30%
35%
1 2 3 4 5 6 7 8 9 10 AllDeciles based on risk
Op
era
tiv
e m
ort
ali
ty
Surgery for ruptured AAA
0%
10%
20%
30%
40%
50%
60%
70%
80%
1 2 3 4 5 6 7 8 9 10 AllDeciles based on risk
Op
erat
ive
mo
rtal
ity
Surgery for unruptured AAA
0%
5%
10%
15%
20%
25%
30%
35%
1 2 3 4 5 6 7 8 9 10 AllDeciles based on risk
Op
era
tiv
e m
ort
ali
ty
Aylin P; Bottle A; Majeed A. Use of administrative data or clinical databases as predictors of risk of death in hospital: comparison of models. BMJ 2007;334: 1044
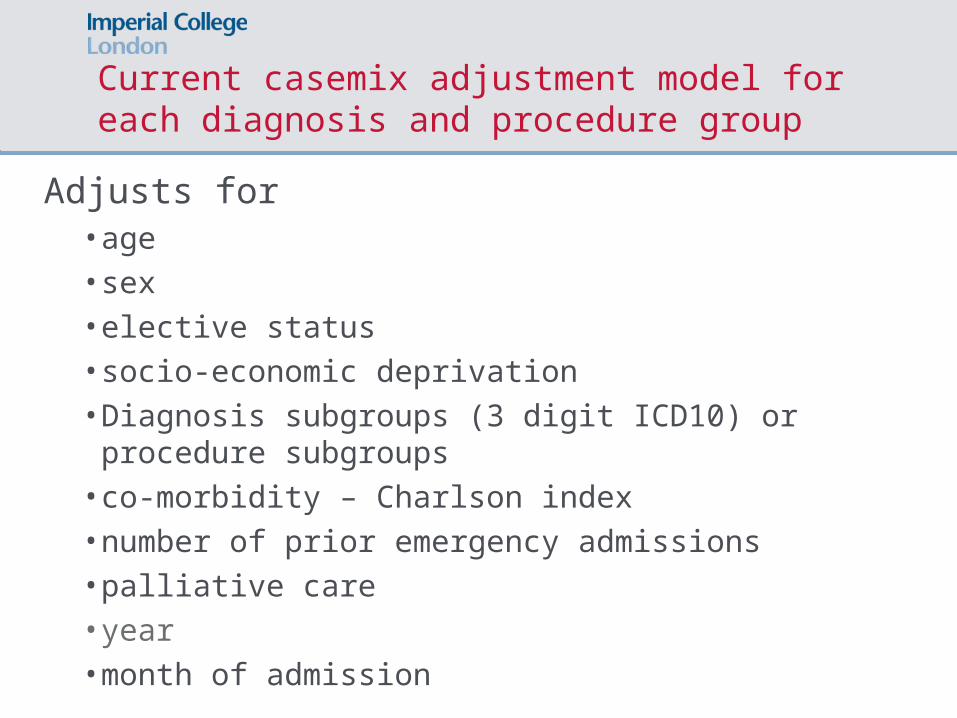
Current casemix adjustment model for each diagnosis and procedure group
Adjusts for • age• sex• elective status• socio-economic deprivation• Diagnosis subgroups (3 digit ICD10) or procedure
subgroups• co-morbidity – Charlson index• number of prior emergency admissions• palliative care• year• month of admission
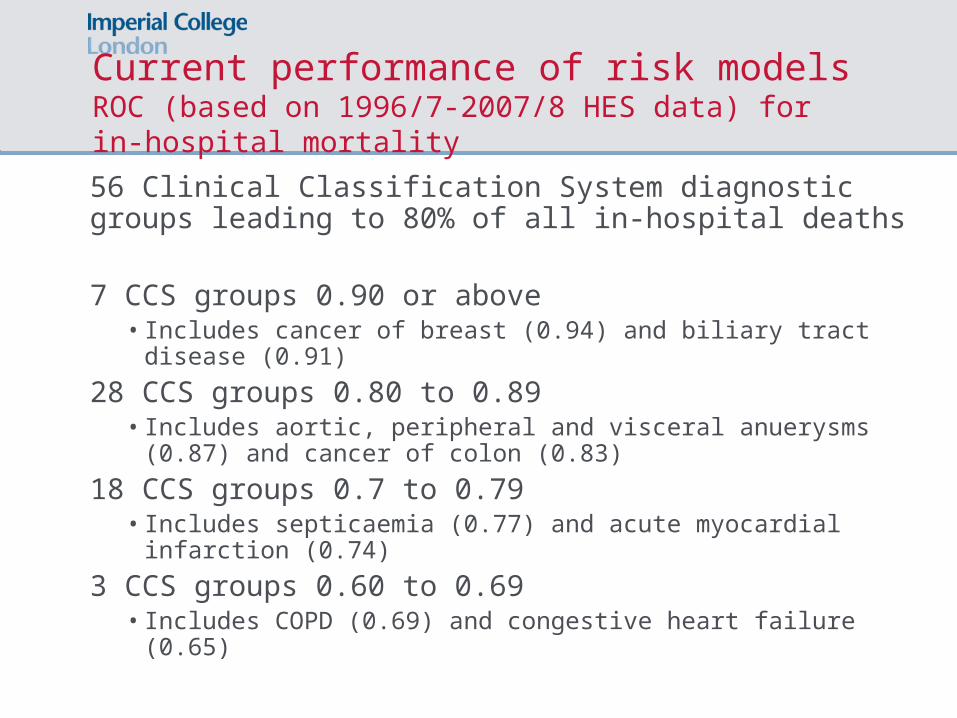
Current performance of risk modelsROC (based on 1996/7-2007/8 HES data) for in-hospital mortality
56 Clinical Classification System diagnostic groups leading to 80% of all in-hospital deaths
7 CCS groups 0.90 or above• Includes cancer of breast (0.94) and biliary tract disease (0.91)
28 CCS groups 0.80 to 0.89• Includes aortic, peripheral and visceral anuerysms (0.87) and
cancer of colon (0.83)
18 CCS groups 0.7 to 0.79• Includes septicaemia (0.77) and acute myocardial infarction
(0.74)
3 CCS groups 0.60 to 0.69• Includes COPD (0.69) and congestive heart failure (0.65)
Presentation of clinical outcomes
“Even if all surgeons are equally good, about half will have below average results, one will have the worst results, and the worst results will be a long way below average”
• Poloniecki J. BMJ 1998;316:1734-1736

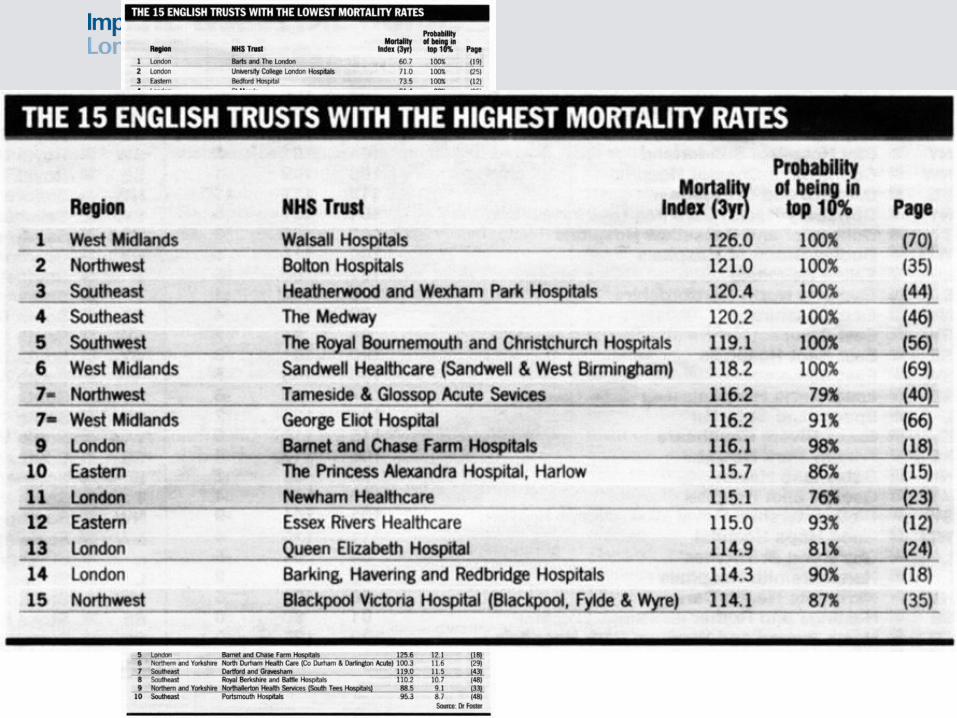
Criticisms of ‘league tables’
• Spurious ranking – ‘someone’s got to be bottom’ • Encourages comparison when perhaps not
justified • 95% intervals arbitrary • No consideration of multiple comparisons • Single-year cross-section – what about change?

Bayesian ranking
Bayesian approach using Monte Carlo simulations can provide confidence intervals around ranks
Can also provide probability that a unit is in top 10%, 5% or even is at the top of the table
• See Marshall et al. (1998). League tables of in vitro fertilisation clinics: how confident can we be about the rankings? British Medical Journal, 316, 1701-4.

Statistical Process Control (SPC) charts
Shipman:• Aylin et al, Lancet (2003)• Mohammed et al, Lancet (2001)• Spiegelhalter et al, J Qual Health Care (2003)
Surgical mortality:• Poloniecki et al, BMJ (1998)• Lovegrove et al, CHI report into St George’s• Steiner et al, Biostatistics (2000)
Public health:• Terje et al, Stats in Med (1993)• Vanbrackle & Williamson, Stats in Med (1999)• Rossi et al, Stats in Med (1999)• Williamson & Weatherby-Hudson, Stats in Med (1999)

Common features of SPC charts
Need to define:• in-control process (acceptable/benchmark performance)• out-of-control process (that is cause for concern)
Test statistic• Function of the difference between observed and
benchmark performance• calculated for each unit of analysis

60
70
80
90
100
110
120
130
140
0 500 1000 1500 2000 2500 3000 3500
HS
MR
Expected deaths
HSMR with 99.8% control limits 2007/8
HSMR 2007/8 with 99.8% control limits
Funnel plots
No ranking
Visual relationship with volume
Takes account of increased variability of smaller centres
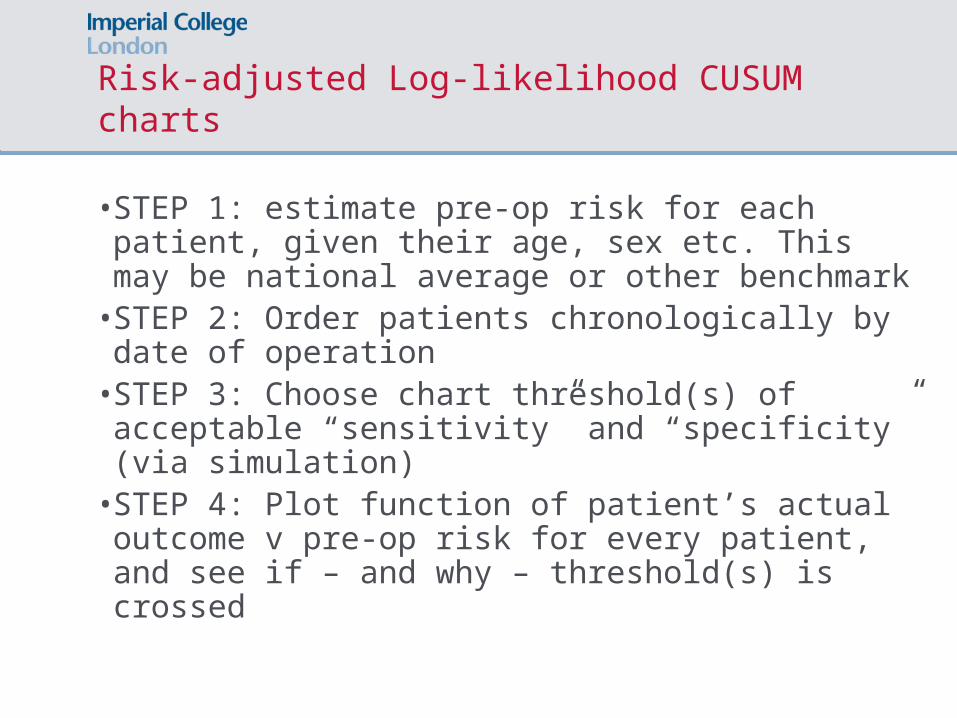
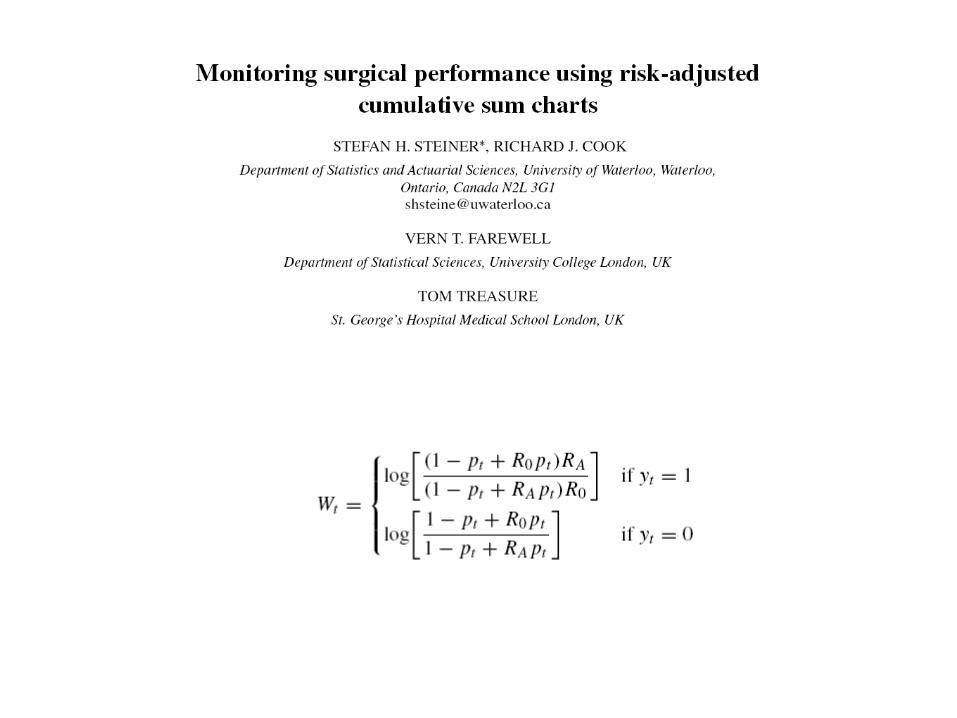
Risk-adjusted Log-likelihood CUSUM charts
• STEP 1: estimate pre-op risk for each patient, given their age, sex etc. This may be national average or other benchmark
• STEP 2: Order patients chronologically by date of operation
• STEP 3: Choose chart threshold(s) of acceptable “sensitivity” and “specificity” (via simulation)
• STEP 4: Plot function of patient’s actual outcome v pre-op risk for every patient, and see if – and why – threshold(s) is crossed
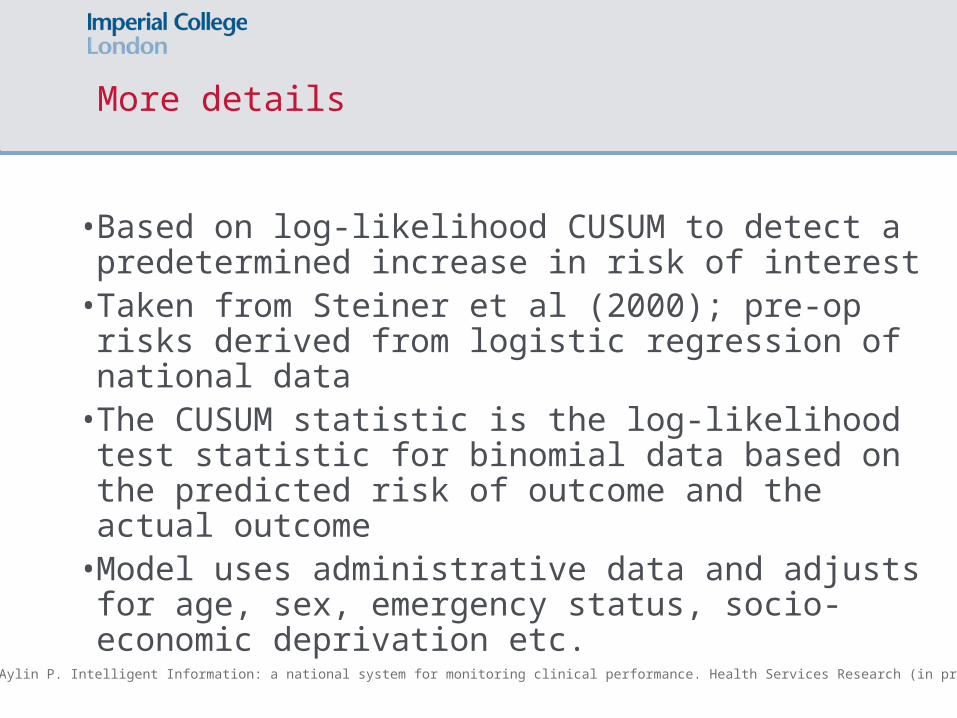
More details
• Based on log-likelihood CUSUM to detect a predetermined increase in risk of interest
• Taken from Steiner et al (2000); pre-op risks derived from logistic regression of national data
• The CUSUM statistic is the log-likelihood test statistic for binomial data based on the predicted risk of outcome and the actual outcome
• Model uses administrative data and adjusts for age, sex, emergency status, socio-economic deprivation etc.
Bottle A, Aylin P. Intelligent Information: a national system for monitoring clinical performance. Health Services Research (in press).
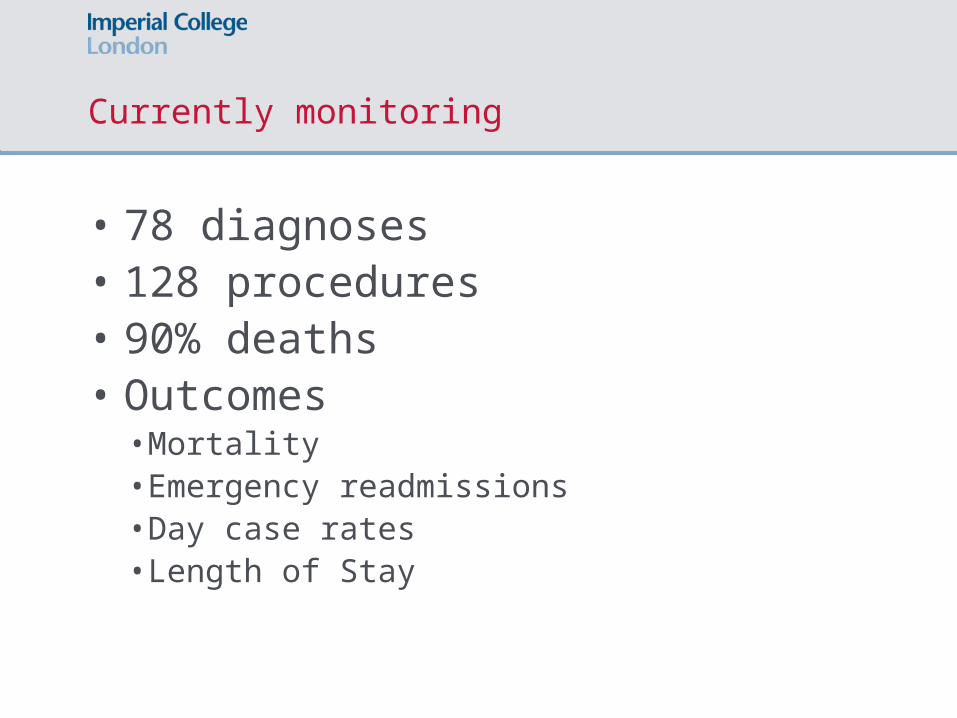
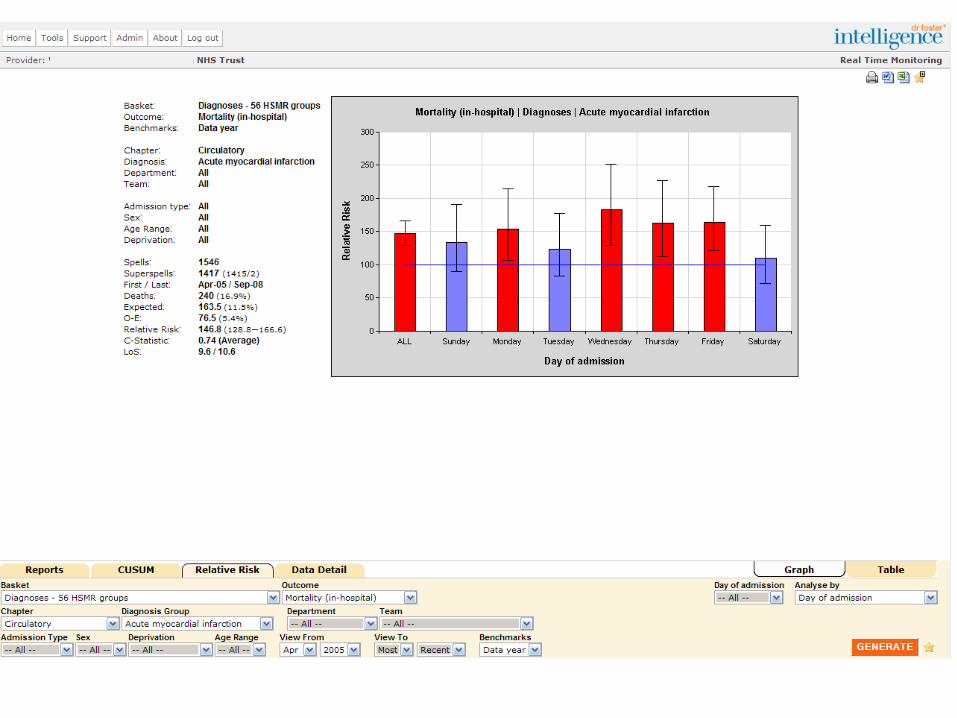
Currently monitoring
• 78 diagnoses• 128 procedures• 90% deaths• Outcomes
• Mortality• Emergency readmissions• Day case rates• Length of Stay
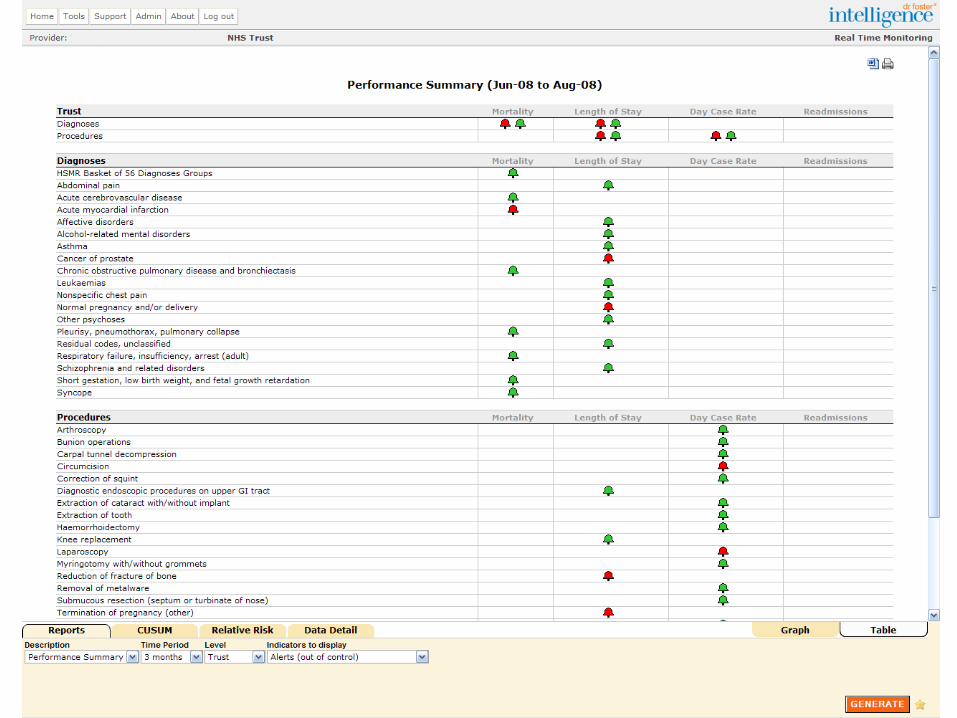
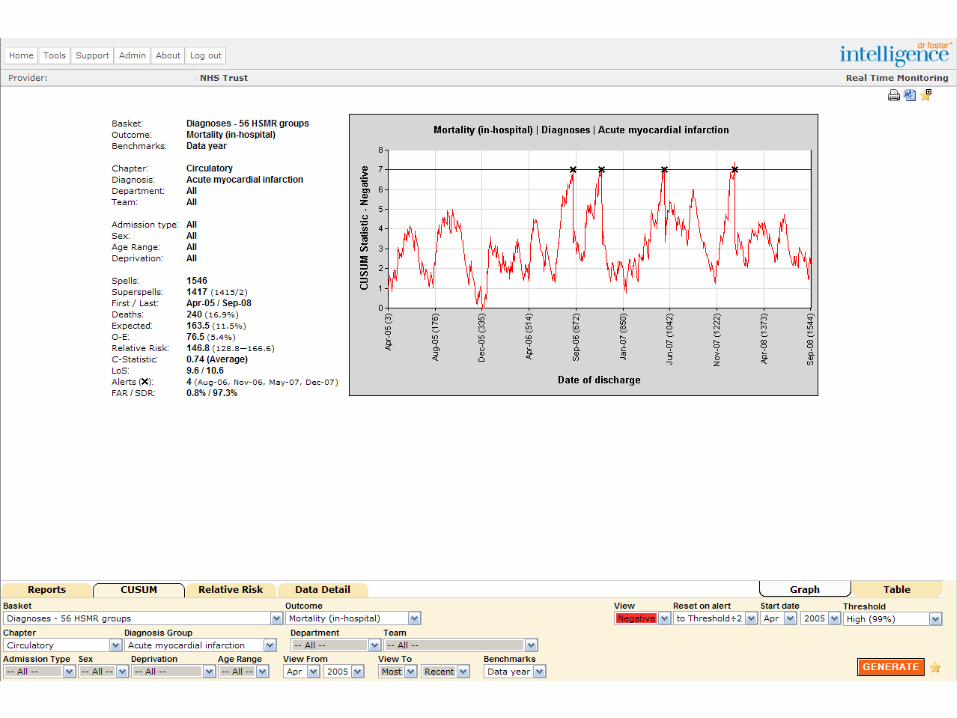
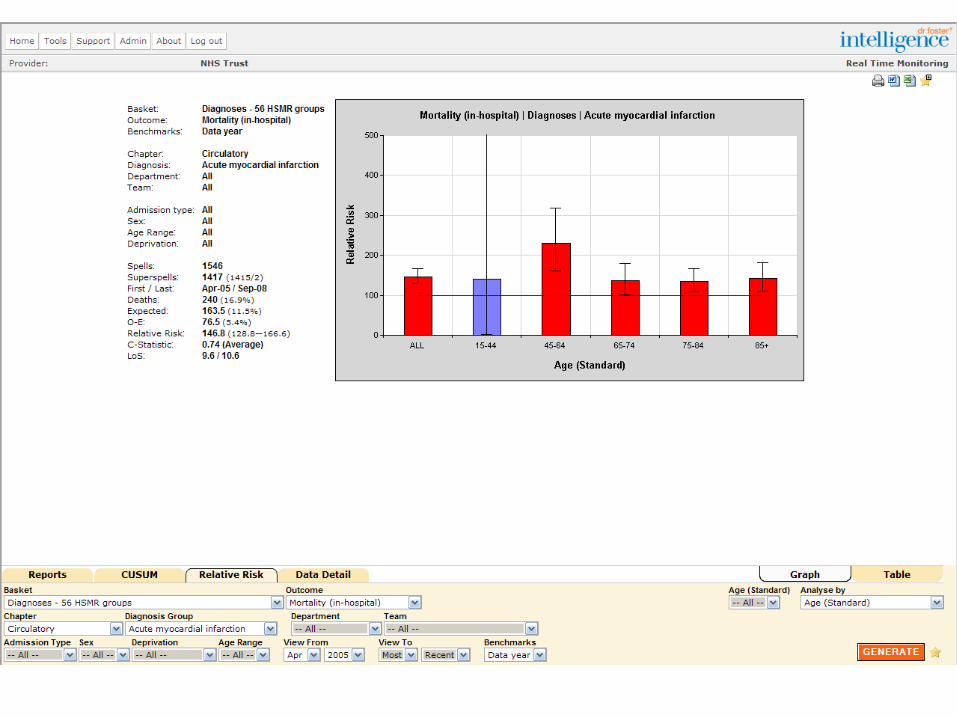
How do you investigate a signal?
What to do with a signal
• Check the data• Difference in casemix• Examine organisational or procedural differences
• Only then consider quality of care
Future
• Patient Reported Outcomes (PROMs)
• Patient satisfaction/experience
• Safety/adverse events
• Pay for performance and quality


