27
Measuring the Social Impact The Limmat Foundation’s Approach 12/07/2012 Juan J. Alarcon Limmat Stiftung, Zurich
| Date post: | 13-Dec-2015 |
| Category: |
Documents |
| Upload: | kennedy-dooling |
| View: | 216 times |
| Download: | 3 times |
Measuring the Social Impact
The Limmat Foundation’sApproach
12/07/2012
Juan J. AlarconLimmat Stiftung, Zurich

Social Development• Harmonious and sustainable improvement of
the living conditions (goods and resources) of a people group.
• Goods and resources can be:– Tangible– Intangible– Individual– Collective
• Regrouped, they conform the matrix of the social-economical welfare.
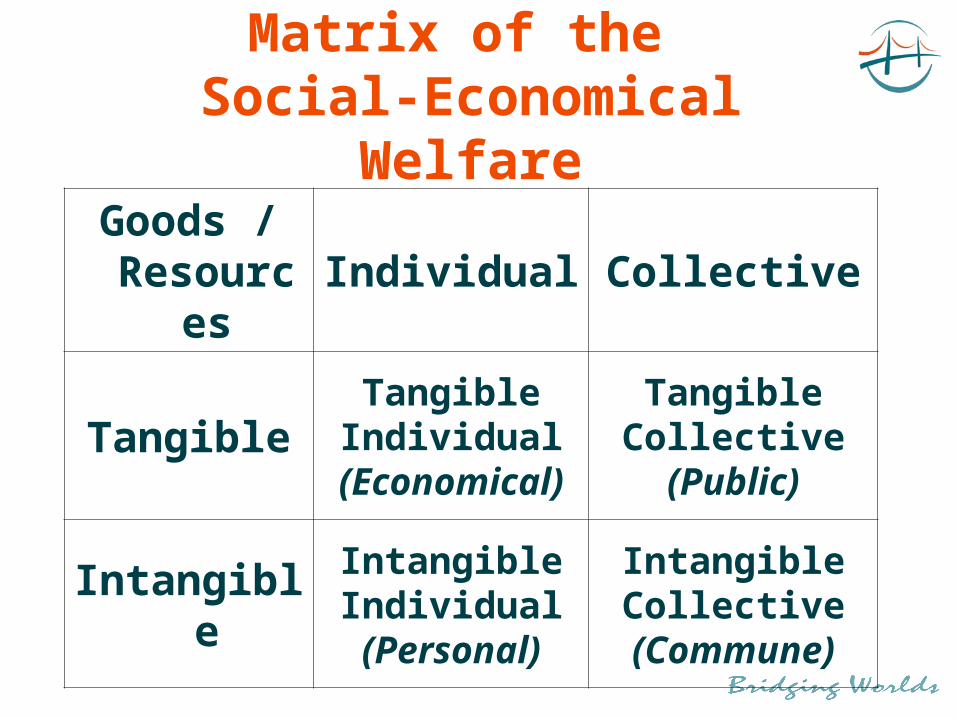
Matrix of the Social-Economical Welfare
Goods / Resources
Individual Collective
TangibleTangible
Individual(Economical)
TangibleCollective(Public)
IntangibleIntangibleIndividual(Personal)
IntangibleCollective
(Commune)

Social-Economical Welfare IndexSEW-Index
• The SEW-Index measures impact, not results.
• Made up of four primary components:
Tangible-Individual(Economical)
Tangible-Collective(Public)
Intangible-Individual(Personal)
Intangible-Collective(Commune)
• Weighted average system of nine indicators.

Social-Economical Welfare IndexSEW-Index
• Data are easy to collect. • It uses objective data for the
appraisal of the different indicators. • Situates the evaluated group in a
range from 0 to 100.
• Allows to compare living conditions of different groups of people.

Matrix of the Social-Economical Welfare
The Four Primary Components of the SEW-Index
Collective-Tangible; 10% Individual-
Tangible; 40%
Collective-Intangible; 20%
Individual-Intangible; 30%
Individual-Tangible
Individual-Intangible
Collective-Intangible
Collective-Tangible
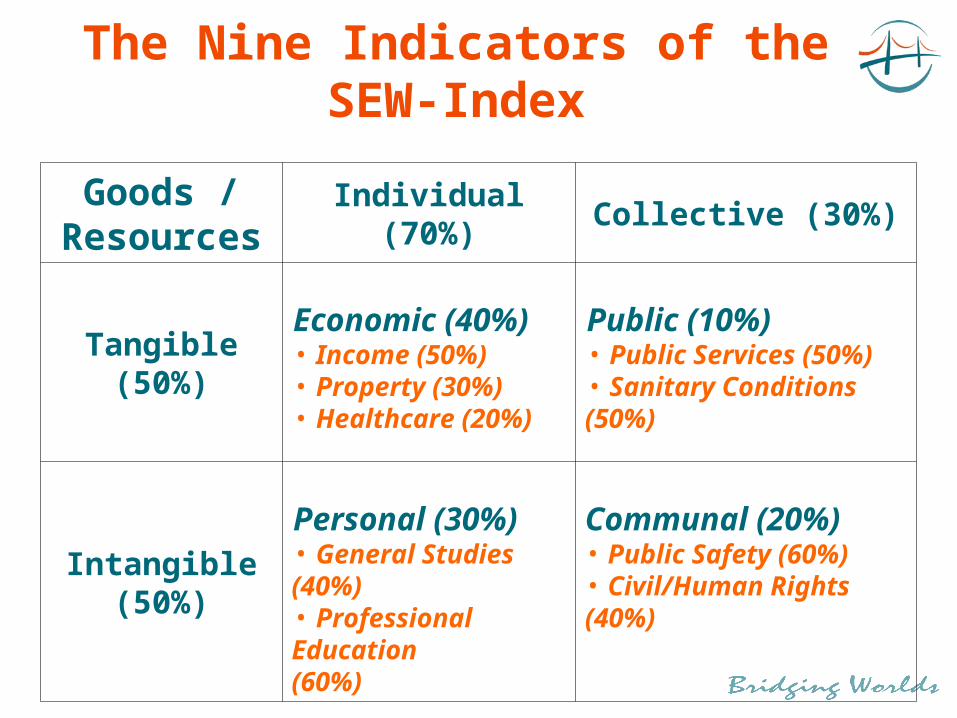
The Nine Indicators of the SEW-Index
Goods / Resources
Individual (70%) Collective (30%)
Tangible(50%)
Economic (40%)• Income (50%)• Property (30%)• Healthcare (20%)
Public (10%)• Public Services (50%)• Sanitary Conditions (50%)
Intangible (50%)
Personal (30%)• General Studies (40%)• Professional Education (60%)
Communal (20%)• Public Safety (60%)• Civil/Human Rights (40%)

Sanitary Conditions5%
General Education12%
Public Services5%
Civil and Humans Rights
8%
Public Safety12%
Health8%
Income20%
Properties 12%
Vocational Training18%
Individual-Tangible 40%
Individual-Intangible 30%
Collective-Intangible 20%
Collective-Tangible 10%
Weight of the Nine Indicators of the SEW-Index
The Nine Indicators of the SEW-Index
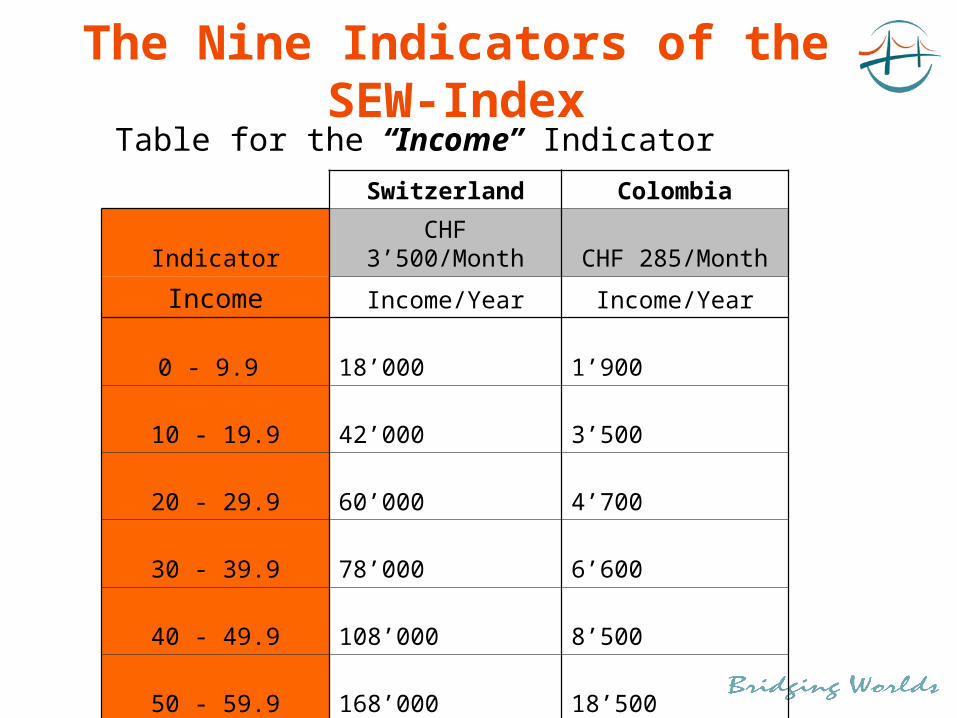
Table for the “Income” Indicator
The Nine Indicators of the SEW-Index
Switzerland Colombia
Indicator CHF 3’500/Month CHF 285/Month
Income Income/Year Income/Year
0 - 9.9 18’000 1’900
10 - 19.9 42’000 3’500
20 - 29.9 60’000 4’700
30 - 39.9 78’000 6’600
40 - 49.9 108’000 8’500
50 - 59.9 168’000 18’500
60 - 69.9 360’000 38’000
70 - 79.9 720’000 80’000
80 - 89.9 1’440’000 215’000
90 - 99.9 4’320’000 1’900’000

Table for the “General Studies” Indicator
The Nine Indicators of the SEW-Index
SEWI scale Level attained 0 = illiterate15 = knows how to read and write20 = primary school studies non completed (3 years schooling)30 = primary school studies completed (5 years schooling)40 = secondary scholl studies non completed (9 years schooling)50 = technical secondary school studies, completed60 = secondary scholl studies (baccalaureate or equivalent) finished70 = middle technical schools (bachelors level)80 = masters degreel or equivalent (5 years university studies)90 = doctorate and/or postgraduate degree
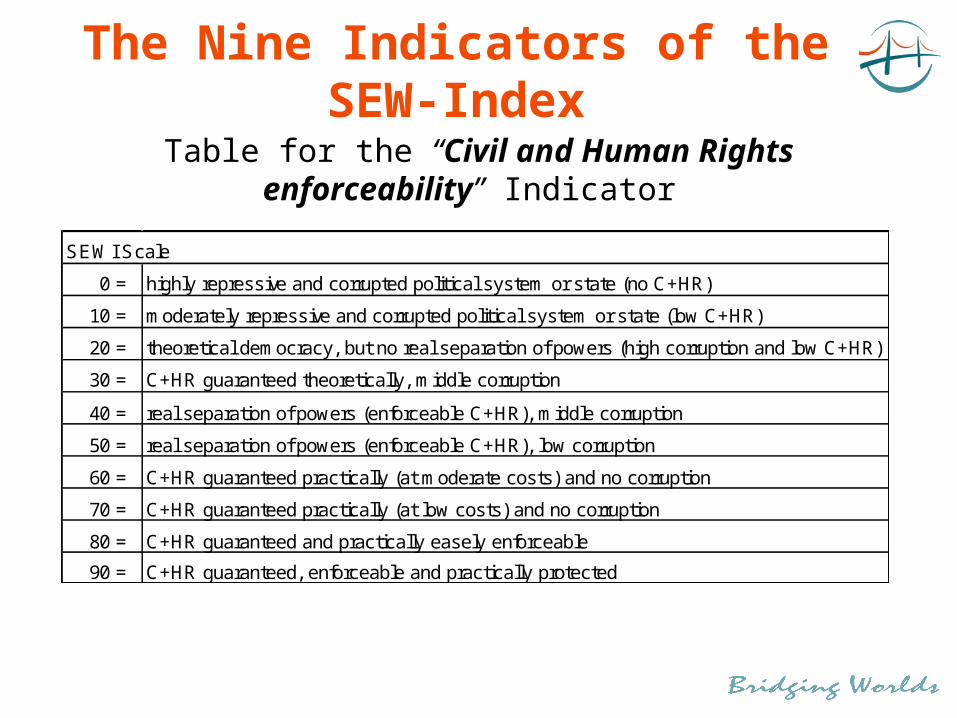
Table for the “Civil and Human Rights enforceability” Indicator
The Nine Indicators of the SEW-Index
SEWI Scale
0 = highly repressive and corrupted political system or state (no C+HR)
10 = moderately repressive and corrupted political system or state (low C+HR)
20 = theoretical democracy, but no real separation of powers (high corruption and low C+HR)
30 = C+HR guaranteed theoretically, middle corruption
40 = real separation of powers (enforceable C+HR), middle corruption
50 = real separation of powers (enforceable C+HR), low corruption
60 = C+HR guaranteed practically (at moderate costs) and no corruption
70 = C+HR guaranteed practically (at low costs) and no corruption
80 = C+HR guaranteed and practically easely enforceable
90 = C+HR guaranteed, enforceable and practically protected

The SEW-IndexA Real Case for Micro-Entrepreneurs in Cali, Colombia
Creation of a training center for micro-entrepreneurs in food processing industry: milk and vegetable products, bakery and grocery.
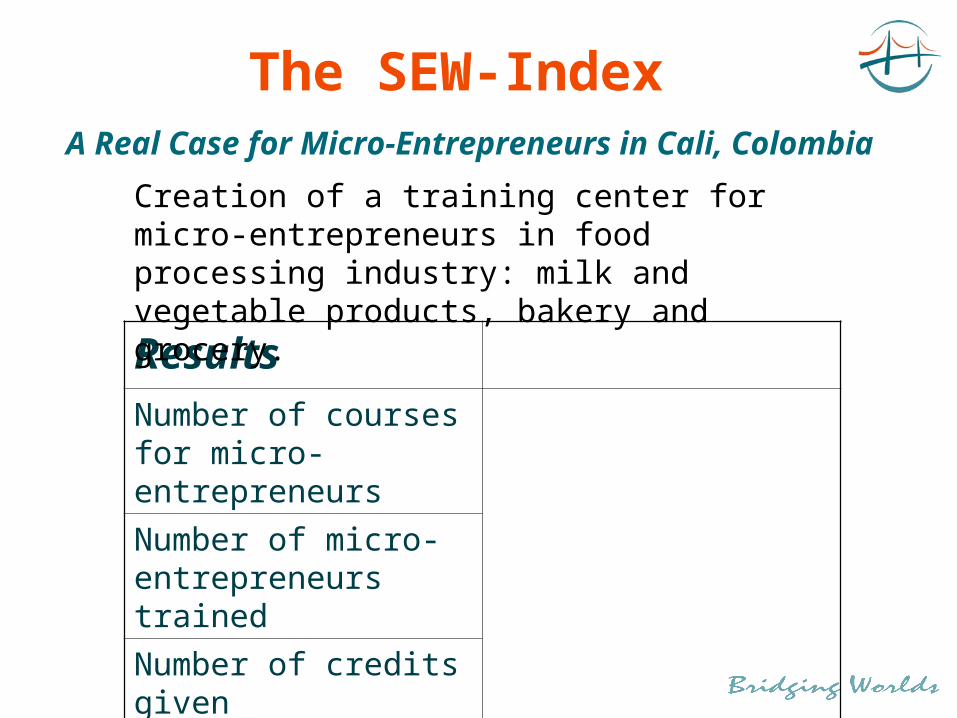
The SEW-IndexA Real Case for Micro-Entrepreneurs in Cali, Colombia
Results ImpactNumber of courses for micro-entrepreneurs
Improvement of the level conditions of the micro-entrepreneurs.
Number of micro-entrepreneurs trained
Number of credits given
Creation of a training center for micro-entrepreneurs in food processing industry: milk and vegetable products, bakery and grocery.

The SEW-IndexA Real Case for Micro-Entrepreneurs in Cali, Colombia
Results ImpactNumber of courses for micro-entrepreneurs
Improvement of the level of the living conditions of the micro-entrepreneurs.
Number of micro-entrepreneurs trained
Number of credits given
Creation of a training center for micro-entrepreneurs in food processing industry: milk and vegetable products, bakery and grocery.
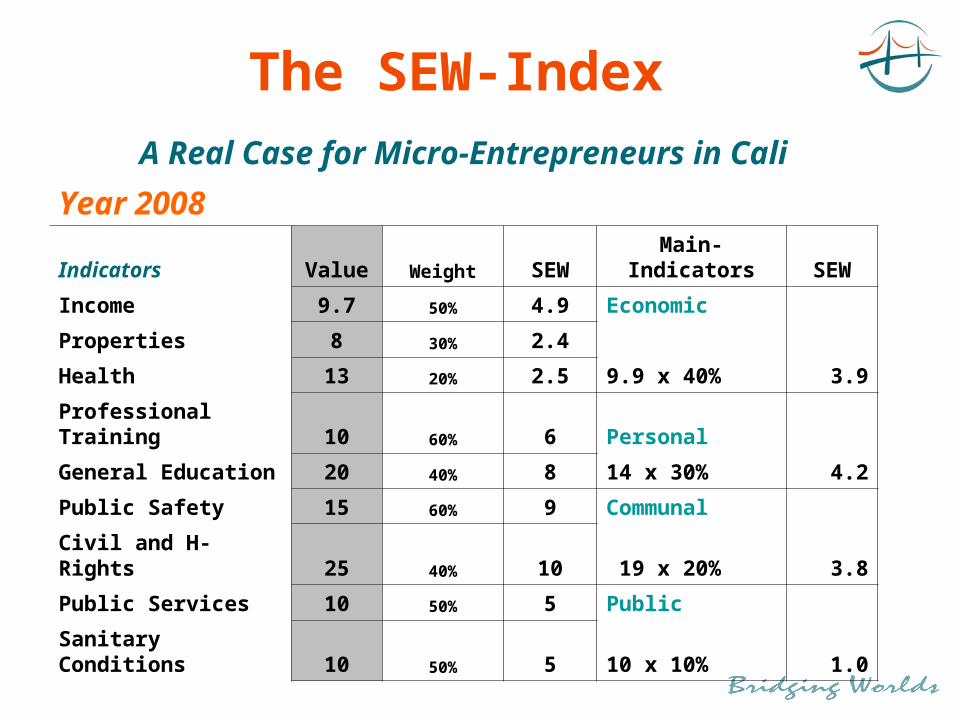
The SEW-Index
A Real Case for Micro-Entrepreneurs in Cali
Year 2008
Indicators Value Weight SEW Main-Indicators SEW
Income 9.7 50% 4.9 Economic
Properties 8 30% 2.4
Health 13 20% 2.5 9.9 x 40% 3.9
Professional Training 10 60% 6 Personal
General Education 20 40% 8 14 x 30% 4.2
Public Safety 15 60% 9 Communal
Civil and H-Rights 25 40% 10 19 x 20% 3.8
Public Services 10 50% 5 Public
Sanitary Conditions 10 50% 5 10 x 10% 1.0
Total SEW Points low-low level 12.9

The SEW-Index
A Real Case for Micro-Entrepreneurs in Cali
Year 2010
Indicators Value Weight SEW Main-Indicators SEW
Income 10.2 50% 5.1 Economic
Properties 11 30% 3.3
Health 16 20% 3.2 11.6 x 40% 4.6
Professional Training 15 60% 9 Personal
General Education 20 40% 8 17 x 30% 5.1
Public Safety 15 60% 9 Communal
Civil and H-Rights 25 40% 10 19 x 20% 3.8
Public Services 15 50% 7.5 Public
Sanitary Conditions 10 50% 5 12.5 x 10% 1.3
Total SEW Points low-low level 14.8

The SEW-Index
A Real Case for Micro-Entrepreneurs in Cali
Year 2012
Indicators Value Weight SEW Main-Indicators SEW
Income 12.4 50% 6.2 Economic
Properties 24.3 30% 7.3
Health 26 20% 5.2 18.7 x 40% 7.5
Professional Training 25 60% 15 Personal
General Education 25 40% 10 25 x 30% 7.5
Public Safety 15 60% 9 Communal
Civil and H-Rights 30 40% 12 21 x 20% 4.2
Public Services 20 50% 10 Public
Sanitary Conditions 25 50% 12.5 22.5 x 10% 2.3
Total SEW Points low-medium level 21.4
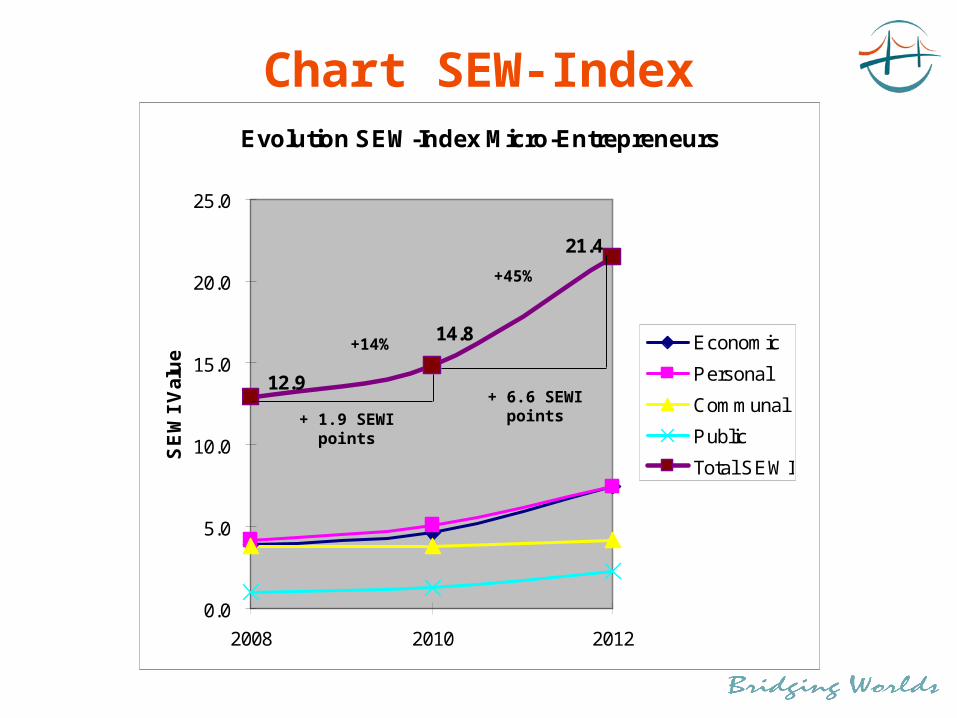
Chart SEW-IndexEvolution SEW-Index Micro-Entrepreneurs
12.9
14.8
21.4
0.0
5.0
10.0
15.0
20.0
25.0
2008 2010 2012
SE
WI
Val
ue
Economic
Personal
Communal
Public
Total SEWI
+ 1.9 SEWI points
+ 6.6 SEWI points
+14%
+45%

Chart SEW-IndexEvolution SEW-Index Micro-Entrepreneurs
12.9
14.8
21.4
0.0
5.0
10.0
15.0
20.0
25.0
2008 2010 2012
SE
WI
Val
ue
Economic
Personal
Communal
Public
Total SEWI+ 8.5 SEWI points
+ 66%
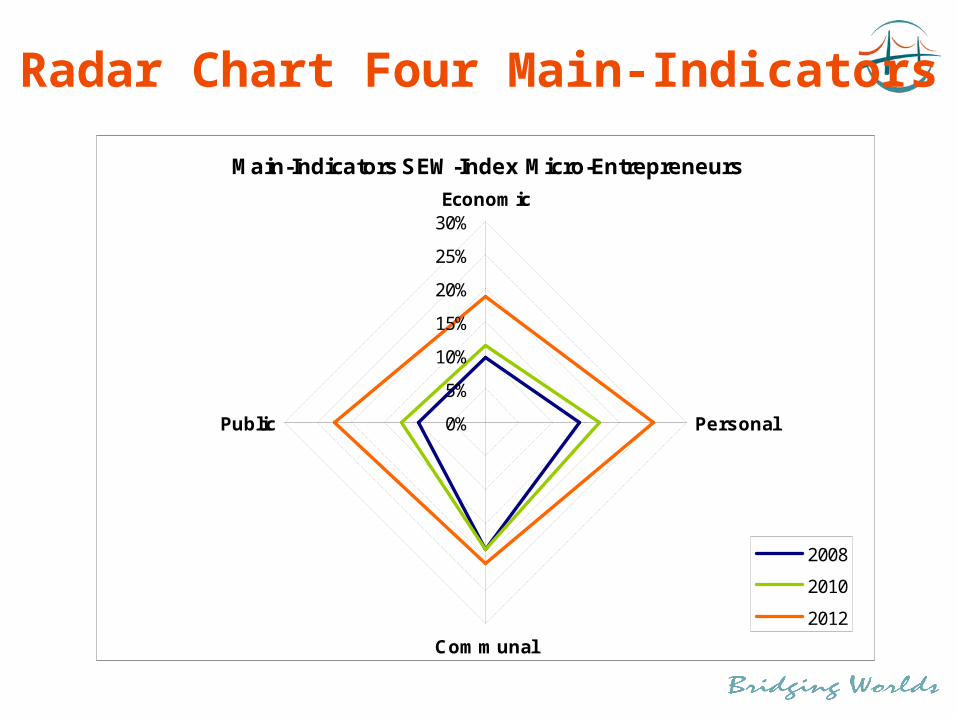
Radar Chart Four Main-Indicators
Main-Indicators SEW-Index Micro-Entrepreneurs
0%
5%
10%
15%
20%
25%
30%Economic
Personal
Communal
Public
2008
2010
2012

Radar Chart Nine Indicators
The Nine Indicators of the SEWI
-5%
5%
15%
25%
35%Income
Properties
Health
General studies
Professional trainingPublic safety
Civil/Human rights
Public services
Healthfulness conditions
2008

Radar Chart Nine Indicators
The Nine Indicators of the SEWI
-5%
5%
15%
25%
35%Income
Properties
Health
General studies
Professional trainingPublic safety
Civil/Human rights
Public services
Healthfulness conditions
2010
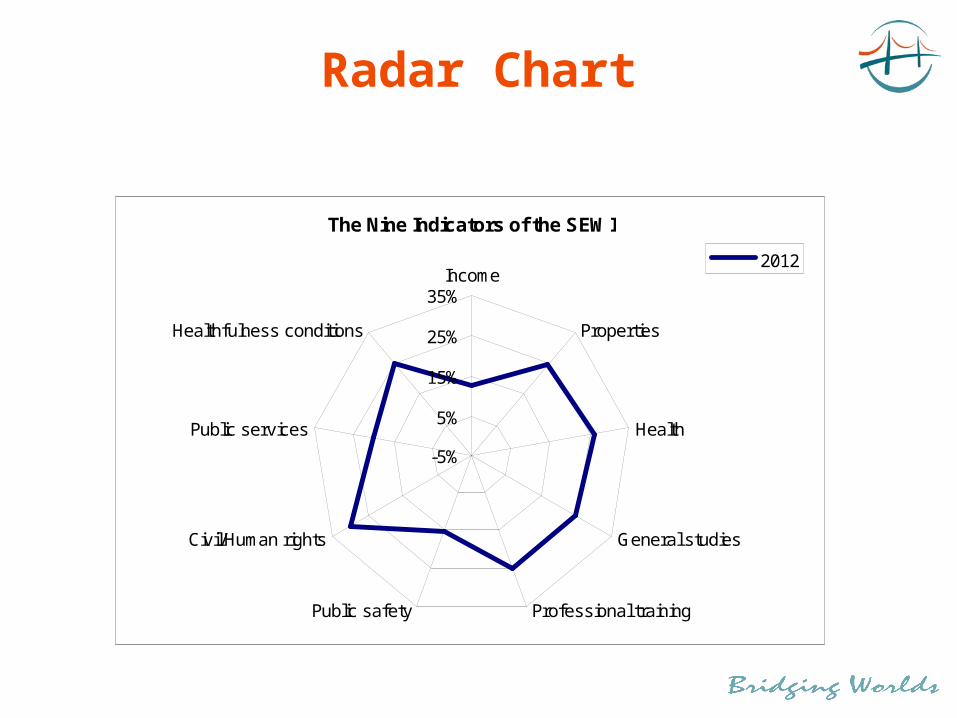
Radar Chart
The Nine Indicators of the SEWI
-5%
5%
15%
25%
35%Income
Properties
Health
General studies
Professional trainingPublic safety
Civil/Human rights
Public services
Healthfulness conditions
2012
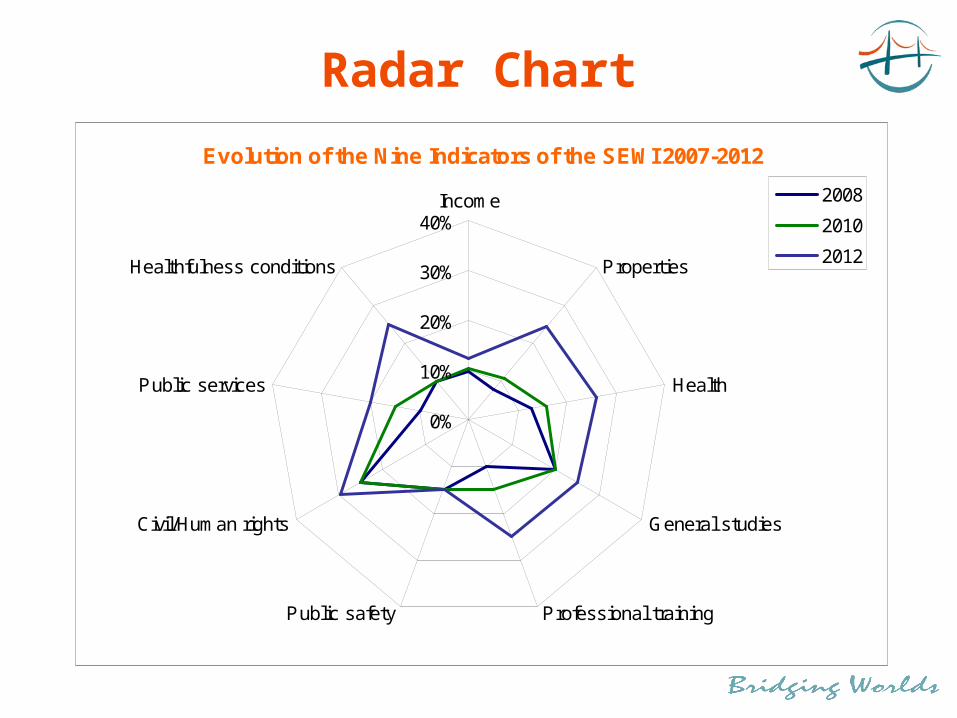
Radar Chart
Evolution of the Nine Indicators of the SEWI 2007-2012
0%
10%
20%
30%
40%Income
Properties
Health
General studies
Professional trainingPublic safety
Civil/Human rights
Public services
Healthfulness conditions
2008
2010
2012
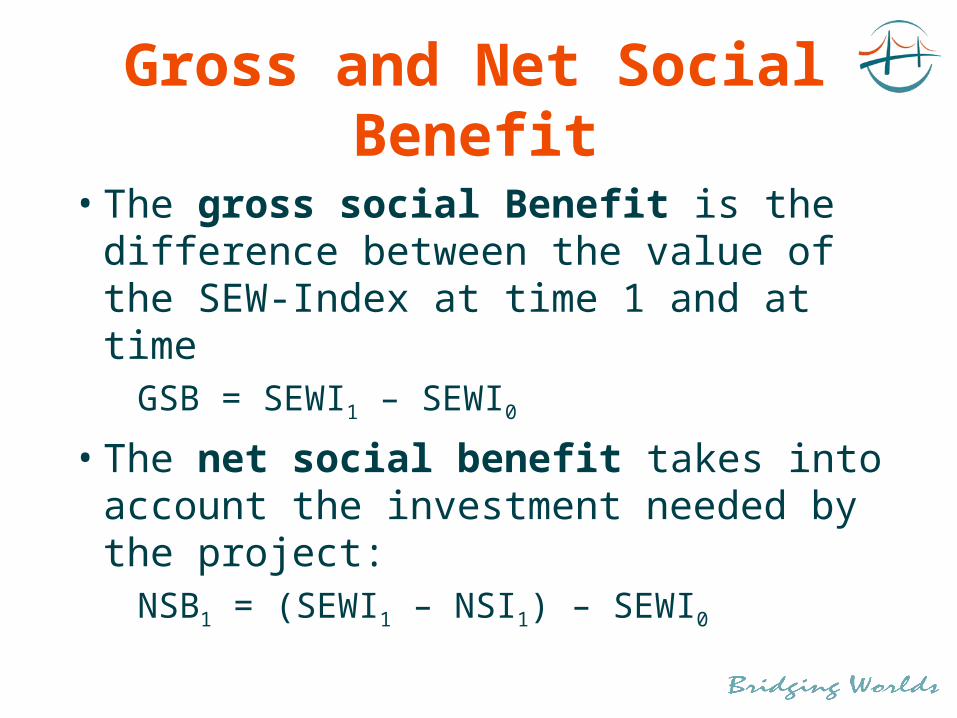
Gross and Net Social Benefit
• The gross social Benefit is the difference between the value of the SEW-Index at time 1 and at time
GSB = SEWI1 – SEWI0
• The net social benefit takes into account the investment needed by the project:
NSB1 = (SEWI1 – NSI1) – SEWI0
The Matrix of the Social-Economical WelfareDevelopment needs a holistic approach.
• The SEW-Index is also an useful tool:• at the stage of the project planning. • individuate the weak points of the targeted
population. • to recognize complementary actions, alone or
together with other institutions. • In this way, the always scarce resources can be
used in an optimal way.

Development Projects
40
30
20
10
SEWI
COSTS
Humanitarian Aid Projects
Special Projects
Development Aid Projects
The Curve of Development


