Page 1
1
Measuring University Students’ Science Communication
Efficacy in Middle and High Schools
Xiufeng Liu*
Lei Fu
ShaoHui Chi
University at Buffalo, State University of New York
*Contact Address:
Dr. Xiufeng Liu
Department of Learning and Instruction
Graduate School of Education
University at Buffalo, SUNY
Buffalo, NY 14260-1000
e-mail: [email protected]
Paper presented at the annual meeting of the NARST, March 30, 2014,
Pittsburgh, PA, USA
Page 2
2
Abstract
Self-efficacy is a person’s belief in one’s capabilities to organize and execute the
courses of action required to produce certain attainments and it is task-specific or
subject-specific. Generalized self-efficacy or confidence measures have been made
with the common use of five-point scales with anchoring descriptors, but many of the
self-efficacy studies are criticized for their invalidity. This study focuses on
university students’ self-efficacy in science communication. In this study, science
communication efficacy is defined as university students’ beliefs in their capabilities
to help middle and high school students understand science. Specifically, we intend
to develop a standardized instrument for measuring university students’ self-efficacy
in communicating science to K-12 students. The specific research questions are: 1.
What is the validity evidence for supporting the use of the measurement instrument to
measure university students’ self-efficacy in communicating science to K-12
students? 2. What is the reliability evidence for supporting the use of the
measurement instrument to measure university students’ self-efficacy in
communicating science to K-12 students? The development of the science
communication efficacy instrument follows a construct modeling approach, starting
with a clearly defined construct, operationalized by progress variables. Assessment
tasks are then derived from the defined progress variables, and data collected from
pilot-testing and field-testing are used to examine the fit between the progress
variables and data using Rasch modeling. The final revised instrument contains 20
items with four response categories to describe respondents’ levels of self-efficacy in
communicating science. The results have revealed that the revised self-efficacy
instrument is well-targeted at the STEM students. Measures from this instrument are
reasonably valid and reliable, thus are appropriate for assessing university STEM
students’ science communication self-efficacy.
Page 3
3
Measuring University Students’ Science Communication
Efficacy in Middle and High Schools
Introduction In the US, there is a long history of involving university students in K-12 science
education. A good example is the NSF funding program called Graduate STEM
(Science, Technology, Engineering and Mathematics) Fellows in K-12 Education
(GK-12). Through interactions with teachers and students in K-12 schools, graduate
STEM fellows improve their science communication and teaching skills while
enriching STEM content and instruction for their K-12 partners. Over the years, the
idea of GK-12 has been expanded to placing university students (graduate and
undergraduate) in K-12 classrooms in order for them to learn science communication,
teaching skills, leadership, teamwork, and civic engagement. This form of
university student learning has also been called service learning.
There has been well-established evidence on the benefits of placing university
students in K-12 classrooms. For example, teachers involved in the GK-12 program
have reported increased STEM content knowledge (e.g., Gamse et al., 2010); a use of
more effective pedagogical techniques (Gamse et al., 2010; Huziak-Clark et al.,
2007), greater access to STEM resources (Gamse et al., 2010; Moskal et al., 2007), to
name just a few. For K-12 students, in a recent evaluation of the GK-12 program
(Abt Associates, 2010), a majority of teachers indicated that the GK-12 program had
positive effects on their K-12 students’ STEM knowledge and skills. STEM students
working in K-12 classrooms have reported gains as well. In another recent
evaluation of the GK-12 program (NSF, 2010), a majority of current and former
graduate students indicated that their GK-12 experience benefited their ability to
conduct various activities requiring communication, teaching, and teamwork skills.
A majority of their college faculty advisors also concurred that the GK-12 program
helps their students develop skills in these areas.
While the benefits of GK-12 and similar service learning programs have been
reported as described above, measurement of university students’ gains using
standardized measurement instruments is still lacking. Our study intends to fill this
gap. It focuses on university students’ self-efficacy in science communication.
Literature review Self-efficacy Theory
According to Bandura, self-efficacy is a person’s belief in one’s capabilities to
organize and execute the courses of action required to produce certain attainments
(Bandura, 1997). Bandura stated that people will not attempt to do things if they do
not believe they can produce certain results. In other words, self-efficacy can affect
the initiation of behavior, the amount of effort expended and the persistence of
behavior in spite of challenges and negative experiences (Bandura, 1977). Other
researchers reached the same conclusion. Self-efficacy can affect one’s cognitive,
motivational and affective processes (Jones, 2012). Pajares (1996) argued that a
person’s self-efficacy will determine how the person approaches tasks and responds to
set-backs, in addition to that it also can determine what the person will do with the
skills and knowledge he/she has. Salas (2009) also stated that the more students
succeed, the more they believe they can succeed (self-efficacy), and therefore, the
more they do succeed.
Self-efficacy is a context-specific rather than a stable characteristic trait. It is
Page 4
4
therefore thought to have a direct effect on performance in specific contexts. Self-
efficacy judgment varies based on the level of skill and perseverance required to
achieve a given task in a given context (Bandura, 1997; Dellinger et al, 2008;
Tschannen-Moran et al., 1998; Woolfolk & Burke, 2005). Ormrod (2004) pointed
out that, while self-efficacy is similar to self-concept or self-esteem, an important
distinction for self-efficacy is that it is domain, task, or situation specific. Examples
provided by Salas (2009) is that a teacher may have a strong sense of self-efficacy in
teaching mathematics, while weaker self-efficacy in teaching English; or a student
may have high self-efficacy when performing mathematics skills, but a low self-
efficacy in language arts. Self-efficacy is related to perceived specific abilities
rather than generalized self-beliefs (Gaffney, 2011). Bursal and Yigit (2012) proposed
that self-efficacy beliefs should be extended to specific subject areas since they are
context and subject matter dependent.
Over the past decades, many scholars have studied self-efficacy in educational
settings; they have found a great influence of self-efficacy on teaching and learning
processes (Armor et al., 1976; Ashton, 1984; Ashton & Webb, 1986; Bursal & Yigit,
2012; Gibson and Dembo, 1984; Guskey & Passaro, 1994; Humphries et al, 2012;
Roll-Peterson, 2008; Schunk, 1989; Shim & Ryan, 2005; Soodak & Podell, 1993;
Soodak & Podell, 1996; Tschannen-Moran et al., 1998; Woolfolk Hoy & Davis,
2006). Bandura (1994) pointed out that educational activities can influence a
person’s self-efficacy and, therefore, that these activities should utilize methods which
can increase self-efficacy. Jones (2012) found that self-efficacy can be developed
through some experiences. For example, when one sees that someone like
himself/herself succeeds following sustained effort, he/she will believe he/she can
succeed too. Other research studies have demonstrated that when training for a
specific skill, high self-efficacy is positively correlated with performance (Bandura,
1997; Block et al., 2013; Gist et al., 1989; Pajares, 1996). Dellinger et al. proposed
that self-efficacy be represented in a causal model of interactions among self and
society, internal personal factors, and the external environment as reciprocating
factors. They argued that internal personal factors (cognitive, affective and
biological events) and the external environment influence behaviors, while the
environment is impacted by behaviors and personal factors, and personal factors are
impacted by behaviors and the environment (Dellinger et al., 2008).
Measuring Self-efficacy In Educational Realms
Generalized self-efficacy or confidence measures have been made with the common
use of five-point scales with anchoring descriptors (Berridge et al. 2007; Clark et al.,
2004; Day et al., 2007; Riboh et al., 2007; Sherer et al., 1982). For example, in the
measurement of teacher efficacy in two Rand Corporation assessments of educational
programs (Humphries, 2012), researchers used two Likert-scaled items to assess
teacher self-efficacy “When it comes right down to it, a teacher really can’t do much,
because most of a student’s motivation and performance depends on his or her home
environment;” and “If I try really hard, I can get through to even the most difficult or
unmotivated students.” (Armor et al.,1976; Berman et al., 1977). Ashton et al. also
used two items from the Rand studies, along with interviews and classroom
observations, to explore the relationship between teacher efficacy and student
achievement, and they identified differences among the teachers of different levels of
self-efficacy, and found that workplace factors can influence teaching self-efficacy
(Ashton, 1984; Ashton et al., 1983) .
Recently, more teacher self-efficacy scales have been developed with more items
Page 5
5
to assess teacher self-efficacy in different domain (DeChenne & Enochs, 2010;
Dellinger et al., 2008; Tschannen-Moran & Hoy, 2001). One of the most widely
used and regarded teacher self-efficacy scales is the Teacher Efficacy Scale developed
by Gibson and Dembo (1984), which was based on the Rand study items but utilized
the framework of self-efficacy from social cognitive theory (Bandura, 1986). The
scale with 16 items consisted of two constructs: self-efficacy and outcome expectancy
(Roberts& Henson, 2000). For a long time, the Teacher Efficacy Scale and its
variations have been the dominant means for assessing teaching efficacy (Henson,
2002; Klassen et al., 2011; Tschannen-Moran et al., 1998). Other relevant scales
include the Responsibility for Student Achievement (Guskey, 1981), the Teacher
Locus of Control (Rose & Medway, 1981), and the Webb Scale (Ashton et al., 1982).
Although the Teacher Efficacy Scale had been long considered as the standard for
measuring self-efficacy, more scholars have questioned this scale. For example,
some scholars argued that the scale has some theoretical and psychometric problems
which may invalidate the results (Brouwers & Tomic, 2003; Coladarci & Fink, 1995;
Deemer & Minke, 1999; Dellinger, 2005; Denzine, Cooney et al., 2005; Guskey &
Passaro, 1994; Tschannen-Moran et al., 1998).
Some studies have attempted to develop new measurement tools in order to address
the problems, such as the Ohio State Teacher Efficacy Scale (Tschannen-Moran &
Hoy, 2001). The Ohio State Teacher Efficacy Scale includes items that reflect the
multidimensional nature of teaching by including specific teaching tasks within
several domains of functioning that were important to a group of teachers
participating in item development (Dellinger et al., 2008). However, there are still
debates on this scale. For example, in Roberts and Hensons’ (2000) study, they
argued that “although the eigenvalues seem to also support a one-factor solution, the
question arises again concerning the utility of an instrument that cannot explain at
least 60% (original instrument explained 35.8%) of the variance in the inter-item
matrix of associations.” (Roberts & Henson, 2000).
With many of the self-efficacy studies being criticized for their invalidity, more
and more researchers put increasing emphasis on the validity and reliability of the
instruments. Some underline that the development of an instrument should be a
rigorous process involving conceptual analysis of the domain of functioning, drafting
and piloting the instrument, and statistical analysis of results including factor analysis
and internal consistency reliability (Shea & Fortna, 2002). Many researchers use
confirmatory factor analysis to develop teacher self-efficacy scales. Roberts and
Henson (2000) developed a new self-efficacy instrument with confirmatory factor
analysis to confirm the hypothesis that science teacher self-efficacy exists in two
constructs: teaching efficacy and knowledge efficacy. Dellinger et al (2008)
described a new measure of teacher self-efficacy beliefs using a principal components
analysis with a varimax rotation and then a confirmatory factor analysis using
structural equation modeling. Humphries et al (2012) developed a 35-item, 7-factor
Physical Education Teaching Efficacy Scale.
Science Communication
Science communication has risen globally in importance in recent years (Bowater &
Yeoman, 2012). Science communication is cross-disciplinary, involving
communication, psychology, education, philosophy, policy and sociology, as well as
the ‘traditional’ sciences such as natural, physical and computational science (Burns et
al., 2003; Mulder, Longnecker, & Davis, 2008). Despite of its importance, science
communication has no standard definition. Bryant (2003) defines science
Page 6
6
communication as processes by which the culture and knowledge of science are
absorbed into the culture of the wider community. Gilbert and Stocklmayer define
science communication as a “purposive intervention by a driving actor or a group of
driving actors to alter the present state of the relationship between sciences and
society toward their desired state” (Gilbert & Stocklmayer, 2012, p. 9). Science
communication involves following aspects: Awareness including familiarity with new
aspects of science; Enjoyment or other affective response; Interest as evidence by
voluntary involvement with science or its communication; Opinions, the forming,
reforming, or confirming of science-related attitudes; Understanding of science, its
content, processes, and social factors (Burns et al., 2003).
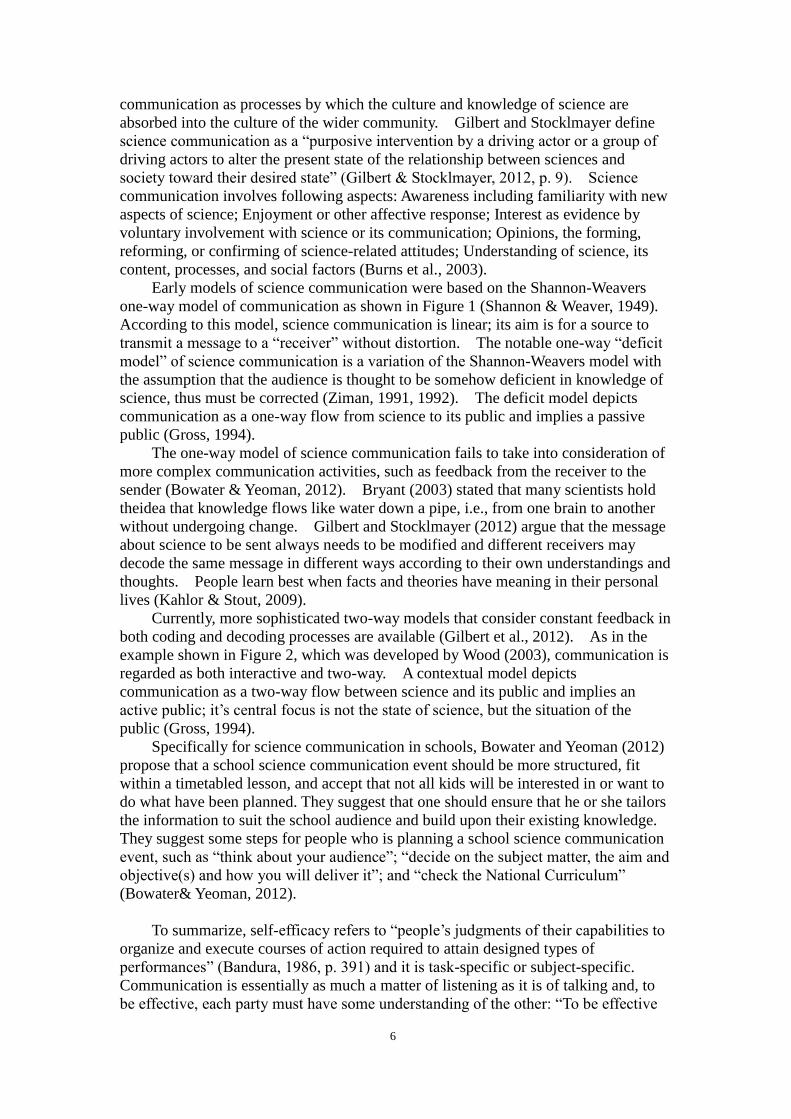
Early models of science communication were based on the Shannon-Weavers
one-way model of communication as shown in Figure 1 (Shannon & Weaver, 1949).
According to this model, science communication is linear; its aim is for a source to
transmit a message to a “receiver” without distortion. The notable one-way “deficit
model” of science communication is a variation of the Shannon-Weavers model with
the assumption that the audience is thought to be somehow deficient in knowledge of
science, thus must be corrected (Ziman, 1991, 1992). The deficit model depicts
communication as a one-way flow from science to its public and implies a passive
public (Gross, 1994).
The one-way model of science communication fails to take into consideration of
more complex communication activities, such as feedback from the receiver to the
sender (Bowater & Yeoman, 2012). Bryant (2003) stated that many scientists hold
theidea that knowledge flows like water down a pipe, i.e., from one brain to another
without undergoing change. Gilbert and Stocklmayer (2012) argue that the message
about science to be sent always needs to be modified and different receivers may
decode the same message in different ways according to their own understandings and
thoughts. People learn best when facts and theories have meaning in their personal
lives (Kahlor & Stout, 2009).
Currently, more sophisticated two-way models that consider constant feedback in
both coding and decoding processes are available (Gilbert et al., 2012). As in the
example shown in Figure 2, which was developed by Wood (2003), communication is
regarded as both interactive and two-way. A contextual model depicts
communication as a two-way flow between science and its public and implies an
active public; it’s central focus is not the state of science, but the situation of the
public (Gross, 1994).
Specifically for science communication in schools, Bowater and Yeoman (2012)
propose that a school science communication event should be more structured, fit
within a timetabled lesson, and accept that not all kids will be interested in or want to
do what have been planned. They suggest that one should ensure that he or she tailors
the information to suit the school audience and build upon their existing knowledge.
They suggest some steps for people who is planning a school science communication
event, such as “think about your audience”; “decide on the subject matter, the aim and
objective(s) and how you will deliver it”; and “check the National Curriculum”
(Bowater& Yeoman, 2012).
To summarize, self-efficacy refers to “people’s judgments of their capabilities to
organize and execute courses of action required to attain designed types of
performances” (Bandura, 1986, p. 391) and it is task-specific or subject-specific.
Communication is essentially as much a matter of listening as it is of talking and, to
be effective, each party must have some understanding of the other: “To be effective
Page 7
7
with any audience, communication must be an interactive process…” (Stocklmayer et.
al., 2001, p. 3). In order to engage the audience, science communicators must
identify audience’s preconceptions or alternative conceptions of science. Science
communication is not just about knowledge and understanding; it also depends as
much on the interests and concerns of the audience as on those of the scientists or
others in positions of social authority (Lewenstein, 1995). The process of
participation and engagement in science is a contextual one (Falk & Storksdieck,
2005). Accordingly, in this study science communication efficacy was defined as
university students’ beliefs in their capabilities to help middle and high school
students understand science. Specifically, we intend to develop a standardized
instrument for measuring university students’ self-efficacy in communicating science
to K-12 students. The specific research questions are:
1. What is the validity evidence for supporting the use of the measurement
instrument to measure university students’ self-efficacy in communicating science to
K-12 students?
2. What is the reliability evidence for supporting the use of the measurement
instrument to measure university students’ self-efficacy in communicating science to
K-12 students?
Method Participants
Participants were university students, most of them in STEM fields, who were part of
a NSF-funded project that assigned university graduate and undergraduate students to
middle and high school classrooms to work with students and teachers in science.
For this sample, 49.4% of the participants were undergraduate students and 1.1% of
them were Master’s student, and 20.7% of them were PhD students. Eighty-seven
students completed the pilot instrument after they had completed at least one semester
placement in middle and high schools from 2011-2013. Seventeen additional students
completed the revised instrument after they had completed their placement in local
middle and high schools in Dec. 2013.
Procedure
The development of the science communication efficacy instrument followed a
construct modeling approach (Wilson, 2003; 2005). The construct modeling
approach to developing a measurement instrument starts with a clearly defined
construct, which “precipitates an idea or a concept that is the theoretical object of
our interest in the respondent…” (Wilson, 2005, p. 5), operationalized by progress
variables. Assessment tasks are then derived from the defined progress variables,
and data collected from pilot-testing and field-testing are used to examine the fit
between the progress variables and data using Rasch modeling (Bond & Fox, 2007;
Liu, 2010).
We defined the construct of science communication self-efficacy to be the
university students’ beliefs in their capabilities to help middle and high school
students understand science. The progress variable of self-efficacy was
conceptualized as consisting of the following levels of capabilities: understanding
students, developing science content, and explaining the content.
We used a Likert-scale (Likert, 1932) type question format. Using response
scales to collect attitude data has a long history in science education. For each
Likert-scale item, respondents are asked to specify their levels of agreement to a
given statement, usually expressed in a format such as: strongly disagree, disagree,
Page 8
8
neutral, agree, strongly agree (Bond & Fox, 2007). The pilot measurement instrument
contained 20 items with five response categories to describe respondents’ levels of
self-efficacy in communicating science. Response categories were coded as 1 through
5 in an ordinal scale: 1—Nothing, 2—Very Little, 3—Some Influence, 4—Quite a
Bit, and 5—A Great Deal. The items related to three major aspects of the progress
variable on science communication to middle and high school students: understanding
students, developing science content, and explain the content.
Data Analysis
Students responses to the 20-item pilot measurement instrument were then analyzed
using the rating scale Rasch model (Andrich, 1978). Rasch measurement has been
increasingly used in a wide variety of disciplines in the past 30 years (Liu & Boone,
2006), and is becoming the convention for developing quality measurement
instruments in all social sciences (Royal et al., 2010). Unlike most other statistical
models which are applied to data, Rasch models impose requirements upon data
(Royal, et al., 2010). Advantages of using Rasch measurement are that, when there
is good model-data-fit, measures produced by the instrument are interval. Interval
scale measures have precise measurement errors for both individual items and
subjects, and allow for inferential statistical analyses to be conducted with more
power.
Winsteps computer program (Linacre, 2011) was used to conduct the analysis.
Linacre's eight rating scale analysis guidelines (2002) were used to decide item
quality.
Pilot-study
Item and person separation and reliability of the pilot instrument
Based on the analysis of the pilot instrument, item separation was 3.33
(reliability=0.92) and person separation was 2.56 (reliability =0.87), both were
acceptable. The mean of the infit mean squares (MNSQ) at 1.01 and the outfit mean
squares (MNSQ) at 0.99 were very close to the expected value of one. The mean
infit ZSTD and outfit ZSTD were both inside the conventionally acceptable range of -
2 to + 2.
The Wright map of items and subjects showed that students’ self-efficacy had a
wide range of variation, but most items gathered along the middle to lower end of the
subjects’ communication efficacy range. However, no item was available for higher
science communication efficacy subjects, and only one student fell below the 20
items. A gap existed between two items with seven students in that gap. The above
findings suggestged that the items of pilot instrument as a whole were relatively easy
for those respondents, thus there was a need for addition of more difficult items for
higher efficacy students.
Fit statistics for items
The mean square residual (MNSQ) and the standardized mean square residual
(ZSTD) are typically used as the fit indicators to examine how well each item accords
with the Rasch unidimensional model. Item MNSQ has an expected value of 1.0
and a range from zero to infinity. Based on Linacre’s suggestion (Linacre, 2010),
items fit the model when their MNSQs fall within the range of 0.6 to 1.4 (for rating
scale); a fit value below 0.6 (overfit) indicates that the item fits better than expected
and can be a hint to item redundancy; a fit value above 1.4 (underfit) might be an
indicator for multidimensionality (Vehren et al., 2013). ZSTD values are within the
Page 9
9
range of -2 to +2 (Liu, 2010) when there is a good fit; a positive z-residual indicates
that responses are worse than expected; a negative z-residual indicates that responses
are better than expected (Bradley et al., 2010).
Inspection of the fit statistics for all pilot 20 items, 17 of the 20 items had infit
and outfit MNSQs within the acceptable range of 0.6 to 1.4, with exceptions of item 2
(infit MNSQ =0.47 and outfit MNSQ=0.49), item 5 (infit MNSQ=1.43 and outfit
MNSQ=1.51), and item 19 (infit MNSQ=1.44 and outfit MNSQ=1.45) .
Item-measure correlation
Item-measure correlation (point-measure correlation/PTMEA) indicates how the item
contributes to the item difficulty (Liu, 2010). According to Wolfe and Smith (2006),
“item-measure correlations should be positive, indicating that the scores on the item
are positively correlated with the average score on the remaining items. Negative
item-measure correlations indicate negatively polarized items that were not reverse
scored. Near zero item-measure correlations indicate that the item is either
extremely easy or difficult to answer correctly or to endorse or that the item may not
measure the construct in the same manner as the remaining items” (Wolfe & Smith,
2006, p. 206).
None of the 20 items had a zero or negative point-measure correlation
(PTMEA); all of the point-measure correlations (PTMEA) had values ranging from
0.25 to 0.73, which indicated that all of the 20 items contributed to the measurement
of students’ science communication efficacy.
Rating scale category structure
The item category frequencies had a good spread, meeting the expectations (Linacre,
2002;Wolfe & Smith, 2006). The measure for category 1 was -2.80, meaning that
the average agreeability estimate for persons answering 1 across all items was -2.80
logits. For categories of 2, 3, 4, 5, the category agreeability estimate was -1.30 logits,
-0.13 logits, 1.25 logits, and 3.10 logits, respectively, meeting the requirement of the
rating scale design, which was increasing monotonically with category.
Linacre (2002) recommended that step calibrations should increase by at least
0.81 logits for a 5-point scale to show distinction between categories (Wolfe & Smith,
2006). The step calibration of the 20 items increased monotonically by 0.51 logits,
1.30 logits, and 1.37 logits; however, the difference between category 2 and 3 (0.5
logits) was too small. This issue was also reflected in probability curves. Probability
curves of good rating scales show that each hill stands alone, as hills blending in with
other hills indicate that respondents may have a hard time to endorse among the
categories (Royal, et al., 2010). Specifically, the category 2 (“very little”) and
category 3 (“some influence) were too close for respondents to differentiate; they
needed to be combined.
Item and Instrument Revisions
Based on the Rasch analysis results of the pilot-study instrument, a number of
improvements were made to the instruments. Specifically, in order to accurately
measure the self-communication self-efficacy of persons with the highest ability level,
we added four new items: new item 17 (“Explain a difficult science concept to
students”), new item 18 (“Explain current research to teachers”), new item 19
(“Facilitate student learning in museums ”), new item 20 (“Explain science to
parents”).
Four pilot items had similar measures: -0.41 logits (“understand middle and high
Page 10
10
school students’ science background knowledge”), -0.43 logits (“understand middle
and high school students’ interest in science”), -0.34 logits (“Understand middle and
high school students’ social and cultural backgrounds”), -0.53 logits (“Understand
middle and high school students’ attention span”), respectively, and two of them,
“Understand middle and high school students’ social and cultural backgrounds”(
PTMEA=0.32) and “Understand middle and high school students’ attention
span”(PTMEA=0.25) had low PTMEA correlation. These two items were removed
from the instrument. We also removed item “Lead small group activities/discussions
with students after school or during weekends” and item “Tutor students after school
or during weekends” because they both did not fit the model well and both pertained
to “weekends” activities that were not central to the measured construct. We also
collapsed the rating scale categories from five to four. The new categories became:
1—Little, 2—Some, 3—Quite a bit, and 4—A Great Deal.
Field-testing
The revised instrument included again 20 items. They were responded by 17
students. Responses by the 17 students were combined with the responses by the 87
students from the pilot study by the following recoding: 1 was coded as 1, 2 and 3
were coded as 2, 4 as 3, and 5 as 4. The combined responses were then submitted to
Rasch analysis again. The findings reported next are based on this analysis.
Results Figure 3 presents the Wright map of the revised instrument. We can see that
students’ self-efficacy had a wider range of variation from -2.33 logits to 5.92 logits,
while the revised item measures ranged from -0.68 logits to 0.84 logits. The first
two most difficult items (item 20, item 19) were the new items (1.23 logits, 1.12
logits), and item 17 (0.39 logits) and item 18 (0.60 logits) were both above the mean
of the items, indicating that the four new items were relatively difficult items just as
intended. However, there was still one gap located near two standard deviations
from the mean of the items; fifteen students had a lower self-efficacy than any item
could assess. Another gap existed at the top of the continuum, where 14 higher self-
efficacy students were in that gap.
Table 1 presents fit statistics for the final 20 items in the revised instrument.
We can see that, infit MNSQs ranged from 0.65 to 1.29 whereas the outfit MNSQs
ranged from 0.69 to 1.31; both were regarded as being acceptable. Infit ZSTDs and
outfit ZSTDs all ranged from -2.0 to +2.0 with the exception of item 2 ( infit ZSTD= -
3.0 and outfit ZSTD=-2.5), item 6 ( infit ZSTD=1.8 and outfit ZSTD= 2.2). All the
items exhibited strong positive point-measure correlations (PTMEA) ranging from
0.50 to 0.70.
Table 2 presents the category structure statistics. As shown in Table 2, with four
categories instead of five, each category count satisfied the criterion for minimum
counts of 10 observations (Linacre, 2002). The average category measures were
ordered and increased monotonically from -1.01 logits to 1.60 logits. The outfit
MNSQ ranged from 0.96 logits to 1.02 logits, indicating expected category usage
(Linacre, 2002). In addition, the category threshold calibrations increased
monotonically with categories and the distances were all more than 1.1 logits,
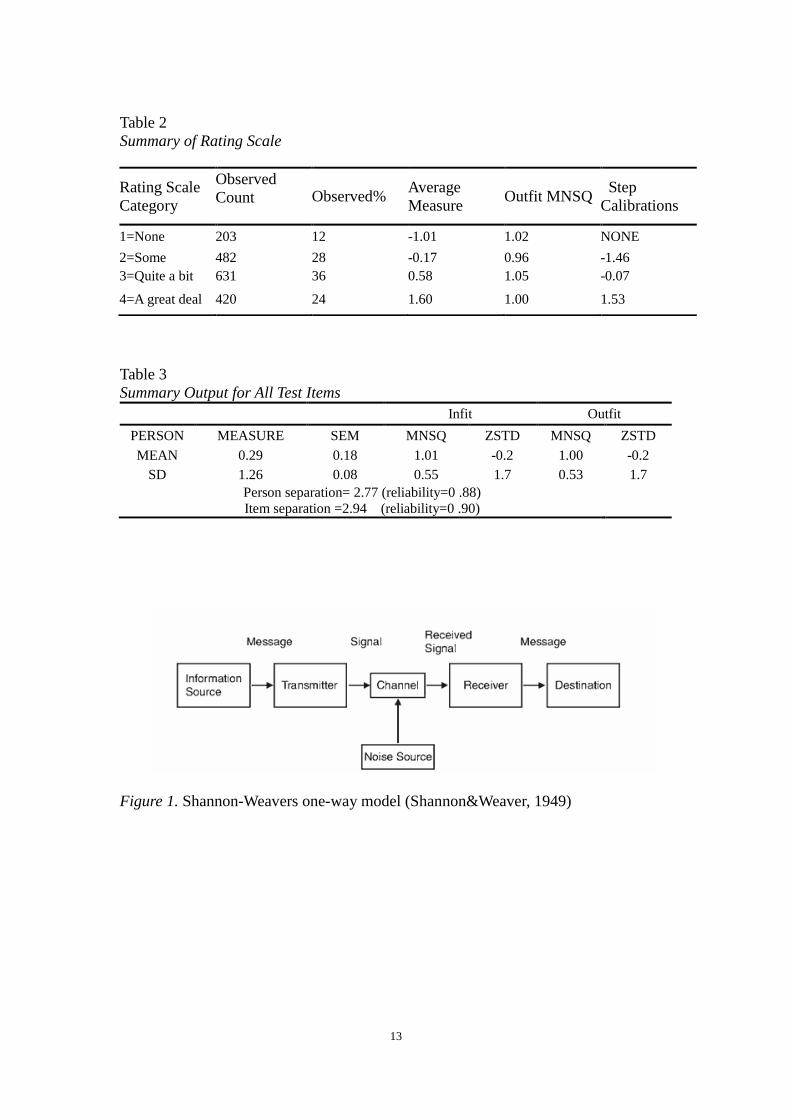
meeting the guidelines given by Linacre (2004). Inspecting the category probability
curves (see Figure 4), we see that each category represented a distinct region of the
underlying construct, thus, collapsing category 1 and 2 had indeed improved our
rating scale diagnostics.
Page 11
11
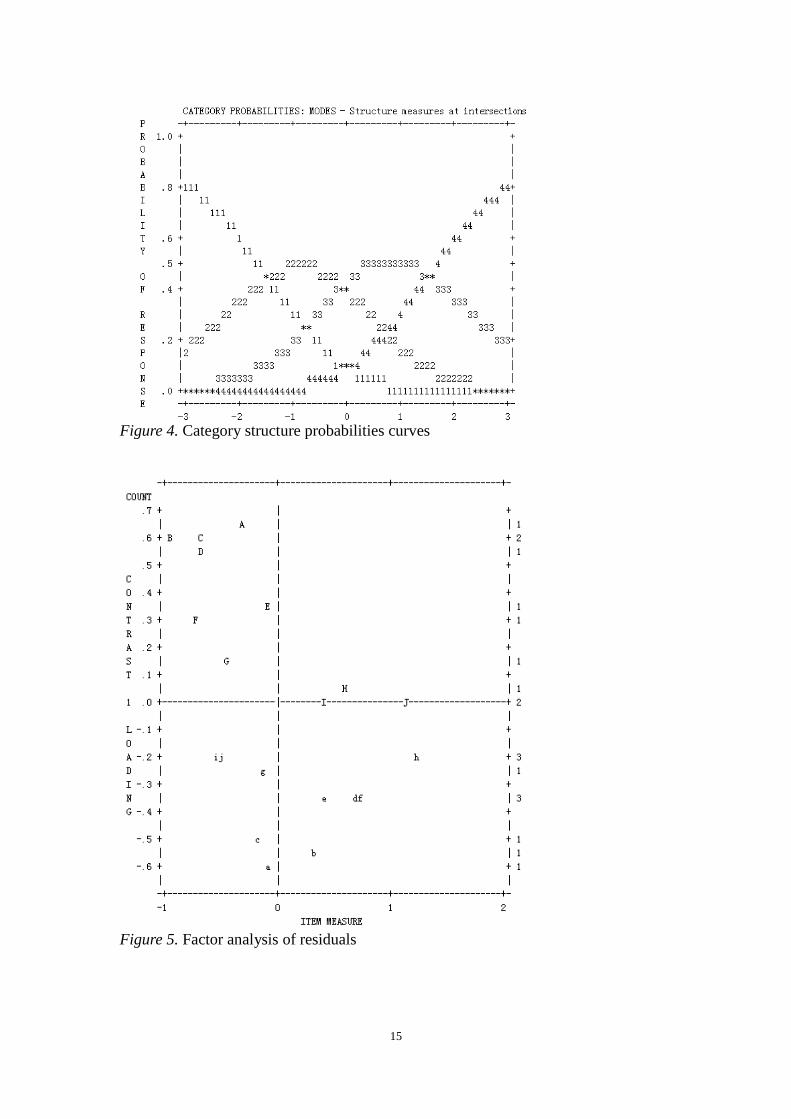
Figure 5 presents the dimensionality map based on PCA (principal component
analysis). PCA was applied to standardized residuals to identify possible dimensions
existing in the scale (Oon & Subramaniam, 2011). A variance greater than or equal
to 50% for the Rasch dimension can be regarded as evidence that the scale is
unidimensional (Linacre, 2011), and scale unidimensionality can be assumed if the
second dimension (first contrast) has the strength of less than 3 items (in terms of
eigenvalues) and the unexplained variance by the first contrast is less than 5% (Oon,
& Subramaniam, 2011). Measures resulted from the revised measurement accounted
for 43.9% of total variance, though 4% higher than pilot measurement, yet still below
the expected norm. Besides, the second dimension had an eigenvalue of 3.2 and
accounted for 9% (previously it was 3.5 and 10.2%) of the variance, indicating that
unidimensionality of items was still not ideal. From Figure 5, we see that items A,
B, C, D, a, b (corresponding to items 11, 10, 14, 9, 4, 5) had the largest contrast
loadings (>0.50), suggesting that they might measure an additional dimension.
Table 3 presents the summary statistics related to reliability. It can be seen in the
table that the person separation index was 2.77, with an equivalent Cronbach’s
reliability coefficient (α value) of 0.88. Item separation index was 2.94, and its
corresponding Cronbach’s α value was 0.90, indicating reliable item and person
estimation. Further, Rasch measurement produces an SEM as an additional measure
of reliability for each individual person and item measure. Persons and items with
measures closer to their means have smaller SEMs than those further from the means.
As shown in Table 3, SEM values for persons and items were small, ranging from
0.14 to 0.33.
Conclusion Validity
According to Liu and Boone (2006), “if assessment data fit the Rasch model well,
then there is evidence to claim that the originally hypothesized dimension or construct
exists, and is assessed by the instrument, thus providing evidence for content and
construct validity.” ( Liu & Boone, 2006, p. 6). Based on the above presented
findings, overall items fit the Rasch model well, suggesting that measures based on
this revised instrument are valid. Given the nature of Rasch measurement, when items
fit the Rasch model, there is evidence for the construct validity of the measures.
Unidimensionality
From the results presented above, unidimensionality of the instrument requires further
improvement. Specifically, items 4, 5, 9, 10, 11, and 14 need to be reconsidered.
We tried to remove those six items; the variance accounted for did not improve much
and was still below 50%. Although it is common in the literature involving Rasch
analysis that reported variance accounted for by Rasch measures based on PCA is less
than 50% (Cervellione et al., 2009; Fischer et al., 2005; Higgins, 2007; Oon &
Subramaniam, 2011), and our variance accounted for (43.9%) by Rasch measures in
this study is not unusual, further improvement to the instrument to improve
unidimensionality is needed.
In conclusion, the results suggest that the revised self-efficacy instrument with
the new 20-items is well-targeted at the STEM students. Measures from this
instrument are reasonably valid and reliable, thus are appropriate for assessing
university STEM students’ science communication self-efficacy.
Page 12
12
Table 1
The Revised Item Statements and Statistics
Item Statement Infit Outfit Measure PTMEA
MNSQ ZSTD MNSQ ZSTD
1
Understand middle and high school students’
science background knowledge
0.81 -1.5 0.82 -1.3 -0.54 0.61
2 Understand middle and high school students’
interest in science
0.65 -3.0 0.69 -2.5 -0.54 0.62
3 Understand middle and high school students’
cognitive abilities
0.94 -0.5 1.02 0.2 -0.20 0.50
4 Decide what science topics are appropriate to
students
0.94 -0.4 0.97 -0.2 -0.11 0.60
5 Decide how much science content is appropriate
to students
1.12 1.0 1.19 1.4 0.33 0.50
6 Help teachers find relevant resources (e.g.,
science activities)
1.25 1.8 1.31 2.2 -0.15 0.57
7 Develop science labs 1.24 1.8 1.21 1.6 0.42 0.65
8 Develop out-of-school science learning activities 1.12 1.0 1.08 0.6 0.73 0.62
9 Assist teachers in teaching lessons 1.17 1.3 1.18 1.3 -0.70 0.56
10 Assist teachers in conducting labs 1.08 0.6 1.10 0.7 -0.97 0.61
11 Teach science labs to students 0.97 -0.2 -0.93 -0.5 -0.34 0.68
12 Facilitate out-of-school science learning activities 0.88 -0.9 0.87 -1.0 0.66 0.69
13 Lead small group activities/discussions with
students in class
1.14 1.1 1.09 0.7 -0.71 0.55
14 Demonstrate scientific content, procedures, tools,
or techniques to students
0.92 -0.6 0.87 -0.9 -0.68 0.65
15 Teach lessons or give lectures to students in class 0.90 -0.8 0.90 -0.7 -0.09 0.70
16 Explain a difficult science concept to students 0.77 -1.9 0.76 -1.9 -0.45 0.69
17 Relate current research to K-12 curriculum 1.07 0.3 1.03 0.2 0.39 0.64
18 Explain current research to teachers 1.04 0.2 0.97 0.0 0.60 0.65
19 Facilitate student learning in museums 1.29 1.0 1.20 0.7 1.12 0.66
20 Explain science to parents 1.23 0.8 1.29 1.0 1.23 0.60
variance explained by measures = 43.9% unexplained variance (total) = 56.1%
Page 13
13
Table 2
Summary of Rating Scale
Table 3
Summary Output for All Test Items
Infit Outfit
PERSON MEASURE SEM MNSQ ZSTD MNSQ ZSTD
MEAN 0.29 0.18 1.01 -0.2 1.00 -0.2
SD 1.26 0.08 0.55 1.7 0.53 1.7
Person separation= 2.77 (reliability=0 .88)
Item separation =2.94 (reliability=0 .90)
Figure 1. Shannon-Weavers one-way model (Shannon&Weaver, 1949)
Rating Scale
Category
Observed
Count
Observed% Average
Measure Outfit MNSQ
Step
Calibrations
1=None 203 12 -1.01 1.02 NONE
2=Some 482 28 -0.17 0.96 -1.46
3=Quite a bit 631 36 0.58 1.05 -0.07
4=A great deal 420 24 1.60 1.00 1.53
Page 14
14
Figure 2. Transaction model of communication from Wood, 2003 (adapted by
Bowater & Yeoman, 2012)
Figure 3. Wright Map of Person-Item distribution
Page 15
15
Figure 4. Category structure probabilities curves
Figure 5. Factor analysis of residuals
Page 16
16
References
Abt Associates (2010). Evaluation of the National Science Foundation’s GK-12
Program. Arlington, VA.
Andrich, D. (1978). Rating formulation for ordered response categories.
Psychometrika, 43(4), 561-573.
Armor, D., Conroy-Oseguera, P., Cox, M., King, N., McDonnell, L., Pascal, A., et al.
(1976). Analysis of the school preferred reading programs in selected Los
Angeles minority schools (Rep. No. R-2007-LAUSD). Santa Monica, CA: RAND.
Ashton, P. T., Olejnik, S., Crocker, L., & McAuliffe, M. (1982). Measurement
problems in the study of teachers' sense of efficacy. Paper presented at the annual
meeting of the American Educational Research Association, New York, NY.
Ashton, P. T., Webb, R. B., & Doda, N. (1983). A study of teachers' sense of
efficacy
(Final Report, National Institute of Education Contract No. 400-79-0075).
Gainesville: University of Florida.(ERIC Document Reproduction Service No. ED
231 834).
Ashton, P. T. (1984). Teacher efficacy: A motivational paradigm for effective
teacher education.Journal of Teacher Education,35, 28–32.
Ashton, P.T., & Webb, R.B. (1986). Making a difference: Teachers’ sense of efficacy
and student achievement. New York: Longman.
Bandura, A. (1977). Self-efficacy. Toward a unifying theory of behavioral change.
Psychological Review, 84, 191–215.
Bandura, A. (1986). Social foundations of thought and action: A social cognitive
theory. Englewood Cliffs,NJ: Prentice-Hall.
Bandura, A. (1994). “Self-efficacy”,in Ramachaudran, V.S. (Ed.), Encyclopedia of
Human Behavior, Vol. 4, Academic Press, New York, NY, pp. 71-81.
Bandura, A., ed. (1997). Self-efficacy: The exercise of control. New York: W.H.
Freeman.
Berman, P. (1977). Federal Programs Supporting Educational Change, Vol. VII:
Factors Affecting Implementation and Continuation
Berridge, E. J., Freeth, D., Sharpe, J., & Roberts, C. M. (2007). Bridging the gap:
supporting the transition from medical student to practising doctor-a two-week
preparation programme after graduation. Medical teacher, 29(2-3), 119-127.
Block, M. E., Hutzler, Y., Barak, S., & Klavina, A. (2013). Creation and Validation
of the Self-Efficacy Instrument for Physical Education Teacher Education Majors
Toward Inclusion. Adapted Physical Activity Quarterly, 30(2), 184-205.
Bond, T. G., & Fox, C. M. (2007). Applying the Rasch model: Fundamental
measurement in the human sciences (second edition).Mahwah,NJ:Lawrence
Erlbaum
Bowater, L., & Yeoman, K. (2012). Science Communication: A Practical Guide for
Scientists. John Wiley & Sons.
Bradley, K. D., Cunningham, J., Haines, T., Mueller, C. E., Royal, K. D., Sampson, S.
O., ... & Weber, J. A. (2010). Constructing and evaluating measures: Applications
of the Rasch measurement model.
Brouwers, A., & Tomic, W. (2003). A test of the factorial validity of the Teacher
Efficacy Scale. Research in Education, 69(1), 67-79.
Bryant, C. (2003). Does Australia need a more effective policy of Science
Communication?. International Journal for Parasitology, 33(4), 357-361.
Burns, T. W., & O'connor, D. J. M., Stocklmayer. S. (2003). Science
Page 17
17
communication:
a contemporary definition. Public Understanding of Science 12, 183–202
Bursal, M., & Yigit, N. (2012). Pre-Service Science and Technology Teachers'
Efficacy Beliefs about Information and Communication Technologies (ICT) Usage
and Material Design. Educational Sciences: Theory and Practice, 12(2),
1084-1088.
Clark, M. C., Owen, S. V., & Tholcken, M. A. (2004). Measuring student
perceptions of clinical competence. The Journal of nursing education, 43(12), 548.
Coladarci, T., & Fink, D. R. (1995). Correlations among measures of teacher
efficacy: Are the measuring the same thing?Paper presented at the annual meeting
of the American Educational Research Association, San Francisco, CA.
Day, C. S.,Yeh, A. C., Franko,O.,Ramirez,M.,& Krupat,E. (2007). Musculoskeletal
medicine: an assessment of the attitudes and knowledge of medical students at
Harvard Medical School. Academic Medicine, 82(5), 452-457.
DeChenne, S. E., & Enochs, L. (2010). Measuring the Teaching Self-Efficacy of
Science, Technology, Engineering, and Math Graduate Teaching Assistants. Online
Submission.
Deemer, S. A., & Minke, K. M. (1999). An investigation of the factor structure of
the teacher efficacy scale. The Journal of Educational Research, 93(1), 3-10.
Dellinger, A. B. (2005). Validity and the review of literature. Research in the
Schools,12(2), 41-54.
Dellinger, A. B., Bobbett, J. J., Olivier, D. F., & Ellett, C. D. (2008). Measuring
teachers’ self-efficacy beliefs: Development and use of the TEBS-Self. Teaching
and Teacher Education, 24(3), 751-766.
Denzine, G. M., Cooney, J. B., & McKenzie, R. (2005). Confirmatory factor
analysis of the Teacher Efficacy Scale for prospective teachers. British Journal of
Educational Psychology, 75(4), 689-708.
Falk,J.,& Storksdieck,M. (2005). Using the contextual model of learning to
understand visitor learning from a science center exhibition. Science Education,
89(5), 744-778.
Fischer, A. R., De Jong, A. E., De Jonge, R., Frewer, L. J., & Nauta, M. J. (2005).
Improving food safety in the domestic environment: The need for a
transdisciplinary approach. Risk Analysis, 25(3), 503-517.
Gaffney, A. L. H. (2011). Measuring Students' Self‐ Efficacy for Communication.
International Journal of Art & Design Education, 30(2), 211-225.
Gamse, B., Carter Smith, W., Parsad, A., Dreier, D., Neishi, K., Carney, J., Spader, J.
(2010). Evaluation of the National Science Foundation’s GK-12 Program.
Volume I and II. Cambridge, MA: Abt Associates, Inc; Prepared for the National
Science Foundation, Arlington, VA.
Gibson, Sh., &Dembo,M.H. (1984). Teacher efficacy: A construct validation.
Journal of Educational Psychology, 76(4),569-582.
Gilbert, J. K., Lewenstein, B. V., & Stocklmayer, S. M. (Eds.). (2012).
Communication and Engagement with Science and Technology: Issues and
Dilemmas A Reader in Science Communication. Routledge.
Gist, M., Schwoerer, C., & Rosen, B. (1989). Effects of alternative training methods
on selfefficacy and performance in computer software training. Journal of Applied
Psychology, 74(6), 884 - 891.
Gross, A. G. (1994). The roles of rhetoric in the public understanding of science.
Public Understanding of Science, 3(1), 3-23.
Guskey, T. R. (1981). The relationship of affect toward teaching and teaching
Page 18
18
self-concept to responsibility for student achievement. Journal of Social Studies
Research, 5(69-74)
Guskey,T.R.,&Passaro,P.D. (1994). Teacher efficacy: A study of construct
dimensions.American Educational Research Journal,31, 627–643
Henson, R. K. (2002). From adolescent angst to adulthood: Substantive implications
and measurement dilemmas in the development of teacher efficacy
research.Educational Psychologist, 37, 137–150
Higgins, G. E. (2007). Examining the Original Grasmick Scale A Rasch Model
Approach. Criminal Justice and Behavior, 34(2), 157-178.
Humphries, C. A., Hebert, E., Daigle, K., & Martin, J. (2012). Development of a
Physical Education Teaching Efficacy Scale. Measurement in Physical Education
and Exercise Science, 16(4), 284-299.
Huziak-Clark, T., Van Hook, S., Nurnberger-Haag, J., & Ballone-Duran, L. (2007).
Using inquiry to improve Pedagogy through K-12/University partnerships. School
Science and Mathematics, 107(8), 311-324.
Jones,A. (2012). Developing a measurement tool for assessing physiotherapy
students’self-efficacy: a pilot study. Assessment & Evaluation In Higher Education,
37(3), 369-377.
Kahlor, L., & Stout, P. (Eds.). (2009). Understanding and Communicating Science.
Routledge.
Klassen, R. M., Tze, V. M. C., Betts, S. M., & Gordon, K. A. (2011). Teacher
efficacy research 1998–2009: Signs of progress or unfulfilled
promise?Educational Psychology Review,23, 21–43
Lewenstein, B. (1995). Science and the media. In S. Jasanoff, G. E. Markle, J. C.
Petersen, and T. Pinch (eds.), Handbook of science and technology studies.
Thousand Oaks, CA: Sage Publications.
Likert, R. A. (1932). Technique for the measurement of attitudes, Archives of
Psychology, 140
Linacre, J. M. (2002). Optimizing rating scale category effectiveness. J Appl Meas,
3(1), 85-106.
Linacre, J. M. (2010). WINSTEPS Rasch measurement computer program, version
3.69.1.8.Chicago, IL: Winsteps.com
Linacre, J. M. (2011). Winsteps (version 3.72.0) [Computer Software]. Chicago:
Winsteps.com.
Liu, X., & Boone, W. J. (2006). Applications of Rasch measurement in science
education. JAM Press.
Liu, X. (2010). Using and developing measurement instruments in science
education: A Rasch modeling approach. Iap.
Moskal, B., Skokan, C., Kosbar, L., Dean, A., Westland, C., Barker, H., Tafoya, J.
(2007). K-12 outreach: Identifying the broader impacts of four outreach projects.
Journal of Engineering Education, 96(3), 173-189.
Mulder, H. A., Longnecker, N., & Davis, L. S. (2008). The state of science
communication programs at universities around the world. Science
Communication,
30(2), 277-287.
Ormrod,J.(2004). Learning theory and the educational process (4th ed.).
Boston:Pearson.
Oon, P. T., & Subramaniam, R. (2011). Rasch Modelling of a Scale that Explores
the Take-Up of Physics Among School Students from the Perspective of Teachers.
In Applications of Rasch measurement in learning environments research (pp.
Page 19
19
119-139). SensePublishers.
Pajares, F. (1996). Assessing Self-Efficacy Beliefs and Academic Outcomes: The
Case for Specificity and Correspondence.
Riboh, J., M. Curet, and T. Krummel. (2007). Innovative introduction to surgery in
the preclinical years. American Journal of Surgery 194: 227–30.
Roberts, J. K., & Henson, R. K. (2000). Self-Efficacy Teaching and Knowledge
Instrument for Science Teachers (SETAKIST): A Proposal for a New Efficacy
Instrument.
Roll-Peterson, L. (2008). Teachers perceived efficacy and the inclusion of a pupil
with dyslexia or mild mental retardation: Findings from Sweden. Education and
Training in Developmental Disabilities, 43,174–185.
Rose, J. S., & Medway, F. J. (1981). Measurement of teachers' beliefs in their
control over student outcome. Journal of Educational Research, 74, 185-190.
Royal, K. D., Ellis, A., Ensslen, A., & Homan, A. (2010). Rating scale optimization
in survey research: an application of the Rasch rating scale model. Journal of
Applied Quantitative Methods, 5(4), 607
Salas, C. S. (2009). Measuring self-efficacy of teachers using Multiple Intelligences
teacher training (Doctoral dissertation, CAPELLA UNIVERSITY).
Schunk,D.H. (1989). Self-efficacy and achievement behaviors, Educational
Psychology Review, Vol. 1, No. 3, pp. 173–208
Shannon, C. E., & Weaver, W. (1949). The mathematical theory of communication
(Urbana, IL. University of Illinois Press, 19(7), 1.
Shea, J. A., & Fortna, G. S. (2002). Psychometric methods. In International
handbook of research in medical education (pp. 97-126). Springer Netherlands.
Sherer, M., Maddux, J. E., Mercandante, B., Prentice-Dunn, S., Jacobs, B. & Rogers,
R. W. (1982). The self-efficacy scale: construction and validation, Psychological
Reports, Vol. 51, No. 2, pp. 663–71.
Shim, S.,& Ryan,A. (2005, Summer). Changes in self-efficacy, challenge
avoidance,and intrinsic value in response to grades: The role of achievement
goals.Journal of Experimental Education, 73(4), 333–349. Retrieved April 29,
2008, from Academic Search Premier database.
Soodak, L. C., & Podell, D. M. (1993). Teacher efficacy and student problem as
factors in special education referral. The Journal of Special Education,27(1), 66-81.
Soodak, L. C., & Podell, D. M. (1996). Teacher efficacy: Toward the understanding
of a multi-faceted construct.Teaching and Teacher Education,12, 401–411.
Stocklmayer, S. M., Gore, M. M., & Bryant, C. R. (Eds.). (2001). Science
communication in theory and practice (Vol. 14). Springer.
Tschannen-Moran, M., Hoy, A. W., & Hoy, W. K. (1998). Teacher efficacy: Its
meaning and measure. Review of educational research, 68(2), 202-248.
Tschannen-Moran, M., & Hoy, A. W. (2001). Teacher efficacy: Capturing an elusive
construct. Teaching and teacher education, 17(7), 783-805.
Vehren, T., Boecker, M., Norra, C., Wirtz, M., Gauggel, S., & Forkmann, T. (2013).
Cross-sectional validation of the Rasch-based Depression Screening (DESC) in a
mixed sample of patients with mental and somatic diseases.Comprehensive
psychiatry, 54(7), 1082-1089.
Wilson, M. (2003). On choosing a model for measuring.
Wilson, M. (2005). Constructing measures: An item response modeling approach.
Mahwah, NJ: Lawrence Erlbaum Associates Publishers.
Wolfe, E. W., & Smith Jr, E. V. (2006). Instrument development tools and activities
or measure validation using Rasch models: part II--validation activities. Journal of
Page 20
20
Applied Measurement, 8(2), 204-234.
Wood, J. T. (2003). Communication in our lives,3rd edn.Thomson
Woolfolk Hoy, A., & Burke Spero, R. (2005). Changes in teacher efficacy during
the early years of teaching: A comparison of four measures. Teaching and teacher
education, 21(4), 343-356.
Woolfolk Hoy, A., & Davis, H. A. (2006). Teacher self-efficacy and its influence on
the achievement of adolescents. Self-efficacy beliefs of adolescents, 117-137.
Ziman, J. (1991). Public understanding of science. Science, Technology & Human
Values, 16(1), 99-105.
Ziman, J. (1992). Not knowing, needing to know, and wanting to know. When
science meets the public, 13-20.