99
“Meat Perfection Defined” A n n u a l R e p o r t
“Meat Perfection Defined”
A n n u a l R e p o r t

“Meat Perfection Defined”
The History of BMC
Botswana Meat Commission (BMC) or “The Commission” has been in existence, as a body corporate, since 1965. The Act of Parliament which legislated the BMC, requires it to serve the cattle producers of Botswana. An excerpt from the 1965 Act states that “the business of the BMC is to purchase cattle and to slaughter the same; and prepare and sell the products of such slaughtering or, if the Commission thinks fit, to sell on the hoof cattle so purchased; in addition the Commission may, in its discretion and with the consent of the Minister, promote schemes for the development and improvement of the livestock industry.” The Commission operates a few production plants and other facilities in Botswana, South Africa and the United Kingdom.
The BMC Headquarters in Lobatse comprises an integrated complex housing the Head Office, Abattoir and a Cannery plant. The Tannery Plant, which collates hides from varied BMC operations, is also located in Lobatse – but quite distantly from the main abattoir plant. Other abattoir facilities were set-up in Francistown and Maun, in 1983 and 1989 respectively. The Commission also owns a storage warehouse in Capetown, South Africa as well as marketing office in the United Kingdom.
BMC supplies varied markets with primal cuts of Botswana Beef, beef by-products as well as processed meats from the Cannery Plant. Even though it is no longer in the plinth of highest contributors to Gross Domestic Product (GDP), Botswana beef exports remains integral to economic diversity efforts of the country.
Botswana Meat Commission commitys to its stakeholders and customers to consistently deliver value perfection
and quality in every meat cut and processed meat products. It therefore promises to deliver to its target markets
through its brand promise “ Meat Perfection De�ned.”

2015A n n u a l R e p o r t


CONTENTS
Corporate Governance Report
Board Meetings
Board Committees
History of BMC
Geographical Structure
Group structure
Board of Commissioners
Executive Management
Heads of Departments
Board Chairman’s Statement
Operations
Human Capital
Stakeholder Relations
Chief Executive Officer’s Review
Compliance
1
2
3 - 4
5Management Committees
6
7
8 - 9
10
11
12 - 13
19 - 29
30 - 31
32 - 33
14 - 16
17 - 18
Sales and Marketing 34 - 39

Corporate Governance StatementStatement of Compliance
Organogram of the BMCCorporate Governance structure
The Board recognises the need to conduct the business of the Commission in accordance with the principles of the King III Code of Ethics. These principles include discipline, independence, responsi-bility, fairness, social responsibility, transparency and the accountability of Commissioners to all stakehold-ers. The Commission’s core values, some of which are Teamwork, Pursuit of Excellence, Accountability and customer Focus are founded and conform to the pillars of King III Code of Ethics. The Board of Commissioners is committed to continuous improvement through good governance, embracing ethical standards and sustainability reporting. The Corporate Governance Structure of Botswana Meat Commission (BMC) comprises the Ministry of Agriculture, the Board, and Management. See illustration below.
Composition of the Board and Appointment of Board of Commissioners
Governance of the Commission is provided for under Part 1 of the Schedule of the BMC Act Cap 74:04. Section 2 (1) establishes the Board of Commissioners which is the principal governing body of the BMC whose Members’ tenure is three (3) years.
The Board shall consist of a Chairperson and ten (10) other Members, as appointed by the Minister of Agriculture, of which four are appointed from a list of names submitted by the Livestock Advisory Commit-tee and the remaining six Members from among persons who, it appears to him, possess, by reason of their experience of and capacity in matters relating to the livestock industry, finance or administration, qualities likely to benefit the work of the Commission. Section 2 (3) empowers the Minister to disregard the list submitted by the Livestock Advisory Committee and appoint persons other than those recommended by the Committee. Members of the Board may be removed by the Minister if is of the view that their tenure is no longer in the public interest.
The role of the Board of Commissioners is to provide strategic direction and supervision to the Chief Execu-tive Office and Management of BMC based on the requirements and mandates of the BMC Act, the Ministry of Agriculture and the best interests of the cattle producers of Botswana. Within the context of this role, the Board may delegate certain of its functions to its Committees or to the CEO and Management but will at all times retain full accountabil-ity for the delegated functions.
The Board abides by its Board Charter, through which it commits to comply with principles of good gover-nance and good ethical behaviour. The guiding principles for the Board Charter and the Charters of its Committees are those contained in the King III Report on Corporate Governance.
1
MINISTER OF AGRICULTURE
BMC BOARD
BMC CEO (MANAGEMENT)

Corporate Governance Statement | Continued
Board meetings
The Board meets, at a minimum, once every quarter. Special Board meetings are convened whenever deemed necessary. Six (6) meetings were convened during the year. Commissioners are provided with comprehensive board documentation at least seven (7) days prior to each of the scheduled meetings.
The table below records the attendance of Commissioners at Board meetings for the year. Attendance of meetings was satisfactory for the year.
2
CommissionersName
19 January2015
23 March2015
13 April2015
01 June2015
02 November2015
11 December2015
Dr Thapelo Matsheka
Mr Legodile Serema
Mr Leonard Morakaladi
Present
Apologised
Term Expired
* Resigned
** Not yet Appointed
Dr Micus Chimbombi
Mr Onkabetse Kgotlafela
Mr Tshepo Masire
Ms Joyce Maphorisa
Ms Tekolo Modungwa
Mr BoipoleloKhumomatlhare
Mr Mike Dube
Mr GodfreyMosimaneotsile
Mr Moraki Mokgosana
Mr Dithologo Mmile
A
A
A
A
A
A
A
A A
A
A
A
A A A
A A
A*
* ** *
* * *
* * *
*
* * * **
O
O
O O O O

Board meetings
The non-executive directors contribute their extensive experience and knowledge to the Board’s committees. The Committees are constituted to over-see clearly defined functional responsibilities that have been delegated to them by the Main Board. Each Committee is formulated to interrogate issues within its portfolio in more detail than the Board would do ordinarily, to ensure alignment of policy, process and direction. Below are the currently existing Board Committees together with brief descriptions of their respective mandates.
1. Value Chain Committee
Current MembersMr L. Serema (Chairperson), Dr M. Chimbombi (Resigned on 06 October 2015) Mr B. Khumomatlhare (Appointed on 12 October 2015), Mr D. Mmile & Mr O. Kgotlafela
2. Finance, Audit and Risk Committee (FARC)
Current MembersMr M. Dube (Chairperson), Mr M. Mokgosana, Dr M. Chimbombi (Resigned on 06 October 2015), Mr B. Khumomatlhare (Appointed on 12 October 2015)
3. Human Resources & Remuneration Committee
Current MembersMs T. Modungwa (Resigned on 06 May 2015), Ms J. Maphorisa (Term ended 20 March 2015), Mr M. Mokgosana (Chairperson) & Mr G. Mosimaneotsile
4. Tender Committee
Current MembersMr L. Morakaladi (Chairperson), Ms J. Maphorisa (Term ended 20 March 2015) Mr G. Mosimaneotsile
Each of the above Committees operates in terms of a mandate approved by the Board. These mandates describe:• the extent of its powers;• the responsibility delegated to it;• its term;• its role and function;• procedure for reporting to the board; and• its authority to act.
At Board meetings, relevant minutes are submitted and the Chairperson of each Committee reports on the Committee’s activities.
Value Chain Committee
The primary objective of the Value Chain Committee is to assist the BMC Board in discharging its responsibili-ties, relative to exercising oversight on all matters relating to strategy implementation, governance, risk management and capabilities and human resource development; in particular as they concern the value chain comprising of Livestock Procurement, Opera-tions, Sales and Marketing, Distribution, and Compli-ance. The Committee monitors performance of Management on the annual business plan, as devolved from the Strategic Plan.
Finance, Audit and Risk Committee (FARC)
The FARC oversees issues relating to the development and management of financial and accounting informa-tion. In particular, the Committee assists the Board in its oversight role by managing the financial, opera-tional, business continuity and commercial risk facets of the Commission. In this regard, it is responsible for monitoring the development of the financial informa-tion, the efficiency of internal controls and risk management systems, the auditing of annual financial statements as carried out by the external auditors, as well as the independence of the said external auditors.
Board Committees
3

Human Resources & Remuneration Committee
The Human Resources & Remuneration Committee assists the BMC Board of Commissioners to discharge its responsibilities relative to monitoring Management’s implementation of the BMC Strategic Plan in relation to all matters concerning Human Resources at BMC. It periodically reviews reports from Management on significant changes to the organisational structure and makes recommendations to the Main Board.
Tender Committee
The Tender Committee is mandated to lend support and guidance on the BMC’s tendering and procure-ment processes. The key objective of this Committee is to ensure that the procurement process of the Commission is conducted in an ethical, transparent, and fair manner; in adherence to the principles of good corporate governance as contemplated in the King III Report on Corporate Governance. The Tender Committee adjudicates tenders of values exceeding Two Million and Five Hundred Thousand Pula (P2 500 000) up to Five Million Pula (P5 000 000). The Main Board adjudicates over tenders valued at P5 000 000 and above, on recommendation of the Board Tender Committee.
Board Committees | Continued
4

1. Management Executive Committee
The Executive Committee of BMC reports to the CEO and the Board. Its key role is to monitor performance of the distinct departments within the Commission and come up with ways for improvement of such perfor-mance. The Management Executive Committee is also tasked to ensure that BMC conducts its business in line with set standards and policies and ensures that the Organisational Strategy that the Commission has formulated is properly implemented.
2. Management Tender Committee
Chaired by the CEO, the Management Tender Committee (MTC) adjudicates all orders/tenders exceeding One Million Pula (P1 000 000) in value, up to Two Million and Five Hundred Thousand Pula (P2 500 000). MTC recommends tenders values at over P2 500 000 to the Board Tender Committee for adjudication. Management Tender Committee ensures that the procurement process of the Commission is conducted in an ethical, transparent, and fair manner; in adher-ence to the principles of good corporate governance.
3. Management Review
The BMC is ISO 9001:2008 and British Retail Consor-tium Global Standard for Food Safety Issue 6 certified. It is an important requirement of these standards to have a management review process, the objective of which is to review organisational performance against set objectives and the establishment of new or amended targets and objectives. Of importance for this review is to ensure that the operations of the Commission are conducted in such a manner, as to ensure that all departments adhere to the agreed service standards.
Directors Declarations of Interest
All Commissioners endeavor to avoid any situation of conflict of interest with the Commission. Potential conflicts can arise and therefore processes and proce-dures are in place requiring Commissioners to identify and declare any actual or potential conflict of interest. Any such notifications are required to be made by the Commissioners prior to, or at a Board meeting and all Commissioners have a duty to update the whole Board of any changes in circumstances. The above shall not apply in relation to a contract with the Commission for the delivery, sale or slaughter of livestock entered into by a member or his spouse in which the member or his spouse receives no preferential treatment over, or more advantageous terms than other members of the public.
Management Committees
5
Geographical Structure
LOBATSE OFFICEPrivate Bag 4, Lobatse, BotswanaTel: (+267) 5330321 / 5340000Fax: (+267) 5332228email: [email protected]
FRANCISTOWN OFFICEPrivate Bag 119, Francistown, Botswana,Tel: (267) 2414499Fax: (267) 2414427
MAUN OFFICEPrivate Bag 8, Maun, BotswanaTel: (267) 6862782Fax: (267) 6863562
UK OFFICEBMC (UK) Holdings LtdStuart House, QueensgateBritannia RoadWaltham CrossHertfordshire,EnglandEN8 7TFTel: +44(0)1992 807950Fax: +44(0)1992 807951
CAPETOWN OFFICETable Bay Cold Storage6 Auckland Street,Paarden EilandCape TownTel: 27 21 5088440Fax: 27 21 5115957
BOTSWANA ABATTOIRS AND PLANTSLobatse: Abattoir Tannery & CanneryFrancistown: AbattoirMaun: Abattoir
UNITED KINDOMLondon: Sales & Marketing
SOUTH AFRICACapetown: Cold Storage & ShippingDocumentationJohannesburg Sales Office
6

Group Structure
Botswana Meat Commission
BMC MEAT IMPORTED (PTY) LTDGuernesey Investments
MAINLINE CARRIERS (PTY) LTDGaborone, Property CompanyBMC Lobatse and Cannery
BMC Francistown
BMC Maun
LOBATSE LEATHER (PTY) LTDLobatse Holdings Company
ALLIED MEAT INSURANCE CO. LTDCayman Islands Marine Insurance
TABLE BAY COLD STORAGE (PTY) LTDCape Town Storage and Shipping
BMC (UK) HOLDINGS (PTY) LTDLondon, Sales and Storage
7
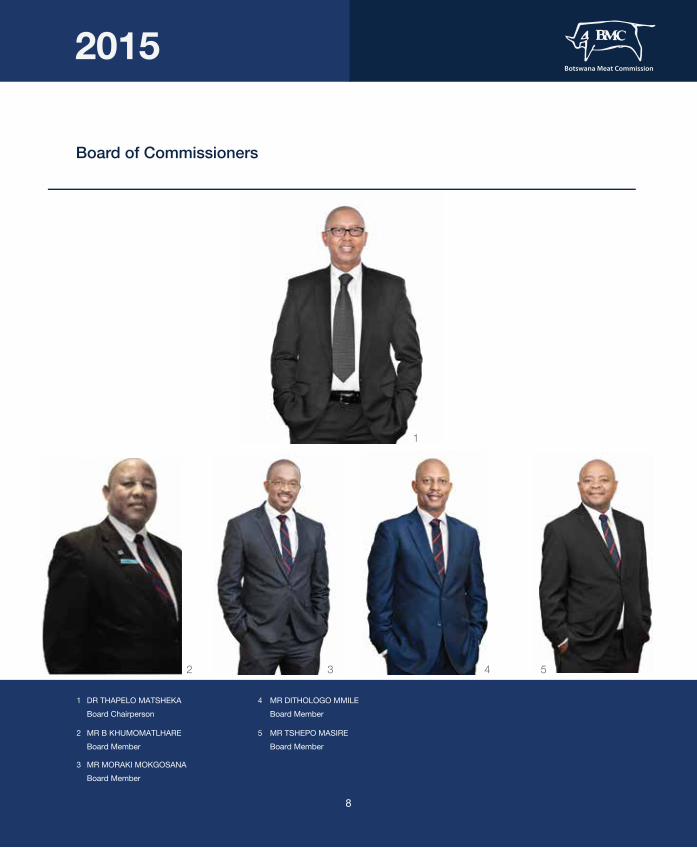
Board of Commissioners
1
2 3 4 5
DR THAPELO MATSHEKABoard Chairperson
MR TSHEPO MASIREBoard Member
MR B KHUMOMATLHAREBoard Member
MR MORAKI MOKGOSANABoard Member
MR DITHOLOGO MMILEBoard Member
1
2
4
5
3
8

Board of Commissioners | Continued
6
7
8
MR GODFREY MOSIMANEOTSILEBoard Member
MR LEGODILE SEREMABoard Member
MR LEONARD MORAKALADIBoard Member
MR MIKE DUBEBoard Member
MR ONKABETSE KGOTLAFELABoard Member
6 7 8
9
NOT IN PICTURE

Executive Management
1
2 3 4 5 6
1
2
4
5
3
DR AKOLANG R. TOMBALEChief Executive Officer
MR SHYAM GOTETIChief Financial Officer
DR. BOITUMELO MOGOME-MASEKOExecutive Manager Compliance
6
MS DITSAPELO R. MAKATIExecutive Manager Human Capital
MR KENNETH MAKUBATEExecutive Manager Livestock Procurement
DR STEPHEN GHANIEExecutive Manager Strategy, Projects & Innovations
10
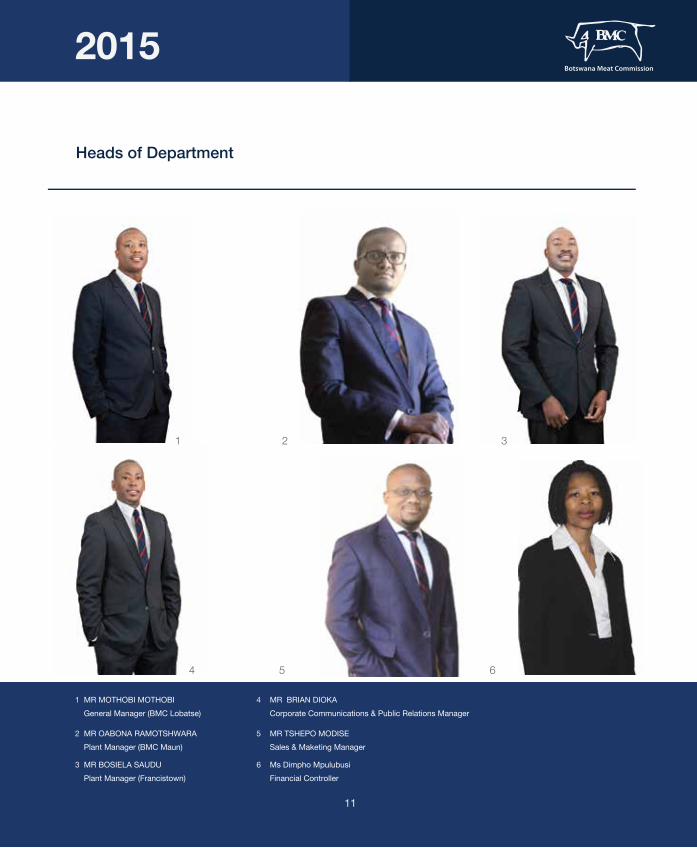
Heads of Department
1 2 3
4 5 6
1
2
4
5
3 6
MR MOTHOBI MOTHOBIGeneral Manager (BMC Lobatse)
MR OABONA RAMOTSHWARAPlant Manager (BMC Maun)
MR TSHEPO MODISESales & Maketing Manager
Ms Dimpho MpulubusiFinancial Controller
MR BOSIELA SAUDUPlant Manager (Francistown)
MR BRIAN DIOKACorporate Communications & Public Relations Manager
11

12

Board Chairman’s Statement
I present to you the Annual Report of the Botswana Meat Commission (BMC), for the financial year ended 31st December 2015. The BMC Board of Commission-ers is buoyant that information contained herein, is compliant to the ethos and global standards of corpo-rate governance, which are a guiding principle of how the Board applies its oversight commitment to the Commission – but also as a criterion of due diligence bade by your office. I also wish to assure your office that the operational and financial narrative detailed in this Annual Report depicts a true record of BMC’s performance in the year 2015, but also responds to strategic initiatives proposed in the preceding year of 2014.
The BMC Board of Commissioners is appreciative of Government’s efforts to support the business with resources. The notable event in 2015 remains the liquidity challenges incurred by the Commission, which were largely necessitated by external factors such as high-debts to commercial banks, non-compliance of the raw-material and deficient supply to BMC abattoirs. Your Government’s intervention totaling P 600 million cash injection to the Commission, kept the business afloat and minimized debt-exposure to commercial banks. However, what remains a challenge though, and also with glaring possibilities of further perplexing BMC operations even more - is non-compliancy of the availed stock for slaughter which have historically become deleterious to our efforts with BMC operations in Francistown and Maun.
In the year under-review, the Board of Commissioners remained resourced with skills-set to upkeep required governance structures, but also to carry-out its oversight mandate.
I wish to commend Dr Micus Chimbombi whose tenure with the Board ceased in September 2015 – for his noteworthy contributions as a Board Member and also his fabled service to the sector in its entirety. I should also applaud you and your Ministry’s resoluteness in appointing Messrs.’ Boipolelo Khumomatlhare and Tshepo Masire to the BMC Board of Commissioners to fortify its strategic mandate and responsibility of achieving intended results.
On behalf of the Board, I wish to express gratitude to the shareholder, cattle supplier stakeholders, our strategic resourcing partners, product consumers, BMC management and staff for their invaluable contri-butions and support to the Commission.
HONOURABLE PATRICK PULE RALOTSIA, MPMinister Of AgriculturePrivate Bag 003Gaborone
DR THAPELO MATSHEKABMC Board of Commissioners - Chairperson
13

14

Chief Executive Officer’s Review
The year ended 31 December 2015, records the mid-point of the five (5) year Strategic Plan devised by the Commission (BMC). Even though the reporting-period had notable events of its own, the Commission remains on course to recover from its loss making financial status
The 2012/17 Strategic Plan is focused on following strategic themes, which are very critical to ensuring that the Commission is guaranteed a recoverya. Value chain optimizationb. Diversification and partnering opportunitiesc. Financial restructuring and organization’s transformation
As at the end of December 2015, the Commission had reformed its cattle procurement and meat production strategy succinctly to the intents and objectives of a fully optimized BMC value chain. This meant that greater focus needed to be dedicated to buying-better and smartly, and with full appreciation of what the market requires. The in-between processes such as; (i) better managing of BMC stock at feedlots; (ii) better managing of feed required by such stock, (iii) ensuring compliance at all fronts – enabled cattle supply to all BMC abattoirs to improve at 3.9 percent year-on-year, reaching 149,709 cattle in 2015.
However the year’s events were unrelenting, especially given the official declaration of drought by Government in July 2015, and its obvious implications on cattle through-put as well as plant’s performance which aggregated 62 percent against the prescribed minimum utilization of 85 percent.
The prevalence of Measles continued to weigh heavily on meat production at all BMC abattoirs and subdued sales revenue. In the period under review Measles’ highest peak was recorded at 15.14 percent in May 2015 in Francis-town, whereas Lobatse plant’s highest was in the month of January 2015 at 13.55 percent. The inferences of Measles on meat production at the BMC, can no longer be underplayed nor ignored, given its impact on operational/ production costs. Just as in the preceding year, the Commission achieved yet another positive growth on its annual gross revenue by 3.6 percent year-on-year,
improving to P 1,213 Million from P 1,170 Million (declared in 2014). The referred financial record, though lower than the projected 2012/17 strategic plan target of P 1,331 Million for the year under review. It is evident that had we not been negatively affected by difficult climatic misfortunes, the target was indeed realistically within our reach. The Maun and Francis-town plants’ performance remained below par and continued to be loss making.
Maun Plant’s performance is negatively affected by the high value export market that would be able to take high value matured deboned primal cuts that are produced there. Instead the said products are sold in the local market that neither prefers deboned meat nor primal cuts. On the positive side Maun Plant generally achieves better carcass quality (CDM) weights which at times reach almost 250 Kilogram. Francistown Plant’s performance is more bedeviled by erratic cattle supply as well as the quality of the cattle availed for slaughter (which is dominantly below a CDM of 210 KG). The Commission however remains optimistic that the relisting the facility for European Market supply would perhaps spike better plant capacity usage.
In an effort to push on with the financial and opera-tional restructuring the Commission engaged a transactional advisor/consultant to develop a bespoke business model, value the enterprise, restructure the balance sheet as well as come up with mechanisms of raising cost effective financing of the Commission. The consultancy started their assignment on BMC, at a time where the business faced heightened liquidity challenges, due to its poor business model, but even more important worsening beef sub sector deficiencies such as poor animal husbandry leading poor quality of animals available for slaughter.The first phase of the consultancy recommendations, required for an exigent short-term plan on BMC’s working capital but also to enable the business to settle its debt/loan obligations which resulted in a P600 million re-capitalization by Government.
15

Chief Executive Officer’s Review
The second phase of the consultancy recommendation was to develop possible scenarios that the shareholder could adopt, to reform the Commission’s business model to make it more efficient and effective.
In achieving both the strategic initiatives for 2015 but also the principles of its core mandate, the Commis-sion also actively developed a robust stakeholder engagement plan, which resuscitated consultative platforms with both internal and external parties. The notable events for the year included Francistown Farmer’s Pitso in October 2015, planned update-sessions with strategic ministry heads (including ministers i.e. Agriculture; Finance and Development Planning; Trade and Industry etc.), Parliament’s Portfolio Committee on Agriculture, as well as the media. The commission believed that these platforms were crucial in providing clarity about the Commission, but also assuring about the path of the strategic plan. Also as part of the transformative obligation, to achieve optimal performance of the business, the Commission decided to re-assess its human capital needs with a view to reduce operational costs but also streamline processes.
In diversification and partnering opportunities, the Commission revised the sales strategy and will introduce family retail packages in the domestic market in the following year (2016), but also provide similar packs to external markets in subsequent years. This was informed by the market assessment later in the year that new opportunities existed in that front. Beyond that a holistic review of market-performances was done, which have assured that EU and Norway remained best and lucrative markets for primal cuts.
The market forecast, as the end of December 2015, also proved the same given the envisaged signing of the SADC Economic Partnership Agreement (EPA) which promises to unlock more trade opportunities especially for Botswana beef. It is against this backdrop of increasing supply-opportunities for more quality beef, that Management has identified and approached a few financial-providers which could better resource the beef value chain, and in the
process enable the cattle supply-market to improve throughput at the BMC. Such capacitation is more directed at the producer/farmer, that they should have funds/resources readily available to sustain supplying their stock to the BMC.
As part of the reformative journey guided by the 5 year strategic plan, the Commission maintained its higher compliance global-grading for the Lobatse and Francistown abattoirs, but also re-invested by improv-ing operational capacity at the Maun abattoir by 33 percent. With the latter, the Maun abattoir is now able to slaughter 130 cattle a day. The Lobatse facility invested in ensuring guaranteed supply of critical utilities such as water. The Commission approved the construction of a more than 1000 cubic meter water treatment plant at the Lobatse facility, together with all its associated civil works. This would ensure sustained supply of water for the abattoir, at times where supply is not guaranteed by Water Utilities (WUC). A similar project is being considered for the Maun abattoir.
I am assured that the 2012-17 strategic plan of the Commission, would surpass its core objectives but only if the beef value chain is restructured to correspond with current/market requirements. For their part, Board and Management, are determined to reform the Commission not only to be profit making but also to remain a sustainable and preferable off take market for Batswana cattle. The country would possibly have the best and distinct product (if better coordinated and developed), the BMC has laudable production processes of highest global standards, therefore the Board, Management and staff remain resolute, that with these collective strengths, the Commission is assured of recording an even better performance in the next year.
DR AKOLANG R. TOMBALEChief Executive Officer
16
COMPLIANCE
Botswana Meat Commission continued to adhere to stringent multiple standards of food safety, legality and quality and supply its high quality product to demanding market segment during 2015. Compliance to interna-tional customer requirements was a challenge especially due to dynamic certifiable standards and multiple audits and as a result BMC compliance protocol was aligned to the new editions of certifiable standards and customer requirements. Senior management commitment, site compliance, personnel, process and product control, allergen, supplier quality assurance, traceability, raw material authenticity, security, fraud and hazard analysis critical control points (HACCP) requirements cut across all disciplines.
European Union certification
The Lobatse plant continued to be listed to supply the European Union (EU) and continued to export to the lucrative EU market during 2015. Francistown plant due to its close proximity (less than ten kilometers) from the protection zone at the time of the 2013 EU audit could not export.
The Department of Veterinary Services as the regulatory authority at Commission export facilities continued to monitor and verify implementation of EU legislative requirements and certified that beef imports from Botswana meet the standards of production for EU member states.
British Retail Consortium certification
BMC Lobatse and Francistown export plants were audited by international renowned certification bodies and maintained “Grade A” against the internationally recognized British Retail Consortium (BRC) Global Standard for Food Safety (Issue 6) Standard.
•
•
•
•
•
17

Compliance | Continued
The BRC standard is one of the Global Food Safety Initiative (GFSI) benchmarked food safety standards required as a minimum for food manufactures globally that measures ethical and fair practices, animal welfare, technical and operational factors in food production.
ISO 9001 certification
Botswana Meat Commission was audited and granted a three years (2014 to 2017) multi-sited certification against ISO 9001:2008 which emphasizes on continual improve-ment i.e. customer focus, leadership skills, involvement of people and stakeholders (communication) and factual approach to decision making.BMC Management understand continual improvement in a business context and used it to improve overall business performance and all facilities including head office continues to operate to the requirements of this standard. HACCP certification
BMC abattoirs and manufacturing facilities in Lobatse, Francistown and Canneries maintained certification against the Hazard Analysis and Critical Control points (HACCP), South African National Services (SANS) 10330:2007 standard. Although not certified the Maun plant complies with BMC Technical Standards which are benchmarked against an HACCP system of preventative approach to food safety.
Customer requirements
Over and above the regulatory standards and audits mentioned above the Commission had to comply with specific protocol for some customers e.g. McDonald’s and Woolworths who conducted independent audits of our facilities during the year.
• McDonalds
Lobatse and Francistown plants successfully retained their certification to supply red meat products to McDonald’s fast food chain in South Africa. The McDonald’s audit conducted by SAI Global (EFSIS) covers hygiene, quality of the product, animal health and welfare.
• Woolworths
Botswana Meat Commission Cannery is a primary supplier for pet food to Woolworths while the red meat processing plants are secondary suppliers to the food chain in South Africa. All facilities were audited and approved to continue supply.
Laboratory accreditation
BMC in-house laboratory embarked on a strategic initiative to accredit its operations against ISO/IEC 17025:2005 standard for testing and calibration laborato-ries. This initiative will provide valuable component for due diligence, defense and reduce reliance on external suppliers. The laboratory successfully carried out method development and validation and participated in proficiency schemes with local, regional and international renowned bodies.
During 2014, gap analysis by Botswana National Veterinary Services and application for accreditation and document review were carried out by Southern Africa Development Community Accreditation System (SADCAS) in preparation for a full accreditation audit in 2015. All findings identified were successfully addressed and evidence submitted to the accreditation body.
Initial assessment was conducted in July 2015 with all twelve (12) tests earmarked for accreditation recom-mended for accreditation pending closure of identified non-conformities.
18

OPERATIONS
Annual productionFigure 1 below shows the monthly comparative throughput between the plants. Lobatse processed the largest throughput when compared with Francis-town and Maun. Over 80% of Lobatse throughput made up of European Union compliant cattle, which also earned it the highest revenue per head of cattle. Lobatse produced 16.656 tons of boneless beef, Francistown 3.960 tons, and Maun 2.656 tons.
Francistown also produced for 9,474 tons of bone-in forequarter, while Maun produced 0.167 tonnes.
When considering the slaughter numbers, plant capac-ity utilization was 78.8%, 29.7%, and 76.6% at Lobatse, Francistown and Maun respectively. Both Lobatse and Maun were close to the optimum utiliza-tion target of 85%, while Francistown continued to struggle with throughput. In terms of value of production, Maun produced the lowest value because of market access constraints for beef derived from cattle reared in Foot-and-Mouth Disease areas.
The canning plant production primary focus was on supplying the Government of Botswana stewed steak contract of 85,500 cartons. By July 2016, 73.34% of the contract had been supplied. Other products produced were corned meat, corned beef, and pet food.
•
•
•
•
•
19

Operations | Continued
Lobatse, Francistown and Maun Plant Slaughter for 2015
FIGURE 1
Jan Feb Mar Apr May Jun Jul Aug Sep Oct Nov Dec2089 11705 12515 11157 10554 13820 8288 6539 8908 7454 6570 43962210
Lobatse
Tonn
age
F/ town 1854 5124 3293 2833 3521 389 1791 1372 882 1125 452733Maun 1629 1923 1724 1787 1993 835 0 1620 2323 2147 1344
0
1000
2000
3000
4000
5000
6000
7000
8000
9000
10000
11000
12000
13000
20

Figure 2 below shows the comparative cold dressed mass for cattle slaughtered between the three abattoirs. • Maun slaughtered the largest cattle during the first part of the year before the two months conveyor upgrade shutdown from late July. The heavier, grass reared cattle were sourced from mainly the Kareng veterinary exten sions. The CDM ranged between 229 and 248 kg. After the shutdown in August, when the effects of drought manifested, slaughter cattle were much lighter and this lowered the CDM.• The feedlot factor helped maintain a good slaughter weight at Lobatse. The average CDM ranged between 212 and 230 kg. A higher CDM was possible had all the feeders performed well and the direct-from-veld cattle prepared prior to marketing.• Francistown sources cattle almost wholly from the range where the cattle were lighter than were for Lobatse and Maun.
180
185
190
200
205
210
215
220
225
230
235
240
244
250
255
Carcass Cold Dressed Mass (CDM)
Lobatse, Francistown and Maun Monthly Average CDM For 2015
FIGURE 2
Jan Feb Mar Apr May Jun Jul Aug Sep Oct Nov Dec230 222 212 217 216 222 225 223 222 228 226 217203
LobatseF/ town 203 201 209 207 207 208 189 209 200 195
238Maun 233 234 229 248 241 232 - 203 193 184223227
21

FIGURE 3
All the plants exceed the global benchmark boneless yield target of 69%. At all plants, there are complementary initiatives to maximize harvesting of meat. These include daily monitoring and reporting of production value and production of sliced bones for sale. Figure 3 below shows the high boneless yields achieved by each deboning plant.
0
10
20
30
40
50
60
70
80
Boneless meat yield
Measles continued to menace the cattle industry. The high incidence did not only affect the market value of affected carcasses, but also bottlenecked the production operation as chiller capacity for carcasses and boxed beef could not be utilized efficiently. The special treatment applied to the affected meat increased operating cost for the Commission.
• Figure 4 shows measles peaking to 15.14% in May at Francistown abattoir before modestly reducing.• Lobatse recorded the highest measles prevalence in January with a second lower peak in April.• Generally, cattle sourced from permanently or regularly inhabited areas produced the bulk of the affected carcasses.
Measles
Lobatse, Francistown and Maun Boneless Meat Yield % for 2015
Maun palnt was not in production in the month of August, due to scheduled plant upgrades
Jan Feb Mar Apr May Jun Jul Aug Sep Oct Nov Dec70.82 69.21 69.03 69.27 68.83 67.61 69.15 69.68 69.35 69.28 69.27 69.55
70.2667
70.18Lobatse
Francistown 69.37 70.18 71.00 70.12 69.86 69.63 69.00 69.27 71.62 69.1570Maun 69 69 70 69.5 69.6 68 - 72.5 69 68
22

23
LIVESTOCK PROCUREMENT
Performance Overview
Achievements
Cattle supply performance was generally good during the 1st and 2nd quarter of the year, especially for Lobatse where throughput targets were exceeded. The third quarter started on a low note mainly due to shortage of water, but in terms of cattle availability this was well and managed. Quarter 4 was fair on cattle supply but was immensely affected by challenges of water shortage and drought.
Cattle supply for Francistown started to slow down in the second quarter and this challenge continued throughout the course of the year. Livestock Procurement continued to engage with farmers around the Francistown Area as part of stakeholder engagement to encourage farmers to bring cattle to the Francistown abattoir.
Maun plant did not do well because of low slaughter numbers in January as a result of frequent plant breakdown, and FMD outbreak in February and March. The scheduled plant upgrades for Maun in August 2015, negatively impacted on slaughter-targets in Q3, since the plant was not in production. However, the performance drastically improved after the re-opening of the plant to achieve a now improved slaughter target of 110 cattle a day.
Challenges
Drought impacted negatively on cattle quality and weights
Plant down-time caused by erratic water supply, especially for Lobatse and Maun plants – affected sched-uled cattle supply
Liquidity challenges of the Commission, also limited procurement of targeted cattle numbers
Concerning mortality-rates were experienced at feedlots mainly due to inconstant feeding regime.
•
•
•
•
•
•
•

0
5, 000
10, 000
15, 000
20, 000
Throughput Perfomance - All Plants Combined
Jan-15 Feb-15 Mar-15 Apr-15 May-15 Jun-15 Jul-15 Aug-15 Sep-15 Oct-15 Nov-15 Dec-156,704 13,600 16,800 17,000 19,300 19,480 19,300 17,500 16,290 15,290 15,200 13,420
6,1925,032Forecast
Actual 15,406 19,562 16,174 15,175 19,133 12,512 8,330 11,900 10,659 9,843
Performance Against Strategic Objectives 2015
Total throughput budget for the 3 plants for Q1 – Q4 is 146,064 cattle.
Quarter 1 (Q1) target kill = 37,104 cattle Achieved 40,000 Quarter 2 (Q2) target kill = 55,780 cattle Achieved 50,482 Quarter 3 (Q3) target kill = 54, 980 cattle Achieved 32,533Quarter 4 (Q4) target kill = 43,910 cattle Achieved 26,694
Deliver Cattle Supply to BMC of 189, 974 Head by end of Year
24
•
••••

Throughput Perfomance - Lobatse
Performance Against Strategic Objectives 2015
EU compliant Cattle Supply to Lobatse plant
Though throughput was significantly low in January, it however improved in subsequent months.Cumulative EU throughput achieved at year end (December 2015) was 103,997 against a budget of 124,044.
Q1 was exceeded since 24,252 cattle were slaughtered against budget of 20,894.Q2 was exceeded since 32,400 cattle were slaughtered against budget of 30,900.Q3 not realized since 23, 735 cattle were slaughtered against budget of 31,900.Q4 not realized since 18, 421 cattle were slaughtered against budget of 30, 100
Cattle Supply to Lobatse Plant of 124, 044 Heads by end of Year
2,000
4,000
0
8,000
10,000
12,000
14,000
16,000
6,000
Hea
d/ M
onth
Jan- 15 Feb- 15 Mar- 15 Apr- 15 May- 15 Jun- 15 Jul- 15 Aug- 15 Sep- 15Oct- 15 Nov- 15 Dec- 15
Forecast Actual
25
••
••••

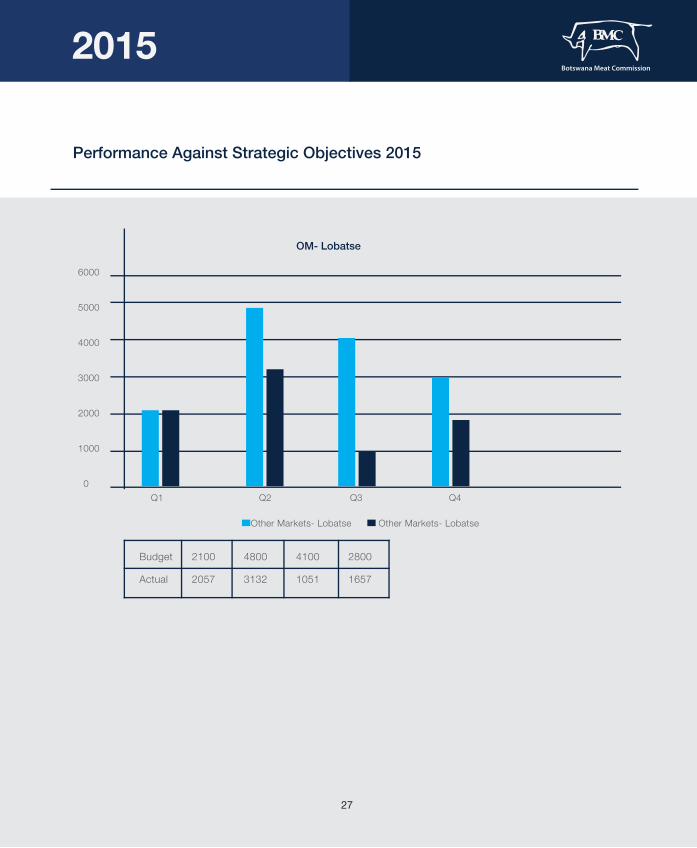
Other Markets Cattle Supply to Lobatse Plant
Cattle supply to Lobatse plant was achieved as follows:Q1 Budget 2,100 cattle, Actual 2,057 Q2 Budget 4,800 cattle, Actual 3,132 Q3 Budget 4,100 cattle, Actual 1,051 Q4 Budget 2,800 cattle, Actual 1,657
Performance Against Strategic Objectives 2015
Jan Feb Mar Apr May Jun Jul Aug Sep Oct Nov Dec
3894 8000
9000 10300
10300
10300
10300
10300
10500
9500
9500
8500
3993
1974
Budget
Actual 1113
11165
10361
12242
6712
6057
9797 7906 6171 8606
0
2000
4000
6000
8000
10 000
12 000
14 000
Eu Slaughter - Lobatse Plant
Hea
d/ M
onth
Full Kill- LobatseFull Kill- Lobatse
26
••••
27
Performance Against Strategic Objectives 2015
OM- Lobatse
0
1000
2000
3000
4000
5000
6000
Q1 Q2 Q3 Q4
Other Markets- Lobatse Other Markets- Lobatse
Budget 2100 4800 4100 2800
Actual 2057 3132 1051 1657
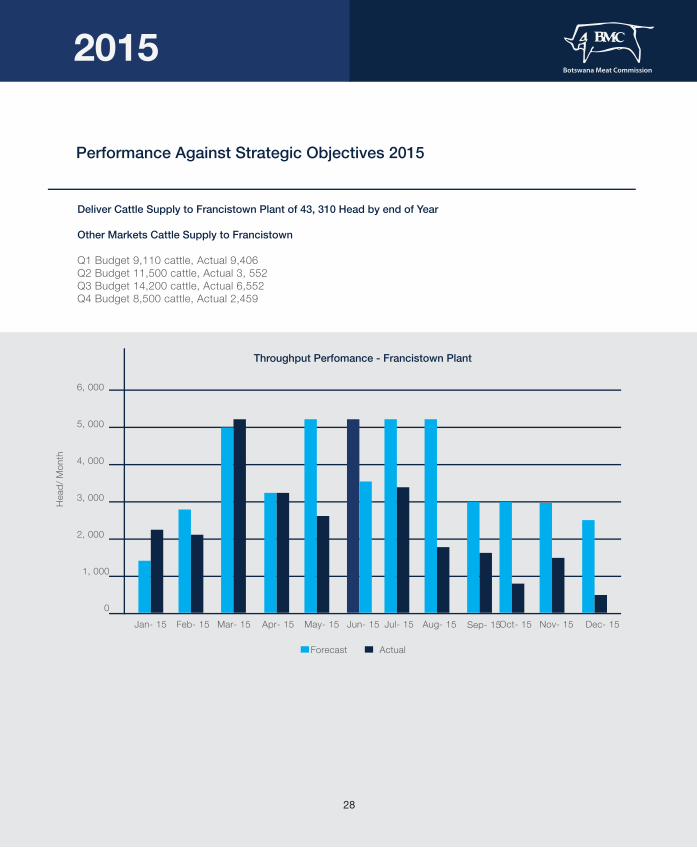
Deliver Cattle Supply to Francistown Plant of 43, 310 Head by end of Year
Other Markets Cattle Supply to Francistown
Q1 Budget 9,110 cattle, Actual 9,406 Q2 Budget 11,500 cattle, Actual 3, 552Q3 Budget 14,200 cattle, Actual 6,552Q4 Budget 8,500 cattle, Actual 2,459
Performance Against Strategic Objectives 2015
0
1, 000
2, 000
3, 000
4, 000
Jan- 15 Feb- 15 Mar- 15 Apr- 15 May- 15 Jun- 15 Jul- 15 Aug- 15 Sep- 15Oct- 15 Nov- 15 Dec- 15
5, 000
6, 000
Throughput Perfomance - Francistown Plant
Forecast
Hea
d/ M
onth
Actual
28
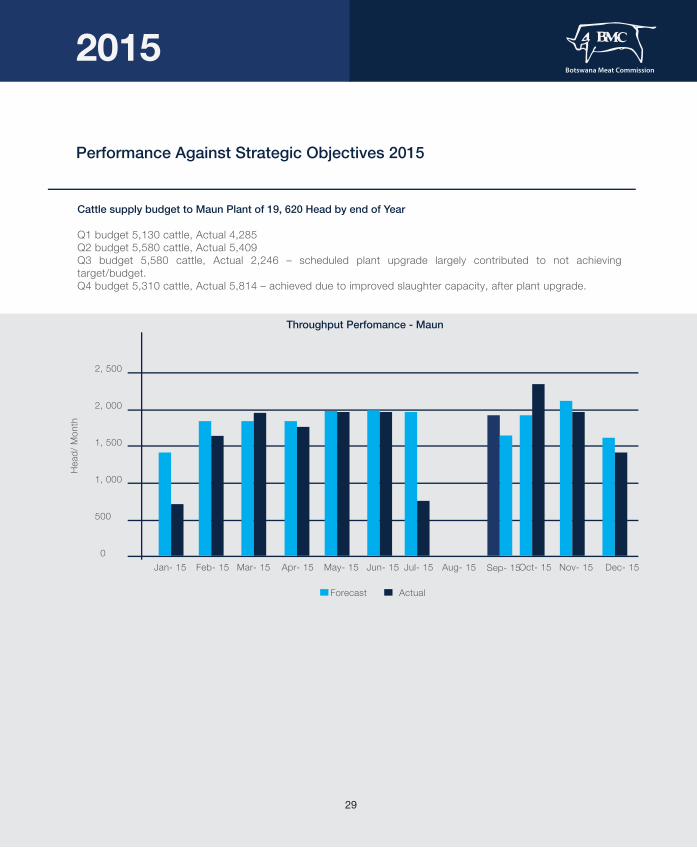
Cattle supply budget to Maun Plant of 19, 620 Head by end of Year
Q1 budget 5,130 cattle, Actual 4,285 Q2 budget 5,580 cattle, Actual 5,409 Q3 budget 5,580 cattle, Actual 2,246 – scheduled plant upgrade largely contributed to not achieving target/budget.Q4 budget 5,310 cattle, Actual 5,814 – achieved due to improved slaughter capacity, after plant upgrade.
Performance Against Strategic Objectives 2015
0
500
1, 000
1, 500
2, 000
2, 500
Throughput Perfomance - Maun
Hea
d/ M
onth
Jan- 15 Feb- 15 Mar- 15 Apr- 15 May- 15 Jun- 15 Jul- 15 Aug- 15 Sep- 15Oct- 15 Nov- 15 Dec- 15
Forecast Actual
29

30
HUMAN CAPITAL
The Human capital of the Commission remains impor-tant and material investments are always pursued on this invaluable asset of the organization.
The organization stand by its commitment to periodi-cally conduct employee satisfaction surveys to gauge and monitor the climate and come up with initiatives to address the findings. The last survey was carried out in 2014 and the organisation will carry out the next survey in 2016 to gauge changes in staff morale, engagement and welfare over a two-year cycle. As at last climate survey, the Commission registered a satisfaction index of 50%.
Through its European sales and marketing agents, Global Protein Suppliers (GPS), the Commission engaged the services of GPS personnel in its produc-tion operations in order to scale up skill transfer to its locally based staff. In addition, to date, two staff members of the Commission have been seconded to its subsidiary businesses in Cape Town and the United Kingdom, again with the milestone of enhancing the capacity of its local human capital. The year 2015 saw the recruitment of Executive management in areas of Human Capital and livestock procurement, as well as establishment of General Manager role within Lobatse plant for efficient running of operations. The job incumbent for this latter role of General Manager was filled towards the end of the period under review.
Still during the year under review, the Commission invested in the development of its top tier leadership via development opportunities in the Investment in Excellence programme. This six-day programme increased awareness on the significance of key competencies of leading the self, others and the organisation as a whole within the employees who attended this course.
•
•
•
•
•
•
•
Management and Botswana Meat Industry Workers Union continue to engage in dialogue in order to ensure good human relations governance. A total of group joint forum meetings exceeding six were held in 2015 to discuss issues of concern which include human capital employee handbook review and memorandum of agreement revision. Both these documents will be disbursed to staff in quarter one of the next review period. The Commission engaged an external consultant in order to carry out a work-study and productivity review during the period May to August 2015. This was part of the organisations endeavor to benchmark its processes and establish those fit for purpose and be aligned to industry trends and standard. Good lessons were drawn from this study and the organisation continue to review its operations in order to implement the recommendations of this study.
During the period under review, the need to adopt a turnaround strategy of restructuring the operations of the Commission was established, the result of which was a decision to right size the Commission. This exercise started in 2015 through dialogue with key stakeholders in Botswana Meat Industry Workers Union and the employ-ees in general. This restructuring is anticipated to end in quarter one of the next review period
Human Capital | Continued
31

2015A n n u a l R e p o r t
Stakeholder Relations
32

In the period under review, especially at the start of the first quarter, relations between the Commission and varied stakeholders had plummeted, owing to concerns around the liquidity of the BMC, but also re-ignited somewhat astray debates on ending the BMC monopoly.
I. Stakeholder RelationsBMC had to then strengthen, with resources, its Corporate Communication and Public Relations function to better manage relationships with stakeholders such as farmers and their amalgamations, feed producers, the legislative, Government, media and the general populace. To effectively debut its stakeholder relations strategy, the media was engaged through press conferences, media-owners platform, orchestrated print and broadcast interviews and statements; to detail the liquidity concerns as well as the recovery-plan, on the same, developed by the BMC.
The stakeholder engagement plan also provided for constant and consistent consultation with cattle-supplier stakeholders through workshop presentation at the annual conference of the Botswana National Beef Producers Union, farmer’s field day events (Sandveld, Southern, Gantsi), the first Francistown Baruakgomo Pitso, kgotla addresses in varied villages, just to mention a few. Members of the legislative were contacted through a detailed presentation by the Honorable Minister, to rebut fears that BMC was insolvent – but also to bring them into his confidence, that the BMC recovery strategy had ensued. Other engagements opportunities created by the BMC stakeholder plan included arranged tours to BMC facilities, by varied members of the cabinet and legislative, and more importantly that of the Parliament Committee of Agriculture. By the year-end, relations with targeted stakeholders had improved, and BMC was profiled even better in the public domain. The Corporate Communications and Public Relations function, intends to sustain these vital relations in subsequent years, through developing and implementing corporate frameworks which are linked to the strategic direction of the business.
II. Corporate Social Investment The pith of giving back to the community, is etched in the BMC corporate value - “Caring for our People” - and this has anchored the business to share some of its success in 2015, even with those that do not directly benefit from its operational proceeds. In the period under review, BMC responded to ruinous adversities endured by communi-ties in the Gantsi and Bobirwa localities, who were affected by flash-storms. BMC donated canned food hampers to a combined total of 600 families, of the referred localities. The Commission also sponsored and donated to the annual Lobatse International Beef Festival; Gantsi Meat Festival; construction of cattle-kraals at the Serowe District Show; dedicatory events of the impending 50th independence anniversary; national sporting events, just to mention a few.
As part of the intrinsic role of BMC in national development, in the period under review, BMC allowed for educa-tional and familiarization tours of its abattoirs, by the schooling fraternity, members of the disciplined forces, varied heads of foreign missions to Botswana and also private business to benchmark on the operational processes of the company. BMC intends to continually contribute to the socio-economic developments of Botswana, and has developed a Donations Policy, to better guide and implement its investment role in all communities.
Stakeholder Relations
33

2015A n n u a l R e p o r t
Sales & Marketing
34

International Overview
2015 was a challenging year for the BMC as all the key global markets were under stresses for various reasons and where protein prices started the year well but overall went into significant decline. The main export markets of the BMC also were depressed and the cattle prices and beef prices across all our key markets fell overall.
However, applying our strategic marketing plan and through a concerted and focused effort, the Commission’s Sales and Marketing Team actually grew returns and realizations per animal for the third consecutive year.In a world that is largely in recession or where GDP’s are slowing down, we consider this to be a good perfor-mance.
International Overview – Factors Affecting Global Markets
• The largest exporter of beef globally is Brazil and the South American continent.• Mercosur, ‘the market of the south’ as the region represents itself, is home to a herd in excess of 270 million cattle and Brazil accounts for in-excess of 200 million • The USA has a cattle herd of circa 90 million, China 100 Million, the EU 88 Million and so on……. • What is clear is that Botswana, with circa 2.5 million cattle have to make sure we stand tall to be seen and heard in this world of global giants• Beef consumption in the developed world is largely stagnant• In the developing world, which has been the powerhouse of driving global protein consumption, stresses and strains are developing.• The key BRICS nations have challenges ranging from economic slowdowns, to the collapse of the oil price and falling GDP’s• FAO’s Agricultural Outlook 2015-2024 sights a period where global grain prices will fall and therefore, protein prices will fall• The challenge for the BMC in 2015 and forward will be to maximise market return in a global market where prices are softening.
The UK Market
Throughout 2015 the UK market, as with the whole of Europe, did not show any growth in GDP and inflation remained at circa zero. The market had an excess of cattle and beef supplies remained high from the Easter trading period through to the year end.This made our marketing efforts in the UK particularly competitive and we maintained our strategy of developing end user customers in the niche, premium sector.
Sales & Marketing
35
Norway Market
The Norwegian market, for the 2015 period was depressed. There was significant overstocking of beef created by the excessive import of German carcasses for deboning which negatively impacted the market. This overstocked positon also affected the domestic cattle price.
Crude Oil prices across the year fell significantly and as Norway is largely an Oil economy this had a significant detrimental effect on the country and employment.
Nortura
Nortura, the Norwegian Farmers Co-operative continued to be our key partner within the market place. Working with Nortura, BMC Beef was a regular feature within the largest retailers across the country.
BMC beef has become recognized as a high quality, consistent and flavorsome product by Norwegian consumers.
EU Market
The EU market remained a difficult market with such countries as Greece, Spain and Portugal all still struggling to come to terms with austerity measures and where the countries fiscal status remained under pressure. Therefore, our strategy across the EU was not to be over reliant on a single market channel but to spread our beef products across many countries and lower our risk in any single market. BMC Beef can be found in 17 of the EU countries on a regular basis with key focus on Italy, Germany, Holland and Eastern European countries such as the Czech Republic.
We held Trade/Industry days with the assistance of the German Embassy in Berlin and have developed business with the German retailer Edeka.
RSA Market
South Africa has always been a significant trading partner for the product we produce that is not EU eligible. However, as is well documented, the South African economy is going through turbulent times and this resulted, in 2015, in a significant loss of value in the Rand compared to the Pula. This FX shift was of a great detriment to our export returns and although we actually pushed our prices up in South Africa, our actual net realisations suffered and declined.
The strategy for 2016 is too reduce volumes supplied to South Africa and push prices upwards on the material we do send.
Sales & Marketing | Continued
36
Sales & Marketing | Continued
37
Overall Sales and Marketing Performance
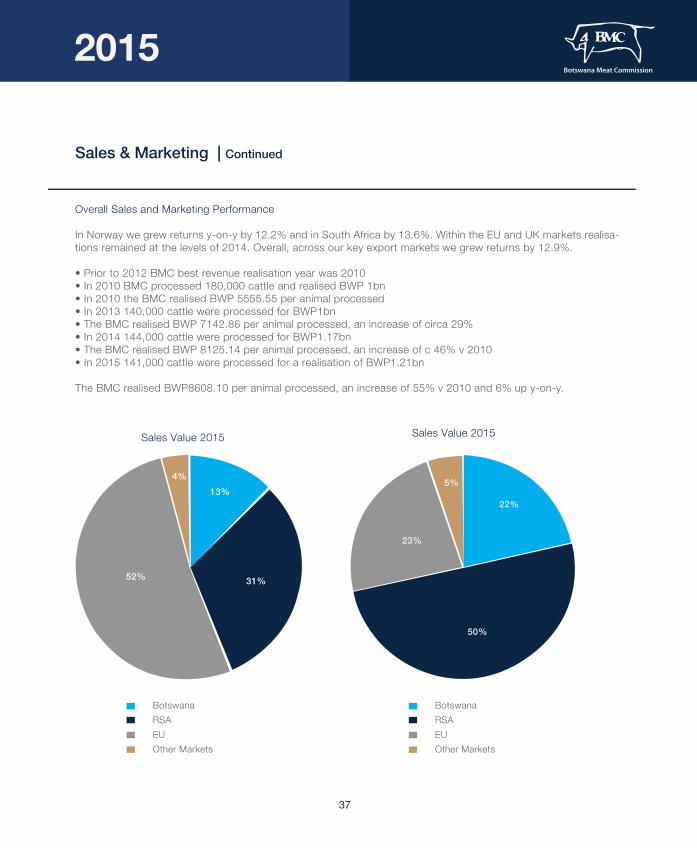
In Norway we grew returns y-on-y by 12.2% and in South Africa by 13.6%. Within the EU and UK markets realisa-tions remained at the levels of 2014. Overall, across our key export markets we grew returns by 12.9%.
• Prior to 2012 BMC best revenue realisation year was 2010• In 2010 BMC processed 180,000 cattle and realised BWP 1bn• In 2010 the BMC realised BWP 5555.55 per animal processed• In 2013 140,000 cattle were processed for BWP1bn• The BMC realised BWP 7142.86 per animal processed, an increase of circa 29%• In 2014 144,000 cattle were processed for BWP1.17bn• The BMC realised BWP 8125.14 per animal processed, an increase of c 46% v 2010• In 2015 141,000 cattle were processed for a realisation of BWP1.21bn
The BMC realised BWP8608.10 per animal processed, an increase of 55% v 2010 and 6% up y-on-y.
4%13%
31%52%
Sales Value 2015 Sales Value 2015
5%
22%
50%
23%
BotswanaRSAEUOther Markets
BotswanaRSAEUOther Markets

EU Market
The EU market remained a difficult market with such countries as Greece, Spain and Portugal all still struggling to come to terms with austerity measures and where the countries fiscal status remained under pressure. Therefore, our strategy across the EU was not to be over reliant on a single market channel but to spread our beef products across many countries and lower our risk in any single market. BMC Beef can be found in 17 of the EU countries on a regular basis with key focus on Italy, Germany, Holland and Eastern European countries such as the Czech Republic.We held Trade/Industry days with the assistance of the German Embassy in Berlin and have developed business with the German retailer Edeka.
RSA Market
South Africa has always been a significant trading partner for the product we produce that is not EU eligible. However, as is well documented, the South African economy is going through turbulent times and this resulted, in 2015, in a significant loss of value in the Rand compared to the Pula. This FX shift was of a great detriment to our export returns and although we actually pushed our prices up in South Africa, our actual net realisations suffered and declined.
Sales & Marketing | Continued
500
480
460
440
420
400
380
360
3402013 2014 2015 2016
Cen
t/ Kg
DW
Cattle Prices
UK/ Steers/ R3 EU 15 Average/ Steers/ R3Ireland/ Steers/ R3 Poland/ Steers/ R3
38

The strategy for 2016 is too reduce volumes supplied to South Africa and push prices upwards on the material we do send.
Overall Sales and Marketing Performance
In Norway we grew returns y-on-y by 12.2% and in South Africa by 13.6%. Within the EU and UK markets realisa-tions remained at the levels of 2014. Overall, across our key export markets we grew returns by 12.9%.
• Prior to 2012 BMC best revenue realisation year was 2010• In 2010 BMC processed 180,000 cattle and realised BWP 1bn• In 2010 the BMC realised BWP 5555.55 per animal processed• In 2013 140,000 cattle were processed for BWP1bn• The BMC realised BWP 7142.86 per animal processed, an increase of circa 29%• In 2014 144,000 cattle were processed for BWP1.17bn• The BMC realised BWP 8125.14 per animal processed, an increase of c 46% v 2010• In 2015 141,000 cattle were processed for a realisation of BWP1.21bn
The BMC realised BWP8608.10 per animal processed, an increase of 55% v 2010 and 6% up y-on-y.
Sales & Marketing | Continued
39

Notes
2015A n n u a l R e p o r t
!

2015A n n u a l R e p o r t
Consolidated andSeparate FinancialStatements31 December 2015
42

General Information
The Organisation
Botswana Meat Commission ("BMC") is a Parastatal and was established in 1965 to promote the development of the country’s livestock industry and the sale of the country’s beef and related products globally. Its headquarters are in Lobatse. The premises are an integrated complex housing an abattoir, cannery and by-products plant as well as a tannery. Besides owning three abattoirs in Botswana, BMC has cold storage facilities in South Africa with marketing subsidiaries in the United Kingdom, Germany and South Africa.
Commissioners
Dr T. Matsheka ChairpersonDr M. C. Chimbombi Term ended. Reappointed on 1 April 2015. Resigned on 6 October 2015L. Morakaladi Term ended. Reappointed on 1 April 2015B. Khumomatlhare Appointed on 12 October 2015T. Modungwa Term ended. Reappointed on 1 April 2015 - Resigned on 6 May 2015L. Serema Term ended. Reappointed on 1 April 2015 O. Kgotlafela Appointed on 1 April 2014G. Mosimaneotsile Appointed on 1 April 2014M. Mokgosana Appointed on 1 April 2014 D. Mmile Appointed on 1 April 2014M. Dube Appointed on 1 April 2014T. Masire Appointed on 1 April 2014
Executive Management
Dr Akolang R. Tombale Chief Executive OfficerS. Goteti Chief Financial OfficerDr S. Ghanie EXCO, Strategy, Projects and InnovationR. D. Makati EXCO, Human Capital. Appointed 16 February 2015 Dr Mogome-Maseko EXCO, ComplianceK. Makubate EXCO, Livestock Procurement. Appointed 17 August 2015T. R. Nape Board Secretary
Registered Office
Plot 6211 Khama AvenueLobatse
Auditors
Deloitte & ToucheP O Box 778Gaborone
Bankers
Barclays Bank of Botswana LimitedFirst National Bank of Botswana LimitedStandard Bank South Africa LimitedStanbic Bank Botswana LimitedStandard Chartered Bank Botswana LimitedStandard Bank Plc LondonBancABC LimitedNedBank South Africa Limited
31 December 2015
43

CONTENTSCommissioners' responsibility statementand approval of the financial statements
Independent auditor's report
Statements of comprehensive income
Statements of financial position
Statements of cash flows
Statements of changes in reserves
Group accounting policies
Notes to the consolidated and separatefinancial statements
68 - 92
56 - 67
54 - 55
53
51 - 52
49 - 50
47 - 48
45 - 46
44

Commissioner’s ResponsibilityStatement And Approval Of The Financial Statements
Commissioners' Responsibility Statement
The Commissioners are responsible for the preparation and fair presentation of the consolidated and separate financial statements of Botswana Meat Commission ("the Group and Commission"), comprising the statements of financial position as at 31 December 2015, and the statements of comprehensive income, changes in reserves and cash flows for the year then ended, and a summary of significant accounting policies and other explanatory notes in accordance with International Financial Reporting Standards (“IFRS”) and in the manner required by the Botswana Meat Commission Act (Chapter 74:04) (as amended).
The Commissioners are required by the Botswana Meat Commission Act (Chapter 74:04) (as amended), to maintain adequate accounting records and are responsible for the content and integrity of the financial information included in this report. It is their responsibility to ensure that the financial statements fairly present the state of affairs of the Group and Commission as at the end of the financial year and the results of their operations and cash flows for the year then ended, in conformity with IFRS.
The Commissioners' responsibility includes: designing, implementing and maintaining internal control relevant to the preparation and fair presentation of these financial statements that are free from material misstatement, whether due to fraud or error; selecting and applying appropriate accounting policies; and making accounting estimates that are reasonable in the circumstances.
The consolidated and separate financial statements are prepared in accordance with IFRS and are based upon appropriate accounting policies consistently applied and supported by reasonable and prudent judgements and estimates. The Commissioners' responsibility also includes maintaining adequate accounting records and an effective system of risk management.
The Commissioners acknowledge that they are ultimately responsible for the system of internal financial control established by the Group and place considerable importance on maintaining a strong control environment. To enable the commissioners to meet these responsibilities, the Board sets standards for internal control aimed at reducing the risk of error or loss in a cost effective manner. The standards include the proper delegation of responsibilities within a clearly defined framework, effective accounting procedures and adequate segregation of duties to ensure an acceptable level of risk. These controls are monitored throughout the Group and all employees are required to maintain the highest ethical standards in ensuring the Group's business is conducted in a manner that in all reasonable circumstances is above reproach. The focus of risk management in the Group is on identifying, assessing, managing and monitoring all known forms of risk across the Group. While operating risk cannot be fully eliminated, the Group endeavours to minimise it by ensuring that appropriate infrastructure, controls, systems and ethical behaviour are applied and managed within predetermined procedures and constraints.
The Commissioners are of the opinion, based on the information and explanations given by management, that the system of internal control provides reasonable assurance that the financial records may be relied on for the preparation of the annual financial statements. However, any system of internal financial control can provide only reasonable, and not absolute, assurance against material misstatement or loss. The Board is primarily responsible for the financial affairs of the Group.
31 December 2015
45

Commissioner’s ResponsibilityStatement And Approval Of The Financial Statements | Continued
The Group and Commission have reported a surplus of P337 million and P332 million, respectively (2014: a deficit of P14 million and P21 million, respectively), and their accumulated losses amounted to P581 million and P591 million, respectively (2014: P889 million and P893 million respectively). The going concern of the Group and Commission is dependent on the initiatives disclosed in note 25 of the financial statements. The Government of Botswana has committed to continue offering financial support to the Group and Commission and the Commis-sioners believe that the going concern principle is an appropriate basis for preparation of the financial statements.
The external auditors are responsible for independently reviewing and reporting on the consolidated and separate financial statements. The financial statements have been examined by the Group's external auditors and their report is presented on page 4.
Disclosure of Audit Information
Each of the Commissioners at the date of approval of this report confirms that:
in so far as the Commissioner is aware, there is no relevant audit information of which the Commission’s auditor is unaware; andthe Commissioner has taken all the steps that he/she ought to have taken as a Commissioner to make himself/herself aware of any relevant audit information and to establish that the Commission’s auditor is aware of that information.
Commissioners' Approval of the Financial Statements
The consolidated and separate financial statements set out on pages 5 to 37, which have been prepared on the going concern basis, were approved by the Board on 23, May 2016 and are signed on its behalf by:
31 December 2015
Commissioner.................................................................... ....................................................................
Commissioner
46

Independent Auditor's Report to the Members of Botswana Meat Commission in Terms of Section 20 (3)of the Botswana Meat Commission Act (Chapter 74:04) (As Amended)
Report on the Audit of the Consolidated and Separate Financial StatementsWe have audited the consolidated and separate financial statements of Botswana Meat Commission as set out on pages 5 to 37, which comprise the statements of financial position as at 31 December 2015, the statements of comprehensive income, changes in reserves and cash flows for the year then ended, and a summary of significant accounting policies and other explanatory notes.
Commissioners’ Responsibility for the Financial StatementsThe Commissioners are responsible for the preparation and fair presentation of these financial statements in accordance with International Financial Reporting Standards and in the manner required by the Botswana Meat Commission Act (Chapter 74:04) (as amended), and for such internal control as the Commissioners determine is necessary to enable the preparation of financial statements that are free from material misstatement, whether due to fraud or error.
Auditor’s ResponsibilityOur responsibility is to express an opinion on these financial statements based on our audit. We conducted our audit in accordance with International Standards on Auditing. Those standards require that we comply with ethical requirements and plan and perform the audit to obtain reasonable assurance about whether the financial statements are free from material misstatement.
An audit involves performing procedures to obtain audit evidence about the amounts and disclosures in the financial statements. The procedures selected depend on the auditor’s judgement, including the assessment of the risks of material misstatement of the financial statements, whether due to fraud or error. In making those risk assessments, the auditor considers internal control relevant to the entity’s preparation and fair presentation of the financial statements in order to design audit procedures that are appropriate in the circumstances, but not for the purpose of expressing an opinion on the effectiveness of the entity’s internal control. An audit also includes evaluating the appropriateness of accounting policies used and the reasonableness of accounting estimates made by management, as well as evaluating the overall presentation of the financial statements.
We believe that the audit evidence we have obtained is sufficient and appropriate to provide a basis for our audit opinion. OpinionIn our opinion, the consolidated and separate financial statements give a true and fair view of the consolidated and separate financial position of Botswana Meat Commission as at 31 December 2015, and its consolidated and separate financial performance and consolidated and separate cash flows for the year then ended in accordance with International Financial Reporting Standards.
31 December 2015
47

Independent Auditor's Report to the Members of Botswana Meat Commission in Terms of Section 20 (3)of the Botswana Meat Commission Act (Chapter 74:04) (As Amended) | Continued
Emphasis of Matter - Going ConcernWithout qualifying our opinion, we draw attention to Notes 25 and 26 of the consolidated and separate financial statements, which indicate that the Group and the Commission reported a total deficit for the year of P263 million (2014: P180 million) and P268 million (2014: P187 million), respectively, after eliminating the effect of funding received from Government of P600 million (2014: P23 million) and recognition of a gain of Pnil million (2014: P143 million) on conversion of the defined benefit fund to a defined contribution fund. The accumulated losses of the Group and Commission amount to P639 million (2014: P889 million) and P649 million (2014: P893 million), respec-tively. These conditions indicate the existence of a material uncertainty that casts significant doubt on the Group’s and Commission’s ability to continue as a going concern. As indicated in Note 25 of these financial statements, the shareholder, the Government of the Republic of Botswana, has undertaken to provide ongoing financial support in the future. The Board of Commissioners believes that the initiatives as disclosed in Note 25 of these financial statements will be successfully implemented
Report on Other Legal and Regulatory RequirementsIn accordance with Section 20(3) of the Botswana Meat Commission Act (Chapter 74:04) (as amended) we confirm the following:
We have received all the information and explanations which, to the best of our knowledge and belief were neces-sary for the performance of our duties as auditors;
The accounts and related records of the Commission have been properly kept except for the deficiencies reported to management and those charged with governance; and
The Commission has not complied with all the provisions of Part 3 - Financial Provisions relating to the Commis-sion, of the Act with which it is the duty of the Commission to comply. Instances of non-compliance are detailed in Note 26 in the financial statements
31 December 2015
Deloitte & Touche GaboroneCertified Auditors ....................Practicing Member: C V Ramatlapeng (20020075)..........................................Gaborone
48
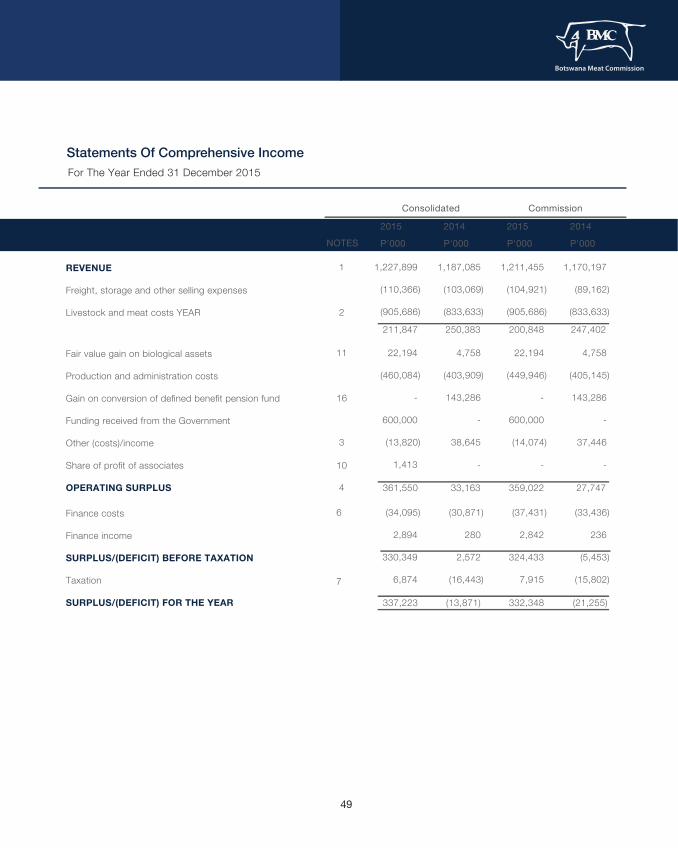
Statements Of Comprehensive IncomeFor The Year Ended 31 December 2015
Consolidated Commission
REVENUE
Freight, storage and other selling expenses
Livestock and meat costs YEAR
2014
P'000
250,383
2015
P'000
211,847
1,227,899
(110,366)
(905,686)
1,187,085
(103,069)
(833,633)
1,211,455
(104,921)
(905,686)
1,170,197
(89,162)
(833,633)
NOTES
1
2
2015
P'000
200,848
2014
P'000
247,402
(13,871)337,223 332,348 (21,255)
Fair value gain on biological assets
Production and administration costs
Gain on conversion of defined benefit pension fund
Funding received from the Government
Other (costs)/income
Share of profit of associates
OPERATING SURPLUS 33,163 361,550
22,194
(460,084)
-
600,000
(13,820)
1,413
4,758
(403,909)
143,286
-
38,645
-
22,194
(449,946)
-
600,000
(14,074)
-
4,758
(405,145)
143,286
-
37,446
-
11
16
3
10
4 359,022 27,747
Finance costs
Finance income
SURPLUS/(DEFICIT) BEFORE TAXATION
Taxation
SURPLUS/(DEFICIT) FOR THE YEAR
(34,095)
2,894
330,349
6,874
(30,871)
280
2,572
(16,443)
(37,431)
2,842
324,433
7,915
(33,436)
236
(5,453)
(15,802)
6
7
49

102,845 (11,729) (13,169) 75,660
Statements Of Comprehensive Income | ContinuedFor The Year Ended 31 December 2015
Consolidated Commission
Other comprehensive (loss)/income
Items that will not be reclassified subsequently to profit or loss:
Revaluation of land and buildings
Deferred tax on revaluation
Net actuarial loss recognised on thedefined benefit plan
Items that may be reclassified subsequently to profit or loss:
Unrealised gain/(loss) on translation of net assets arising on consolidation of foreign entities
Amortised cost adjustment of interest-freegovernment loans
Total other comprehensive (loss)/income
TOTAL COMPREHENSIVE INCOME FOR THE YEAR
2014
P'000
2015
P'000
-
-
-
1,440
(13,169)
152,526
(7,545)
(26,725)
(2,255)
(13,156)
-
-
-
(13,169)
115,541
-
(26,725)
-
(13,156)
NOTES
8
17
16
15
2015
P'000
2014
P'000
88,974 325,494 319,179 54,405
50

Statements Of Financial PositionAs At 31 December 2015
Consolidated Commission
ASSETSNon-current assetsProperty, plant and equipmentInvestment propertyInvestments
2014
P'000
2015
P'000
560,688 5,980 1,617568,285
611,063 6,171
182 617,416
479,291 - 7,484 486,775
515,901 - 7,484 523,385
NOTES
89
10
111213
14
15.2
17
20.3
Current assetsBiological assetsInventoriesTrade and other receivablesAmounts due from group companiesCash and cash equivalents
Total assets
82,110 90,953 147,884 - 158,814 479,761 1,048,046
77,297108,836225,264
-24,167
435,5641,052,980
82,110 90,859 134,501 27,280 134,985 469,735 956,510
77,297 108,836 222,633 18,490 3,204 430,460 953,845
2015
P'000
2014
P'000
RESERVES AND LIABILITIESRESERVESCapital reservesLoan redemption reserveDevelopment reserveStabilisation reserveForeign exchange fluctuation reserveForeign exchange stabilisation reserveLoans revaluation reserveAsset revaluation reserveAccumulated deficitTotal reserves/(deficit)
114,449 195,063 2,734 390 489 21,014 56,140 403,258 (581,175) 212,362
109,815 165,067 2,434 390 64 17,976 69,309 411,153 (889,340) (113,132)
58,666 195,063 2,734 390 - - 56,140 345,157
66,896
58,666 165,067 2,434 390
- - 69,309 345,157(893,306)(252,283)
LIABILITIESNon-current liabilitiesBorrowingsGovernment capital grantDeferred tax liability
502,445 4,073 10,937 517,455
503,569 - 13,147 516,716
502,445 4,073 - 506,518
503,569 - - 503,569
(591,254)
51

Statements Of Financial Position | ContinuedAs At 31 December 2015
Consolidated Commission
Current liabilitiesTaxation payableTrade and other payablesAmounts due to group companiesBank overdraftsUnspent capital grantBorrowings
Total liabilitiesTotal reserves and liabilities
2014
P'000
2015
P'000
2,546150,150
-75,977
3,90585,651
318,229835,684
1,048,046
74,252 152,952
- 324,479
- 97,713
649,396 1,166,112 1,052,980
- 138,292
79,271 75,977
3,905 85,651
383,096 889,614 956,510
72,495 142,926
66,753 322,672
- 97,713
702,559 1,206,128
953,845
NOTES
718
20.4
15.1
15.1
2015
P'000
2014
P'000
52

Statements Of Cash FlowsFor The Year Ended 31 December 2015
Consolidated Commission
CASH FLOWS USED IN OPERATING ACTIVITIESCash used in operationsInterest paidTaxation (paid)/receivedNet cash used in operating activities
2014
P'000
2015
P'000
(159,476)(24,233)
(29)(183,738)
(69,975)(22,065)
1,304 (90,736)
(153,325)(27,568)
- (180,893)
(66,358)(24,703)
- (91,061)
NOTES
21.1
7
2015
P'000
2014
P'000
CASH FLOWS USED IN INVESTING ACTIVITIES Purchase of property, plant and equipment Proceeds on disposal of property, plant and equipment Purchase of shares Finance income Net cash used in investing activities
(18,673)782 -
2,894 (14,997)
(43,515)734 (172)280
(42,673)
(16,015)782
- 2,842
(12,391)
(41,388)463
- 236
(40,689)
21.2
CASH FLOWS FROM/(USED IN) FINANCING ACTIVITIES Borrowings repaid Government financing and grants obtained Effects of changes in foreign exchange rates Net cash generated from/(used in) financing activities
(36,218)607,978
10,124 581,884
(33,836)-
(1,115)(34,951)
(36,218)607,978
- 571,760
(33,762)- -
(33,762)21.3
Net increase/(decrease) in cash and cash equivalents Cash and cash equivalents at beginning of year Cash and cash equivalents at end of year
383,149 (300,312)
82,837
(168,360) (131,952) (300,312)
378,476 (319,468)
59,008
(165,512)(153,956)(319,468)
Comprising:Cash and cash equivalentsBank overdrafts
158,814 (75,977)
82,837
24,167 (324,479)(300,312)
134,985 (75,977)59,008
3,204 (322,672)(319,468)
1415.1
53

Stat
emen
ts O
f Cha
nges
In R
eser
ves
For T
he Y
ear E
nded
31
Dece
mbe
r 201
5
Balan
ce a
t 1 Ja
nuar
y 201
4To
tal c
ompr
ehen
sive
incom
eDe
ficit f
or th
e ye
arOt
her c
ompr
ehen
sive
incom
eAp
prop
riatio
nsTr
ansfe
r of a
ctua
rial lo
sses
rese
rveto
acc
umula
ted
defic
it upo
nco
nver
sion
of d
efine
d be
nefit
fund
Balan
ce a
t 31
Dece
mbe
r 201
4To
tal c
ompr
ehen
sive
loss
Surp
lus fo
r the
year
Othe
r com
preh
ensiv
e los
sAp
prop
riatio
nsBa
lance
at 3
1 De
cem
ber 2
015
Total
Capit
alre
serve
s
Loan
rede
mptio
nre
serve
Deve
lopme
ntre
serve
Stab
ilisati
onre
serve
Fore
ignex
chan
geflu
ctuati
onre
serve
Fore
ignex
chan
gesta
bilisa
tion
rese
rve
Loan
sreva
luatio
nre
serve
Asse
treva
luatio
nre
serve
Actua
rial
losse
sre
serve
Accu
mulat
edde
ficit
P'000
P'000
P'000
P'000
P'000
P'000
P'000
P'000
P'000
P'000
P'000
Cons
olida
ted
(202
,106
)88
974
(1
3,87
1)10
2,84
5 - - (1
13,1
32)
325,
494
337,
223
(11,
729) -
212,
362
135,
067 - - -
30,0
00 -
165,
067 - - -
29,9
96
195,
063
2,14
6 - - -28
8 -2,
434 - - -
300
2,73
4
390 - - - - -
390 - - - -
390
(499
)56
3 - 56
3 - - 64
425 -
425 -
489
16,6
911,
285 -
1,28
5 - -17
,976
3,03
8 -3,
038 -
21,0
14
82,4
65
(13,
156) -
(13,
156) - -
69,3
09
(13,
169) -
(13,
169) -
56,1
40
267,
033
144,
120 -
144,
120 - -
411,
153
(7,8
95) -
(7,8
95) -
403,
258
(115
,159
)(2
6,72
5) - (2
6,72
5) -
141,
884 - - - - - -
(698
,443
)(1
8,72
5)(1
3,87
1)(4
,854
)(3
0,28
8)
(141
,884
)(8
89,3
40)
338,
461
337,
223
1,23
8 (3
0,29
6)(5
81,1
75)
108,
203
1,61
2 - 1,
612 - -
109,
815
4 ,6
34 -
4,63
4 - 11
4,44
9
16/01
/2017
16/01
/2017
16/01
/2017
54

Loan redemption reserveComprises amounts appropriated from income to provide for the repayment of loans as required in terms of the Botswana Meat Commission Act (Chapter 74:04) ( as amended).
Development reserveIn terms of the Botswana Meat Commission Act (Chapter 74:04) (as amended) the Commission shall appropriate amounts to the development reserve to a maximum in any one year of P2 per head of cattle slaughtered.
Stabilisation reserveIn terms of the Botswana Meat Commission Act (Chapter 74:04) (as amended) this reserve, which at present may not exceed a total of P70 000 000, may be utilised for stabilisation of livestock prices or for any other purpose which the Commission, with appropriate approval, may determine from time to time.
Foreign exchange fluctuation reserveRepresents unrealised gains and losses on the translation of assets and liabilities arising on the consolidation of foreign subsidiaries.
Foreign exchange stabilisation reserveRepresents amounts of GBP250 000 (2014: GBP250 000) and US$1 500 000 (2014: US$1 500 000), set aside by certain subsidiaries of the Commission, to be utilised for stabilisation of the impact of foreign exchange fluctuations or for any other purpose which the Commission, with appropriate approval, may determine from time to time.
Loan revaluation reserveRepresents the difference between loans received at rates below the prevailing market rates at inception and the amortised cost of the loans. Over the period of the loans this reserve will unwind through other comprehensive income based on the effective interest rate yield curve.
Asset revaluation reserveRepresents the difference between the fair value of land and buildings and plant and machinery and their net book value on revaluation, less related deferred taxation.
Statements Of Changes In Reserves | ContinuedFor The Year Ended 31 December 2015
Balance at 1 January 2014Total comprehensive incomeSurplus for the yearTransfer of actuarial losses reserve to accumulateddeficit upon conversion of defined benefit fundAppropriationsOther movements in reservesBalance at 31 December 2014Total comprehensive lossSurplus for the yearOther comprehensive lossAppropriationsBalance at 31 December 2015
TotalCapitalreserves
Loanredemptionreserve
Developmentreserve
Stabilisationreserve
Loansrevaluationreserve
Assetrevaluationreserve
Actuariallossesreserve
Accumulateddeficit
P'000 P'000 P'000 P'000 P'000 P'000 P'000 P'000 P'000Commission
(306,521)54,405 (21,255)75,660
- -
(167)(252,283)319,179 332,348 (13,169)
- 66,896
58,666 - - - - - -
58,666 - - - -
58,666
135,067 - - - -
30,000 -
165,067 - - -
29,996195,063
2 146 - - - -
288 -
2,434 - - -
300 2,734
390 - - - - - -
390 - - - -
390
82,465 (13,156)
- (13,156)
- - -
69,309 (13,169)
- (13,169)
- 56,140
229,616115,541
-115,541
- - -
345,157 - - - -
345,157
(115 159)(26 725)
- (26 725)141 884
- - - - - - - -
(699,712)(21,255)(21,255)
- (141,884)
(30,288)(167)
(893,306)332,348 332,348
- (30,296)
(591,254)
55

Group Accounting Policies
Statement Of ComplianceThe financial statements have been prepared in accordance with International Financial Reporting Standards (IFRS) and the Botswana Meat Commission Act. The accounting policies have been consistently applied by the Commission with the exception of the newly adopted International Financial Reporting Standards as disclosed below.
Adoption Of New And Revised International Financial Reporting Standards
Standards and interpretations effective in the current yearThe following revised standards and interpretations were adopted for the year ended 31 December 2015: Amendments to IAS 19 Employee Benefits.Annual Improvements 2010-2012 Cycle - Amendments to IFRS 2, IFRS 3, IFRS 8, IFRS 13, IAS 16 and IAS 24.Annual Improvements 2011-2013 Cycle - Amendments to IFRS 3, IFRS 13 and IAS 40.
The Commission has analysed the effect of the newly adopted standards and has not identified any material impact on the previously reported amounts. The additional disclosures required by the new standards are reflected in the consolidated and separate financial statements for the year ended 31 December 2015.
Standards and interpretations in issue not yet adopted At the date of authorisation of these financial statements, the following Standards and Interpretations that affect the Commission's and Group's operations were in issue but not yet effective:
New/Revised International Financial Reporting StandardsIAS 1 - Amendments arising under the Disclosure Initiative (effective for annual periods beginning on or after 1 January 2016).IAS 16 - Various amendments (effective for annual periods beginning on or after 1 January 2016).IAS 19 - Amendments resulting from September 2014 Annual Improvements to IFRSs (effective for annual periods beginning on or after 1 January 2016).IAS 27 - Amendments reinstating the equity method as an accounting option for investments in subsidiaries, joint ventures and associates in an entity's separate financial statements (effective for annual periods beginning on or after 1 January 2016).IFRS 5 - Amendments resulting from September 2014 Annual Improvements to IFRSs (effective for annual periods beginning on or after 1 January 2016).IFRS 7 - Amendments resulting from September 2014 Annual Improvements to IFRSs (effective for annual periods beginning on or after 1 January 2016).IFRS 9 - New standard on financial instruments (effective for annual periods beginning on or after 1 January 2018).IFRS 10 - Amendments on Sale or Contribution of Assets between an investor and its associate or joint venture (effective for annual periods beginning on or after 1 January 2016).IFRS 12 - Amendments regarding the application of the consolidation exception (effective for annual periods beginning on or after 1 January 2016).IFRS 15 - New standard on revenue (effective for annual periods beginning on or after 1 January 2018).IFRS 16 - New standard on leases (effective for annual periods beginning on or after 1 January 2019).
Management is in the process of assessing the impact of these standards on the Group and Commission's financial statements.
31 December 2015
56

Statement Of ComplianceThe financial statements have been prepared in accordance with International Financial Reporting Standards (IFRS) and the Botswana Meat Commission Act. The accounting policies have been consistently applied by the Commission with the exception of the newly adopted International Financial Reporting Standards as disclosed below.
Adoption Of New And Revised International Financial Reporting Standards
Standards and interpretations effective in the current yearThe following revised standards and interpretations were adopted for the year ended 31 December 2015: Amendments to IAS 19 Employee Benefits.Annual Improvements 2010-2012 Cycle - Amendments to IFRS 2, IFRS 3, IFRS 8, IFRS 13, IAS 16 and IAS 24.Annual Improvements 2011-2013 Cycle - Amendments to IFRS 3, IFRS 13 and IAS 40.
The Commission has analysed the effect of the newly adopted standards and has not identified any material impact on the previously reported amounts. The additional disclosures required by the new standards are reflected in the consolidated and separate financial statements for the year ended 31 December 2015.
Standards and interpretations in issue not yet adopted At the date of authorisation of these financial statements, the following Standards and Interpretations that affect the Commission's and Group's operations were in issue but not yet effective:
New/Revised International Financial Reporting StandardsIAS 1 - Amendments arising under the Disclosure Initiative (effective for annual periods beginning on or after 1 January 2016).IAS 16 - Various amendments (effective for annual periods beginning on or after 1 January 2016).IAS 19 - Amendments resulting from September 2014 Annual Improvements to IFRSs (effective for annual periods beginning on or after 1 January 2016).IAS 27 - Amendments reinstating the equity method as an accounting option for investments in subsidiaries, joint ventures and associates in an entity's separate financial statements (effective for annual periods beginning on or after 1 January 2016).IFRS 5 - Amendments resulting from September 2014 Annual Improvements to IFRSs (effective for annual periods beginning on or after 1 January 2016).IFRS 7 - Amendments resulting from September 2014 Annual Improvements to IFRSs (effective for annual periods beginning on or after 1 January 2016).IFRS 9 - New standard on financial instruments (effective for annual periods beginning on or after 1 January 2018).IFRS 10 - Amendments on Sale or Contribution of Assets between an investor and its associate or joint venture (effective for annual periods beginning on or after 1 January 2016).IFRS 12 - Amendments regarding the application of the consolidation exception (effective for annual periods beginning on or after 1 January 2016).IFRS 15 - New standard on revenue (effective for annual periods beginning on or after 1 January 2018).IFRS 16 - New standard on leases (effective for annual periods beginning on or after 1 January 2019).
Management is in the process of assessing the impact of these standards on the Group and Commission's financial statements.
Group Accounting Policies | Continued
Basis Of Preparation
The consolidated and separate financial statements are prepared under the historical cost convention with the exception of certain items in the statement of financial position which are shown at fair value.
The preparation of consolidated and separate financial statements in conformity with IFRS requires the use of certain critical accounting estimates. It also requires management to exercise its judgement in the process of applying the Commission’s accounting policies. The areas involving a higher degree of judgement or complexity, or areas where assumptions and estimates are significant to the Commission’s financial statements are disclosed in the “Critical accounting judgements and key sources of estimations of uncertainty".
Basis Of Consolidation
SubsidiariesSubsidiaries are all entities over which the Commission has the power to govern the financial and operating policies generally accompanying a shareholding of more than one half of the voting rights. Subsidiaries are fully consoli-dated from the date on which control is transferred to the group. They are de-consolidated from the date that control ceases.
The acquisition of subsidiaries is accounted for using the purchase method. The cost of an acquisition is measured as the fair value of the assets given, equity instruments issued and liabilities incurred or assumed at the date of exchange, plus costs directly attributable to the acquisition. The excess of the cost of acquisition over the fair value of the net assets of the subsidiary acquired is recorded as goodwill. If the cost of acquisition is less than the fair value of the net assets of the subsidiary acquired, the difference is recognised directly in profit or loss.
All intra-group transactions, balances, income, expenses and unrealised gains on transactions are eliminated on consolidation. Unrealised losses are also eliminated but considered as an impairment indicator of the assets transferred. The accounting policies of the subsidiaries have been changed where necessary to ensure consis-tency with the policies adopted by the Group.
AssociatesAn associate is an entity in which the Commission has significant influence but not control, generally accompanying a shareholding of between 20% and 50% of the voting rights. Investments in associates are accounted for using the equity method of accounting and are initially recognised at cost. Under the equity method, the Group’s share of the post-acquisition profits or losses of associates is recognised in the statement of comprehensive income and its share of post-acquisition movements in reserves is recognised in reserves. The cumulative post-acquisition movements are adjusted against the carrying amount of the investment. When the Group’s share of losses in an associate equals or exceeds its interest in the associate, the Group does not recognise further losses, unless it has incurred obligations or made payments on behalf of the associate.
Unrealised gains on transactions between the Group and its associates are eliminated to the extent of the Group’s interest in the associates. Unrealised losses are also eliminated unless the transaction provides evidence of impair-ment of the asset transferred. The accounting policies of associates have been changed where necessary to ensure consistency with policies adopted by the Group.
31 December 2015
57

Group Accounting Policies | Continued
Foreign Currency Translation
Functional and presentation currencyItems included in the financial statements of each of the Group’s entities are measured using the currency of the primary economic environment in which the entity operates (the functional currency). The consolidated financial statements are presented in Botswana Pula, which is the Commission’s functional and presentation currency.
Transactions and balancesForeign currency transactions are translated into the functional currency using the exchange rates prevailing at the dates of the transactions. Foreign exchange gains and losses resulting from the settlement of such transactions and from the translation at year-end exchange rates of monetary assets and liabilities denominated in foreign currencies are recognised in profit or loss.
Group companiesThe results and financial position of all the group entities (none of which has the currency of a hyperinflationary economy) that have a functional currency different from the presentation currency are translated into the presenta-tion currency as follows:
Assets and liabilities for each statement of financial position presented are translated at the closing rate at the reporting date;Income and expenses for each statement of comprehensive income are translated at average exchange rates; andAll resulting exchange differences are recognised as a separate component of equity.
On consolidation, exchange differences arising from the translation of the net investment in foreign entities are taken to equity. When a foreign entity is sold, exchange differences that were recorded in equity are recognised in profit or loss as part of the gain or loss on sale.
Inventories
Finished goodsInventories are stated at the lower of cost and net realisable value. Cost is determined on the following basis:
Meat stocks are valued at average cost of production.Deboned and processed meat stocks are valued at meat stock costs plus production and processing overheads. By-products are valued at average cost of production.
Net realisable value represents the estimated selling price applicable in the ordinary course of the business less applicable variable selling and distribution expenses.
Consumable storesConsumable stores items are valued at weighted average cost. Provision is made for obsolete and slow moving items.
31 December 2015
58

Buildings Leasehold land and buildings Plant and machinery Vehicles Furniture, fittings and equipment Computer equipment and software
15 - 20 years the shorter of the lease period or 15-20 years 5 - 15 years 3 - 10 years 5 - 7 years 3 - 5 years
Group Accounting Policies | Continued
Property, Plant And Equipment All categories of property, plant and equipment except for land and buildings and plant and machinery are stated at historical cost less accumulated depreciation and impairments. Historical cost includes expenditure that is directly attributable to the acquisition of items. Land and buildings and plant and machinery are carried at a revalued amount, being the fair value at the date of revalua-tion less subsequent depreciation and impairment. The fair values are determined by independent valuers every 3 to 5 years. Subsequent costs are included in the assets' carrying amount or recognised as separate assets, as appropriate, only when it is probable that future economic benefits associated with the item will flow to the Group and the costs of the item can be measured reliably. Repairs and maintenance are charged to profit or loss during the financial period in which they are incurred. The cost of major renovations is included in the carrying amount of assets when it is possible that future economic benefits in excess of the originally assessed standard of performance of the existing asset will flow to the Group. Major renovations are depreciated over the remaining useful life of the related assets. The carrying value of all assets is reviewed where there is an indication that it may be impaired. Where the carrying value of an asset is found to exceed its recoverable amount, the asset is written down to its estimated recoverable amount. Freehold land is not depreciated. Leasehold land is written off over the period of the lease. Depreciation on other assets is calculated using the straight-line method to allocate their cost to their residual values over the estimated useful lives, as presented below.
Property, plant and equipment’s residual values and useful lives are reviewed at each reporting date. If appropriate, adjustments are made and accounted for prospectively as a change in estimate.
Gains or losses on disposals are determined by comparing proceeds with the carrying amount. Such gains or losses are included in profit or loss.
Investment Property
The investment property, comprising a filling station, warehouse, workshop and ancillary offices owned by a subsidiary of the Commission, is held for long-term rental yields and is not occupied by the Group. The investment property is carried at fair value. Valuations are done every 3 to 5 years.
31 December 2015
59
Group Accounting Policies | Continued
Impairment Of Non-financial Assets
Assets that have an indefinite useful life are not subject to amortisation and are tested annually for impairment. Assets that are subject to amortisation are reviewed for impairment whenever events or changes in circumstances indicate that the carrying amount may not be recoverable. An impairment loss is recognised for the amount by which the asset’s carrying amount exceeds its recoverable amount. The recoverable amount is the higher of an asset’s fair value less costs to sell and value in use. For the purposes of assessing impairment, assets are grouped at the lowest level for which there is separately identifiable cash flows. Non-financial assets that suffered impair-ment are reviewed for possible reversal of the impairment at each reporting date.
LeasesLeases are classified as finance leases whenever the terms of the lease transfer substantially all the risks and rewards of ownership of the lessee. All other leases are classified as operating leases.
The Group and Commission as lessorRental income from operating leases is recognised on a straight-line basis over the term of the relevant lease. Initial direct costs incurred in negotiating and arranging an operating lease are added to the carrying amount of the leased asset and recognised on a straight-line basis over the lease term.
The Group and Commission as a lesseeOperating lease payments are recognised as an expense on a straight-line basis over the lease term, except where another systematic basis is more representative of the time pattern in which economic benefits from the leased asset are consumed. Contingent rentals arising under operating leases are recognised as an expense in the period in which they are incurred.
In the event that lease incentives are received to enter into operating leases, such incentives are recognised as a liability. The aggregate benefit of incentives is recognised as a reduction of rental expense on a straight-line basis, except where another systematic basis is more representative of the time pattern in which economic benefits from the leased asset are consumed.
Cash And Cash EquivalentsCash and cash equivalents comprise cash in hand, deposits held at call with banks and other short-term highly liquid investments with original maturities of three months or less. Bank overdrafts are shown within current borrowings in the statement of financial position.
BorrowingsBorrowings are recognised initially at fair value, net of transaction costs incurred. Borrowings are subsequently stated at amortised cost using the effective yield method. Borrowing costs directly attributable to the acquisition, construction or production of qualifying assets, which are assets that necessarily take a substantial period of time to get ready for their intended use or sale, are added to the cost of those assets, until such time when the assets are substantially ready for their intended use or sale.
31 December 2015
60

Group Accounting Policies | Continued
Borrowings are recognised initially at fair value, net of transaction costs incurred. Borrowings are subsequently stated at amortised cost using the effective yield method. Borrowing costs directly attributable to the acquisition, construction or production of qualifying assets, which are assets that necessarily take a substantial period of time to get ready for their intended use or sale, are added to the cost of those assets, until such time when the assets are substantially ready for their intended use or sale.
Borrowings obtained from the Government of the Republic of Botswana at rates below the prevailing market rates are initially recorded at fair value and subsequently measured at amortised cost, determined based on the effective yield method. Under this method, the amortised cost of the borrowing is measured as the present value of anticipated future cash flows discounted at the market interest rate at inception of the loans. The difference between the borrowing received and the amortised cost is recognised in other comprehensive income when the borrowing is received and unwinds to interest expense over the period of the loan based on the effective interest rate yield curve.
Investment income earned on the temporary investment of specific borrowings pending their expenditure on qualifying assets is deducted from the borrowing costs eligible for capitalisation. All other borrowing costs are recognised in profit or loss in the period in which they are incurred. Borrowings are classified as current liabilities unless the Group has an unconditional right to defer settlement of the liability for at least 12 months after the reporting date.
Employee BenefitsThe Commission operated a defined benefit pension fund for all eligible citizen employees until 30 September 2014. The plan was converted to a defined contribution plan effective 1 October 2014.
A defined benefit plan is a pension plan that defines an amount of pension benefit to be provided, usually as a function of one or more factors such as age, years of service or compensation. The assets of the fund are held separately from those of the Commission in an independently administered fund. The fund was actuarially valued annually using the projected unit credit method.
The balance recognised in the statement of financial position in respect of the defined benefit pension plan was the present value of the defined benefit obligation at the reporting date less the fair value of plan assets, together with adjustments for actuarial gains/losses and past service cost. The present value of the defined benefit obligation was determined by discounting the estimated future cash flows using interest rates of high quality corporate bonds that were denominated in the currency in which the benefits would be paid and that had terms to maturity approxi-mating to the terms of the related pension liability. Actuarial gains and losses and changes in the fair value of the plan assets were charged or credited to other comprehensive income in the year of valuation. Current service costs and interest on the obligation were charged to income as incurred.
31 December 2015
61

Group Accounting Policies | Continued
Biological AssetsBiological assets are measured at cost on initial recognition and at fair value less cost to sell at the end of each reporting period. Changes in the measurement of fair value less cost to sell are included in profit or loss for the period in which they arise. All costs incurred in maintaining the assets are included in profit or loss for the period in which they arise.
Fair values of livestock held for slaughter are determined based on the cost of purchase of the animals, costs of feeding the animals, commission paid to buyers for the cattle and the transportation costs. The Commissioners consider this to be a reliable estimate of the fair value of the animals at the reporting date.
ProvisionsProvisions are recognised when the Group has a present legal or constructive obligation as a result of past events, and it is probable that an outflow of resources will be required to settle the obligation, and a reliable estimate of the amount can be made. Where the Group expects a provision to be reimbursed, for example under an insurance contract, the reimbursement is recognised as a separate asset but only when the reimbursement is virtually certain. Provisions are not recognised for future operating losses. Revenue RecognitionRevenue comprises the value of the sale of goods and services, including property rentals and insurance premiums net of value-added tax, rebates and discounts, and after eliminating sales within the Group. Revenue is recognised as follows:
Revenue from the sale of goods is recognised when significant risks and rewards of ownership of the goods are transferred to the buyer. Revenue from rendering of services is based on the stage of completion determined by reference to services performed to date as a percentage of total services to be performed.Interest income is recognised on a time proportion basis, taking account of the principal outstanding and the effective interest rate over the period to maturity, when it is determined that such income will accrue to the Group. Dividends are recognised when the right to receive payment is established being the earlier of the declaration of the dividend and the payment of the dividend.Government grants are only recognised when there is reasonable assurance that the conditions attaching to them have been or will be complied with and the grants will be received. They are recognised as income, using the income approach method, over the periods necessary to match them with the related costs, which they are intended to compensate. Government grants receivable as compensation for expenses or losses already incurred or for the purpose of giving the Commission immediate financial support with no future related costs are recog-nised as income in the period in which they become receivable.
31 December 2015
62

Group Accounting Policies | Continued
Related Parties
Related parties are defined as those parties that:
(a) directly, or indirectly through one or more intermediaries:
control, are controlled by, or are under common control with the Commission (this includes parents, subsidiaries and fellow subsidiaries); have an interest in the Commission that gives them significant influence over the Commission; or
(b) are members of the key management personnel of the Commission and its subsidiaries including close members of their families.
All dealings with related parties are accordingly included in profit or loss for the year.
TaxationIncome tax expense represents the sum of the tax currently payable and deferred tax.
Current taxThe tax currently payable is based on taxable profit for the year. Taxable profit differs from profit as reported in the statement of comprehensive income because of items of income or expense that are taxable or deductible in other years and items that are never taxable or deductible. The Group’s liability for current tax is calculated using tax rates that have been enacted or substantively enacted by the end of the reporting period.
Deferred taxDeferred tax is recognised on temporary differences between the carrying amounts of assets and liabilities in the financial statements and the corresponding tax bases used in the computation of taxable profit. Deferred tax liabilities are generally recognised for all taxable temporary differences. Deferred tax assets are generally recognised for all deductible temporary differences to the extent that it is probable that taxable profits will be available against which those deductible temporary differences can be utilised. Such deferred tax assets and liabilities are not recog-nised if the temporary difference arises from goodwill or from the initial recognition (other than in a business combi-nation) of other assets and liabilities in a transaction that affects neither the taxable profit nor the accounting profit. The carrying amount of deferred tax assets is reviewed at the end of each reporting period and reduced to the extent that it is no longer probable that sufficient taxable profits will be available to allow all or part of the asset to be recovered. Deferred tax assets and liabilities are measured at the tax rates that are expected to apply in the period in which the liability is settled or the asset realised, based on tax rates (and tax laws) that have been enacted or substantively enacted by the end of the reporting period. The measurement of deferred tax liabilities and assets reflects the tax consequences that would follow from the manner in which the Group expects, at the end of the reporting period, to recover or settle the carrying amount of its assets and liabilities. Deferred tax assets and liabilities are offset when there is a legally enforceable right to set off current tax assets against current tax liabilities and when they relate to income taxes levied by the same taxation authority and the Group intends to settle its current tax assets and liabilities on a net basis.
31 December 2015
63

Group Accounting Policies | Continued
Current and deferred tax for the periodCurrent and deferred tax are recognised as an expense or income in profit or loss, except when they relate to items that are recognised outside profit or loss (whether in other comprehensive income or directly in equity), in which case the tax is also recognised outside profit or loss, or where they arise from the initial accounting for a business combination. In the case of a business combination, the tax effect is included in the accounting for the business combination.
Financial Instruments
Financial AssetsAll financial assets are recognised and derecognised on trade date where the purchase or sale of a financial asset is under a contract whose terms require delivery of the financial asset within the timeframe established by the market concerned, and are initially measured at fair value, plus transaction costs, except for those financial assets classified as at fair value through profit or loss, which are initially measured at fair value. Financial assets are classified into the following specified categories: financial assets ‘at fair value through profit or loss’ (FVTPL), ‘held-to-maturity’ investments, ‘available-for-sale’ (AFS) financial assets and ‘loans and receivables’. The classification depends on the nature and purpose of the financial assets and is determined at the time of initial recognition. The Group's principal financial assets are 'loans and receivables'.
Effective interest method
The effective interest method is a method of calculating the amortised cost of a debt instrument and of allocating interest income over the relevant period. The effective interest rate is the rate that exactly discounts estimated future cash receipts (including all fees on points paid or received that form an integral part of the effective interest rate, transaction costs and other premiums or discounts) through the expected life of the debt instrument, or (where appropriate) a shorter period, to the net carrying amount on initial recognition. Income is recognised on an effective interest basis for debt instruments other than those financial assets classified as at FVTPL. Loans and receivablesTrade receivables, loans, and other receivables that have fixed or determinable payments that are not quoted in an active market are classified as ‘loans and receivables’. Loans and receivables are measured at amortised cost using the effective interest method less any impairment. Interest income is recognised by applying the effective interest rate, except for short-term receivables where the recognition of interest would be immaterial.
Impairment of financial assetsThe carrying amount of the financial asset is reduced by the impairment loss directly for all financial assets with the exception of trade receivables where the carrying amount is reduced through the use of an allowance account. When a trade receivable is uncollectible, it is written off against the allowance account. Subsequent recoveries of amounts previously written off are credited against the allowance account. Changes in the carrying amount of the allowance account are recognised in profit or loss.
31 December 2015
64

Group Accounting Policies | Continued
Derecognition of financial assetsThe Group derecognises a financial asset only when the contractual rights to the cash flows from the asset expire, or when it transfers the financial asset and substantially all the risks and rewards of ownership of the asset to another entity. If the Group neither transfers nor retains substantially all the risks and rewards of ownership and continues to control the transferred asset, the Group recognises its retained interest in the asset and an associated liability for amounts it may have to pay. If the Group retains substantially all the risks and rewards of ownership of a transferred financial asset, the Group continues to recognise the financial asset and also recognises a collater-alised borrowing for the proceeds received.
Financial Liabilities and Equity instruments
Equity instrumentsAn equity instrument is any contract that evidences a residual interest in the assets of an entity after deducting all of its liabilities. Equity instruments issued by the Group are recognised at the proceeds received, net of direct issue costs.
Financial liabilitiesFinancial liabilities are classified as either financial liabilities ‘at FVTPL’ or ‘other financial liabilities’. The Group's financial liabilities are principally 'other financial liabilities'.
Other financial liabilitiesOther financial liabilities, including payables, are initially measured at fair value, net of transaction costs. Other financial liabilities are subsequently measured at amortised cost using the effective interest method, with interest expense recognised on an effective yield basis.
The effective interest method is a method of calculating the amortised cost of a financial liability and of allocating interest expense over the relevant period. The effective interest rate is the rate that exactly discounts estimated future cash payments through the expected life of the financial liability, or (where appropriate) a shorter period, to the net carrying amount on initial recognition.
Derecognition of financial liabilitiesThe Group derecognises financial liabilities when, and only when, the Group’s obligations are discharged, cancelled or they expire.
Impairment Of AssetsAt each reporting date, the Group reviews the carrying amounts of its assets to determine whether there is any indication that those assets have suffered an impairment loss. If any such indication exists, the recoverable amount of an asset is estimated in order to determine the extent of the impairment loss, if any.
Recoverable amount is the higher of fair value less costs to sell and value in use. In assessing value in use, the estimated future cash flows are discounted to their present value using a pre-tax discount rate that reflects current market assessments of the time value of money and the risks specific to the asset for which the estimates of future cash flows have not been adjusted.
31 December 2015
65

Group Accounting Policies | Continued
If the recoverable amount of an asset is estimated to be less than its carrying amount, its carrying amount is reduced to its recoverable amount. An impairment loss is recognised immediately in the profit or loss for the year.
Where an impairment loss subsequently reverses, the carrying amount of the asset is increased to the revised estimate of its recoverable amount, but so that the increased carrying amount does not exceed the carrying amount that would have been determined had no impairment loss been recognised for the asset in prior years. A reversal of an impairment loss is recognised immediately in the profit or loss for the year. Government GrantsGrants from the Government of the Republic of Botswana are recognised at their fair value where there is reason-able assurance that the grant will be received.
Financing received as immediate financial support or as a compensation for incurred losses is recognised in the statement of comprehensive income when it is committed by Government.
Capital expenditure is financed by grants from the Government of the Republic of Botswana. Funds received are initially credited to deferred grants and transferred to capital grants when the assets are acquired and the expendi-ture incurred. The capital grants are released to the statement of comprehensive income on a basis matching with the depreciation charge on the related assets. Critical Accounting Judgements And Key Sources Of Estimation Of UncertaintyThe Commission makes assumptions concerning the future. The resulting accounting estimates will, by definition, seldom equal the related actual results. The estimates and assumptions that have a significant risk of causing a material adjustment to the carrying amount of assets and liabilities within the next financial year are discussed below.
Useful lives and residual values for property, plant and equipmentThe Commission tests annually whether, the useful life and residual value estimates are appropriate and in accor-dance with its accounting policy.
Fair value of land and buildings, investment property and plant and machineryThe fair value of properties is determined by an independent valuer to be equal to their market value at the date of valuation. The fair value of plant and machinery is determined by an independent valuer to be equal to the assets' depreciated replacement cost.
Fair values of biological assetsThe Commissioners have estimated that the fair value of the livestock held at year end comprises the following:
Cost of purchase of the livestock;Cost of feeding the animals to the reporting date;Commission paid to livestock buyers; andTransport costs for moving the livestock to feeding pens
31 December 2015
66

Group Accounting Policies | Continued
Impairment of assetsProperty, plant and equipment, inventory, investments and financial assets are assessed for impairment at each reporting date. Factors taken into consideration include economic viability of the asset itself. Future cash-flows expected to be generated by the asset are projected, taking into account market conditions and the expected useful lives of the assets. The present value of these cash flows, determined using an appropriate discount rate, is compared to the current asset value and, if lower, the assets are impaired to present value.
Amortised cost of interest-free loansThe amortised cost is determined based on the expected future cash flows discounted using the market interest rate at commencement of the loans.
Provisions, contingent assets and contingent liabilitiesManagement performs ongoing analysis of all claims, litigation and other legal and business matters to identify provisions, contingent assets and contingent liabilities in compliance with the requirements of IAS 37 Provisions, contingent liabilities and contingent assets.
Going concernThe Commission’s management has made an assessment of the Commission’s and Group's ability to continue as a going concern. This has been noted in note 25.
31 December 2015
67

Notes To The Consolidated And Separate Financial Statements31 December 2015
Consolidated Commission
1. REVENUESale of meat and allied meat productsOther sales - services
2. LIVESTOCK AND MEAT COSTSOpening Inventory (note 12)Cattle purchasesFair value gain on biological assetsClosing Inventory (note 12)
3. OTHER (COSTS)/INCOMEFinancing of the losses in Francistown abattoirreceived from the Government of BotswanaNet exchange (losses)/gainsLoss on disposal of property, plant and equipmentSundry incomeIncome from related parties
4. OPERATING SURPLUSOperating surplus is stated after taking thefollowing into account:
Depreciation of property, plant and equipmentImpairment of property, plant and equipmentFair value gain from valuation of biological assetsDepreciation of investment propertyAuditor's remuneration - current - prior yearCommissioners- Fees and emoluments- ExpensesOperating lease paymentsOperating lease incomeStaff costs (note 5)
2014
P'000
2015
P'000
1,211,455 16,444
1,227,899
90,520 857,946
22,194 (64,974)
905,686
- (23,198)
(34)9,412
- (13,820)
57,093 -
22,194 191
3,243 2,183 1,060
97 28
1,465 (2,521)
205,052
1,170,197 16,888
1,187,085
130,942 788,453
4,758 (90,520)
833,633
22,900 6,816 (1,068)9,997
- 38,645
30,508 8,344 4,758
29 2,735 2,735
-
103 8
990 (2,405)
173,323
1,211,455 -
1,211,455
90,520 857,946
22,194 (64,974)
905,686
- (20,345)
(34)6,045
260 (14,074)
51,809 -
22,194 -
2,440 1,380 1,060
97 28 - -
192,624
1,170,197 -
1,170,197
130,942 788,453
4,758 (90,520)
833,633
22,900 7,544 (1,090)7,852
240 37,446
29,766 8,344 4,758
- 1,983 1,325
658
103 8
- -
161,044
2015
P'000
2014
P'000
68

Notes To The Consolidated And Separate Financial Statements | Continued31 December 2015
Consolidated Commission
5. STAFF COSTSWages and salariesRetrenchment costsPension fund costsStaff allowances and other staff costs
6. FINANCE COSTSBank overdraftBorrowingsRelated parties
2014
P'000
2015
P'000
142,956 31,244
9,912 20,940
205,052
2,970 31,125
- 34,095
115,374 -
11,228 46,721
173,323
9,068 21,803
- 30,871
131,315 31,244
9,125 20,940
192,624
2,880 31,125
3,426 37,431
103,462 -
11 228 46,354
161,044
8,995 21,803
2,638 33,436
2015
P'000
2014
P'000
69

The Commission is taxed in Botswana in terms of the Fourth Schedule of the Income Tax Act 1995, which is princi-pally based on gross sales proceeds less marketing expenses.
The Minister of Finance and Development Planning has relieved the Commission in respect of the taxation amount for all financial years up to 2015.
Notes To The Consolidated And Separate Financial Statements | Continued31 December 2015
Consolidated Commission
7. TAXATIONBotswana taxation:- current year - prior years tax relief
Foreign taxation:- current taxation- deferred taxation
Total taxation
Balance payable at beginning of yearCurrent tax chargeTax (paid)/receivedTax set off against VAT liabilitiesTax reliefBalance payable at end of year
Disclosed in the statements of financial position as:
Taxation payable
2014
P'000
2015
P'000
143 (7,915)(7,772)
675 223 898
(6,874)
48,840 (33,020) 15,820
- 623 623
16,443
- (7,915)(7,915)
- - -
(7,915)
48,822 (33,020)15,802
- - -
15,802
2015
P'000
2014
P'000
74,252 818 (29)
(64,580)(7,915)2,546
2,5462,546
74,724 48,840
1,304 (17,596)(33,020)74,252
74,25274,252
72,495 - -
(64,580)(7,915)
-
- -
74,289 48,822
- (17,596)(33,020)72,495
72,495 72,495
70

The effect from the 2014 revaluation of the Group's plant and machinery presented in other comprehensive income comprises the elimination of depreciation on revaluation of P115 155 000 and the revaluation of plant and machinery of P37 371 000 disclosed in this note.
8.1 Consolidated Year ended 31 December 2015 Opening carrying amount Exchange differences Additions Transfers from WIP Disposals Depreciation charge Depreciation on disposals Closing carrying amount At 31 December 2015 Cost/valuation Accumulated depreciation and impairment Carrying amount Year ended 31 December 2014 Opening carrying amount Exchange differences Revaluation of land and buildings Additions Transfers from WIP Disposals Depreciation charge Depreciation on disposals Impairment Elimination of depreciation on revaluation Closing carrying amount At 31 December 2014 Cost/valuation Accumulated depreciation and impairment Carrying amount
334,521 (6,776)5,905
10,912 (130)
(15,309)8
329,131
358,983 (29 852)
329,131
335,116 (906)
- 13,395
1,825 (358)
(14,909)358
- -
334,521
349,072 (14,551)
334,521
23 1 - - -
(14)-
10
4,596 (4,586)
10
35 1 - - - -
(13)- - -
23
4,595 (4,572)
23
242,731 (4,258)7,822 1,253
- (34,402)
- 213,146
263,835 (50,689)
213,146
100,966 (352)
37,371 4,293 3,768 (6,403)(9,729)6,006 (8,344)
115,155 242,731
259,018 (16,287)
242,731
6,062 -
64 -
(1 377)(2 310)
721 3,160
19,982 (16,822)
3,160
3,244 - -
4,036 906
(1,686)(1,812)1,374
- -
6,062
21,295 (15,233)
6,062
6,448 (100)672
60 -
(1,408)-
5,672
15,096 (9,424)5,672
6,238 (14)
- 968 292 (138)(939)
41 - -
6,448
14,464 (8,016)6,448
9,044 2
2,133 7
(46)(3,650)
8 7,498
32,559 (25,061)
7,498
10,984 - -
1,738 175
(1,060)(3,106)
313 - -
9,044
30,463 (21,419)
9,044
12,234 (8)
2,077 (12,232)
- - -
2,071
2,071 -
2,071
367 (3)-
19,085 (6,966)
(249)- - - -
12,234
12,234 -
12,234
611,063 (11,139)18,673
- (1,553)
(57,093)737
560,688
697,122 (136,434)560,688
456,950 (1,274)
37,371 43,515
- (9,894)
(30,508)8,092 (8,344)
115 155 611,063
691,141 (80,078)
611,063
Notes To The Consolidated And Separate Financial Statements | Continued31 December 2015
8. PROPERTY, PLANT AND EQUIPMENTFreeholdLand andBuildings
LeaseholdLand andBuildings
PlantandMachinery
MotorVehicles
FurnitureandEquipment
ComputerEquipment
CapitalWork inProgress Total
P'000 P'000 P'000 P'000 P'000 P'000 P'000 P'000
71

The effect from the 2014 revaluation of the Commission's plant and machinery presented in other comprehensive income comprises the elimination of depreciation on revaluation gain of P115 155 000, the revaluation gain of plant and machinery in the Lobatse and Francistown plants of P386 000 and the impairment loss of plant and machinery in the Maun plant of P8 344 000 disclosed in this note.
8.2 Commission Year ended 31 December 2015 Opening carrying amount Additions Transfers from WIP Depreciation charge Disposals Depreciation on disposals Closing carrying amount At 31 December 2015 Cost/valuation Accumulated depreciation and impairment Carrying amount Year ended 31 December 2014 Opening carrying amount Revaluation of land and buildings Additions Transfers from WIP Depreciation charge Disposals Depreciation on disposals Impairment Elimination of depreciation on revaluation Closing carrying amount At 31 December 2014 Cost/valuation Accumulated depreciation and impairment Carrying amount
279,011 4,406
10,912 15,309)
(130)8
278,898
308,750 (29,852)
278,898
279,593 -
12,502 1,825
(14,909)(358)358
- -
279,011
293,562 (14,551)279,011
3 - - - - - 3
4,548 (4,545)
3
3 - - - - - - - - 3
4,548 (4,545)
3
204,107 6,883 1,189
(29,384)- -
182,795
222,546 (39,751)
182,795
99,288 386
3,441 3,768 (9,190)(6,398)6,001 (8,344)
115,155 204,107
214,474 (10,367)
204,107
6,062 64
- (2,310)(1,377)
721 3,160
17,974 (14,814)
3,160
3,244 -
4,036 906
(1,812)(1,686)1,374
- -
6,062
19,287 (13,225)
6,062
5,524 534
43 (1,158)
- -
4,943
12,187 (7,244)4,943
5,407 -
671 292 (749)
(97)- - -
5,524
11,610 (6,086)5,524
9,044 2,107
7 (3,648)
(46)8
7,472
31,841 (24,369)
7,472
10,984 -
1,738 175
(3,106)(1,060)
313 - -
9,044
29,773 (20,729)
9,044
12,150 2,021
(12,151)- - -
2,020
2,020 -
2,020
116 -
19,000 (6,966)
- - - - -
12,150
12,150 -
12,150
515,901 16,015
- (51,809)
(1,553)737
479,291
599,866 (120,575)479,291
398,635 386
41,388 -
(29,766)(9,599)8,046 (8,344)
115,155 515,901
585,404 (69,503)
515,901
Notes To The Consolidated And Separate Financial Statements | Continued31 December 2015
PROPERTY, PLANT AND EQUIPMENT FreeholdLand andBuildings
LeaseholdLand andBuildings
PlantandMachinery
MotorVehicles
FurnitureandEquipment
ComputerEquipment
CapitalWork inProgress Total
P'000 P'000 P'000 P'000 P'000 P'000 P'000 P'000
72

Notes To The Consolidated And Separate Financial Statements | Continued
Group and CommissionThe details of the Group and Commission's freehold land and buildings are available at the Commission's Head Office in Lobatse.
The Commission is engaged in a project to update and obtain all title deeds over the properties owned by the Commission as certain title deeds over the Commission's properties are not available. The fair value of the plots with no title deeds available is P1 541 060 as at 31 December 2015.
Fair value measurement of the Group's and Commission's land and buildingsThe fair value of the Commission's land and buildings was determined as at 31 December 2013 by Apex Properties Botswana (Proprietary) Limited, an independent valuer with appropriate qualifications and experience in the valuation of the properties in the relevant locations. The fair value was estimated using the Depreciated Replacement Cost ("DRC") model. The main input factors used in the model were the area of each property and the estimated value per square meter based on the condition of the proper-ties.
The fair value of the land and buildings of Table Bay Cold Storage (Proprietary) Limited as at 31 December 2013 was determined by Unit Property Brokers, independent valuers not related to the Group with appropriate qualifications and experience in the valuation of the properties in the relevant location. The fair value was determined based on a combination of market prices and an income capitalisation model.
All land and buildings have been valued using level 3 inputs. Level 3 inputs are unobservable inputs for the asset. Management considers the fair values determined in 2013 still relevant as at 31 December 2015.
Had the land and buildings been measured on a historical cost basis, their net book value for the Group would have been P86 702 847 (2014: P75 858 504) and their net book value for the Commission would have been P 72 606 000 (2014: P61 395 000).
Fair value measurement of the Group's and Commission's plant and machineryIn 2014 the fair value of the plant and machinery belonging to the Commission and Table Bay Cold Storage (Proprietary) Limited was determined by PricewaterhouseCoopers' team of independent valuation specialists with appropriate qualifications and experience in the valuation of tangible assets. The basis for the valuation was the Depreciated Replacement Cost ("DRC") model. The following main input factors were used in the model: a) expected average life that each type of asset will remain in service before requiring replacement; b) the cost of replacing the existing assets with their modern equivalent assets; and c) estimated useful life adjusted by the condition factor to determine the remaining useful life of the assets. Plant and machinery has been valued using level 3 inputs. Level 3 inputs are unobservable inputs for the assets. Had the plant and machinery been measured on a historical cost basis, its net book value for the Group would have been P85 300 105 (2014: P90 521 104) and their net book value for the Commission would have been P83 255 000 (2014: P88 566 000).
The impairment loss of P8 344 000, which was recognised in profit and loss in 2014, relates to the plant and machinery of the Maun production plant,a separate cash generating unit, as its revalued amount was below its net book value. The impairment is a result of the fact that the plant and machinery was comparatively new and had a high net book value at the date of the revaluation, while its revalued amount was lower based on the assets' condition at the revaluation date. As the disposal costs of the plant and machinery are considered not being material, the recoverable amount of the revalued assets is assumed to be close to their revalued amount so no further impairment is deemed necessary.
31 December 2015
73

Notes To The Consolidated And Separate Financial Statements | Continued31 December 2015
The fair value of the investment property was determined as at 31 December 2013 by Apex Properties Botswana (Proprietary) Limited, an independent valuer with appropriate qualifications and experience in the valuation of the properties in the relevant location. The fair value was estimated using the depreciable replacement cost method. The investment property was valued using level 3 inputs. Level 3 inputs are unobservable inputs for the asset. Management believes that there was no material change in the fair value of the investment property as at 31 December 2015.
Consolidated
2015
P'000 P'000
2014
9. INVESTMENT PROPERTY
Opening carrying amountDepreciation chargeClosing carrying amount
Fair value
10. INVESTMENTS Subsidiary companies: Botswana Meat Commission (UK) Holdings Limited Shares at cost Lobatse Leathers (Proprietary) Limited Shares at cost Mainline Carriers (Botswana) (Proprietary) Limited Shares at cost Associates: GPS Food Group AS - shares at cost Effect of foreign exchange rates Share of the profit of GPS Food Group AS Debentures in Clifton School (Botswana) at cost
6,171 (191)
5,980
5,980
100
100
100
33
-
-
- -
172 22
1,413 1,607
10 1,617
-
-
- -
172
- 172
10 182
2,866
300
4,308 7,474
-
- -
10 7,484
2,866
300
4,308 7,474
-
- -
10 7,484
6,200 (29)
6,171
6,171
Consolidated Commission
2014P'000
2014P'000
2015P'000% Equity
held
2015P'000
The shares in GPS Food Group AS were acquired on 1 July 2014.
74
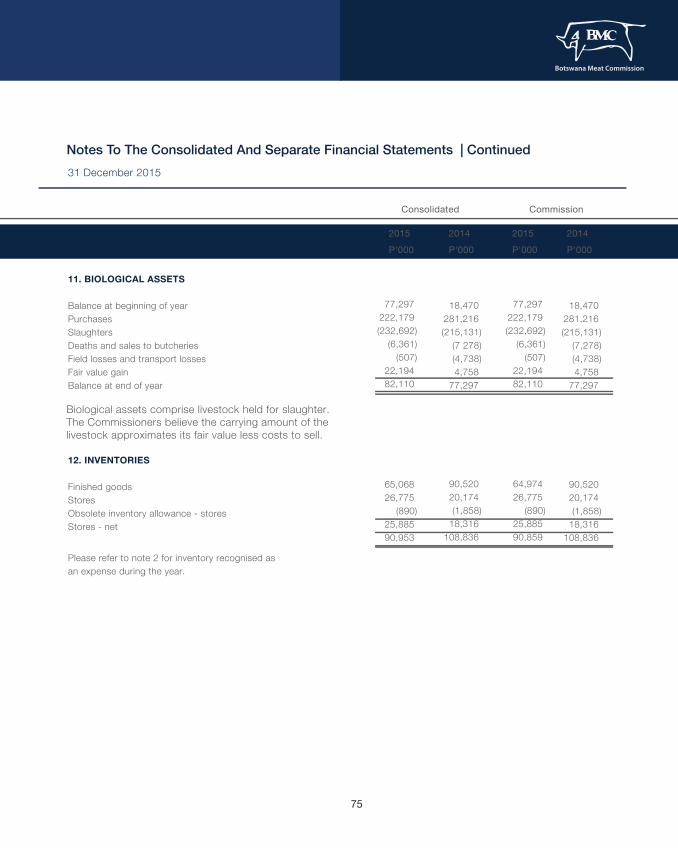
Biological assets comprise livestock held for slaughter.The Commissioners believe the carrying amount of thelivestock approximates its fair value less costs to sell.
Notes To The Consolidated And Separate Financial Statements | Continued31 December 2015
11. BIOLOGICAL ASSETS
Balance at beginning of yearPurchasesSlaughtersDeaths and sales to butcheriesField losses and transport lossesFair value gainBalance at end of year
77,297 222,179 (232,692)
(6,361)(507)
22,194 82,110
18,470 281,216 (215,131)
(7 278)(4,738)4,758
77,297
77,297 222,179 (232,692)
(6,361)(507)
22,194 82,110
18,470 281,216 (215,131)
(7,278)(4,738)4,758
77,297
12. INVENTORIES
Finished goodsStoresObsolete inventory allowance - storesStores - net
65,068 26,775
(890)25,885 90,953
90,520 20,174 (1,858)
18,316 108,836
64,974 26,775
(890)25,885 90,859
90,520 20,174 (1,858)
18,316 108,836
Consolidated Commission
2014P'000
2014P'000
2015P'000
2015P'000
Please refer to note 2 for inventory recognised as an expense during the year.
75

In determining the recoverability of a trade receivable, the Group and Commission consider any change in the credit quality of the trade receivable from the date credit was initially granted up to the reporting date. The concentration of credit risk relating to trade receivables is limited due to the customer base being large and unrelated. Accordingly, the Commissioners believe that there is no further allowance required in excess of the allowance for doubtful debts recognised in the statement of financial position. There are no significant debtors past the due date that have not been impaired. The average credit period is 30 days (2014: 65 days).
Receivables are pledged as security on the Standard Chartered Bank Botswana Limited trade finance facility as disclosed in Note 15.1.
Notes To The Consolidated And Separate Financial Statements | Continued31 December 2015
13. TRADE AND OTHER RECEIVABLES
Trade receivablesLess: Allowance for doubtful debtsTrade receivables - netPrepaymentsValue added taxReceivable from the Government of Botswanafor financing the losses of the Francistown abattoirOther receivables
145,627 (18,492)
127,135 14,039
5,408
- 1,302
147,884
215,345 (34,108)
181,237 11 431
3 574
22,900 6,122
225,264
137,241 (18,427)
118,814 9,146 5,408
- 1,133
134,501
213,682 (34,082)
179,600 10,893
3,546
22,900 5,694
222,633
Consolidated Commission
2014P'000
2014P'000
2015P'000
2015P'000
Movement in the allowance for doubtful debts
Balance at beginning of yearCurrent year provisionAmounts written offBalance at end of year
34,108 7,662
(23,278)18,492
22,552 11,556
- 34,108
34,082 7,623
(23,278)18,427
22,240 11,842
- 34,082
14. CASH AND CASH EQUIVALENTS
Cash at bank and in handShort-term deposits
36,085122,729158,814
17,791 6,376
24,167
12,256122,729134,985
2,1711,0333,204
76

Notes To The Consolidated And Separate Financial Statements | Continued31 December 2015
15. BORROWINGS AND BANK OVERDRAFTS 15.1 Current Bank overdrafts Current portion of Government of the Republic of Botswana loans Current portion of African Banking Corporation of Botswana Limited (t/a Banc ABC) long term loan Current portion of First National Bank of Botswana Limited and Rand Merchant Bank long term loan
75,977 75,977
49,428
6,483
29,740 85,651
324,479 324,479
31,909
6,057
59,747 97,713
75,977 75,977
49,428
6,483
29,740 85,651
322,672 322,672
31,909
6,057
59,747 97,713
Consolidated Commission
2014P'000
2014P'000
2015P'000
2015P'000
77

The bank overdrafts and trade finance facilities are denominated in BWP and ZAR with limits as follows:
The trade finance facility received from Standard Chartered Bank Botswana Limited can be drawn in various currencies although the limit is set in Botswana Pula. It bears interest at 3-month LIBOR+2.5% for all amounts drawn in British Pounds, 3-month EURIBOR+3% for all amounts drawn in Euro, JIBAR+3.5% for all amounts drawn in South African Rand and prime rate less 2.5% for all amounts drawn in Botswana Pula. The facility is secured through:
1. Assignment of receivables for all proceeds to liquidated maturing export invoice finance loans;2. An irrevocable unconditional Government guarantee for BWP300 000 000; and"3. Deed of hypothecation over moveable assets for BWP95 000 000.
In terms of Section (23(3) (b)) of the Botswana Meat Commission Act (Chapter 74:04), the Commission is free of obligation to repay this loan; interest at a rate not exceeding 8% per annum is payable thereon.CapitalInterest
Notes To The Consolidated And Separate Financial Statements | Continued31 December 2015
BORROWINGS | CONTINUED Bank overdrafts comprise: Trade finance Standard Chartered Bank Botswana Limited Current account overdraft Standard Chartered Bank Botswana Limited First National Bank of Botswana Limited Bank Gaborone Limited Standard Bank South Africa Limited
Botswana pula denominated (thousand) South African Rand denominated (thousand)
53,242 53,242
22,735 22,556
- 179
-
75,977
263,723 263 ,723
60,756 29,163 27,283
2,503 1,807
324,479
53,242 53,242
22,735 22,556
- 179
-
75,977
263,723 263,723
58,949 29,163 27,283
2,503 -
322,672
Consolidated Commission
2014P'000
2014P'000
2015P'000
2015P'000
Overdraft/trade finance facilities limits Amount utilised Amount available Total facility
75,977 252,639 328,616
324,479 32,128
356,607
75,977 249,023 325,000
322,672 29,828
352,500
Non-current Government of the Republic of Botswana
162 150
12
162 150
12
162 150
12
162 150
12
BWP325,000ZAR 5 000
BWP352,500ZAR 5 000
BWP325,000ZAR 0
BWP352,500ZAR 0
78

Interest free loan repayable in eight equal instalments which were scheduled to commence in August 2014, after a grace period of 3 years. However, the payments did not commence and the initial accumulated payment has been rescheduled to 2017.CapitalLess short-term portionAmortised cost adjustment - beginning of yearAmortised cost adjustment for the year
Notes To The Consolidated And Separate Financial Statements | Continued31 December 2015
BORROWINGS | CONTINUED
Non-current (continued)
157,609 191,850
- (42,720)
8,479
131,875 191,850 (17,255)(52,808)10,088
157,609 191,850
- (42,720)
8,479
131,875 191,850 (17,255)(52,808)10,088
Interest free loan repayable in sixteen equal instalments over 8 years, which were scheduled to commence in February 2014, after a grace period of 2 years. However, the payments did not commence and the initial accumulated payment has been rescheduled to 2016.CapitalLess short-term portionAmortised cost adjustment - beginning of yearAmortised cost adjustment for the year
60,496 104,000 (21,638)(26,556)
4,690
62,790 104,000 (14,654)(29,624)
3,068
60,496 104,000 (21,638)(26,556)
4,690
62,790 104,000 (14 654)(29,624)
3,068
The loan is payable semi-annually over a period of 8 years commencing on 15 June 2016 and attracts interest at prime per annum. The Commission negotiated a 4 year grace period from date of first draw down - 15 June 2012. The interest is capital-ised and attracts interest at the same rate as the principal amount.Total Government of Botswana Loans
African Banking Corporation of Botswana Limited t/a Banc ABC - the loan had a moratorium for 7 months ended 31 March 2011. The repayments thereafter are over a 10 year period at an interest rate of prime, less 2.75%. The loan is secured by a guarantee from the Government of the Republic of Botswana.Total non-current borrowings
262,893 481,160
280,276475,103
262,893 481,160
280,276475,103
21,285502,445
28,466 503,569
21,285502,445
28,466503,569
Consolidated Commission
2014P'000
2014P'000
2015P'000
2015P'000
79

Notes To The Consolidated And Separate Financial Statements | Continued31 December 2015
Total current borrowings (Note 15.1)
Total borrowings
85,651
588,096
97,713
601,282
85,651
588,096
97,713
601,282
Consolidated Commission
2014P'000
2014P'000
2015P'000
2015P'000
Maturity of borrowings and overdrafts per agreements (including future interest payments)Up to 1 yearBetween 2 and 5 yearsOver 5 years
161,724 378,202 238,052 777,978
437,444329,479319,087
1,086,010
161,724378,202238,052777,978
435,637 329,479 319,087
1,084,203
80

The Commission operated a defined benefit pension plan for its eligible employees until 30 September 2014. The plan was converted to a defined contribution plan effective from 1 October 2014.
The final independent actuarial valuation of the defined benefit plan was performed at 30 September 2014 by AON Hewitt Limited (Mauritius).
Amounts recognised in other comprehensive income in respect of the defined benefit plan are:Net actuarial loss recognised in the year
Movements in the present value of the defined benefit obligations in the current period were as follows:
Notes To The Consolidated And Separate Financial Statements | Continued31 December 2015
16. PENSION FUND LIABILITY
- - - - - - -
-
10,014 7,314
11,005 (8,305)
(143,286)(103,968)
(39,318)
(133,272)
- - - - - - - - -
289,029 11,005
7,314 (103,968)
(39,318)(96,645)(96,142)28,725
-
- -
26,725 26,725
Consolidated Commission
2014P'000
2015P'000
Charge to the income statement: Current service cost Interest on obligation Interest income on plan assets Gain on conversion of fund to defined contribution fund Past service cost Settlement gain
Opening defined benefit obligation Interest cost Current service cost Past service cost Settlement gain Benefits paid on settlement Other benefits paid Actuarial losses Closing defined benefit obligation
Amounts recognised in profit or loss in respect of the defined benefit plan are:
81

Movement in the present value of the plan assets in the current period were as follows:
Notes To The Consolidated And Separate Financial Statements | Continued31 December 2015
- - - - - -
177,687 8,305 4,795
(192,787)2,000
-
Consolidated Commission
2014P'000
2015P'000
Opening fair value of plan assets Expected return on plan assets Contributions Benefits paid Actuarial gains Closing fair value of plan assets
- - - -
5.40%5.90%6.30%4.90%
The principal actuarial assumptions used were: - Inflation rate - Expected rate of remuneration growth - Discount rate - Expected pension increases
82

The major portion of the deferred tax liability relates to temporary differences in respect of revalued property, plant and equipment and fair valued investment property.
The average credit period for trade payables is 30 days (2014: 30 days). No interest is charged on the trade payables. The Group and Commission have financial risk management policies in place to ensure that all payables are paid within a reasonable time of the agreed credit terms.
Consolidated Commission
2014P'000
2014P'000
2015P'000
2015P'000
Notes To The Consolidated And Separate Financial Statements | Continued31 December 2015
5,113 (134)623
7,545 13,147
13,147 (2,433)
223 -
10,937
- - - - -
- - - - -
17. DEFERRED TAXATION Balance at beginning of year Exchange differences Income statement charge (note 7) Charge to other comprehensive income Balance at end of year
81,349 33,797
- 26,188
- -
11,618 152,952
66,052 26,096 29,745 14,033
380 11,761
2,083 150,150
60,93220,14029,74513,694
-11,761
2,020138,292
78,665 27,722
- 25,793
- -
10,746 142,926
18. TRADE AND OTHER PAYABLES Trade payablesAccrued expensesRetrenchment provisionPayroll accrualsValue added taxAdvances from customersOther payables
83

- Debt is defined as borrowings and overdrafts, as disclosed in note 15.- Reserves comprises reserves as disclosed in the statement of changes in reserves.
The Commissioners consider that the carrying values of the financial instruments reported in the statement of financial position approximate their fair values.
The Commission and Group manage their capital to ensure that they continue as a going concern while maximising the return to the stakeholder through optimisation of the debt and equity balance.
The capital structure of the Group and the Commission consists of net debt, which includes the borrowings and bank balances and cash and the Commission's capital and reserves disclosed in the statements of changes in equity.
Gearing ratioThe Group's overall management strategy is to maintain the gearing ratio at a minimum. On an annual basis, in line with Botswana Meat Commission Act (Cap 74:04) (As amended) Sections 13 and 14, the Commission sets aside funds for the redemption of borrowings from accumulated surplus.
Notes To The Consolidated And Separate Financial Statements | Continued31 December 2015
19. FINANCIAL INSTRUMENTS
19.1 Capital risk management
19.2 Categories of financial instruments
Consolidated Commission
2014P'000
2014P'000
2015P'000
2015P'000
601,282 (24,167)
577,115
(113,132)
510%
664,073 (158,814)505,259
212,362
238%
664,073 (134,985)529,088
66,896
791%
923,954 (3,204)
920,750
(252,283)
365%
234,426
695,513
30,871
280
287,251
758,304
34,095
2,894
282,212
826,436
37,431
2,842
229,888
1,107,840
33,436
236
Debt (note 15)Cash and cash equivalents (note 14)Net debt (i)
Reserves (ii)
Net debt to reserves ratio
Financial assetsLoans and receivables at amortised cost
Financial liabilitiesOther liabilities at amortised cost
Finance costsFinancial liabilities at amortised cost
Finance incomeLoans and receivables
84

The Commission undertakes transactions denominated in foreign currencies. Foreign exchange rate exposures are managed through continuous dialogue with the bankers on the anticipated movement in the exchange rates. The carrying amounts of the Commission's foreign currency denominated assets and liabilities at the reporting date are as follows:
Consolidated Commission
2014P'000
2014P'000
2015P'000
2015P'000
Notes To The Consolidated And Separate Financial Statements | Continued31 December 2015
FINANCIAL INSTRUMENTS | CONTINUED 19.3 Foreign currency risk management
8,441 7,556
161 - - -
16,158
16,048 1,490 6,217
- - -
23,755
16,048 1,490 6,217
22,856 39,656 10,700 96,967
8,441 7,556
161 19,453 31,175 10,478 77,264
South African Rand trade payables United States Dollar trade payables Great Britain Pound trade payables Great Britain Pound payables (related parties) United States Dollar payables (related parties) South African Rand payables (related parties)
60,114 27,714 24,785 64,670
- -
177,283
16,363 6,352
12,768 55,931
- -
91,414
16,363 6,352
12,768 55,931 13,864 13,416
118,694
60,114 27,714 24,785 64,670
- 18,490
195,773
South African Rand trade receivables British Pound trade receivables United States Dollar trade receivables Euro trade receivables South African Rand receivables (related parties) British Pound receivables (related parties)
79,428
25,520
4,691
80,640 190,279
69,092
29,268
10,786
96,885 206,031
-
-
-
- -
-
-
-
- -
Net Assets of Table Bay Cold Storage South Africa (ZAR) Net Assets of Botswana Meat Commission Guernsey (GBP) Net Assets Of Botswana Meat Commission United Kingdom (GBP) Net Assets of Allied Meat Insurance Cayman Islands (GBP)
85

Foreign currency sensitivity analysisThe following table details the Group's sensitivity to a 5% increase or decrease in Botswana Pula rate against the currencies the Group is exposed to. 5% is the most likely change in exchange rates as assessed by the Commission's management. A positive number below indicates a increase in profit/decrease in loss where the Pula strengthens against the foreign currency. For a 5% weakening of the Pula against the foreign currencies, there would be an equal and opposite impact on the profit/loss and the balances below would be negative.
19.4 Interest rate riskThe Group is exposed to movements in interest rates because it has overdraft facilities and borrowings bearing interest rates which are linked to the prime lending rate. If interest rates were 1% lower and all other variables were held constant, the Group's profit would increase as shown below. For a 1% increase in interest rates there would be an equal and opposite impact on the profit and the balances would be negative.
Credit risk refers to the risk that a counterparty will default on its contractual obligations resulting in financial loss to the Group. The Group has adopted a credit policy of only dealing with creditworthy counterparties and obtaining sufficient collateral, where appropriate, as a means of mitigating the risk of financial loss from defaults. Credit exposure is controlled by credit limits that are reviewed and approved by management. Ongoing credit evaluation is performed on the financial condition of accounts receivable and, where appropriate, credit guarantee from reputable financial institutions is obtained. There are no significant debtors that are past due that have not been included in the allowance for doubtful debts.
Consolidated Commission
2014P'000
2014P'000
2015P'000
2015P'000
Notes To The Consolidated And Separate Financial Statements | Continued31 December 2015
8,056
9,514
3,383
10,302
1,086
-
5,925
-
Profit or loss
Equity
4,116 1,122 1,407 4,098Profit or loss
24,167 181,237
22,900 -
6,122 234,426
158,814 127,135
- -
1,302 287,251
134,985 118,814
- 27,280
1,133 282,212
3,204 179,600
22,900 18,490
5,694 229,888
Bank balances Trade receivables Receivables from the Government of Botswana Amounts due from group companies Other receivables
19.5 Credit risk
The gross maximum exposure to credit risk is as follows:
86

20.1 Services charges Management fees - Botswana Meat Commission (UK) Holdings Limited Storage expenses - Table Bay Cold Storage (Proprietary) Limited Management fees - Table Bay Cold Storage (Proprietary) Limited Management fees - Mainline Carriers Botswana (Proprietary) Limited 20.2 Interest paid Allied Meat Insurance Company Limited, Cayman Islands BMC UK Holdings Limited
19.6 Liquidity risk management
Ultimate responsibility for liquidity risk management rests with the Board of Commissioners, which has built an appropriate liquidity risk management framework for the management of the Group's short, medium and long term funding and liquidity management requirements. The Group manages liquidity risk by maintaining adequate reserves, banking facilities and reserve borrowing facilities, by continuously monitoring forecast and actual cash flows and matching the maturity profiles of financial assets and liabilities. Included in note 15 are the details of the overdraft facility that the Group has at its disposal to further reduce liquidity risk. The Government of Botswana provides funding to the Group and Commission when the need arises.
The expected undiscounted cash outflows related to borrowings are disclosed in note 15.2. The rest of the Group's financial liabilities are short term and expected to be settled at their book value within the next financial year.
20. RELATED PARTY TRANSACTIONS AND BALANCES
The related parties of the Commission are the Government of Botswana, its subsidiaries as disclosed in Note 10 and the Commis-sioners and senior management. The following related party transactions were entered into:
Commission
2014P'000
2015P'000
Notes To The Consolidated And Separate Financial Statements | Continued31 December 2015
(4,342)(7,714)(2,728)
260 (14,524)
(3,036)(390)
(3,426)
(5,008)(5,054)(2,178)
240 (12,000)
(1,829)(810)
(2,639)
The gross maximum exposure to credit risk is as follows:
87
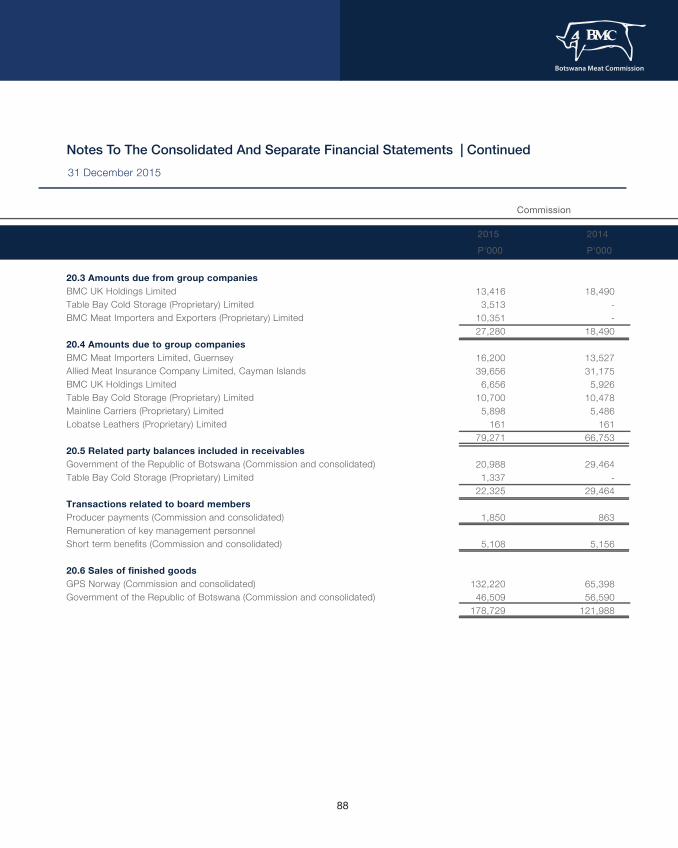
20.3 Amounts due from group companies BMC UK Holdings Limited Table Bay Cold Storage (Proprietary) Limited BMC Meat Importers and Exporters (Proprietary) Limited 20.4 Amounts due to group companies BMC Meat Importers Limited, Guernsey Allied Meat Insurance Company Limited, Cayman Islands BMC UK Holdings Limited Table Bay Cold Storage (Proprietary) Limited Mainline Carriers (Proprietary) Limited Lobatse Leathers (Proprietary) Limited 20.5 Related party balances included in receivables Government of the Republic of Botswana (Commission and consolidated) Table Bay Cold Storage (Proprietary) Limited Transactions related to board members Producer payments (Commission and consolidated) Remuneration of key management personnel Short term benefits (Commission and consolidated) 20.6 Sales of finished goods GPS Norway (Commission and consolidated) Government of the Republic of Botswana (Commission and consolidated)
Commission
2014P'000
2015P'000
Notes To The Consolidated And Separate Financial Statements | Continued31 December 2015
13,416 3,513
10,351 27,280
16,200 39,656
6,656 10,700
5,898 161
79,271
20,988 1,337
22,325
1,850
5,108
132,220 46,509
178,729
18,490 - -
18,490
13,527 31,175
5,926 10,478
5,486 161
66,753
29,464 -
29,464
863
5,156
65,398 56,590
121,988
88

21.1 Cash used in operations Operating surplus Adjustments for: Depreciation of property, plant and equipment Depreciation of investment property Impairment of property, plant and equipment Fair value adjustment for biological assets Loss on disposal of property, plant and equipment Other movements in reserves Government financing obtained Share of profit of associates Pension fund obligation income Movements in working capital Decrease/(increase) in biological assets Decrease in inventories (Increase)/decrease in amounts due from group companies Decrease/(increase) in trade and other receivables (Decrease)/increase in trade and other payables Increase in amounts due to group companies Cash used in operations
21. NOTES TO THE STATEMENTS OF CASH FLOWS
Notes To The Consolidated And Separate Financial Statements | Continued31 December 2015
361,550
57,093 191-
(22,194)34 -
(600,000)(1,413)
- (204,739)
17,381 17,883
- 12,800 (2,802)
- 45,263
(159,476)
33,163
30,508 29
8,344 (4,758)1,068
- - -
(138,067)(69,713)
(54,069)35,915
- (52,926)70,817
- (262)
(69,975)
359,022
51,809 - -
(22,194)34 -
(600,000)- -
(211,329)
17,381 17,977 (8,790)
23,552 (4,634)
12,518 58,004
(153,325)
27,747
29,766 -
8,344 (4,758)1,090
(167)- -
(138,067)(76,0456)
(54,069)35,915 15,620 (73,423)76,972
8,672 9,687
(66,358)
Consolidated Commission
2014P'000
2014P'000
2015P'000
2015P'000
89

22.1 Contingent liabilitiesClaims instituted by Feedmaster Botswana for damages and interest at the rate of 10% per annum for alleged breach of Commission's obligationsClaims instituted by Northern Ranching Botswana for damages due to alleged breach of Commission's obligationsBond of surety covering outstanding liabilities under theBMC Staff Motor Vehicle Advance schemeGuarantees in respect of home loan advancesGuarantees from Standard Chartered Bank Botswana LimitedGuarantee by Standard Chartered Bank of Botswana Limitedin favour of Standard Chartered Bank LondonGuarantee in favour of TransnetGuarantee in favour of SkilpadshekGuarantee in favour of Ramatlabama customs officeCustoms and excise guarantee in South AfticaGuarantee to South African Revenue ServicesOther guarantees
21.2 Proceeds on disposal of property, plant and equipmentCostAccumulated depreciationNet carrying amountLoss on disposal of property, plant and equipmentProceeds on disposal
21.3 Effects of changes in foreign exchange rates
Property, plant and equipmentReservesInvestmentsDeferred tax
NOTES TO THE STATEMENTS OF CASH FLOWS | Continued
22. CONTINGENT LIABILITIES AND ASSETS
Notes To The Consolidated And Separate Financial Statements | Continued31 December 2015
1,553 (737)816 (34)
782
11,139 1,440
(22)(2,433)10,124
9,894 (8,092)1,802 (1,068)
734
1,274 (2,255)
- (134)
(1,115)
1,553 (737)816 (34)
782
- - - - -
9,599 (8,046)1,553 (1,090)
463
- - - - -
9,898 -
- -
14,160
37,060 752
- -
362 2,175
- 64,407
36,349 10,485
1,346 5,085
13,704
37,060 821 894
1,130 448 251 193
107,766
9,898 -
- -
14,160
37,060 - - - - - -
61,118
36,349 10,485
1,346 5,085
13,704
37,060 - - - - - -
104,029
Consolidated Commission
2014P'000
2014P'000
2015P'000
2015P'000
90

23. COMMITMENTS 23.1 Future capital expenditure Authorised but not yet contracted forCapital expenditure will be funded frominternally generated funds and external funding as necessary.
Future minmum lease receipts: Not later than one year Between one and five years
There are no material events that occurred after the financial year end to the date of approval of the financial statements that require additional disclosure in the financial statements.
22.2. Contingent assetsTax relief not yet receivedRefund by Government of losses incurred by Francistown abattoirCounter claim by BMC on the Feedmaster Botswana case
NOTES TO THE STATEMENTS OF CASH FLOWS | Continued
Notes To The Consolidated And Separate Financial Statements | Continued31 December 2015
- 82,176 95,886 18,379 196,441
72,495 - 51,216 18,379 142,090
- 82,176 95,886 18,379 196,441
72,495 - 51,216 18,379 142,090
Consolidated Commission
2014P'000
2014P'000
2015P'000
2015P'000
23.2 Operating lease commitments (payments)
Future minmum lease payments:Not later than one yearBetween one and five years
1,808 5,080 6,888
1,610 687 2,297
- - -
- - -
605 - 605
1,668 1,017 2,685
- - -
- - -
49,821 42,415 49,821 42,040
23.3 Operating lease commitments (receipts)
24. EVENTS AFTER THE REPORTING DATE
91
The Group and the Commission reported a total deficit for the year of P263 million (2014: P180 million) and P268 million (2014: P187 million), respectively, after eliminating the effect of funding received from Government of P600 million (2014: P23 million) and recognition of a gain of Pnil million (2014: P143 million) on conversion of the defined benefit fund to a defined contribution fund. The accumulated losses of the Group and Commission amount to P639 million (2014: P889 million) and P649 million (2014: P893 million), respectively. These conditions indicate the existence of a material uncertainty that casts significant doubt on the Group’s and Commission’s ability to continue as a going concern and to continue realising its assets and discharging its liabilities in the normal course of business.
The ability of the Group and Commission to continue as a going concern is dependent on a number of factors. The most significant of these is the commitment by the Government of the Republic of Botswana to continue its financial support to the Commission. In the current year, the Government of Botswana provided the entity with unconditional financial aid of P600 000 000 aimed at improving the Commission's financial situation. The Commission's going concern is also dependent on obtaining trade facilities and commercial loans from financial institutions.
The following initiatives have been undertaken by the Commission in order to improve its financial performance:
- Development of a three year strategy (2014 - 2017) to enhance the value chain of the Commission;- Establishment of regional markets; and- Increasing supply into the European Union market.
The Commission reported a surplus of P275 million for 2015 financial year (2014: a deficit of P21 million) and has accumulated losses of P649 million (2014: P893 million). Section 17 of the Botswana Meat Commission Act stipulates that it is the duty of the Commission so to exercise its functions and conduct its business as to ensure, taking one year with another, that its revenues are sufficient to enable the Commission to meet the outgoings of the Commission properly chargeable to the revenue account in terms of Section 14 of the Act. The Commission has not complied with the Act in this regard.
25. GOING CONCERN
26. COMPLIANCE WITH THE BOTSWANA MEAT COMMISSION ACT (74:04) (AS AMENDED)
Notes To The Consolidated And Separate Financial Statements | Continued31 December 2015
Consolidated Commission
2014P'000
2014P'000
2015P'000
2015P'000
92

Notes
93


