22
University of Alberta Department of Mechanical Engineering MecE 230 Seminar Pack Compiled by Morris R. Flynn, Larry W. Kostiuk and Andrew Martin 1

University of AlbertaDepartment of Mechanical Engineering
MecE 230 Seminar Pack
Compiled by Morris R. Flynn, Larry W. Kostiuk and Andrew Martin
1

MEC E 230Seminar A, Designing the HVAC system on a 30-passenger bus
Objective: To apply the concepts of control volumes and mass/energy conservation in the conceptualdesign of a real world mechanical system.
Background: In designing the HVAC system on a bus, it is worth noting that the bus can go anywherein the world. Therefore the local environmental conditions that play a role in human comfort, such asthe ambient temperature, T∞, are highly variable. By contrast, we wish to keep the cabin of the bus ata constant temperature of, say, 20◦C.
Questions:
1. [2 points] By considering a balance of chemical species, draw and label a control volume (CV)that is appropriate for designing only the bus air exchange system. Thus you should account forinflows, outflows, sources and sinks of O2, CO2, etc. for the open system that is the bus cabin.
2. [1 point] Assuming the air inside bus is fully mixed, is there any difference between the interiorconditions vs. the conditions measured at the outlet? (Yes/No)
3. [2 points] By considering energy conservation, draw and label a CV that is appropriate fordesigning only the cabin cooling system. (Cooling is necessary whenever Tinterior > 20◦C.) Includethe thermal contribution of the people on the bus, the bus motor, the A/C system and theenvironment (including the Sun).
4. [1 point] The design process typically considers, within reason, worst-case scenario(s). In thisspirit, is it preferable when designing the cabin cooling system to assume cloudy or sunny condi-tions? An air exchange fan that is on or off?
5. [2 points] By considering energy conservation, draw and label a CV that is appropriate fordesigning only the cabin heating system. (Heating is necessary whenever Tinterior < 20◦C.) Includethe thermal contribution of the people on the bus, the bus motor, the heating system and theenvironment (including the Sun).
6. [1 point] Is it preferable when designing the cabin heating system to assume cloudy or sunnyconditions? An air exchange fan that is on or off?
2

MEC E 230Seminar B, Mystery control volumes and balance equations
Objective: To apply the concepts of control volumes in identifying particular devices or pieces ofmechanical equipment.
Background: Different devices or pieces of mechanical equipment have different associated flows ofmass and energy. In this seminar, we will gain valuable practice in matching such devices/pieces ofequipment to their corresponding control volume (CV) diagrams.
Directions: For each of the CVs shown below, select from the following list that particular deviceor piece of mechanical equipment that is most likely operating inside that CV. Then write out expres-sions for conservation of mass and energy. In the diagrams below, arrows indicate the direction of massor energy flow into or out of the CVs.
Grading: 1 point per diagram.
Possible devices or mechanical equipment:
Electric air compressor Electric kitchen mixer RocketHeat exchanger Boiler Electric generatorBalloon Piston-cylinder Steam turbine
Diagram A: Device or equipment:
Diagram B: Device or equipment:
3

Diagram C: Device or equipment:
Diagram D: Device or equipment:
Diagram E: Device or equipment:
Diagram F: Device or equipment:
4

MEC E 230Seminar C, Revisiting J.P. Joule’s work
Objective: To apply the concepts of energy conservation in examining the conversion from work toheat.
Background: James Prescott Joule (1818-1889) was a pioneer in the field of thermodynamics andis credited for advancing the idea that work can be converted into heat. A schematic of one of Joule’smore famous experiments is given below. In this experiment, translational work associated with a fallingweight is converted into rotational shaft work, which is, in turn, turned into heat serving to increasethe temperature of the fluid inside the cavity. Joule sought to understand the relationship between thework applied to the fluid and the corresponding rise of fluid temperature.
Figure 1: A cartoon schematic of Joule’s experiment. Image source http://javiciencias.blogspot.ca/-2014/04/energy-heat-and-work.html
Equipment/materials:
Insulated cavity Drill Rotor Energy meter StopwatchThermometer Corn syrup Paper towels Funnel
Data:
• Corn syrup: cv = 3000 J/(kg K), ρ = 1380 kg/m3
• Water: cv = 4200 J/(kg K), ρ = 998 kg/m3
5

Time (s) Temperature (◦C)0255075100125150
• Corn syrup volume (L) =
• Voltage (V) =
• Average electrical current (A) =
Questions:
1. [2 points] Assume a 5 kg weight falling from a height of 12 m. The weight is dropped, causingthe paddlewheel to spin in 2.5 L of water. When the weight reaches the ground, the paddlewheelis disengaged from the spool and the weight is wound back up to 12 m. The paddlewheel is thenreattached and the weight is dropped again. Suppose that the weight is dropped a total of 16times. What will be the increase of the water temperature? Neglect sidewall heat loss and assumea perfect conversion of work to heat.
2. [1 point] Repeat the above calculation but now suppose that the working fluid is corn syrup, notwater.
3. [3 points] Using the data collected during the demonstration, plot ∆T (vertical axis) vs. time, t(horizontal axis). From the slope of the associated best fit line, estimate the rate of working onthe fluid, measured in Watts. How does this value compare to the electrical work supplied to thedrill? List one loss in the conversion of electrical work to rotational shaft work and one loss in theconversion of rotational shaft work to heat.
6

MEC E 230Seminar D, Heating and cooling by convection and conduction
Objective: To study cases where the lumped system approximation does and does not apply.
Background: In class, we learned that the lumped system approximation can be assumed only whenthe thermal resistance due to conduction is much less than that for convection. Because the thermal re-sistance due to conduction depends on the thermal conductivity, k, however, the validity of the lumpedsystem approximation strongly depends on the material of construction.
Equipment/materials1:
Large container Ice Copper sphere Plastic sphere StopwatchThermometer Thermocouples Thermocouple display Paper towels
Data:
• Copper: k = 400 W/(m·K), cv = 385 J/(kg·K), ρ = 8960 kg/m3
• Plastic: k = 0.4 W/(m·K), cv = 1500 J/(kg·K), ρ = 900 kg/m3
• Each sphere has a volume of 6.5× 10⁻⁵ m3
Results (copper sphere – cooling/heating):
Time (s) Text (◦C) Tint (◦C) Time (s) Text (◦C) Tint (◦C)
1Thermocouple display: Agilent, U1242A, True RMS Multimeter.
7

Results (plastic sphere – cooling/heating):
Time (s) Text (◦C) Tint (◦C) Time (s) Text (◦C) Tint (◦C)
Questions:
1. [1 point] How much heat must be removed from the copper sphere to reduce its temperaturefrom 20◦C to 0◦C? Repeat your calculation but now consider the plastic sphere. (Report youranswers as positive numbers).
2. [2 points] For each sphere and for both the cooling and the heating phases, draw curves showingText and Tint vs. time. Thus you should produce four figures total, each having two curves. (Becareful not to spend too much time on this part).
3. [1 point] Why does the copper sphere cool/heat faster than its plastic counterpart?
4. [1 point] Why, for both spheres, does cooling occur more quickly than heating?
5. [1 point] For which sphere does the lumped system approximation more reasonably apply?
8
MEC E 230Seminar E, Viscosity of fluids
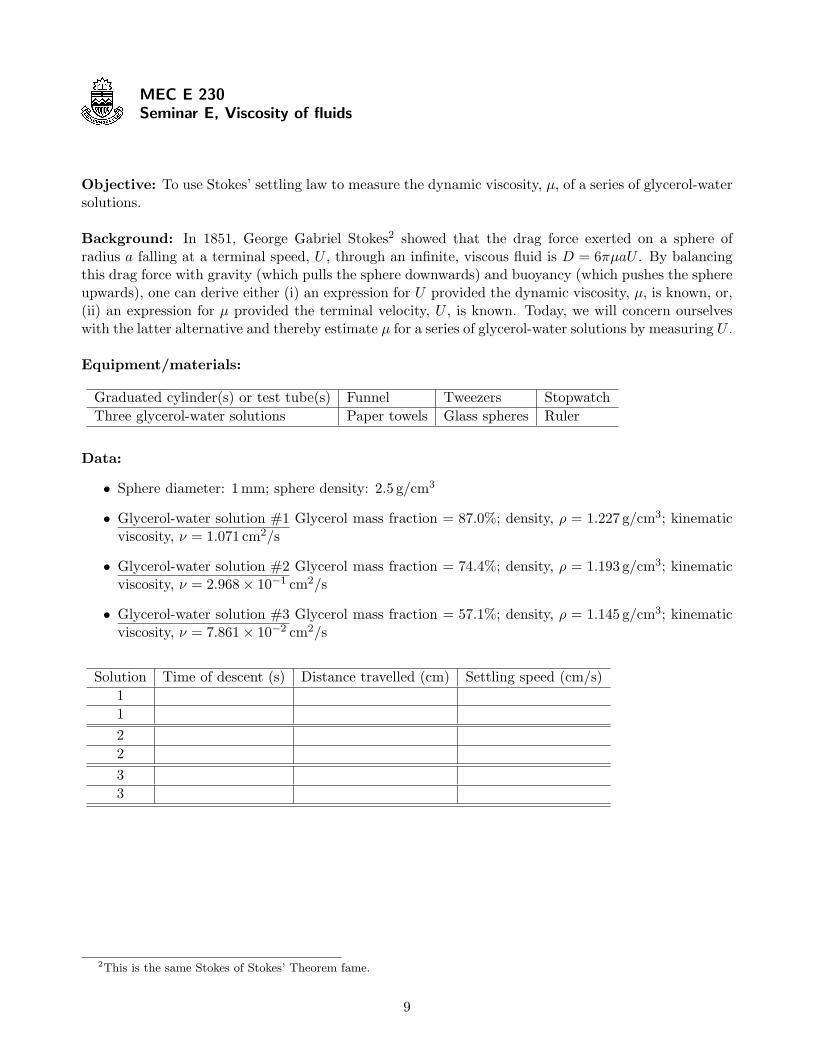
Objective: To use Stokes’ settling law to measure the dynamic viscosity, µ, of a series of glycerol-watersolutions.
Background: In 1851, George Gabriel Stokes2 showed that the drag force exerted on a sphere ofradius a falling at a terminal speed, U , through an infinite, viscous fluid is D = 6πµaU . By balancingthis drag force with gravity (which pulls the sphere downwards) and buoyancy (which pushes the sphereupwards), one can derive either (i) an expression for U provided the dynamic viscosity, µ, is known, or,(ii) an expression for µ provided the terminal velocity, U , is known. Today, we will concern ourselveswith the latter alternative and thereby estimate µ for a series of glycerol-water solutions by measuring U .
Equipment/materials:
Graduated cylinder(s) or test tube(s) Funnel Tweezers StopwatchThree glycerol-water solutions Paper towels Glass spheres Ruler
Data:
• Sphere diameter: 1 mm; sphere density: 2.5 g/cm3
• Glycerol-water solution #1 Glycerol mass fraction = 87.0%; density, ρ = 1.227 g/cm3; kinematicviscosity, ν = 1.071 cm2/s
• Glycerol-water solution #2 Glycerol mass fraction = 74.4%; density, ρ = 1.193 g/cm3; kinematicviscosity, ν = 2.968× 10⁻¹ cm2/s
• Glycerol-water solution #3 Glycerol mass fraction = 57.1%; density, ρ = 1.145 g/cm3; kinematicviscosity, ν = 7.861× 10⁻² cm2/s
Solution Time of descent (s) Distance travelled (cm) Settling speed (cm/s)112233
2This is the same Stokes of Stokes’ Theorem fame.
9

Questions:
1. [1 point] Draw a free body diagram showing the three forces (drag, gravity and buoyancy) actingon a sphere falling at its terminal velocity.
2. [2 points] By balancing the forces from Question 1, derive the following expression for µ:
µ =2a2g
9U(ρs − ρ) , (1)
where ρs and ρ are the respective densities of the sphere and ambient fluid. Hint: As we will learnlater in this course and as Archimedes demonstrated over two thousand years ago, the buoyancyforce is given by Fb = V gρ where V is the volume of the sphere.
3. [2 points] Based on your measured data, estimate µ for each glycerol-water solution. How do yourmeasurements compare with the data from the previous page? (Recall that the kinematic anddynamic viscosities are related via ν = µ/ρ.) Use the following formula to compute a percentageerror for each of your three solutions:
Percentage error =|µeqn. 1 − µdata table|
µdata table× 100% . (2)
4. [1 point] Stokes’ equation applies for a sphere falling through an infinite ambient. Is this conditionsatisfied here? What influence might be exerted by the side-walls of the graduated cylinder ortest tube?
10

MEC E 230Seminar F, Surface tension of fluids
Seminar under development
11

MEC E 230Seminar G, The coiled manometer
Objective: To use our knowledge of hydrostatics to explain counterintuitive flow behavior in a coiledmanometer.
Equipment/materials:
Circular plastic bucket Cardboard tube Clear plastic tubing FunnelElectrical tape 1 L beaker or Erlenmeyer flask Food coloring
The plastic tubing should be wrapped around the outside of the bucket/tube at least five times andshould be affixed to the bucket/tube using the electrical tape.
Observations: We expect the fluid poured into the (elevated) funnel to drain out the other end of thetubing. This expectation is realized when using the cardboard tube, but not the circular plastic bucketwhere, instead, the fluid overflows the funnel. The figure, discussion and questions below will help toexplain this unexpected outcome.
Figure 2: A manometer with tubing in the shape of a sinusoid.
Discussion: Wrapping the tubbing around the bucket/tube forms, in essence, a sinusoidal shape asshown in figure 2. When the second loop begins to fill, the air path from the first loop to the outlet ofthe tubing becomes blocked off. Moreover the pressure of the air bubble that appears between points band c becomes larger than atmospheric pressure, patm. (For simplicity, we assume that patm = 0 below;we further assume that ρair = 0). As a consequence Hd > Hc where, for instance, Hc indicates theheight of point c, measured relative to the floor, say. If any water flows into the third loop, the processis repeated. Eventually, this buildup of pressure causes the water to back up in the first loop and flowout of the funnel.
12

Questions:
1. [1 point] If pa = patm = 0, what is the pressure at point b, pb? Assume that the elevations ofpoints a and b are Ha and Hb, respectively.
2. [2 points] Derive two expressions for pc, one by relating pc to pb and the other by relating pc topd = patm = 0.
3. [1 point] Using your results from Questions 1 and 2, what is the relationship between Ha−Hb
and Hd −Hc?
4. [1 point] On the basis of your calculations, which condition is associated with overflow?(a) Ha −Hb > Hd −Hc
(b) Ha −Hb < Hd −Hc
13
MEC E 230Seminar H, Buoyancy and floating sports balls
Objective: To estimate the density of common sports balls using principles of buoyancy.
Background: By measuring the depth of submersion of an object floating at a free surface, it isstraightforward to estimate the density of said object. Here we apply this idea in computing the densityof three familiar sports balls.
Equipment/materials:
Golf ball Ping pong ball Tennis ballSmall aquarium Ruler Paper towels
Data:
Sports ball Mass (g) Diameter (inches) Depth of submersion (cm)Golf ball 44.28 1.685Ping pong ball 2.32 1.480Tennis ball 58.59 2.534
Fluid 1
Fluid 2
V
V2
1
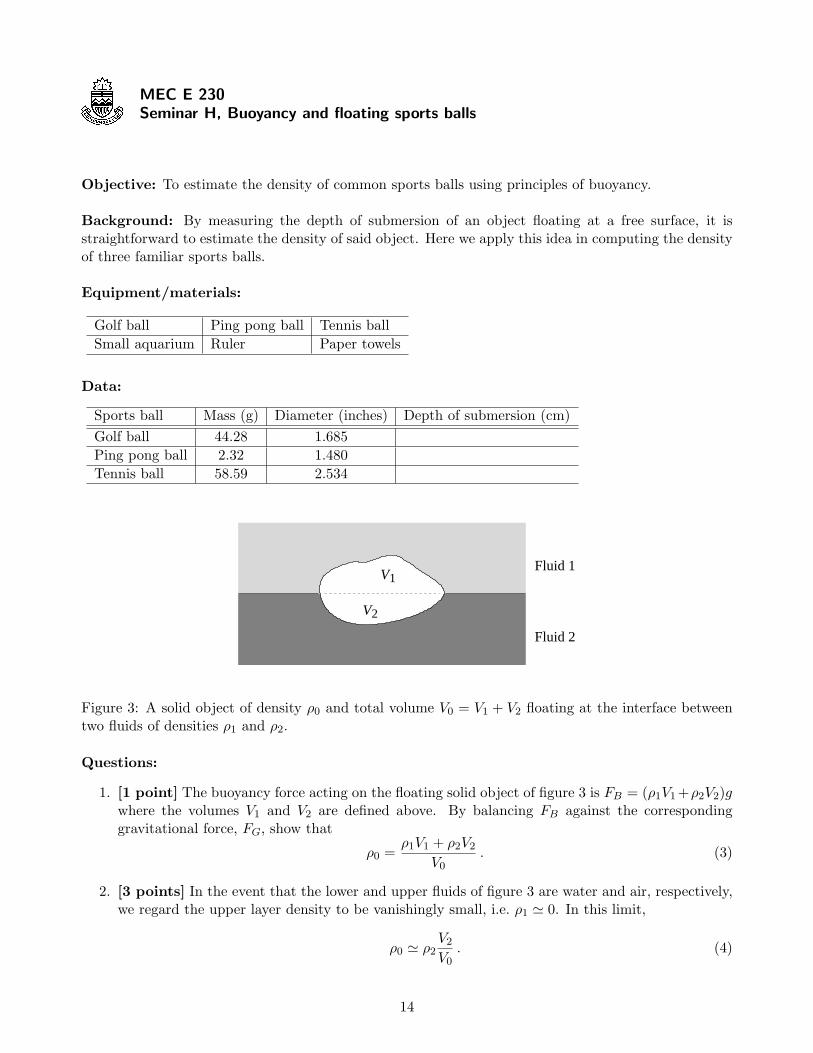
Figure 3: A solid object of density ρ0 and total volume V0 = V1 + V2 floating at the interface betweentwo fluids of densities ρ1 and ρ2.
Questions:
1. [1 point] The buoyancy force acting on the floating solid object of figure 3 is FB = (ρ1V1 +ρ2V2)gwhere the volumes V1 and V2 are defined above. By balancing FB against the correspondinggravitational force, FG, show that
ρ0 =ρ1V1 + ρ2V2
V0. (3)
2. [3 points] In the event that the lower and upper fluids of figure 3 are water and air, respectively,we regard the upper layer density to be vanishingly small, i.e. ρ1 ' 0. In this limit,
ρ0 ' ρ2V2
V0. (4)
14

Estimate V2/V0 for each of the three sports balls3. Then, assuming ρ2 = 0.9982 g/cm3, estimateρ0 for each of the three sports balls also.
3. [1.5 points] Compute the density of each of the three sports balls using the data provided intabular form above. How do these values compare to your results from Question 2? In eachcase, calculate a percentage error using the following formula:
Percentage error =|ρeqn. 1 − ρdata table|
ρdata table× 100% . (5)
4. [0.5 points] From Question 3, we note that the percentage error can be large in the case ofobjects that are small and light. Which of the following fluid properties is most likely responsiblefor this discrepancy: surface tension, dynamic viscosity or kinematic viscosity?
3Hint: See http://keisan.casio.com/exec/system/1223382199, http://www.onlineconversion.com/object volume
partial sphere.htm and/or http://mathworld.wolfram.com/SphericalCap.html.
15

MEC E 230Seminar I, Density of fluids
Objective: To examine the influence of density differences in the context of density-driven exchangeflow.
Background: In Seminar E, we derived an expression for the Stokes settling speed by balancingforces. Today, we will consider an example of density-driven flow and derive an expression for speedbased on a balance of energy, rather than a balance of forces. Density-driven flow occurs in very manynatural and industrial settings and describes, for instance, the draft of cold air that rushes into yourhome when you open your front door in winter months. Here we will study the manner in which densitydifferences set the front speed of a density-driven flow. Our analysis will consider data collected from anumerical simulation rather than from a bench-scale experiment. (You will learn more about numericalmodeling later on e.g. in MecE 390).
U
U
ρ1b
b
H
(a) (b)
1ρ2ρ
2ρ
Figure 4: Density-driven exchange flow. (a) The initial instant, t = 0. (b) t = ∆t > 0.
Questions:
1. [2 points] The above figures show the evolution of a density-driven exchange flow where the(constant) front speed of the upper and lower gravity currents in figure 4 b is U . In contrastingpanels (a) and (b), it can be shown that the fluid of density ρ1 gains potential energy in the amount12b
2ρ1gU∆t where g is gravitational acceleration and ∆t is the time increment. The correspondinggain of kinetic energy is 1
2bρ1U3∆t. Conversely, the fluid of density ρ2 gains kinetic energy in
the amount 12bρ2U
3∆t but loses potential energy in the amount 12b
2ρ2gU∆t. By balancing theseterms, show that the front speed is given by
U = 12
√g′H . (6)
Here g′ = 2g(ρ2 − ρ1)/(ρ2 + ρ1) ' g(ρ2 − ρ1)/ρ1, where, in writing the latter expression, we haveassumed that ρ2 − ρ1 is much less than either ρ1 or ρ2.
2. [2 points] Using (6) and the data shown in tabular form below, estimate ρ2 if ρ1 = 1.00 g/cm3
and H = 20.0 cm. (As regards the tabulated data, you should plot these and determine the slopeof the corresponding best fit line). Note that in the numerical simulation, ρ2 is set to 1.02 g/cm3,which gives you an indication of the accuracy of (6). Note also that the data corresponds to thenumerical simulation shown at http://websrv.mece.ualberta.ca/mrflynn/case306.avi.
16

3. [1 point] Comment on the difference between the image presented in figure 4 b vs. the flow realizedby numerical simulation. In the latter case, what evidence do you have that the flow is turbulent?
Data:
Time (s) Front position (cm)0.0 0.02.5 20.35.0 43.07.5 64.810.0 86.912.5 108.215.0 130.317.5 151.820.0 173.222.5 194.7
17

MEC E 230Seminar J, Tank draining 1
Objective: To evaluate the time required for a tank to drain under its own hydrostatic force.
Background: The draining and filling of storage tanks is a frequent operation in many industrialprocesses. Here, we study the former scenario. Attention is first given to Case 1, indicated schemat-ically below, in which water drains through a rounded-edged orifice located in the bottom surface.Frictional effects are in this case minimal. We will then investigate the siphon system of Case 2 andestimate whether frictional effects are likewise negligible for that flow also.
h
Air
Water
ve
Case 1 Case 2
ve
Figure 5: Tank draining without (Case 1) and with (Case 2) a siphon.
Equipment/materials:
Bucket Beaker Acrylic tank with a rounded-edged orifice RulerStopper Paper towels Siphon tube (58 cm long) Stopwatch
Data:
Item Symbol DiameterAcrylic tank D 12.4 cmRounded-edged orifice d 0.77 cmSiphon tube dt 0.25 inch
• Time required for the free surface to drop from 15 cm to 5 cm (Case 1):
• Time required for the free surface to drop from 15 cm to 5 cm (Case 2):
18

Questions:
1. [1 point] Bernoulli’s equation describes the flow of a fluid that is isothermal, incompressible andinviscid. Under steady conditions, Bernoulli’s equation can be written as
p1
ρ+ 1
2v21 + gz1 =
p2
ρ+ 1
2v22 + gz2 , (7)
where p is the fluid pressure, ρ is the fluid density, v is the fluid velocity, g is gravitationalacceleration and z is the elevation. With reference to the left-hand side panel of figure 5, supposethat Point 1 is located immediately below the free surface. Then p1 ' patm, z1 = h and v1 ' 0because the rate of descent of the free surface is small. Suppose also that Point 2 is locatedimmediately below the opening so that p = patm and z2 ' 0. Show that v2 =
√2gh.
2. [1 point] Again with reference to the left-hand side panel of figure 5, show that the water levelin the tank is given by the solution of the following ode:
dhdt
= −√
2ghd2
D2(8)
(d and D are defined in the latter table from page 1).
3. [3 points] By integrating (8), estimate the amount of time required for the free surface to fallfrom an elevation of 15 cm to an elevation of 5 cm. Using the following formula, compute thepercentage error with the corresponding measured value:
Percent error =|tpredicted − tmeasured|
tpredicted× 100% . (9)
Provide one possible reason for the deviation between theory and measurement.
4. [3 points] Now consider the right-hand side panel of figure 5. If we neglect frictional losses inthe siphon tube, the analogue of (8) reads
dhdt
= −√
2ghd2
t
D2. (10)
On this basis, estimate the time for the interface to fall from 15 cm to 5 cm and also compute apercentage error using (9). Is your error larger or smaller than before?
5. [2 points] Friction losses can be incorporated in Bernoulli’s equation by adding a right-hand sidedissipation term, i.e.
p1
ρ+ 1
2v21 + gz1 =
p2
ρ+ 1
2v22 + gz2 + 1
2
fL
dtv22 , (11)
where L = 58 cm is the siphon tube length and f (' 0.1) is called the friction factor. In this case,(10) is replaced by
dhdt
= −√
2gh
1 + fLdt
d2t
D2. (12)
Estimate the new time for the interface to fall from 15 cm to 5 cm for the Case 2 experiment andcompute a new percentage error using (9).
19

MEC E 230Seminar K, Tank draining 2
Objective: To evaluate the time required for a tank to drain under its own hydrostatic force and toestimate the impact of minor losses in piping systems.
Background: The draining and filling of storage tanks is a very frequent operation in industrialprocesses. Here we will study the former scenario whereby the liquid exiting the tank flows througha long pipe of radius a and length L. A laminar flow will be assumed. We will furthermore neglectentrance and exit losses corresponding, respectively, to the points i and e, in figure 6. For example, anentrance loss is associated with the “traffic jam” of fluid particles trying to squeeze into the relativelysmall cross-sectional area of the pipe. Under the above assumptions, it can be shown that the volumeflux in the pipe is given by
Q =πa4
8µ
(−dp
dx
), (13)
where µ is the dynamic viscosity and
−dpdx' pi − patm
L(14)
is the pressure gradient in which pi is the pressure at the pipe inlet.
h
Q
waterair
ie
Figure 6: Tank draining from a long pipe.
Equipment:
Acrylic tank (rectangular cross-section) Acrylic pipe BucketMeasuring tape Stopwatch Stopper
20

Data:
• Water density: ρ = 998.2 kg/m3
• Water dynamic viscosity: µ = 1.003× 10⁻³ kg/(m·s)
• Pipe inner diameter: 2a = 0.635 cm
• Tank interior dimensions: 13.3 cm×13.3 cm
• Pipe length, L:
• Time, ∆t, required for free surface to fall from h1 = 20 cm to h2 = 10 cm:
Questions:
1. [2 points] Using your knowledge of hydrostatics and mass conservation, show that the height, h,of the free surface relative to the mid-plane of the pipe satisfies the following ODE:
dhdt
= −πa4ρgh
8µLAc. (15)
2. [2 points] By integrating (15) show that
∆t =8µLAc ln(h1/h2)
πa4ρg. (16)
3. [1 point] Explain why ∆t increases as L increases.
4. [1 point] Compare (∆t)theoretical and (∆t)experimental. On the basis of this comparison, was itappropriate to neglect minor losses at the inlet and exit of the pipe?
21

MEC E 230Seminar L, Deflecting jet
Objective: To determine the force exerted by a high-pressure jet as a function of the profile of thedownstream shape.
Background: Designers of vehicles and planes minimize drag by selecting streamlined shapes. Todaywe will study such effects by examining the force that is exerted on a non-streamlined and streamlinedshape by a high-pressure jet of compressed air. According to theory, this force is given by
FNS = 2mV FS =(
1− 1√2
)mV , (17)
for the non-streamlined and streamlined shape, respectively. Here m is the jet mass flux at the nozzleexit and V is the corresponding jet velocity. The latter quantity is given by
V =√γRT , (18)
where γ is the ratio of specific heats, i.e. γ = cp/cv, R is the gas constant and T is the temperatureat the nozzle exit. For air, γ = 1.4, R = 287 m2/(s2K) and T = 0.833T0 in which T0 = 20◦C is thetemperature of the air in the compressed air cylinder. Conversely,
m = 0.634p0
RT0· π
4d2 · V , (19)
in which p0 = 100 psi (gage) is the pressure of the air in the compressed air cylinder and d = 3.13 mmis the nozzle diameter.
Equipment:
Compressed air cylinder, tubing and fittings Pressure gage Safety goggles PulleyNon-streamlined shape Streamlined shape Spring scale Nozzle
Data:
Shape Spring scale Force (N)reading (kg)
Non-streamlinedStreamlined
Questions:
1. [2 points] Show, using the equations and parameters summarized above that FNS = 9.00 N andFS = 1.32 N. Recall that in imperial units, atmospheric pressure is 14.7 psi (absolute), i.e. 1 psi=6.894 kPa.
2. [2 points] Compare the predictions of force made in Question 1 with your measured data.Provide one possible reason for any discrepancies observed.
22


