33
Thesis Summary Mechanical and Geophysical Characterization of Damage in Rocks By Ahmadreza Hedayat Nomination for the Rocha Medal 2015

Thesis Summary
Mechanical and Geophysical Characterization of
Damage in Rocks
By Ahmadreza Hedayat
Nomination for the Rocha Medal 2015

Abstract
The strength and deformation behavior of rocks are significantly influenced by the presence of
discontinuities and fractures in the rock mass. Shearing along pre-existing discontinuities is the most
common mode of failure in rock engineering, and shear strength along discontinuities plays a major
role in the stability of underground structures and rock slopes. One of the primary objectives of this
research is to better understand the mechanical and geophysical processes that take place during shear
failure of rock discontinuities. In this research, active seismic monitoring, particularly compressional,
P, and shear, S, wave propagation, was used to observe the dynamic processes occurring in
discontinuities impending shear failure. Seismic wave propagation and Digital Image Correlation
(DIC) were employed to investigate slip processes along frictional discontinuities. Direct shear
experiments were performed on gypsum, used as a rock-model material, and on Indiana Limestone
specimens. The gypsum specimens were composed of two blocks with perfectly mated contact
surfaces. In the experiments, the normal stress across the frictional surface was applied first and then
the shear load was increased with a constant displacement rate until failure. Compressional and shear
wave pulses were transmitted through and reflected off the discontinuity while digital images of the
specimen surface were acquired during the test.
A distinct peak in the amplitude of transmitted waves and a marked decrease in the amplitude of
reflected waves occurred prior to the peak shear strength of a discontinuity. These observations were
identified as “seismic precursors” to the failure of the discontinuity. Seismic precursors were observed
well before slip, or failure, occurred along the discontinuity. The sequence of precursors observed
while shearing indicated that along the non-homogeneous contact surface, slip initiated from the
surface with low frictional strength and extended to the surface with the higher frictional strength.
Precursors were associated with an increase in the rate of relative displacement across the discontinuity
(from DIC) and were a measure of the reduction of the fracture’s shear stiffness (from wave
propagation). The observed changes of amplitude of transmitted and reflected waves provided a
mechanism for determining if slip along a discontinuity had occurred or was about to occur. This
finding has numerous potential applications. It is a tool that can be used to assess the state of stress in
discontinuities; it can also be used to detect discontinuities and damage inside materials; and it has the
potential for having predictive capabilities for early warning of failures (e.g., earthquakes) and other
instabilities due to shear failure.

1
1. Introduction
The mechanical and hydraulic properties of rocks are often controlled by the discontinuities or joints
present in the rock mass. The strength, shape, number, and size of the contacts between the joint
surfaces control the mechanical behavior of the joint surfaces, and the aperture influences the hydraulic
properties of rock joints (Brady and Brown 2004; Jaeger et al. 2007). Pre-existing discontinuities in a
rock mass are seldom subjected to tensile loading, but rather are subjected to compressive loading,
shear loading, or both. Shearing, as the common mode of failure in rock engineering, has been
extensively studied by many researchers, such as Ladanyi and Archambault, 1969; Jaeger, 1971;
Barton, 1972, 1973; Barton and Choubey, 1977; Byerlee, 1978; Dieterich, 1979, and Jaeger et al.,
2007.
The shear strength of rock joints mainly depends on the level of effective normal stress applied on the
plane of sliding, the rock type, the roughness of the joint surface, the size of the joint (scale effect),
and the environmental conditions (e.g., presence of water and pore pressure) (Byerlee 1978; Brady and
Brown 2004; Jaeger et al. 2007; Hoek 2007). The shear resistance along a joint surface may not be
uniform because of the existence of zones with low and high frictional properties. These zones may
transfer excess load to adjacent areas as their frictional resistance is exceeded. Therefore, failure or slip
may occur in a progressive manner and well before the full frictional strength is mobilized along the
entire surface of the discontinuity (Comninou and Dundurs 1983; Gorbatikh et al. 2001; Malanchuk
2011). Slip may initiate from a region of low frictional resistance and spread asymmetrically to regions
with higher resistance resulting in non-uniform normal and shear stress distributions along the
discontinuity.
Variation of frictional strength along a joint or fault, non-uniform stress field, inelastic deformations
near fault terminations, and variation of elastic modulus of the host rock may cause non-uniform slip
distributions (Burgmann et al. 1994). Detailed examination of small faults has shown that the fault
thickness and its structure are not likely to be uniform along the strike of the fault (Burgmann et al.
1994). Also, as mentioned, the shear and normal stresses may not be uniform along the fault. In
moderate earthquakes, the size of the nucleation region in faults has been found to be orders of
magnitude smaller than the rupture surface (Johnston et al. 1987, Lockner 1993). Therefore, it is likely
that slip nucleates at a certain point(s) rather than occurring simultaneously along the entire fault
(Martel and Pollard 1989). Slip distribution is commonly assumed to be symmetrical with respect to a
2
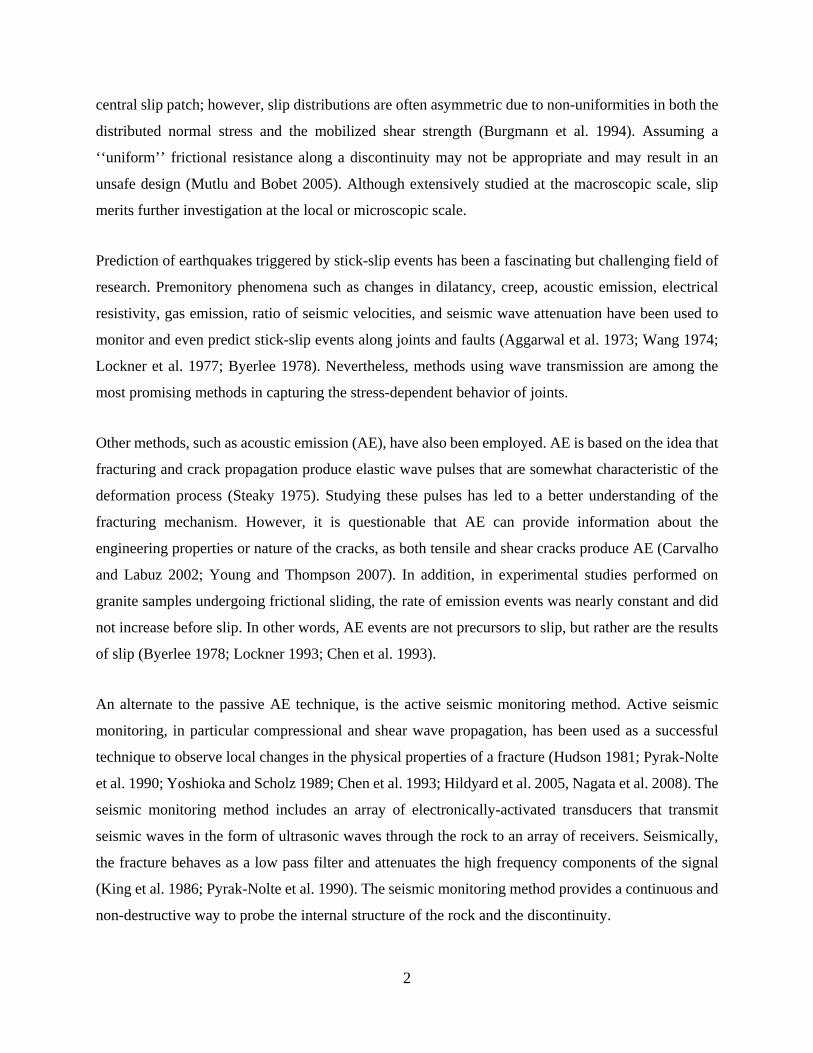
central slip patch; however, slip distributions are often asymmetric due to non-uniformities in both the
distributed normal stress and the mobilized shear strength (Burgmann et al. 1994). Assuming a
‘‘uniform’’ frictional resistance along a discontinuity may not be appropriate and may result in an
unsafe design (Mutlu and Bobet 2005). Although extensively studied at the macroscopic scale, slip
merits further investigation at the local or microscopic scale.
Prediction of earthquakes triggered by stick-slip events has been a fascinating but challenging field of
research. Premonitory phenomena such as changes in dilatancy, creep, acoustic emission, electrical
resistivity, gas emission, ratio of seismic velocities, and seismic wave attenuation have been used to
monitor and even predict stick-slip events along joints and faults (Aggarwal et al. 1973; Wang 1974;
Lockner et al. 1977; Byerlee 1978). Nevertheless, methods using wave transmission are among the
most promising methods in capturing the stress-dependent behavior of joints.
Other methods, such as acoustic emission (AE), have also been employed. AE is based on the idea that
fracturing and crack propagation produce elastic wave pulses that are somewhat characteristic of the
deformation process (Steaky 1975). Studying these pulses has led to a better understanding of the
fracturing mechanism. However, it is questionable that AE can provide information about the
engineering properties or nature of the cracks, as both tensile and shear cracks produce AE (Carvalho
and Labuz 2002; Young and Thompson 2007). In addition, in experimental studies performed on
granite samples undergoing frictional sliding, the rate of emission events was nearly constant and did
not increase before slip. In other words, AE events are not precursors to slip, but rather are the results
of slip (Byerlee 1978; Lockner 1993; Chen et al. 1993).
An alternate to the passive AE technique, is the active seismic monitoring method. Active seismic
monitoring, in particular compressional and shear wave propagation, has been used as a successful
technique to observe local changes in the physical properties of a fracture (Hudson 1981; Pyrak-Nolte
et al. 1990; Yoshioka and Scholz 1989; Chen et al. 1993; Hildyard et al. 2005, Nagata et al. 2008). The
seismic monitoring method includes an array of electronically-activated transducers that transmit
seismic waves in the form of ultrasonic waves through the rock to an array of receivers. Seismically,
the fracture behaves as a low pass filter and attenuates the high frequency components of the signal
(King et al. 1986; Pyrak-Nolte et al. 1990). The seismic monitoring method provides a continuous and
non-destructive way to probe the internal structure of the rock and the discontinuity.

3
This research aims to characterize experimentally the shearing mechanism along frictional
discontinuities. Because of its potential in observing local changes in a frictional surface, active seismic
monitoring is used in this research in an attempt to understand the shearing processes, in particular the
mechanisms of shearing and slip initiation and propagation along frictional discontinuities.
Within the broad scope identified above, the specific objectives of the research presented in this thesis
can be summarized as follows:
(a) Seismic monitoring of shearing. Geophysical methods have the potential, if linked with the
mechanics of the phenomena, to provide information regarding the state of stress along discontinuities
and their engineering properties, such as the fracture specific stiffness. Active seismic monitoring,
particularly compressional and shear wave propagation, have the potential for use as a premonitory
measure of the failure of discontinuities and may enable us to interrogate the interior of rock
discontinuities prior and during failure.
(b) Investigation of slip initiation and propagation along discontinuities. One of the most important
mechanisms for deformation and failure in rock masses is slip along pre-existing discontinuities or
fractures. Slip may not happen simultaneously along the entire discontinuity, and it may initiate from
a zone with minimal frictional resistance and propagate to areas with higher resistance. Seismic wave
propagation may provide spatial and/or sequential information about slip along the entire area of a
discontinuity.
(c) Multi-modal monitoring of slip along frictional discontinuities. Seismic wave propagation (i.e.,
seismic wave transmission and reflection) and Digital Image Correlation (DIC) may be useful in
monitoring slip initiation and propagation processes along discontinuities, particularly for investigating
the differences, if any, between processes and observations made on the surface and those made inside
the material.
(d) Investigation of the shearing mechanism for frictional discontinuities with cohesion. Mutlu (2005)
observed that the loss of cohesion and frictional weakening occur at different rates. Frictional
weakening requires much larger slip displacement than cohesional debonding. The research seeks to
understand the role played by cohesion in the shearing process along discontinuities.
4
The objectives discussed above were pursued through an extensive experimental program. First, a
biaxial compression apparatus was developed to couple seismic wave measurements with direct shear
testing. A number of direct shear experiments on gypsum specimens, used in this research as rock-
model material, with homogeneous and non-homogeneous contact surfaces, as well as on Indiana
limestone specimens, was completed to investigate the interplay that exists between seismic wave
transmission through an interface and the mechanics of shearing. Investigation of slip was carried out
by acquiring transmitted and reflected waveforms prior to and during failure of the specimens. A
deformation measurement system based on DIC was developed to evaluate the process of slip along
frictional discontinuities. DIC directly computes the full-field surface deformations by comparing the
digital images of the specimen surface acquired before and after deformation by using image
correlation principles. DIC was employed to monitor slip initiation and propagation processes along
frictional discontinuities impending shear failure and to compare the observations made on the surface
with those made in the interior of the specimen using wave propagation.
2. Direct Shear Experiments on Frictional Discontinuities
In order to investigate the slip process along frictional discontinuities, a series of direct shear
experiments was performed on gypsum specimens as well as natural limestone samples. This section
focuses on direct shear experiments conducted on gypsum with persistent and non-persistent
discontinuities. The section describes the experimental program used in this research and discusses the
details of the direct shear experiments including specimen preparation, experimental setup, and results.
2.1 Specimen Preparation
The material used for the investigation is gypsum, which has been extensively used as a rock-model
material in other studies (Einstein and Hirschfeld 1970; Reyes and Einstein 1991; Shen et al. 1995;
Bobet and Einstein 1998; Mutlu and Bobet 2006). Gypsum is used as the testing material because it
has rock-like properties, it results in reproducible samples, it can be prepared in a timely and
economical manner, and the experiment results can be easily compared with previous findings.
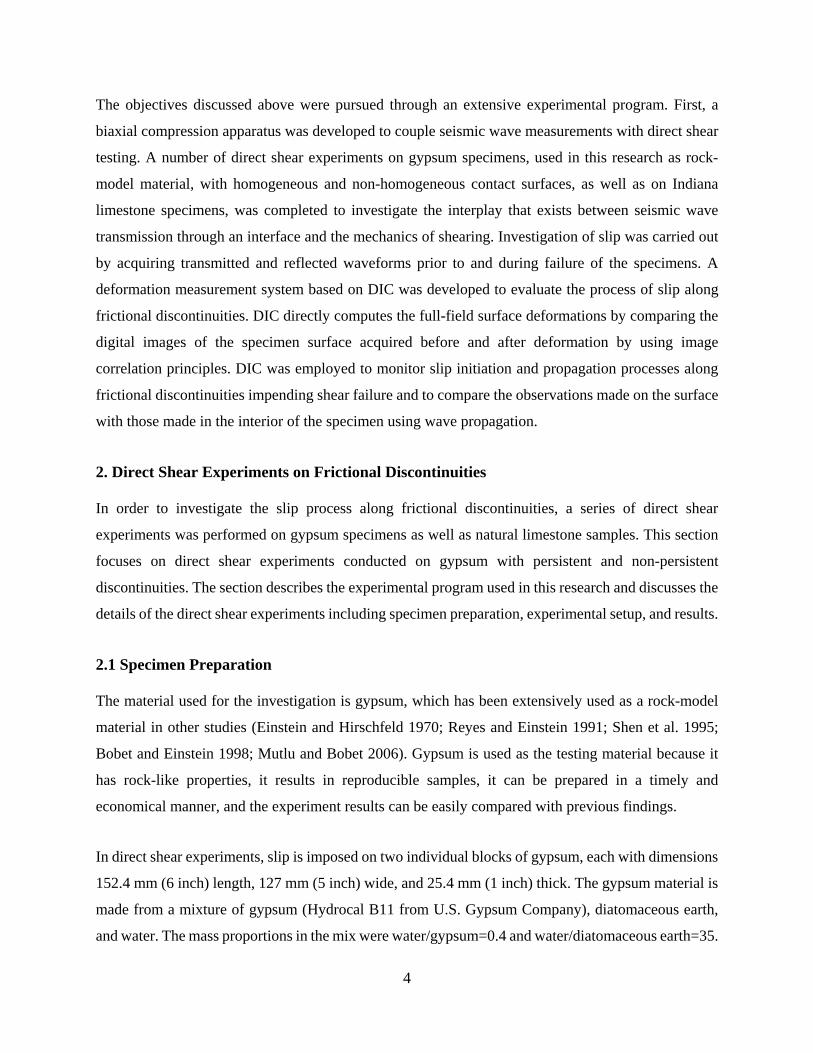
In direct shear experiments, slip is imposed on two individual blocks of gypsum, each with dimensions
152.4 mm (6 inch) length, 127 mm (5 inch) wide, and 25.4 mm (1 inch) thick. The gypsum material is
made from a mixture of gypsum (Hydrocal B11 from U.S. Gypsum Company), diatomaceous earth,
and water. The mass proportions in the mix were water/gypsum=0.4 and water/diatomaceous earth=35.

5
The diatomaceous earth is used to prevent bleeding of water during settling of the gypsum mixture.
The gypsum material is homogeneous and isotropic with the following average properties:
density=1560 kg/m3, uniaxial compressive strength=36 MPa, Young’s modulus=6 GPa, Poisson’s
ratio=0.15, average compressional wave velocity=3230 m/s, and average shear wave velocity= 1910
m/s.
The contact surfaces were made by casting gypsum against flat surfaces with different frictional
characteristics. Non-homogeneous contact surfaces consisted of a smooth surface with low frictional
strength (µ ~ 0.7) on the upper half and a rough surface with high frictional strength (µ ~ 1.2) on the
lower half. To produce the non-homogeneous contact surfaces, a smooth plastic sheet was placed on
the upper half of a mold and sandpaper, with grit #36 (530 µm), was placed on the lower half of the
mold. The mold was placed on a vibrating table after filling with gypsum and then vibrated for five
minutes to remove any entrapped air. Once the first gypsum block had hardened, a thin layer of mold
release agent (Product of Dow Corning) was applied on the surface and then the second block was cast
against the contact surface of the first block. This created a two-piece assembly with a perfectly mated
interface. The mold release agent prevented adhesion between the two blocks and vibration of each
single block and the two-block specimen assembly prevented any entrapped air inside the specimen.
After the specimen was taken out of the mold, it was stored at room temperature for 24 hours, and then
placed in an oven for curing at a temperature of 40˚ C for four days. After curing the specimen, the
sides of the gypsum specimen were carefully polished to obtain flat, smooth and perfectly planar
surfaces. The planar surfaces enabled uniform compression loading along the contact surface and
application of shear stress parallel to the interface, avoided any stress concentration, and ensured a
planar object surface for accurate image correlation.
Surface roughness measurements were made over the entire area of each contact surface in 0.25 mm
increments in two orthogonal directions using a surface roughness profilometer. Fig. 1a shows the
surface roughness for the smooth portion and Fig. 1b shows the rough portion of a discontinuity in a
non-homogeneous specimen. The maximum variation in the size of asperities for the smooth and rough
surface areas was ±0.1 mm and ±0.4 mm, respectively. The fabrication process created homogeneous
surfaces, where the roughness was approximately uniformly distributed across the surface.
6
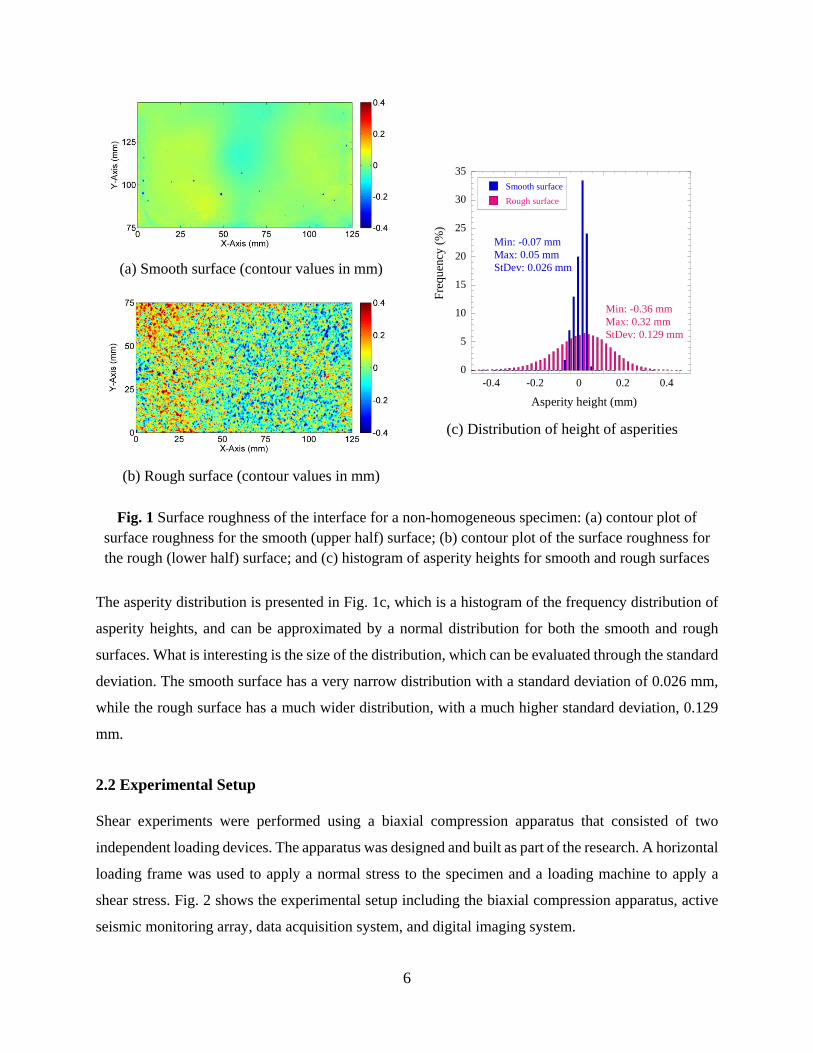
(a) Smooth surface (contour values in mm)
(b) Rough surface (contour values in mm)
(c) Distribution of height of asperities
Fig. 1 Surface roughness of the interface for a non-homogeneous specimen: (a) contour plot of surface roughness for the smooth (upper half) surface; (b) contour plot of the surface roughness for the rough (lower half) surface; and (c) histogram of asperity heights for smooth and rough surfaces
The asperity distribution is presented in Fig. 1c, which is a histogram of the frequency distribution of
asperity heights, and can be approximated by a normal distribution for both the smooth and rough
surfaces. What is interesting is the size of the distribution, which can be evaluated through the standard
deviation. The smooth surface has a very narrow distribution with a standard deviation of 0.026 mm,
while the rough surface has a much wider distribution, with a much higher standard deviation, 0.129
mm.
2.2 Experimental Setup
Shear experiments were performed using a biaxial compression apparatus that consisted of two
independent loading devices. The apparatus was designed and built as part of the research. A horizontal
loading frame was used to apply a normal stress to the specimen and a loading machine to apply a
shear stress. Fig. 2 shows the experimental setup including the biaxial compression apparatus, active
seismic monitoring array, data acquisition system, and digital imaging system.
0
5
10
15
20
25
30
35
-0.4 -0.2 0 0.2 0.4
Smooth surface
Rough surface
Fre
quen
cy (
%)
Asperity height (mm)
Min: -0.36 mmMax: 0.32 mmStDev: 0.129 mm
Min: -0.07 mmMax: 0.05 mmStDev: 0.026 mm

7
Fig. 2 Experimental setup including the biaxial compression apparatus, seismic array monitoring, and imaging system
Fig. 3a contains a photograph of the biaxial compression apparatus. The horizontal frame was
composed of a flatjack, loading platens that encase specimen and sensors, steel rods, steel balls, and
plates. The flatjack was placed behind the steel plate and, as it was pressurized, transmitted the pressure
to the loading plates and the specimen while the horizontal frame supported the reaction. A series of
steel balls or rollers was placed between the loading platen and the steel plate to minimize the vertical
friction and to ensure that the vertical load was resisted solely by the interface between the blocks. A
spherical hinge was created by a wedge connection between the vertical load and the top of the
specimen to ensure that the load was aligned with the specimen without any undesired bending
moments. Fig. 3b is a schematic of the loading apparatus. The experimental setup ensures that the loads
that were applied by the horizontal frame and the loading machine were directly transferred to the
interface between the gypsum blocks. Compressional and shear wave pulses were transmitted through
the discontinuity while the normal and shear loads were applied to the interface.
Imaging system
Image acquisition system
Biaxial compression
apparatus
Pump and hydraulic
system
Data acquisition system
Seismic array
Signal conditioner box

8
(a) Biaxial compression apparatus
(b) Schematic of the setup
Fig. 3 Biaxial compression apparatus built for the research and loading
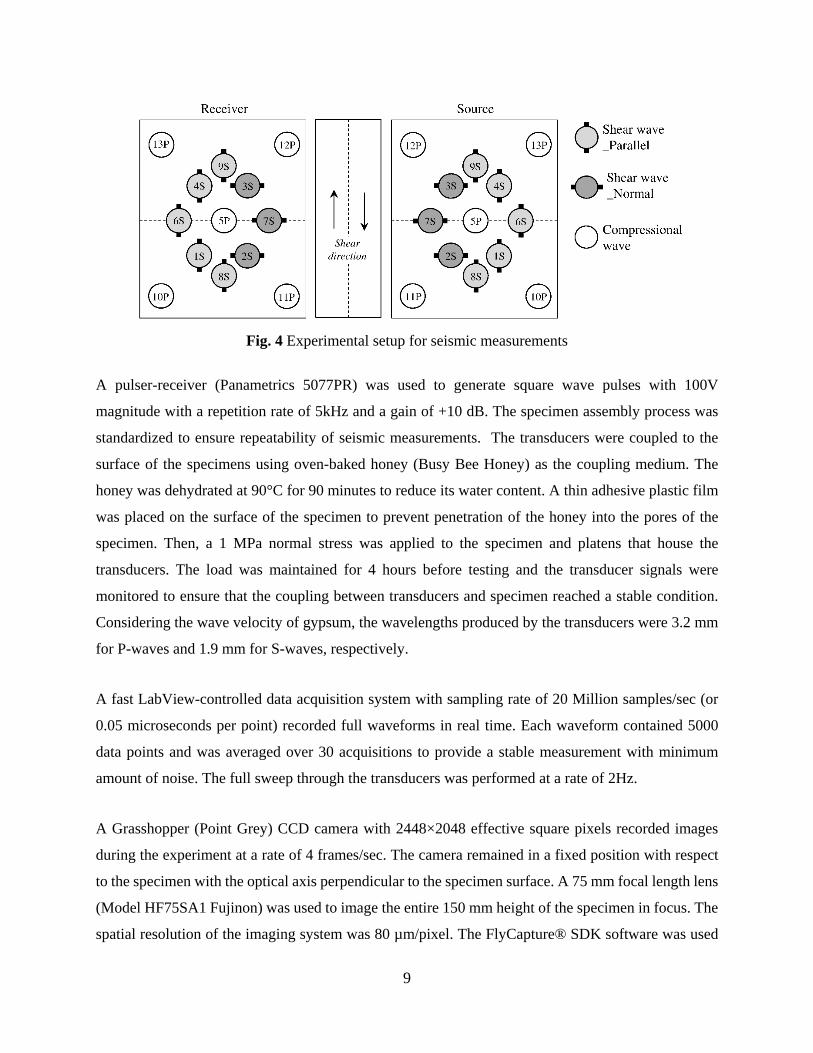
Special load platens were designed and fabricated to house thirteen transducer pairs, as shown in Fig.
3a. Thirteen sources and thirteen receivers were placed on the right and the left side of the rock
specimen, respectively. The transducers were broadband with a central frequency of 1MHz
(Panametrics V103RM for P-waves and V153RM for S-waves). Fig. 4 shows the transducer layout
that was used for seismic measurements. In this setup, each platen contained eight S-wave transducers
and five P-wave transducers. Five of the S-wave transducers (1S, 4S, 6S, 8S, and 9S) were polarized
in the direction of shear and three (2S, 3S, and 7S) were polarized perpendicular to the direction of
shear (Fig. 4). Five P-wave transducers (5P, 10P, 11P, 12P, and 13P) were included to monitor changes
in normal stiffness. The solid black boxes next to the shear wave transducers in Fig. 4 represent the
polarization of the shear waves generated by the transducers. The transducer layouts for source and
receiver platens are mirror images of each other.
9
Fig. 4 Experimental setup for seismic measurements
A pulser-receiver (Panametrics 5077PR) was used to generate square wave pulses with 100V
magnitude with a repetition rate of 5kHz and a gain of +10 dB. The specimen assembly process was
standardized to ensure repeatability of seismic measurements. The transducers were coupled to the
surface of the specimens using oven-baked honey (Busy Bee Honey) as the coupling medium. The
honey was dehydrated at 90°C for 90 minutes to reduce its water content. A thin adhesive plastic film
was placed on the surface of the specimen to prevent penetration of the honey into the pores of the
specimen. Then, a 1 MPa normal stress was applied to the specimen and platens that house the
transducers. The load was maintained for 4 hours before testing and the transducer signals were
monitored to ensure that the coupling between transducers and specimen reached a stable condition.
Considering the wave velocity of gypsum, the wavelengths produced by the transducers were 3.2 mm
for P-waves and 1.9 mm for S-waves, respectively.
A fast LabView-controlled data acquisition system with sampling rate of 20 Million samples/sec (or
0.05 microseconds per point) recorded full waveforms in real time. Each waveform contained 5000
data points and was averaged over 30 acquisitions to provide a stable measurement with minimum
amount of noise. The full sweep through the transducers was performed at a rate of 2Hz.
A Grasshopper (Point Grey) CCD camera with 2448×2048 effective square pixels recorded images
during the experiment at a rate of 4 frames/sec. The camera remained in a fixed position with respect
to the specimen with the optical axis perpendicular to the specimen surface. A 75 mm focal length lens
(Model HF75SA1 Fujinon) was used to image the entire 150 mm height of the specimen in focus. The
spatial resolution of the imaging system was 80 µm/pixel. The FlyCapture® SDK software was used

10
for controlling the camera and image acquisition. The matching process was performed on the acquired
images and the unit of measurement was pixel-based. To transfer the measured values from pixel to
the physical dimension, the DIC correlated displacements were multiplied by the spatial resolution
value, 80 µm/pixel, to obtain the displacements in the physical dimension.
For the direct shear experiments, the normal stress was applied first and held constant for the duration
of the test. The magnitude of the normal stress ranged between 0.5 MPa and 5 MPa. The shear load
was then applied by imposing a constant displacement rate of 8 µm/s to the top platen. An electronic
feedback control-loop adjusted the flatjack pressure to keep the horizontal stress constant, as the
Poisson’s effect induced horizontal expansion of the specimen during shearing. During normal and
shear loading, P-wave and S-wave pulses were transmitted through the interface and recorded. Two
linear variable displacement transducers (LVDTs), placed on top of the loading platen, and the loading
machine load cell measured the vertical (shear) deformation of the specimen and the applied shear
load, respectively.
2.3 Experimental Results
Three types of contact surfaces were created. Homogenous smooth specimens were made by putting a
smooth plastic sheet over the entire area of the mold. Homogeneous rough specimens were made by
putting a sandpaper with grit #36 over the entire area of the mold. Non-homogenous specimens were
made by casting gypsum against the flat surface of the mold that had at its upper half a smooth plastic
sheet and at its lower half a sandpaper with grit #36.
To determine the frictional characteristics of the contact surfaces, direct shear experiments were
performed on both homogeneous and non-homogenous contact surfaces. Fig. 5 contains graphs of
shear stress versus shear displacement for a homogeneous smooth, homogeneous rough, and a non-
homogeneous gypsum specimen, at a normal stress of 2.3 MPa. The displacements were measured
with respect to the displacement required to reach the peak shear stress. Positive values denote slip
after peak and negative values denote pre-peak displacements. This was done to provide uniform
scaling for comparison of results from all the tests.
The data at small shear stresses, i.e. 0 MPa to 0.5 MPa, are indicative of initial seating deformations
caused by the loading machine. A linear increase in shear stress with displacement occurred once the

11
load was fully transferred to the specimen. A linear relation was observed up to the peak shear stress,
or shear strength, of the interface. After reaching the peak, frictional degradation accelerated and
asperities on the interface began to shear off. The shear strength was reduced to its residual value in a
softening regime through stick-slip oscillations. Specimens with homogeneous rough and
homogeneous smooth contact surfaces exhibited the greatest and the least shear strength, respectively.
The greater the surface roughness of the contact surfaces, the greater the shear strength of the interface.
It should be noted that for the non-homogenous specimen, consisting of smooth and rough contact
surfaces, the shear stress-displacement information obtained from the shear test, Fig. 5a, does not
provide any indication about the initiation of slip and its propagation along the interface. Fig. 5b
summarizes the results of biaxial tests on specimens with homogeneous (rough and smooth) contact
surfaces.
(a) Shear stress-displacement for a non-homogeneous specimen with MPa 3.2n
(b) Results of direct shear experiments on homogenous specimens
Fig. 5 Direct shear experiment results on homogeneous and non-homogeneous gypsum specimens
Assuming the Coulomb shear strength law, the failure envelopes for homogeneous smooth and rough
specimens were obtained from regression analysis of the data. The results gave peak friction angles of
38˚ and 50˚ for the homogeneous smooth and rough specimens, respectively. The peak and residual
friction angles for homogenous smooth specimens are identical and equal to the residual friction angle
for the homogenous rough specimens. As expected, there was no cohesion along any of the surfaces
because the use of the mold release agent prevented adhesion between the two surfaces.
0
0.5
1
1.5
2
2.5
3
-1 -0.5 0 0.5 1
She
ar s
tres
s (M
Pa)
Shear displacement (mm)
Non-homogeneous
Homogeneous- Smooth
Homogeneous- Rough
0
1
2
3
4
5
0 1 2 3 4 5
Rough
Smooth
y = 1.2x
y = 0.8x
Peak
she
ar s
tres
s (M
Pa)
Normal stress (MPa)

12
3. Seismic Monitoring of Frictional Discontinuities
Full waveform measurements were taken during direct shear experiments on specimens with
homogeneous smooth, homogeneous rough and non-homogeneous contact surfaces. The effect of
shearing on the transmitted and reflected wave amplitudes is shown in Fig. 6. The figures are plots of
the amplitude for selected transducers at a given displacement (in the legend: negative values denote
pre-peak and positive values post-peak displacements).
(a) Transmitted shear wave (9S-9S)
(b) Transmitted compressional wave (4P-4P)
(c) Reflected shear wave (9S-9S)
(d) Reflected compressional wave (4P-4P)
Fig. 6 Transmitted and reflected waveforms measured during shearing of a non-homogeneous
interface with MPa 3n
-0.3
-0.2
-0.1
0
0.1
0.2
0.3
27 28 29 30 31
-1.00 mm-0.75 mm-0.50 mm-0.25 mm0.00 mm0.25 mm0.50 mm
Am
plit
ude
(Vol
ts)
Time (microseconds)
-0.3
-0.2
-0.1
0
0.1
0.2
0.3
16 17 18 19 20
-1.00 mm-0.75 mm-0.50 mm-0.25 mm0.00 mm0.25 mm0.50 mm
Am
plit
ude
(Vol
ts)
Time (microseconds)
-2
-1
0
1
2
27 28 29 30 31
-1.00 mm-0.75 mm-0.50 mm-0.25 mm0.00 mm0.25 mm0.50 mm
Am
plit
ude
(Vol
ts)
Time (microseconds)
-2
-1
0
1
2
16 17 18 19 20
-1.00 mm-0.75 mm-0.50 mm-0.25 mm0.00 mm0.25 mm0.50 mm
Am
plit
ude
(Vol
ts)
Time (microseconds)

13
Figs. 6a and 6b show the transmitted shear and compressional waves and Figs. 6c and 6d show the
corresponding reflected waveforms during a shearing experiment on a non-homogeneous interface. No
significant changes were observed in either the arrival time or frequency content of the recorded signals
during the experiment. However, significant changes of peak-to-peak amplitude were observed during
shearing. As a result, the peak-to-peak amplitude of the transmitted waves, i.e. the difference between
the maximum and the minimum amplitudes of the waveform, was used to study the interface behavior.
A series of direct shear experiments was performed on homogeneous and non-homogeneous contact
surfaces. A summary of the observed seismic behavior is included in the following section.
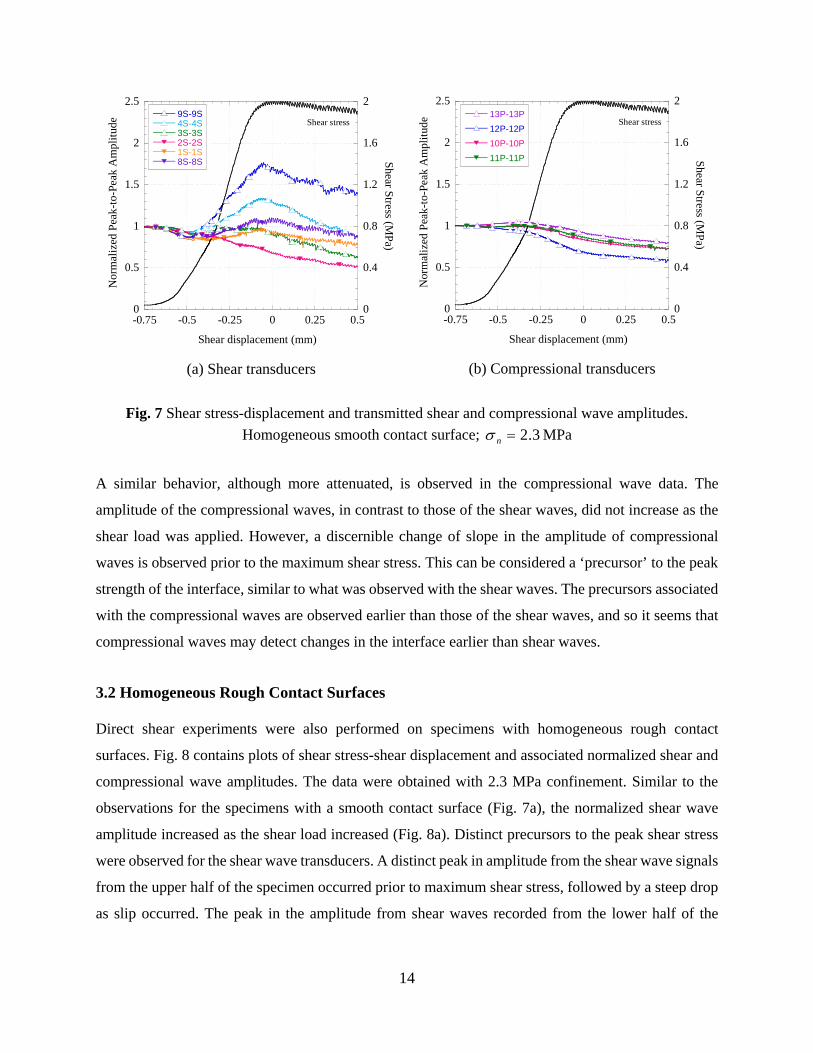
3.1 Homogeneous Smooth Contact Surfaces
The first set of experiments was conducted on specimens with homogeneous smooth contact surfaces.
Fig. 7 shows plots of shear stress and normalized peak-to-peak amplitudes with respect to shear
displacements, for a gypsum specimen with a smooth contact surface and 2.3 MPa confinement. The
shear displacements were measured with respect to the displacement required to reach the peak shear
stress. Positive values denote slip after peak and negative values denote pre-peak displacements. Fig.
7a contains data from the shear wave transducers and Fig. 7b from the compressional wave transducers.
In the figures, the amplitude has been normalized with respect to its value prior to shear. Markers with
an open triangle pointing upwards are used for transducers placed on the upper half of the specimen
while triangular markers pointing downwards represent transducers placed on the lower half of the
specimen.
The initial portion of the shear stress-displacement plot in Fig. 7a, i.e. from -0.75 mm to -0.65 mm of
shear displacement, shows the seating deformation of the specimen. During this period, the increase in
shear stress is small and the fluctuations in wave amplitudes are also small. A gradual and continuous
increase in the normalized shear wave amplitudes is observed as the shear load increased (Fig. 7a).
What is important is that the normalized amplitudes of the transmitted shear waves attain a maximum
prior to reaching the peak shear strength of the interface. This can be considered a ‘precursor’ to the
peak strength of the interface. After the maximum amplitude, the normalized amplitudes decrease in a
gradual and continuous manner as shear displacement increases.
14
(a) Shear transducers
(b) Compressional transducers
Fig. 7 Shear stress-displacement and transmitted shear and compressional wave amplitudes.
Homogeneous smooth contact surface; 3.2n MPa
A similar behavior, although more attenuated, is observed in the compressional wave data. The
amplitude of the compressional waves, in contrast to those of the shear waves, did not increase as the
shear load was applied. However, a discernible change of slope in the amplitude of compressional
waves is observed prior to the maximum shear stress. This can be considered a ‘precursor’ to the peak
strength of the interface, similar to what was observed with the shear waves. The precursors associated
with the compressional waves are observed earlier than those of the shear waves, and so it seems that
compressional waves may detect changes in the interface earlier than shear waves.
3.2 Homogeneous Rough Contact Surfaces
Direct shear experiments were also performed on specimens with homogeneous rough contact
surfaces. Fig. 8 contains plots of shear stress-shear displacement and associated normalized shear and
compressional wave amplitudes. The data were obtained with 2.3 MPa confinement. Similar to the
observations for the specimens with a smooth contact surface (Fig. 7a), the normalized shear wave
amplitude increased as the shear load increased (Fig. 8a). Distinct precursors to the peak shear stress
were observed for the shear wave transducers. A distinct peak in amplitude from the shear wave signals
from the upper half of the specimen occurred prior to maximum shear stress, followed by a steep drop
as slip occurred. The peak in the amplitude from shear waves recorded from the lower half of the
0
0.5
1
1.5
2
2.5
0
0.4
0.8
1.2
1.6
2
-0.75 -0.5 -0.25 0 0.25 0.5
9S-9S4S-4S3S-3S2S-2S1S-1S8S-8S
Nor
mal
ized
Pea
k-to
-Pea
k A
mpl
itud
e
Shear S
tress (MP
a)
Shear displacement (mm)
Shear stress
0
0.5
1
1.5
2
2.5
0
0.4
0.8
1.2
1.6
2
-0.75 -0.5 -0.25 0 0.25 0.5
13P-13P
12P-12P
10P-10P
11P-11P
Nor
mal
ized
Pea
k-to
-Pea
k A
mpl
itud
e
Shear S
tress (MP
a)
Shear displacement (mm)
Shear stress

15
specimen was followed by a second hump, showing an increase in the normalized amplitude (or
interface shear specific stiffness) with slip.
Fig. 8b shows a similar plot for compressional waves. The change of normalized amplitude with
deformation is not as dramatic as the shear waves, but a significant change in slope of the amplitude
prior to maximum shear stress is considered to be a precursor to peak strength. Because shear wave
transducers are sensitive to the changes of the interface shear stiffness and compressional wave
transducers are sensitive to the changes of the interface normal stiffness, it is expected that shear and
compressional waves behave differently.
(a) Shear transducers
(b) Compressional transducers
Fig. 8 Shear stress-displacement and transmitted shear and compressional wave amplitudes.
Homogeneous rough surface; 3.2n MPa
3.3 Monitoring of Slip along Non-Homogeneous Contact Surfaces
A series of direct shear experiments was completed on gypsum specimens with non-homogeneous
contact surfaces. Seismic wave measurements were performed during the experiment in two different
modes: (a) transmission of seismic waves, and (b) transmission and reflection of seismic waves. The
following sections describe the observed behavior of non-homogeneous contact surfaces with shear.
0
0.5
1
1.5
2
2.5
3
0
0.5
1
1.5
2
2.5
3
-0.6 -0.4 -0.2 0 0.2 0.4 0.6
9S-9S4S-4S3S-3S2S-2S1S-1S8S-8S
Nor
mal
ized
Pea
k-to
-Pea
k A
mpl
itud
e
Shear Stress (M
Pa)
Shear displacement (mm)
Shear stress
0
0.5
1
1.5
2
2.5
3
0
0.5
1
1.5
2
2.5
3
-0.6 -0.4 -0.2 0 0.2 0.4 0.6
13P-13P
12P-12P
10P-10P
11P-11PN
orm
aliz
ed P
eak-
to-P
eak
Am
plit
ude
Shear S
tress (MP
a)
Shear displacement (mm)
Shear stress
16
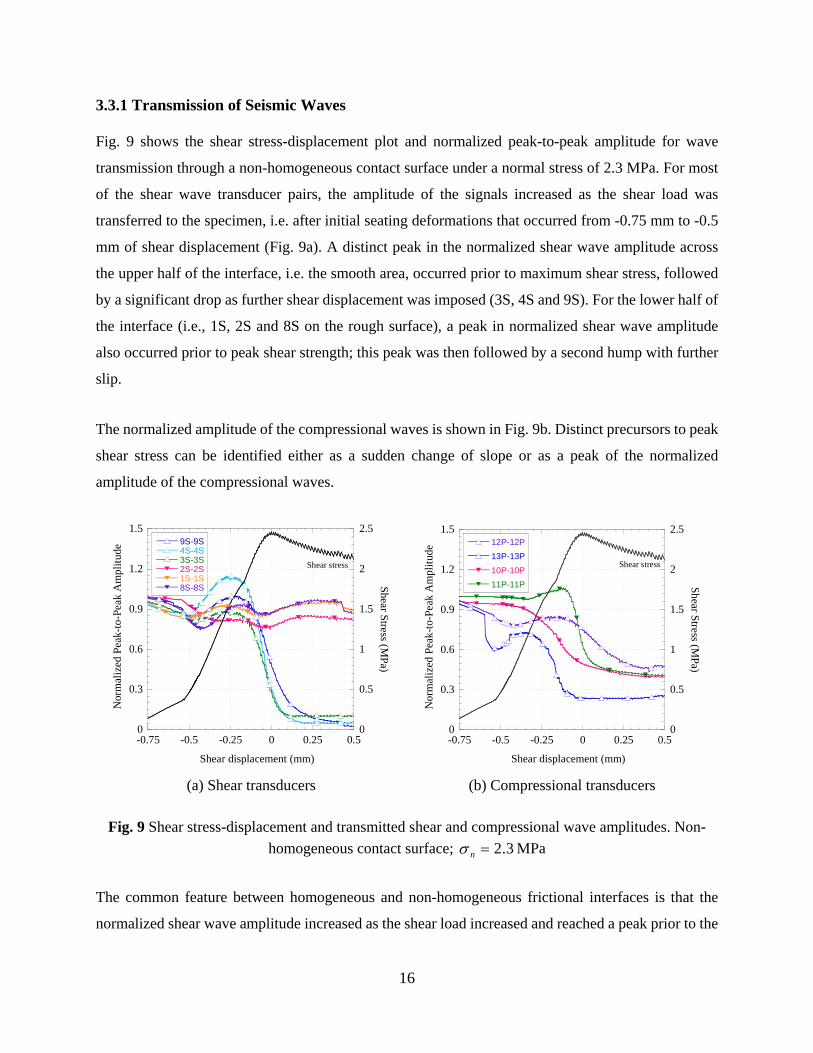
3.3.1 Transmission of Seismic Waves
Fig. 9 shows the shear stress-displacement plot and normalized peak-to-peak amplitude for wave
transmission through a non-homogeneous contact surface under a normal stress of 2.3 MPa. For most
of the shear wave transducer pairs, the amplitude of the signals increased as the shear load was
transferred to the specimen, i.e. after initial seating deformations that occurred from -0.75 mm to -0.5
mm of shear displacement (Fig. 9a). A distinct peak in the normalized shear wave amplitude across
the upper half of the interface, i.e. the smooth area, occurred prior to maximum shear stress, followed
by a significant drop as further shear displacement was imposed (3S, 4S and 9S). For the lower half of
the interface (i.e., 1S, 2S and 8S on the rough surface), a peak in normalized shear wave amplitude
also occurred prior to peak shear strength; this peak was then followed by a second hump with further
slip.
The normalized amplitude of the compressional waves is shown in Fig. 9b. Distinct precursors to peak
shear stress can be identified either as a sudden change of slope or as a peak of the normalized
amplitude of the compressional waves.
(a) Shear transducers
(b) Compressional transducers
Fig. 9 Shear stress-displacement and transmitted shear and compressional wave amplitudes. Non-
homogeneous contact surface; 3.2n MPa
The common feature between homogeneous and non-homogeneous frictional interfaces is that the
normalized shear wave amplitude increased as the shear load increased and reached a peak prior to the
0
0.3
0.6
0.9
1.2
1.5
0
0.5
1
1.5
2
2.5
-0.75 -0.5 -0.25 0 0.25 0.5
9S-9S4S-4S3S-3S2S-2S1S-1S8S-8S
Nor
mal
ized
Pea
k-to
-Pea
k A
mpl
itud
e
Shear S
tress (MP
a)
Shear displacement (mm)
Shear stress
0
0.3
0.6
0.9
1.2
1.5
0
0.5
1
1.5
2
2.5
-0.75 -0.5 -0.25 0 0.25 0.5
12P-12P
13P-13P
10P-10P
11P-11P
Nor
mal
ized
Pea
k-to
-Pea
k A
mpl
itud
e
Shear S
tress (MP
a)
Shear displacement (mm)
Shear stress

17
peak shear strength of the interface. The rate of increase of the normalized amplitude tends to be greater
for transducers placed on the upper half of the specimen than on the lower half. Slip along the
homogeneous smooth interface can be associated with a continuous decrease of the amplitude of shear
waves. However, shear along the homogeneous rough and non-homogenous interfaces resulted in a
decrease in shear wave amplitude that is steeper and more pronounced on signals from the smooth
surface than the rough surface.
3.3.2 Transmission and Reflection of Seismic Waves
The data acquisition system also enabled us to acquire simultaneously both transmitted and reflected
seismic waves during the shear experiment. Fig. 10 shows the normalized peak-to-peak amplitude and
the shear stress-displacement plot for a non-homogeneous specimen at a normal stress of 3 MPa. Fig.
10a shows the amplitude of transmitted shear waves and Fig. 10b shows the amplitude of reflected
shear waves across the discontinuity during shearing.
As shown in Fig. 10a, after the initial seating deformation of the specimen, from -1.25 mm to -0.75
mm of shear displacement, the shear stress increased rapidly with shear displacement until it reached
the peak shear strength of the contact surface. The asperities then started to shear off, resulting in a
stress-weakening behavior until the residual strength was reached. The amplitude of the transmitted
shear waves increased as the shear load was transferred to the specimen (see Fig. 10a). A distinct peak
in the normalized shear wave amplitude for signals from all of the shear wave transducers occurred
prior to peak shear strength. The peak occurred on all the transducers and indicated the impending
shear failure of the contact surface. The peak in the amplitude was followed by a decrease as further
shear displacement was imposed on the contact surface. The decrease in the amplitude was more
significant for the upper half of the interface (i.e., 9S and 3S on the smooth surface) than for the lower
half of the interface (i.e., 1S and 8S on the rough surface).
Fig. 10b shows the amplitude of reflected shear waves during the same experiment. They were acquired
simultaneously with the transmitted signals. After the initial seating deformation of the specimen (from
-1.25 mm to -0.75 mm of shear displacement), the amplitude of the reflected signals decreased as the
shear load was transferred to the contact surface (see Fig. 10b). The amplitude of the reflected signals
attained a minimum prior to reaching the peak shear strength. The minimum in the amplitude of the
reflected wave corresponded to the peak of the amplitude of transmitted waves. After reaching the

18
minimum, the amplitude of the reflected waves increased due to the reduction of fracture shear stiffness
and the induced damage and loss of contact at the interface. Although the amplitude of the reflected
shear waves showed small variations during the shearing experiment, (i.e. within ±7%), it clearly
detected damage to the interface prior to failure.
(a) Transmitted waveforsms
(b) Reflected waveforsms
Fig. 10 Shear stress-displacement and transmitted-reflected shear wave amplitudes. Non-
homogeneous contact surface; 3n MPa
3.4 Seismic Precursors
Precursors are defined in this research as significant changes in transmitted compressional or shear
wave amplitude that occur prior to peak shear strength. Precursors can be evaluated as a function of
the displacement required between their appearance and the peak shear strength. The discussion is
based on displacement rather than time to eliminate the effect of loading rate. In the following
discussion, negative values denote the magnitude of shear displacement required to reach the peak
shear stress after the precursor is detected; thus, the more negative the value, the earlier the precursor
appears before peak.
Fig. 11a is a plot of precursors along the interface for specimens with a homogeneous smooth contact
surface, Fig. 11b for homogeneous rough contact surfaces, and Fig. 11c for non-homogeneous contact
surfaces. In the figures, the location of the precursors is measured from the bottom of the specimen.
The figures contain the results of a series of experiments performed on each type of interface at normal
0
0.5
1
1.5
2
2.5
0
1
2
3
4
5
-1.25 -1 -0.75 -0.5 -0.25 0 0.25 0.5
9S3S7S1S8S
Nor
mal
ized
Pea
k-to
-Pea
k A
mpl
itud
e
Shear S
tress (MP
a)
Shear displacement (mm)
Shear stress
0.9
0.95
1
1.05
1.1
0
1
2
3
4
-1.25 -1 -0.75 -0.5 -0.25 0 0.25 0.5
9S3S7S1S8S
Nor
mal
ized
Pea
k-to
-Pea
k A
mpl
itud
e
Shear Stress (M
Pa)
Shear displacement (mm)
Shear stress

19
stresses ranging from 1 MPa to 4 MPa. Error bars provide the level of uncertainty in finding the position
of each precursor. Precursors to peak strength are observed between -0.2 mm to 0 mm for homogeneous
smooth interfaces; between -0.3 mm to -0.1 mm for homogeneous rough interfaces, and between -0.5
mm to -0.2 mm for the non-homogeneous interfaces. Although the magnitude of the displacement may
seem to be small in terms of its absolute value, it is an important fraction of the peak displacement.
The average value of peak displacement for the homogeneous smooth, homogeneous rough and non-
homogeneous interface was 0.36 mm, 0.58 mm, and 0.57 mm, respectively. Thus, precursors appear
within the range of 50% to 80% of the peak displacement.
(a) Homogenous smooth interface
(b) Homogenous rough interface
(c) Non-homogeneous interface
Fig. 11 Precursors along a frictional interface with homogeneous and non-homogeneous contact surfaces
1
2
3
4
5
-0.5 -0.4 -0.3 -0.2 -0.1 0 0.1
Tra
nsdu
cer
vert
ical
pos
ition
(in
ch)
Precursor (mm)
1
2
3
4
5
-0.5 -0.4 -0.3 -0.2 -0.1 0 0.1
Tra
nsdu
cer
vert
ical
pos
itio
n (i
nch)
Precursor (mm)
1
2
3
4
5
-0.5 -0.4 -0.3 -0.2 -0.1 0 0.1
Tra
nsdu
cer
vert
ical
pos
itio
n (i
nch)
Precursor (mm)
Rough
Smooth

20
Precursors are observed to occur closer to the macroscopic peak shear strength of the homogeneous
smooth interface, (Fig. 11a), than to the macroscopic shear strength of the homogeneous rough
interface, (Fig. 11b). For specimens with a non-homogeneous interface, it is observed that the
precursors are somewhat uniformly distributed along the interface, i.e. they seem to occur at the same
time along the contact surface, and between -0.5 mm to -0.2 mm. Thus, it can be concluded that the
peak shear strength of the smooth interface is mobilized first because of the small distance between
the precursors and the peak strength of the smooth surface (Fig. 11a), and the peak shear strength of
the rough surface is mobilized later because of the large distance between the precursors and the
strength of the rough surface (Fig. 11b). This observation is in agreement with previous findings by
Mutlu who performed direct shear experiments on blocks of acrylic material with a non-homogeneous
interface (Mutlu 2005). He observed, using a photoelastic method, that slip along the contact surface
did not occur simultaneously. It was observed first on the weak zone and then propagated to the strong
surface.
4. Digital Image Correlation and Investigation of Slip along Frictional Discontinuities
DIC is a non-contact full-field measurement method for surfaces undergoing deformation. DIC has
gained popularity in the field of experimental solid mechanics over the last 30 years (Pan et al. 2009;
Sutton et al. 2009) and is now widely accepted and commonly used as a powerful tool in experimental
geomechanics (Liu and Iskander 2004; Rechenmacher and Finno 2004; Withers 2008; Orteu 2009).
DIC directly computes the full-field surface deformations by comparing the digital images of a
specimen surface acquired before and after deformation by using image correlation principles (Pan et
al. 2009). DIC, as a continuous measurement technique, has a great potential for measuring
displacements and strains along discontinuities and fractures and is extensively used in the field of
fracture mechanics (Sutton et al. 2007; Lin and Labuz 2013). In this study, DIC is employed to monitor
slip initiation and propagation processes along non-homogeneous discontinuities impending shear
failure.
In DIC, incremental displacements are obtained from the comparison between two digital images
assuming one as the reference and one as the deformed. Thus, the total full-field displacement is
measured through the summation of the incremental displacements from previous image pairs. To
evaluate slip along the discontinuity during shearing, displacement contours were constructed through
various stages of shearing. In the following, positive values of vertical displacement indicate

21
downward movement; the smooth surface is on the upper part of the figures (i.e. y > 75 mm) and the
rough surface on the lower part (for y < 75 mm).
Fig. 12a shows the displacement contour for a load of 35% of the peak shear load. As the applied load
increased from 0 to 35% of the peak shear load, a zone of displacement discontinuity, a slip patch,
started to form on the upper part of the smooth area; this is shown in the figure with black arrows.
Beyond the slip patch, the interface between the two halves is not detected because the interface is still
intact. A detailed examination of vertical displacements along different horizontal cross sections
provides more information about the mechanism of deformation. Three cross sections: y=25 mm, y=75
mm, and y=125 mm are analyzed (Fig. 12b). The average vertical displacements at y=25 mm, y=75
mm, and y=125 mm cross sections are 14 µm, 30 µm, and 41 µm, respectively. It is observed that the
specimen’s dominant deformation is like a solid block without any significant relative slip between the
two halves except for the top patch. Note that the average vertical displacement at the middle cross
section, y=75 mm, is about 30 µm, which is equal to the average displacement of the top and bottom
cross sections, which indicates an essentially elastic deformation.
(a) Vertical displacement contour
(b) Vertical displacement profile
Fig. 12 Vertical displacement for a non-homogeneous contact surface at 35% of peak load
As the shear load increased to 70% of the peak shear load, the slip patch advanced along the smooth
area, as shown with a black arrow in Fig. 13a. Vertical displacement profiles along the horizontal cross
0
10
20
30
40
50
0 10 20 30 40 50
Ver
tica
l dis
plac
emen
t (m
icro
n)
x (mm)
y=25 mm
y=75 mm
y=125 mm

22
sections are shown in Fig. 13b. The discontinuity in displacement is clearly represented through the
zones with significant displacement gradients between x=23 mm and x=27 mm at y=125mm and y=75
mm profiles. Note that in DIC, a fracture does not exist and any measure of fracture displacement
involves a certain width. The size of the subset influences the width of the discontinuity zone but does
not affect the amount of slip, which is obtained as the difference in vertical displacements between the
right and the left sides of the interface. At y=25 mm in Fig. 13b, there is still no jump in the
displacement.
(a) Vertical displacement contour
(b) Vertical displacement profile
Fig. 13 Vertical displacement for a non-homogeneous contact surface at 70% of peak load
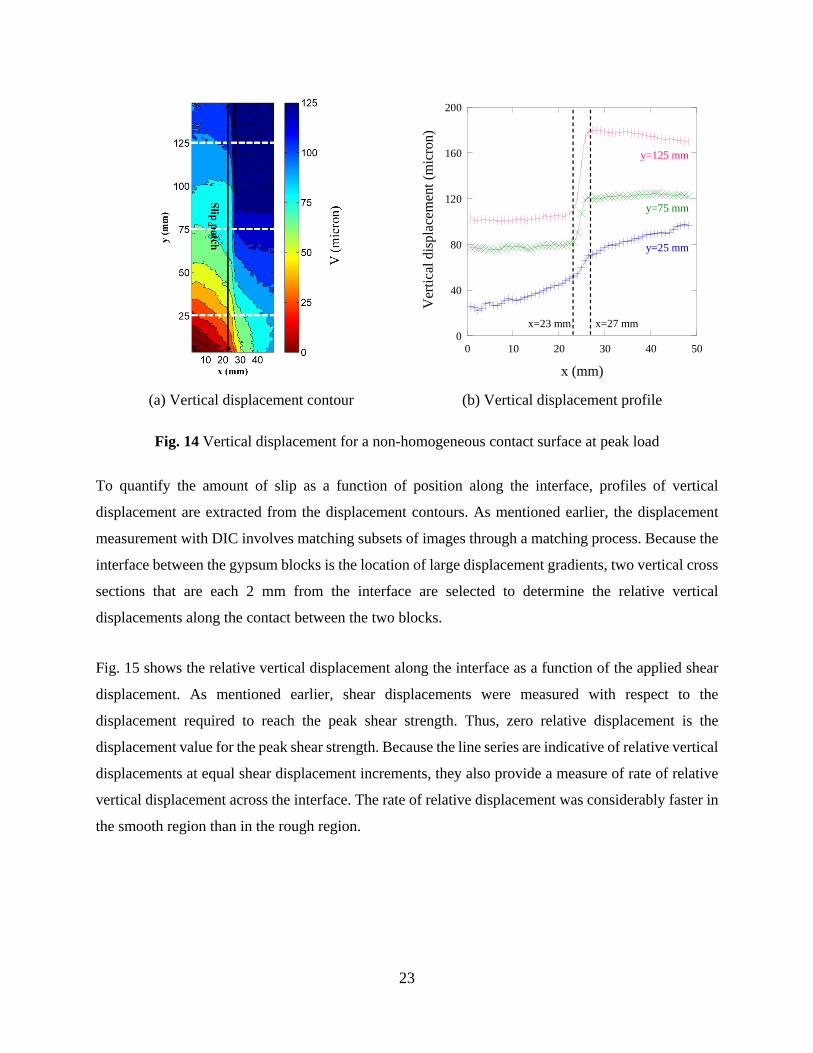
When the applied load reached the peak load (Fig. 14), slip propagated through the rough surface. A
clear displacement discontinuity is observable on all three displacement profiles. The amount of slip is
significantly higher along the smooth surface than along the rough surface.
0
20
40
60
80
100
0 10 20 30 40 50
Ver
tica
l dis
plac
emen
t (m
icro
n)
x (mm)
y=25 mm
y=75 mm
y=125 mm
x=23 mm x=27 mm
23
(a) Vertical displacement contour
(b) Vertical displacement profile
Fig. 14 Vertical displacement for a non-homogeneous contact surface at peak load
To quantify the amount of slip as a function of position along the interface, profiles of vertical
displacement are extracted from the displacement contours. As mentioned earlier, the displacement
measurement with DIC involves matching subsets of images through a matching process. Because the
interface between the gypsum blocks is the location of large displacement gradients, two vertical cross
sections that are each 2 mm from the interface are selected to determine the relative vertical
displacements along the contact between the two blocks.
Fig. 15 shows the relative vertical displacement along the interface as a function of the applied shear
displacement. As mentioned earlier, shear displacements were measured with respect to the
displacement required to reach the peak shear strength. Thus, zero relative displacement is the
displacement value for the peak shear strength. Because the line series are indicative of relative vertical
displacements at equal shear displacement increments, they also provide a measure of rate of relative
vertical displacement across the interface. The rate of relative displacement was considerably faster in
the smooth region than in the rough region.
0
40
80
120
160
200
0 10 20 30 40 50
Ver
tica
l dis
plac
emen
t (m
icro
n)
x (mm)
y=25 mm
y=75 mm
y=125 mm
x=27 mmx=23 mm

24
Fig. 15 Relative vertical displacement profile along an interface with the non-homogeneous contact surface and 3MPa normal confinement
To couple the geophysical observations with DIC measurements, the normalized amplitude of shear
wave transducers is compared with the corresponding relative displacement from DIC in Fig. 16. The
seismic transducers are essentially ultrasonic sensors that probe changes in the interface. Each
transducer only probes the area that is within its beam diameter and lobe pattern. Thus, a comparison
of the transducer readings with vertical displacements are made for locations on the specimen surface
that correspond to the location (in terms of height) of the transducer pair. Relative vertical
displacements, as a function of applied shear stress, are extracted from Fig. 15 at the location that is
illuminated by the transducer. In Fig. 16, normalized peak-to-peal amplitudes of the waveforms
measured by transducer pair 9S on the smooth surface and 8S on the rough surface are shown along
with their corresponding vertical displacements. In the figure, the green arrows denote the change in
rate of displacement and are associated with the instant when slip starts at a particular point, as
observed in the DIC measurements. Slip initiated first in the smooth surface and was concurrent with
the precursor from the seismic transducer. The increase in the rate of relative displacement occurred
later for the rough surface and was also associated with the corresponding seismic precursor.
0
25
50
75
100
125
150
0 20 40 60 80 100 120
-0.75 mm-0.6 mm-0.45 mm-0.3 mm-0.15 mm0 mm
Pos
itio
n al
ong
Inte
rfac
e (m
m)
Relative vertical displacement (µm)
Shear displacement applied

25
Fig. 16 Precursors and slip along the discontinuity
5. Seismic Precursors to Failure of Discontinuities in Natural Rock
Precursors to slip were observed in the seismic wave measurements. A distinct peak in the amplitude
of shear waves and a marked decrease in the amplitude of compressional waves were observed prior
to the peak shear strength of discontinuities in gypsum. A series of experiments was also performed on
specimens of Indiana Limestone to investigate the precursor events prior to the failure of
discontinuities in natural rocks.
Fig. 17 shows a graph of the shear stress-displacement and the normalized peak-to-peak amplitude for
the Indiana Limestone specimen. The amplitude of the transmitted wave from each transducer is
normalized with respect to its maximum value during shearing. That is, a value of one indicates the
maximum transmitted amplitude and points to the location of precursors that are observed prior to the
shear failure. For all the shear wave transducer pairs, the amplitude of the signals increased as the shear
load was applied, i.e. after initial seating deformations (Fig. 17a). A distinct peak in the normalized
shear wave amplitude was observed for all shear wave transducers and was followed by a gradual
decrease after reaching failure. Fig. 17b shows a similar graph for the compressional waves. The
transmitted compressional waves are also normalized with respect to their maximum during shearing.
Distinct precursors to peak shear stress can be identified either as a sudden change of slope or as a peak
of the normalized amplitude of the compressional waves.
0
0.25
0.5
0.75
1
1.25
0
10
20
30
40
50
-0.8 -0.6 -0.4 -0.2 0
Nor
mal
ized
Am
plitu
deR
elative interface displacement (µ
m)
Displacement (mm)
Slip
dv_9S
Precursor
8S
dv_8S
9S

26
Interestingly enough, the same phenomenon that was observed in gypsum contact surfaces also
occurred for the Indiana Limestone. The normalized amplitude of transmitted shear waves across the
discontinuity increased as the shear load increased and reached a peak prior to the peak shear strength
of the discontinuity. Similarly, either a distinct peak or a marked decrease in the amplitude of
transmitted wave occurred prior to failure of the discontinuity. The peak in the amplitude of transmitted
waves or the minimum in the amplitude of reflected waves are here considered as precursors
premonitory to the failure of the discontinuity. Unlike the data for gypsum, the precursors on these
rough surfaces occur fairly close to the failure of the discontinuity.
(a) Shear wave transducers
(b) Compressional wave transducers
Fig. 17 Shear stress-displacement and shear and compressional wave amplitudes for the Indiana
Limestone specimen under 4n MPa
Fracture specific stiffness was calculated for fractured Indiana Limestone specimens, based on seismic
transmission and reflection measurements. The dominant frequency for the compressional and shear
wave signals was 0.58 MHz and 0.34 MHz at 4 MPa of normal stress, respectively. Considering the
average wave velocity for compressional waves, 4500pV m/s, and shear waves, 2500sV m/s, the
wavelength of the signals is equal to 7.74 mm for compressional waves and 7.14 mm for shear waves,
respectively. The displacement discontinuity theory (Schoenberg 1980; Myer et al. 1985; Pyrak-Nolte
et al. 1990; Nihei et al. 1994; Pyrak-Nolte 1996; Nakagawa et al. 2000) was used to calculate the
fracture normal and shear specific stiffness based on the ratio of spectral amplitude of transmission to
the spectral amplitude of reflection. Fig. 18 shows the shear stress-displacement and the calculated
0
0.25
0.5
0.75
1
1.25
1.5
0
1.5
3
4.5
6
7.5
9
-0.75 -0.5 -0.25 0 0.25
12S9S3S1S8S10S
Nor
mal
ized
Pea
k-to
-Pea
k A
mpl
itud
e
Shear S
tress (MP
a)
Shear displacement (mm)
Shear stress
0
0.25
0.5
0.75
1
1.25
1.5
0
1.5
3
4.5
6
7.5
9
-0.75 -0.5 -0.25 0 0.25
13P4P2P11P
Nor
mal
ized
Pea
k-to
-Pea
k A
mpl
itud
e
Shear S
tress (MP
a)
Shear displacement (mm)
Shear stress
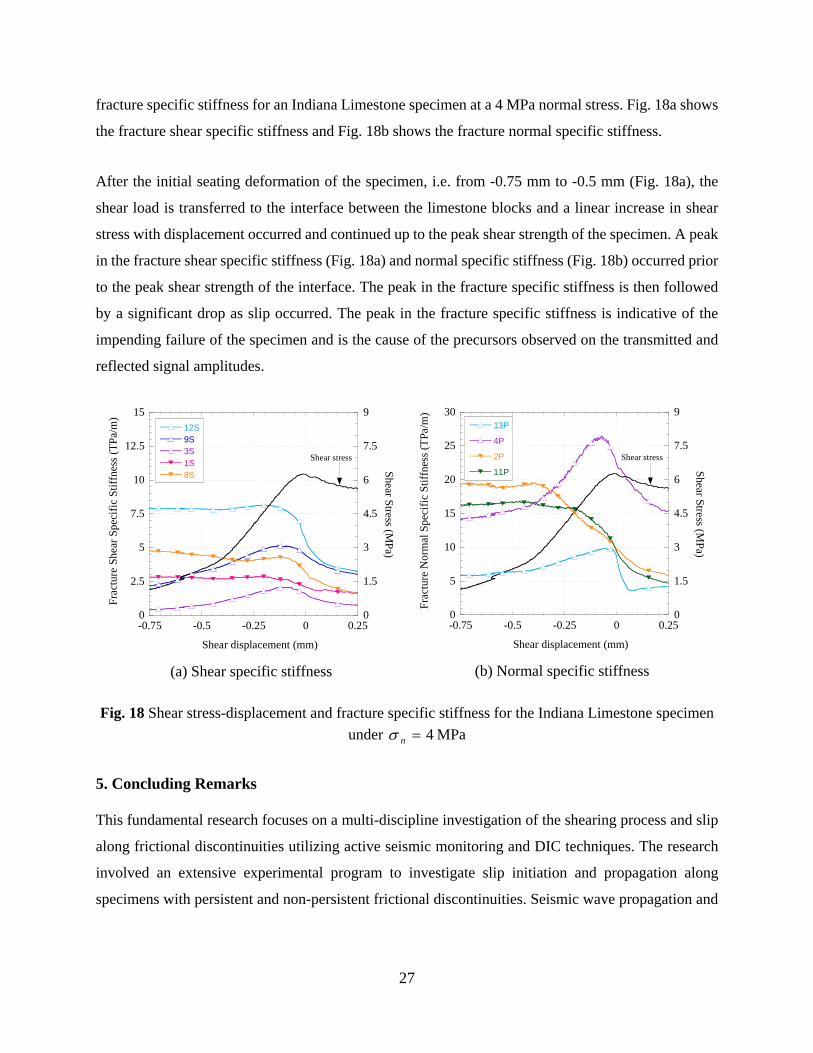
27
fracture specific stiffness for an Indiana Limestone specimen at a 4 MPa normal stress. Fig. 18a shows
the fracture shear specific stiffness and Fig. 18b shows the fracture normal specific stiffness.
After the initial seating deformation of the specimen, i.e. from -0.75 mm to -0.5 mm (Fig. 18a), the
shear load is transferred to the interface between the limestone blocks and a linear increase in shear
stress with displacement occurred and continued up to the peak shear strength of the specimen. A peak
in the fracture shear specific stiffness (Fig. 18a) and normal specific stiffness (Fig. 18b) occurred prior
to the peak shear strength of the interface. The peak in the fracture specific stiffness is then followed
by a significant drop as slip occurred. The peak in the fracture specific stiffness is indicative of the
impending failure of the specimen and is the cause of the precursors observed on the transmitted and
reflected signal amplitudes.
(a) Shear specific stiffness
(b) Normal specific stiffness
Fig. 18 Shear stress-displacement and fracture specific stiffness for the Indiana Limestone specimen
under 4n MPa
5. Concluding Remarks
This fundamental research focuses on a multi-discipline investigation of the shearing process and slip
along frictional discontinuities utilizing active seismic monitoring and DIC techniques. The research
involved an extensive experimental program to investigate slip initiation and propagation along
specimens with persistent and non-persistent frictional discontinuities. Seismic wave propagation and
0
2.5
5
7.5
10
12.5
15
0
1.5
3
4.5
6
7.5
9
-0.75 -0.5 -0.25 0 0.25
12S9S3S1S8S
Fra
ctur
e S
hear
Spe
cifi
c S
tiff
ness
(T
Pa/
m)
Shear S
tress (MP
a)
Shear displacement (mm)
Shear stress
0
5
10
15
20
25
30
0
1.5
3
4.5
6
7.5
9
-0.75 -0.5 -0.25 0 0.25
13P
4P
2P
11P
Fra
ctur
e N
orm
al S
peci
fic
Sti
ffne
ss (
TPa
/m)
Shear S
tress (MP
a)
Shear displacement (mm)
Shear stress

28
DIC were used to monitor slip along frictional surfaces and the investigation was conducted on two
different materials: gypsum, as a rock-type material, and Indiana Limestone, as a natural rock.
Distinct peaks in the amplitude of the transmitted waves were observed prior to the peak shear strength
of discontinuities and were defined as “precursors” to the failure. In experiments performed on gypsum
specimens with non-homogeneous contact surfaces, the precursors indicated that slip initiated on the
smooth surface and then extended to the rough surface, as the shear load was increased. DIC
measurements were also used to track slip along the contact surface. Slip was identified as a jump in
the displacement field across the discontinuity and as an increase in the rate of relative displacement.
The DIC measurements also confirmed that slip initiated on the smooth surface and propagated to the
rough surface. Precursors were associated with an increase of the rate of relative displacement across
the discontinuity and, as confirmed by the DIC measurements, were linked to a reduction of the
fracture’s shear stiffness.
The major finding from this research is the identification of geophysical precursors to failure of
frictional discontinuities. Seismic precursors were observed well before slip or failure. Precursors were
attributed to local changes of frictional characteristics of the contact surfaces and were thought to
provide a mechanism for determining if slip along a discontinuity had occurred or was about to occur.
This finding, albeit at the laboratory scale, makes a significant contribution to the field of rock
mechanics. Precursors have significant potential for providing data on the engineering properties of
fractures such as specific stiffness and for potential predictive capabilities for early warning of
impending failure such as earthquakes or other shear instabilities.
References
Aggarwal, Y. P., Sykes, L. R., Armbruster, J., and Sbar, M. L. (1973). Premonitory changes in seismic velocities and prediction of earthquakes, Nature, 241, 101-104.
Barton, N. (1972). A model study of rock-joint deformation. International Journal of Rock Mechanics and Mining Sciences and Geomechanics Abstracts, 9(5), 579-602.
Barton, N. (1973). Review of a new shear strength criterion for rock joints. Engineering Geology, 7, 287-332.
Barton, N., and Choubey, V. (1977). The shear strength of rock joints in theory and practice, Rock Mechanics, 10, 1-54.
Bobet, A., and Einstein, H. H. (1998). Fracture coalescence in rock-type materials under uniaxial and biaxial compression. International Journal of Rock Mechanics and Mining Sciences, 35(7), 863-888.

29
Brady, B. H. G., and Brown, E. T. (2004). Rock mechanics for underground mining. The Netherlands: Kluwer Academic Publishers.
Burgmann, R., Pollard, D. D., Martel, S. J. (1994). Slip distributions on faults: Effects of stress gradients, inelastic deformation, heterogeneous host-rock stiffness, and fault interaction. Journal of Structural Geology, 16, 1675-1690.
Byerlee, J. (1978). A review of rock mechanics studies in the United States pertinent to earthquake prediction. Pure and Applied Geophysics, 116, 586-602.
Carvalho, F., and Labuz, J. F. (2002). Moment tensors of acoustic emission in shear faulting under plane-strain compression. Tectonophysics, 356, 199-211.
Chen, W. Y., Lovell, C. W., Haley, G. M., and Pyrak-Nolte, L. J. (1993). Variation of shear-wave amplitude during frictional sliding. International Journal of Rock Mechanics and Mining Sciences and Geomechanics Abstracts, 30, 779-784.
Comninou, M., and Dundurs, J. (1983). Spreading of slip from a region of low friction. Acta Mechanica, 47, 65-71.
Dieterich, J. H. (1979). Modeling of rock friction I: experimental results and constitutive equations, Journal of Geophysical Research, 84, 2161-2168.
Einstein, H. H., and Hirschfeld, R. C. (1970). Model studies on mechanics of jointed rocks. ASCE Journal of the Geotechnical Division, 99, 229-248.
Gorbatikh, L. B., Nuller, D., and Kachanov, M. (2001). Sliding on cracks with non-uniform frictional characteristics. International Journal of Solids and Structures, 38, 7501-7524.
Hildyard, M. W., Young R. P., Collins, D. S., and Pettitt, W. S. (2005). Seismic wave propagation to diagnose the state of fracturing. Journal of the South African Institute of Mining and Metallurgy, 105, 437-446.
Hoek, E. (2007). Practical rock engineering. Available on-line at http://www.RocScience.com.
Hudson, J. A. (1981). Wave speeds and attenuation of elastic waves in material containing cracks. Geophysical Journal of the Royal Astronomical Society, 64, 133-150.
Jaeger, J. C. (1971). Friction of rocks and stability of rock slopes. Geotechnique, 21, 97-134.
Jaeger, J. C., Cook, N. G. W., Zimmerman, R. W. (2007). Fundamentals of rock mechanics. London: Wiley-Blackwell.
Johnston, M. J. S., Linde, A. T., Gladwin, M. T., and Borcherdt, R. D. (1987). Fault failure with moderate earthquakes. Tectonophysics, 144, 189- 206.
King M. S., Myer, L. R. and Rezowalli, J. J. (1986). Experimental studies of elastic-wave propagation in a columnar-jointed rock mass. Geophysical Prospecting, 8(34), 1185-l199.
Ladanyi, B., and Archambault, G. (1969). Simulation of the shear behaviour of a jointed rock mass. 11th U.S. Symposium on Rock Mechanics, Berkeley, 105-125.
Lin, Q. and Labuz, J. F. (2013). Fracture of sandstone characterized by digital image correlation. International Journal of Rock Mechanics and Mining Sciences, 60, 235-245.
Liu, J., and Iskander, M. (2004). Adaptive cross correlation for imaging displacements in soils. Journal of Computing in Civil Engineering, ASCE, 18, 46-57.

30
Lockner, D. (1993). The role of acoustic emission in the study of rock fracture. International Journal of Rock Mechanics and Mining Sciences and Geomechanics Abstracts, 30(7), 883–99.
Lockner, D. A., Walsh, J. B., and Byerlee, J. D. (1977). Changes in seismic velocity and attenuation during deformation of granite. Journal of Geophysical Research, 82(33), 5374-5378.
Malanchuk, N. I. (2011). Local slip of bodies caused by the inhomogeneous friction coefficient. Materials Science, 46(4), 543-552.
Martel, S. J., and Pollard, D. D. (1989). Mechanics of slip and fracture along small faults and simple strike-slip fault zones in granitic rock. Journal of Geophysical Research, 94, 9417-9428.
Mutlu, O. (2005). Progressive failure along frictional surfaces. Ph.D. Thesis, Purdue University, West Lafayette, IN.
Mutlu, O., and Bobet, A. (2005). Slip initiation on frictional fractures. Engineering Fracture Mechanics, 72(5), 729-747.
Mutlu, O. and Bobet, A. (2006). Slip propagation along frictional discontinuities. International Journal of Rock Mechanics and Mining Sciences, 43, 860-876.
Myer, L. R., Hopkins, D., and Cook, N. G. W. (1985). Effects of contact area of an interface on acoustic wave transmission characteristics. Proceedings of the 26th U.S. Rock Mechanics Symposium, Boston, Mass, 565-572.
Nagata, K., Nakatani, M., and Yoshida, S. (2008). Monitoring frictional strength with acoustic wave transmission. Geophysical Research Letters, 35, L06310.
Nakagawa, S., Nihei, K. T., and Myer, L. R. (2000). Shear induced conversion of seismic waves across single fractures. International Journal of Rock Mechanics and Mining Sciences and Geomechanics Abstracts, 37, 203-218.
Nihei, K. T., Myer, L. R., Cook, N. G. W., and Yi, W. (1994). Effects of non-welded interfaces on guided SH waves. Geophysical Research Letters, 21, 745-748.
Orteu, J. J. (2009). 3-D computer vision in experimental mechanics. Optics and Lasers in Engineering, 47, 282-291.
Pan, B., Qian, K., Xie, H., Asundi, A. (2009). Two-dimensional digital image correlation for in-plane displacement and strain measurement: a review. Measurement Science and Technology, 20, 062001.
Pyrak-Nolte, L. J. (1996). The seismic response of fractures and interrelations among fracture properties. International Journal of Rock Mechanics and Mining Sciences and Geomechanics Abstracts, 33(8), 787-802.
Pyrak-Nolte, L. J., Myer, L. R., and Cook, N. G. W. (1990). Transmission of seismic waves across single natural fractures. Journal of Geophysical Research, 95(B7), 8617-8638.
Rechenmacher, A. L., and Finno, R. J. (2004). Digital image correlation to evaluate shear banding in dilative sands. Geotechnical Testing Journal, 27, 13-22.
Reyes, O., and Einstein, H. H. (1991). Failure mechanism of fractured rock- a fracture coalescence model. Proceedings of the 7th ISRM Congress, Aachen, Germany.
Schoenberg, M. (1980). Elastic wave behaviour across linear slip interfaces. Journal of the Acoustical Society of America, 68(5), 1516-1521.

31
Shen, B., Stephansson, O., Einstein, H.H., and Ghahreman, B. (1995). Coalescence of fractures under shear stress experiments. Journal of Geophysical Research, 100, 5975-5990.
Steaky, R. M. (1975). Acoustic emission during high temperature frictional sliding. Pure and Applied Geophysics, 113, 31-43.
Sutton, M. A., Orteu, J., and Schreier, H. W. (2009). Image correlation for shape, motion and deformation measurements. New York: Springer.
Sutton, M. A., Yan, J., Deng, X., Cheng, C. S., and Zavattieri, P. (2007). Three-dimensional digital image correlation to quantify deformation and crack-opening displacement in ductile aluminum under mixed-mode I/III loading. Journal of Optical Engineering, 46(5), 051003.
Wang, C. Y. (1974). Earthquake prediction and oriented microcracks in rocks, Nature, 251, 405-406.
Withers, P. (2008). Strain measurement by digital image correlation. International Journal for Experimental Mechanics, 44, 421–422.
Yoshioka, N., and Scholz, C. H. (1989). Elastic properties of contacting surfaces under normal and shear loads: 2. Comparison of theory with experiment, Journal of Geophysical Research, 94, 17691-17700.
Young, R. P., Thompson, B. D. (2007). Imaging dynamic rock fracture with acoustic emission and x-ray tomography. Proceedings of the 11th Congress of International Society for Rock Mechanics, July 9-13, Lisbon, Portugal.
Word Count: 9551


