Mechanical behavior of representative volume elements of lithium-ion battery cells under compressive loading conditions Wei-Jen Lai a , Mohammed Yusuf Ali b , Jwo Pan b, * a Department of Materials Science and Engineering, The University of Michigan, Ann Arbor, MI 48109, USA b Department of Mechanical Engineering, The University of Michigan, Ann Arbor, MI 48109, USA highlights Present stressestrain curves for LiFePO 4 battery cells under in-plane constrained compression. Correlate experimental stressestrain curves to deformation patterns of battery cells. Model the buckling of cell specimens and justify the length selection of cell specimens. Correlate the buckling of cell components to the buckling stress of battery cells. Present a physical kinematic model for formation of kinks and shear bands in battery cells. article info Article history: Received 4 March 2013 Received in revised form 23 June 2013 Accepted 24 June 2013 Available online 2 July 2013 Keywords: Lithium-ion battery Representative volume element Mechanical behavior of pouch cell battery Kink formation Shear band formation In-plane constrained compression abstract The mechanical behaviors of lithium iron phosphate battery cells are investigated by conducting in- plane and out-of-plane compression tests of representative volume element (RVE) specimens of dry cells. The test results of cell RVE specimens under in-plane constrained compression indicate that the load carrying behavior of the cell RVE specimens is characterized by the buckling, the kink and shear band formation, and the final densification of the cell components. The SEM images of the active materials on electrodes and the test results of the cell RVE specimens under out-of-plane compres- sion suggest that the porosity in the components and the macroscopic gaps between the components is up to 40%. The test results suggest that the lithium-ion battery cells can be modeled as anisotropic foams or cellular materials. The elastic buckling analyses for a beam with lateral constraints indicate that the higher order buckling modes and the critical buckling stresses in general agree with those observed in experiments. The elastic buckling analyses also justify the length selection of the cell RVE specimens. Finally, an idealized kinematic model is presented to explain the physical mechanisms of the kink and shear band formation in the cell RVE specimens under in-plane constrained compression. Ó 2013 Elsevier B.V. All rights reserved. 1. Introduction Lithium-ion batteries have been considered as the solution for electric vehicles for the automotive industry due to its lightweight and high energy density. The major design considerations for lithium-ion batteries involve electrochemistry, thermal manage- ment and mechanical performance. The electrochemistry has been widely studied since it directly determines the battery performance and its life cycle. Different active materials on electrodes form different types of lithium-ion batteries. However, the basic chem- ical reactions of battery cells are similar. For automotive applica- tions, the mechanical performance is of great importance for crashworthiness analyses. Mechanical tests such as shock, drop, penetration, roll-over, and crush tests for abuse conditions of bat- tery cells, modules and packs were documented in SAE J2462 [1]. Research works were conducted on the safety performance of the battery cells under mechanical tests such as nail penetration tests, round bar crush tests, and pinch tests, for example, see Refs. [2e4]. However, the research works on the mechanical behavior of the representative volume elements (RVEs) of lithium-ion batteries are quite limited. Sahraei et al. [5] conducted a series of mechanical tests and computational works on commercial LiCoO 2 /graphite cells used for * Corresponding author. Tel.: þ1 734 764 9404; fax: þ1 734 647 3170. E-mail addresses: [email protected](W.-J. Lai), [email protected](M.Y. Ali), [email protected], [email protected](J. Pan). Contents lists available at SciVerse ScienceDirect Journal of Power Sources journal homepage: www.elsevier.com/locate/jpowsour 0378-7753/$ e see front matter Ó 2013 Elsevier B.V. All rights reserved. http://dx.doi.org/10.1016/j.jpowsour.2013.06.134 Journal of Power Sources 245 (2014) 609e623
Mechanical behavior of representative volume elements oflithium-ion battery cells under compressive loading conditions
Wei-Jen Lai a, Mohammed Yusuf Ali b, Jwo Pan b,*
aDepartment of Materials Science and Engineering, The University of Michigan, Ann Arbor, MI 48109, USAbDepartment of Mechanical Engineering, The University of Michigan, Ann Arbor, MI 48109, USA
h i g h l i g h t s
� Present stressestrain curves for LiFePO4 battery cells under in-plane constrained compression.� Correlate experimental stressestrain curves to deformation patterns of battery cells.� Model the buckling of cell specimens and justify the length selection of cell specimens.� Correlate the buckling of cell components to the buckling stress of battery cells.� Present a physical kinematic model for formation of kinks and shear bands in battery cells.
a r t i c l e i n f o
Article history:Received 4 March 2013Received in revised form23 June 2013Accepted 24 June 2013Available online 2 July 2013
Keywords:Lithium-ion batteryRepresentative volume elementMechanical behavior of pouch cell batteryKink formationShear band formationIn-plane constrained compression
0378-7753/$ e see front matter � 2013 Elsevier B.V.http://dx.doi.org/10.1016/j.jpowsour.2013.06.134
a b s t r a c t
The mechanical behaviors of lithium iron phosphate battery cells are investigated by conducting in-plane and out-of-plane compression tests of representative volume element (RVE) specimens of drycells. The test results of cell RVE specimens under in-plane constrained compression indicate that theload carrying behavior of the cell RVE specimens is characterized by the buckling, the kink and shearband formation, and the final densification of the cell components. The SEM images of the activematerials on electrodes and the test results of the cell RVE specimens under out-of-plane compres-sion suggest that the porosity in the components and the macroscopic gaps between the componentsis up to 40%. The test results suggest that the lithium-ion battery cells can be modeled as anisotropicfoams or cellular materials. The elastic buckling analyses for a beam with lateral constraints indicatethat the higher order buckling modes and the critical buckling stresses in general agree with thoseobserved in experiments. The elastic buckling analyses also justify the length selection of the cell RVEspecimens. Finally, an idealized kinematic model is presented to explain the physical mechanismsof the kink and shear band formation in the cell RVE specimens under in-plane constrainedcompression.
� 2013 Elsevier B.V. All rights reserved.
1. Introduction
Lithium-ion batteries have been considered as the solution forelectric vehicles for the automotive industry due to its lightweightand high energy density. The major design considerations forlithium-ion batteries involve electrochemistry, thermal manage-ment and mechanical performance. The electrochemistry has beenwidely studied since it directly determines the battery performanceand its life cycle. Different active materials on electrodes form
different types of lithium-ion batteries. However, the basic chem-ical reactions of battery cells are similar. For automotive applica-tions, the mechanical performance is of great importance forcrashworthiness analyses. Mechanical tests such as shock, drop,penetration, roll-over, and crush tests for abuse conditions of bat-tery cells, modules and packs were documented in SAE J2462 [1].Research works were conducted on the safety performance of thebattery cells under mechanical tests such as nail penetration tests,round bar crush tests, and pinch tests, for example, see Refs. [2e4].However, the research works on the mechanical behavior of therepresentative volume elements (RVEs) of lithium-ion batteries arequite limited.
Sahraei et al. [5] conducted a series of mechanical tests andcomputational works on commercial LiCoO2/graphite cells used for
RVE representative volume elementROM rule of mixturePim buckling load of the i-th component with the two
unattached elastic foundationm number of half wavesEi compressive elastic modulus of the i-th componentIi ¼ bh3i =12 moment of inertia of the i-th componentL length of the cell componentp lateral pressure on the beamz deflection of the beamk1, k2 spring constants of the harder and softer elastic
foundations on the two sides of the beamf ¼ k1/k2 spring constant ratioa coefficient depending upon the value of m in Equation
(1)m parameter defined in Equation (2)b width of the cell componenthi thickness of the i-th componentE0i effective compressive elastic modulus of the i-th
component under plane strain compression conditionsEi compressive elastic modulus of the i-th componentni Poisson’s ratio of the i-th componentk spring constant of the elastic foundationE out-of-plane compressive elastic modulus of the cell
RVE specimenh thickness of the neighbor cell componentsPic critical buckling load of the i-th componentPin buckling load of the i-th component with an
unattached elastic foundation on one side and a rigidwall on the other side
n number of wavesn parameter defined in Equation (10)3im compressive strain of the i-th component with the two
unattached elastic foundation3in compressive strain of the i-th component with an
unattached elastic foundation on one side and a rigidwall on the other side
Ai cross sectional area of the i-th componentPcell buckling load of cell RVE specimenni number of the i-th component in the cell RVE
specimenscell buckling stress of the cell RVE specimenA cross sectional area of the cell RVE specimena kink anglew width of the cell RVE specimend kink lengthq shear band angleqi initial shear band angleqf final shear band angle3Y 0 nominal normal strain in Y0 direction3Z0 nominal normal strain in Z0 directiongY 0Z 0 nominal shear strain in Y0Z0 plane3TY total nominal strain of one unit cell in cell RVE
specimenhs shear band heightE0cell effective compressive elastic modulus of the cell RVE
specimenfi volume fraction of the i-th componentf void volume fraction
W.-J. Lai et al. / Journal of Power Sources 245 (2014) 609e623610
cell phones. The results indicate that the compressive mechanicalbehavior is characterized by the buckling and densification of thecell components. Other testing and modeling data available werealso conducted on commercial LiCoO2 cylindrical or prismatic bat-tery cells [6,7]. However, this information is of limited use for re-searchers to model the mechanical performance of automotivehigh-voltage LiFePO4 battery cells and modules for crashworthi-ness analyses. Sahraei et al. [5] indicated that computational effort isquite significant to model local buckling phenomenon of batterycells under in-plane compression. Therefore, macro homogenizedmaterial models of the representative volume elements (RVEs) forboth the battery cells and modules have to be developed for crash-worthiness analyseswith sacrifice of the accuracy at themicro scale.
One of the primary objectives of this investigation is to developtestingmethods to determine the detailedmechanical properties oflithium-ion battery cells and modules [8] in a systematic fashion.The other is to provide the necessary experimental data for thedevelopment of macro homogenized material models in the com-panion papers [9,10]. At this point, there is no test standard forcharacterizing the mechanical properties of the representativevolume elements (RVEs) of lithium-ion batteries under largedeformation because it is difficult to test a live battery due to thesafety concern. Even in the discharged state, the volatile and toxicelectrolyte still poses a severe safety concern. Further, standardcompression tests in an in-plane direction of cell specimens do notprovide useful information since there are almost no bondingforces between the anode, cathode, separator and cover sheets. Thecell specimens fall apart when no out-of-plane constraints areapplied. Therefore, a constrained compression test procedure needs
to be developed and provide other researchers a way to conducttests and compare the test results. The results presented in thispaper can also help to understand the deformation process andmechanical behavior of battery cells such that homogenized ma-terial models can be developed for battery cells.
One ultimate goal of this investigation is to provide test data fordevelopment of computational models for multi-scale multi-physicsanalyses of battery packs in vehicles under crash loading conditions.Battery pack designs are different for different electric vehicles. Bat-tery packs can have various shapes of plastic or metal shells thatenclose a cooling system, electronics, and battery modules, thatcontain battery cellswith electronics cover plates, control electronics,pressure plates, laser welded bus bars, heat sink plates, inter-connected covers and compression bands. Battery pack designs areusually quite complex. Different types of finite elements such as shellelements, solid elements, rigid elements, and weld elements aretypically used in computational models to reduce the sizes of themodels. However, the sizes of the computational models for batterypacks can still be quite large for crashworthiness analyses since thesizes of finite elements have to be small with consideration of smallthicknesses of pack components anddeformationpatterns of interest.It is not possible to model the details of all battery pack componentsfor computational efficiency in full vehicle crashworthiness analyses.
Finite element models for small cell specimens under compres-sion in Sahraei et al. [5] showed the complexity of the finite elementanalyses at the length scale of cell components. Finite elementmodels for cell RVE specimens under in-plane constrainedcompression in Ali et al. [9] also showed the complexity of the finiteelement analyses at the length scale of cell components. Sahraei et al.
Fig. 1. A typical battery module.
W.-J. Lai et al. / Journal of Power Sources 245 (2014) 609e623 611
[7] conducted finite element analyses of an idealized battery packwith an outer steel shell and a homogenized crushable foam core tosimulate a drop test of the battery pack on a rigid cylinder. The re-sults showed that with the homogenized foam model, it wascomputationally efficient to model the drop test of the battery packfor optimum design. Ali et al. [10] conducted finite element analysesof a small-scale module specimen under in-plane punch indentation[8] based on several homogenized material models. The computa-tional results indicated that it was computationally efficient tosimulate the module specimen under punch indentation with thehomogenized material models. Therefore, homogenized materialmodels for cells and modules can be quite useful for simulation andcontrol of the crush responses of battery packs for optimum designunder crash loading conditions with computational efficiency. Basedon homogenized material models, computational results fordeformed battery cells from full vehicle crashworthiness analysescan then be used for further combined structural, electrical andthermal analyses of battery cells at the smaller length scales.
In this investigation, cell RVE specimens were first made fromthe individual cell components and in-plane constrainedcompression tests were then conducted. Out-of-plane compressiontests of cell RVE specimens were also conducted to understand thedifferent behaviors in the in-plane and out-of-plane directions.Based on the experimental observations of the cell RVE specimensunder in-plane constrained compression and the results of thecorresponding finite element analyses, the buckling mode of thecell RVE specimens under in-plane constrained compression isexamined by elastic buckling analyses of a beam with lateral con-straints. The buckling loads for the cell RVE specimens are thenobtained based on the elastic buckling solutions and the compositerule of mixture (ROM). In addition, an idealized kinematic model isdeveloped to explain the physical mechanisms of the kink and
shear band formation in the cell RVE specimens under in-planeconstrained compression. Finally, some conclusions are made.
2. Specimens
The structure of a typical battery module based on prismaticpouch cells is shown in Fig. 1. The module is composed of manycompartments (shown as several light blue compartments on bothends of the module in the web version) separated by aluminumheat dissipater sheets (shown in light blue). Inside each compart-ment (in the middle portion of the module where the sidealuminum heat dissipater sheet is removed), there are two cells(shown in gray) with one layer of foam (shown in black) betweenthe two cells. The battery module is usually held together by twostainless steel bands (not shown) with a specified tension and theadhesive (between the cell and the foam layer, and between the celland the aluminum heat dissipater sheet).
Each cell consists of five major components: cover sheet, anode,cathode, separator and electrolyte. Since the electrolyte is difficult tohandle during assembly due to its toxicity, all the cell RVE specimenstested in this studyweremadewithoutelectrolyte at theUniversityofMichigan. Table 1 lists all the detailed material and thickness infor-mation of the cell components. The cover sheet is composed ofaluminum foil with polyamide and polypropylene layers on bothsides bonded together by polyesterepolyurethane and urethane-freeadhesive, respectively. The thicknesses of the individual layers of thecover sheet are shown in Table 1 and the total thickness of the coversheet is 0.111 mm. The anode and cathode selected for this study aregraphite coated on copper foil and LiFePO4 coated on aluminum foil,respectively. The copper foil has a thickness of 9 mm and the totalthickness of the anode sheet is 0.2 mm. The aluminum foil has athickness of 15 mm and the total thickness of the cathode sheet is0.2 mm. Both the anode and cathode sheets are double-side coated.The SEM images of the graphite and LiFePO4 on the anode andcathode sheets are shown in Fig. 2(a) and (b), respectively. It is notedthat both activematerials on the electrodes are in a powder formheldtogether by binders and therefore possess a highdegree of porosity. Itis not the intent of this investigation to characterize the morphologyof theactivematerials. The separator ismadeofpolyethylenewith theporosity ranging from36 to 44% and a thickness from16 to 25 mm.Allthe cell components are purchased commercially.
Fig. 3(a) shows a schematic of a pouch cell and a cell RVEspecimen with the XeYeZ coordinate system. Here, X and Y arereferred to as the in-plane directions and Z is referred to as theout-of-plane plane direction. A small cell RVE specimen with thedimensions is shown in Fig. 3(b). Fig. 3(c) shows a side view of aportion of a cell RVE specimen with the individual cell compo-nents. The large red arrows shown in the figures indicate the in-plane compressive direction. As shown in Fig. 3(c), the anodes
hickness Notes
.025 mm 0.111 mme5 g m�2
.040 mme3 g m�2
.040 mmmm 0.2 mm Double side coated
Binder: SBR þ CMC5 mm 0.2 mm Double side coated
6e25 mm Porosity: 36%e44%Pore size: 0.01e0.1 mm
Fig. 2. SEM images of (a) graphite and (b) LiFePO4 on the anode and cathode sheets, respectively.
W.-J. Lai et al. / Journal of Power Sources 245 (2014) 609e623612
(shown in orange in the web version) and cathodes (shown ingray) form alternating layers with two cover sheets (shown inlight blue). The separators (shown in white) are located betweenelectrode and cover sheets. The cell RVE specimen is composed of10 anode, 10 cathode, 21 separator and 2 cover sheets. The cellcomponents were manually cut and assembled. The assembly ofthe cell components in the generic cell RVE specimen as sche-matically shown in Fig. 3(c) may be slightly different from thosein usual lithium-ion cells for convenience of assembly of thepurchased cell components. However, generic cell RVE specimens
Fig. 3. A schematic of (a) a pouch cell and a cell RVE specimen for the in-plane constrainedsmall portion of the cell RVE specimen showing the individual cell components. The largecolor in this figure legend, the reader is referred to the web version of this article.)
with slightly different assemblies should have the similar buck-ling, kink and shear band mechanisms under constrainedcompression as discussed later due to their layered structures.The specimen has the size of 25 mm � 25 mm � 4.6 mm. Noelectrolyte was added for the dry cells. Due to the large specimenwidth in the X direction compared to the specimen thickness, thespecimen width does not change before and after in-planecompression tests. Therefore, the specimens are subject to theplane strain conditions in the X direction under in-planecompression tests.
compression test, (b) a cell RVE specimen with the dimensions, and (c) a side view of ared arrows indicate the compressive direction. (For interpretation of the references to
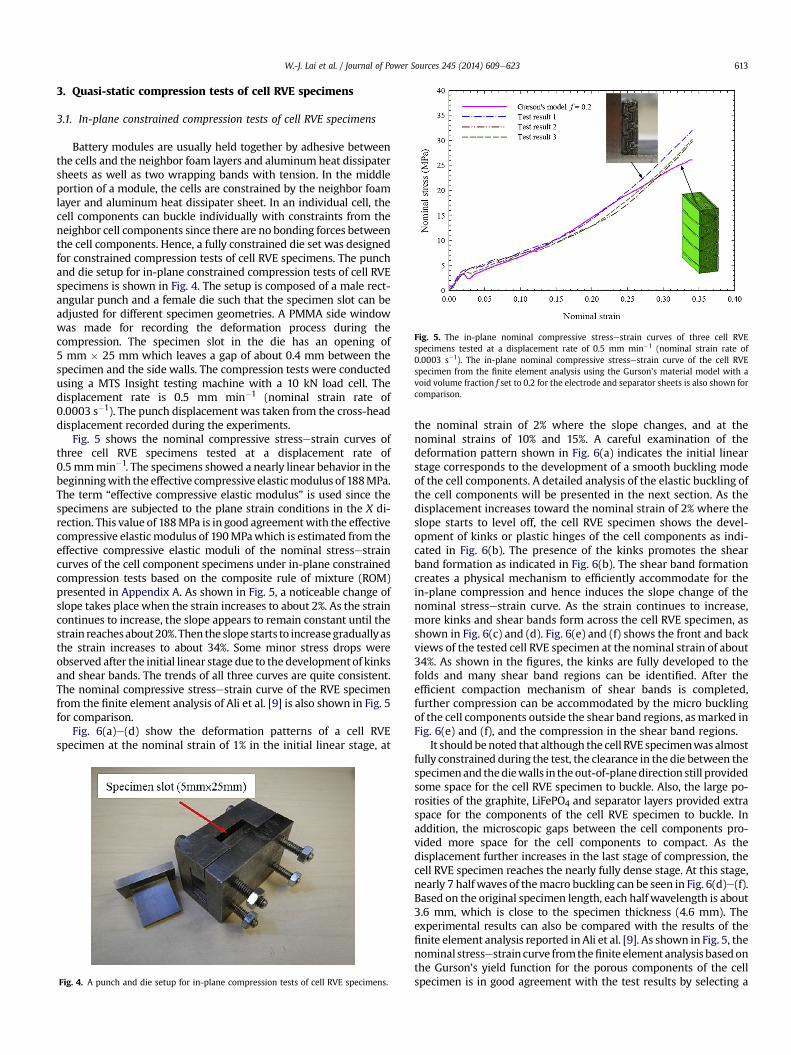
Fig. 5. The in-plane nominal compressive stressestrain curves of three cell RVEspecimens tested at a displacement rate of 0.5 mm min�1 (nominal strain rate of0.0003 s�1). The in-plane nominal compressive stressestrain curve of the cell RVEspecimen from the finite element analysis using the Gurson’s material model with avoid volume fraction f set to 0.2 for the electrode and separator sheets is also shown forcomparison.
W.-J. Lai et al. / Journal of Power Sources 245 (2014) 609e623 613
3. Quasi-static compression tests of cell RVE specimens
3.1. In-plane constrained compression tests of cell RVE specimens
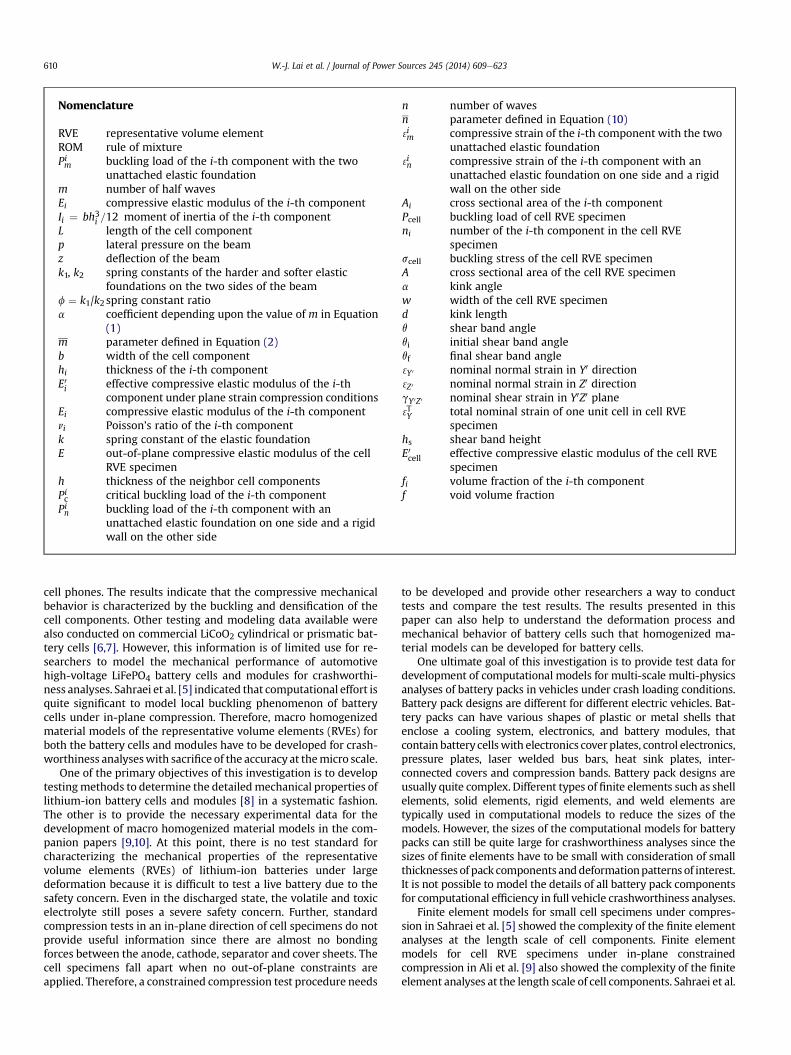
Battery modules are usually held together by adhesive betweenthe cells and the neighbor foam layers and aluminum heat dissipatersheets as well as two wrapping bands with tension. In the middleportion of a module, the cells are constrained by the neighbor foamlayer and aluminum heat dissipater sheet. In an individual cell, thecell components can buckle individually with constraints from theneighbor cell components since there are no bonding forces betweenthe cell components. Hence, a fully constrained die set was designedfor constrained compression tests of cell RVE specimens. The punchand die setup for in-plane constrained compression tests of cell RVEspecimens is shown in Fig. 4. The setup is composed of a male rect-angular punch and a female die such that the specimen slot can beadjusted for different specimen geometries. A PMMA side windowwas made for recording the deformation process during thecompression. The specimen slot in the die has an opening of5 mm � 25 mm which leaves a gap of about 0.4 mm between thespecimen and the side walls. The compression tests were conductedusing a MTS Insight testing machine with a 10 kN load cell. Thedisplacement rate is 0.5 mm min�1 (nominal strain rate of0.0003 s�1). The punch displacement was taken from the cross-headdisplacement recorded during the experiments.
Fig. 5 shows the nominal compressive stressestrain curves ofthree cell RVE specimens tested at a displacement rate of0.5mmmin�1. The specimens showed a nearly linear behavior in thebeginningwith the effective compressive elasticmodulus of 188MPa.The term “effective compressive elastic modulus” is used since thespecimens are subjected to the plane strain conditions in the X di-rection. This value of 188MPa is in good agreementwith the effectivecompressive elasticmodulus of 190MPawhich is estimated from theeffective compressive elastic moduli of the nominal stressestraincurves of the cell component specimens under in-plane constrainedcompression tests based on the composite rule of mixture (ROM)presented in Appendix A. As shown in Fig. 5, a noticeable change ofslope takes place when the strain increases to about 2%. As the straincontinues to increase, the slope appears to remain constant until thestrain reachesabout20%.Then the slope starts to increasegraduallyasthe strain increases to about 34%. Some minor stress drops wereobserved after the initial linear stage due to the development of kinksand shear bands. The trends of all three curves are quite consistent.The nominal compressive stressestrain curve of the RVE specimenfrom the finite element analysis of Ali et al. [9] is also shown in Fig. 5for comparison.
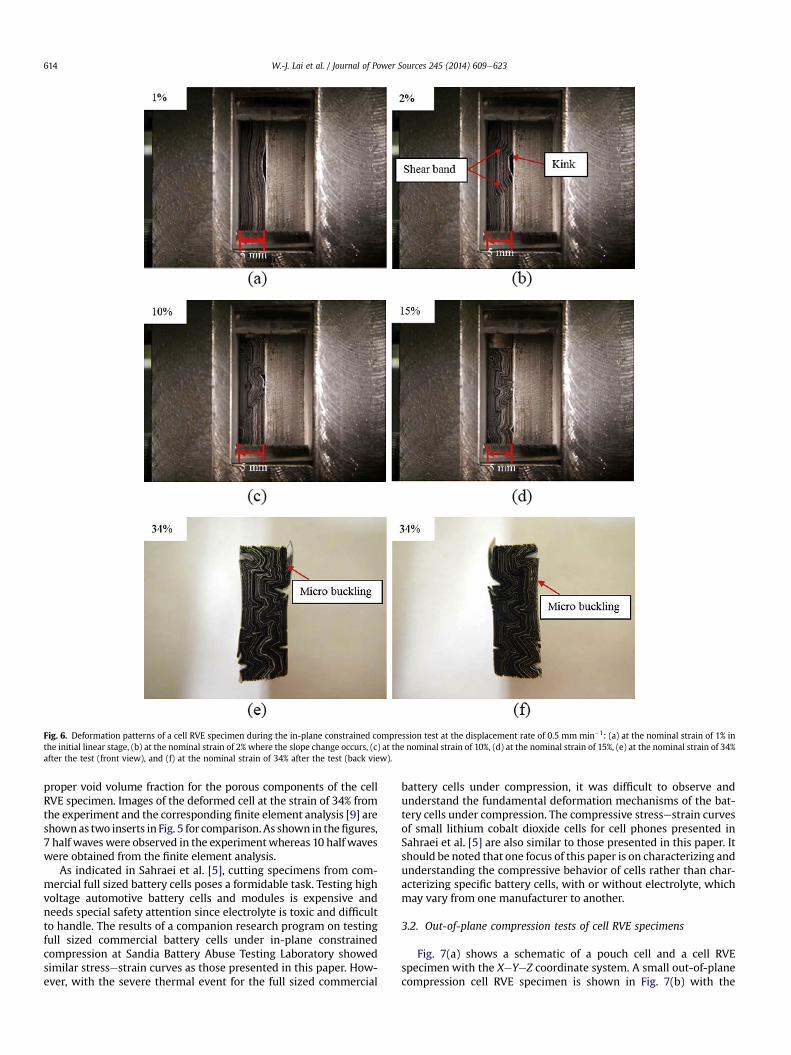
Fig. 6(a)e(d) show the deformation patterns of a cell RVEspecimen at the nominal strain of 1% in the initial linear stage, at
Fig. 4. A punch and die setup for in-plane compression tests of cell RVE specimens.
the nominal strain of 2% where the slope changes, and at thenominal strains of 10% and 15%. A careful examination of thedeformation pattern shown in Fig. 6(a) indicates the initial linearstage corresponds to the development of a smooth buckling modeof the cell components. A detailed analysis of the elastic buckling ofthe cell components will be presented in the next section. As thedisplacement increases toward the nominal strain of 2% where theslope starts to level off, the cell RVE specimen shows the devel-opment of kinks or plastic hinges of the cell components as indi-cated in Fig. 6(b). The presence of the kinks promotes the shearband formation as indicated in Fig. 6(b). The shear band formationcreates a physical mechanism to efficiently accommodate for thein-plane compression and hence induces the slope change of thenominal stressestrain curve. As the strain continues to increase,more kinks and shear bands form across the cell RVE specimen, asshown in Fig. 6(c) and (d). Fig. 6(e) and (f) shows the front and backviews of the tested cell RVE specimen at the nominal strain of about34%. As shown in the figures, the kinks are fully developed to thefolds and many shear band regions can be identified. After theefficient compaction mechanism of shear bands is completed,further compression can be accommodated by the micro bucklingof the cell components outside the shear band regions, asmarked inFig. 6(e) and (f), and the compression in the shear band regions.
It should benoted that although the cell RVE specimenwas almostfully constrained during the test, the clearance in the die between thespecimenand thediewalls in the out-of-planedirection still providedsome space for the cell RVE specimen to buckle. Also, the large po-rosities of the graphite, LiFePO4 and separator layers provided extraspace for the components of the cell RVE specimen to buckle. Inaddition, the microscopic gaps between the cell components pro-vided more space for the cell components to compact. As thedisplacement further increases in the last stage of compression, thecell RVE specimen reaches the nearly fully dense stage. At this stage,nearly 7 halfwaves of themacro buckling can be seen in Fig. 6(d)e(f).Based on the original specimen length, each half wavelength is about3.6 mm, which is close to the specimen thickness (4.6 mm). Theexperimental results can also be compared with the results of thefinite element analysis reported in Ali et al. [9]. As shown in Fig. 5, thenominal stressestrain curve fromthefinite element analysis basedonthe Gurson’s yield function for the porous components of the cellspecimen is in good agreement with the test results by selecting a
Fig. 6. Deformation patterns of a cell RVE specimen during the in-plane constrained compression test at the displacement rate of 0.5 mm min�1: (a) at the nominal strain of 1% inthe initial linear stage, (b) at the nominal strain of 2% where the slope change occurs, (c) at the nominal strain of 10%, (d) at the nominal strain of 15%, (e) at the nominal strain of 34%after the test (front view), and (f) at the nominal strain of 34% after the test (back view).
W.-J. Lai et al. / Journal of Power Sources 245 (2014) 609e623614
proper void volume fraction for the porous components of the cellRVE specimen. Images of the deformed cell at the strain of 34% fromthe experiment and the corresponding finite element analysis [9] areshownas two inserts in Fig. 5 for comparison. As shown in thefigures,7 half waveswere observed in the experimentwhereas 10 halfwaveswere obtained from the finite element analysis.
As indicated in Sahraei et al. [5], cutting specimens from com-mercial full sized battery cells poses a formidable task. Testing highvoltage automotive battery cells and modules is expensive andneeds special safety attention since electrolyte is toxic and difficultto handle. The results of a companion research program on testingfull sized commercial battery cells under in-plane constrainedcompression at Sandia Battery Abuse Testing Laboratory showedsimilar stressestrain curves as those presented in this paper. How-ever, with the severe thermal event for the full sized commercial
battery cells under compression, it was difficult to observe andunderstand the fundamental deformation mechanisms of the bat-tery cells under compression. The compressive stressestrain curvesof small lithium cobalt dioxide cells for cell phones presented inSahraei et al. [5] are also similar to those presented in this paper. Itshould be noted that one focus of this paper is on characterizing andunderstanding the compressive behavior of cells rather than char-acterizing specific battery cells, with or without electrolyte, whichmay vary from one manufacturer to another.
3.2. Out-of-plane compression tests of cell RVE specimens
Fig. 7(a) shows a schematic of a pouch cell and a cell RVEspecimen with the XeYeZ coordinate system. A small out-of-planecompression cell RVE specimen is shown in Fig. 7(b) with the
Fig. 7. A schematic of (a) a pouch cell and a cell RVE specimen for the out-of-plane compression test, (b) a cell RVE specimen with the dimensions, and (c) a side view of a smallportion of the cell RVE specimen showing the individual cell components. The large blue arrows indicate the compressive direction. (For interpretation of the references to color inthis figure legend, the reader is referred to the web version of this article.)
W.-J. Lai et al. / Journal of Power Sources 245 (2014) 609e623 615
dimensions. Fig. 7(c) shows a side view of a small portion of the cellRVE specimen with the individual cell components. The large bluearrows shown in the figure indicate the out-of-plane compressivedirection. The out-of-plane compression cell RVE specimen wassmaller than the in-plane compression cell RVE specimen in orderto avoid exceeding the load limit of the load cell. The size of the out-of-plane compression cell RVE specimen is reduced to10 mm � 10 mm � 4.6 mm as shown in Fig. 7(b). The layeredstructure of the cell RVE specimen is the same as that of the cell RVEspecimens for in-plane constrained compression tests. The test wasconducted using a MTS Insight testing machine with a displace-ment rate of 0.25 mmmin�1 (nominal strain rate of 0.0009 s�1). Noconstraint was applied to the lateral sides of the specimen in the Xand Y directions.
Three nominal compressive stressestrain curves of the cellRVE specimens under out-of-plane compression are shown inFig. 8(a). The three in-plane nominal compressive stressestraincurves in Fig. 5 are also shown for comparison. As shown in the
Fig. 8. (a) The out-of-plane nominal compressive stressestrain curves of cell RVE specimens(b) pictures of two specimens before (left) and after (right) compression. The three in-planecomparison.
figure, the low stress response in the early stage of the out-of-plane compression tests can be attributed to the consumptionof the porosity in the cell components and the microscopic gapsbetween the cell components. With the increasing strain,densification of the cell components kicked in and contributed tothe sharp increase of the stress. The nominal stressestrain curvesappear to be linear elastic again at the strain of about 40% as thestrain increases. This suggests that the total volume fraction ofthe porosity in the components and the microscopic gapsbetween the components is about 40% when the cell RVEspecimens are nearly fully condensed and become linear elasticas the strain increases. The tested specimens retained the finalthicknesses and appeared to be permanently deformed. Howev-er, no dimension change was observed in the two lateral di-rections perpendicular to the loading direction, whichcorresponds to zero Poisson’s ratio. Fig. 8(b) shows pictures ofcell RVE specimens before (left) and after (right) thecompression.
tested at a displacement rate of 0.25 mm min�1 (nominal strain rate of 0.0009 s�1) andnominal compressive stressestrain curves as shown in Fig. 5 are also shown in (a) for
Fig. 9. A schematic of a uniform straight beam under end loads and supported byunattached elastic foundations. Both ends are hinged and the beam is supported by theelastic foundations through the lateral pressure p proportional to the deflection in theZ direction. The elastic foundations on two sides of the beam have the spring constantsk1 and k2.
Table 2Effective compressive elastic moduli of cell components.
Effective compressive elastic modulus (MPa)
Cover sheet 575Anode 83Cathode 275Separator 90
W.-J. Lai et al. / Journal of Power Sources 245 (2014) 609e623616
4. Buckling analyses of cell RVE specimens under in-planeconstrained compression
Based on the experimental observations of the cell RVE specimensunder in-plane constrained compression, the physical mechanism toaccommodate the compression starts with the elastic buckling of thecell components. When a cell RVE specimen was made, the compo-nent sheets were first assembled and packed together. The specimenwas thenput in the slot of the female die.Whena cell RVE specimen isunder in-plane compression, the component sheets buckle inde-pendently with the lateral constraints from the neighbor componentsheets. Since the component sheets were only packed together, eachcomponent sheet can be treated as an individual thin plate or beamunder in-plane compressionwith the lateral constraintswhich canbetreated as unattached elastic foundations.
Fig. 9 shows a uniform straight beam under end loads andsupported by two unattached elastic foundations. Both ends arehinged and the beam is supported by the elastic foundationsthrough the lateral pressure proportional to the deflection in the Zdirection. Here, and represent the spring constants of the harderand softer elastic foundations on the two sides of the beam,respectively. The buckling load solution of the beam can be found inRef. [11]. Based on the solution listed in Ref. [11], the buckling loadof the i-th component with the two unattached elastic foundationscan be expressed as
Pim ¼ m2p2E0iIiL2
þ k2L2
m2p2fa (1)
where m represents the number of half waves in which thecomponent buckles and is equal to the lowest integer greater thanm. Here, m is defined as
In Equation (1), f ¼ k1/k2 and a depends upon the value of m. InEquations (1) and (2), Ii ð¼ bh3i =12Þ is themoment of inertia for the i-th component. E0i is the effective elasticmodulus for a thinplate underplane strain compression conditions and is equal to Ei=ð1� n2i Þ;where Ei and ni are the compressive elastic modulus and Poisson’sratio of the i-th component. The effective compressive elastic modulifor the cell component specimens are listed inTable 2. Here, L, b andhiare the length, width, and thickness of the i-th component.
As suggested from the experimental observations and the re-sults reported in the finite element analysis [9], the cell compo-nents buckle first. After the buckling of the cell components, kinksand shear bands are formed according to the buckling mode of thecell components. Based on the experimental observations, the cellRVE specimens appear to buckle in an asymmetric fashion whereno symmetry with respect to the central anode sheet was observed.However, the results of the finite element analysis [9] indicated thatin the very early stage the component sheets buckle in the sym-metric mode. For anode, cathode, and separator sheets in the cellRVE specimen, the sheets can be thought as a beam with two un-attached elastic foundations on both sides. For the anode, cathodeand separator sheets in the middle portion of the cell RVE speci-mens, the buckling mode will be dominated by the constraints onboth sides of the sheets. It is assumed that the spring constants forthe elastic unattached foundations are the same and denoted by k.Here, k represents the lateral force per unit plate length per unitdeflection of the neighbor components in the out-of-plane direc-tion. The spring constant k can be expressed in terms of the out-of-plane compressive elastic modulus E of the cell RVE specimens as
k ¼ Ebh
(3)
where h represents the thickness of the neighbor cell components.With the elastic spring constant k on both sides of the beam is equalto each other, Equation (1) becomes
Pim ¼ m2p2E0iIiL2
þ kL2
m2p2 (4)
where m again represents the number of half waves in which thecomponent buckles and is equal to the lowest integer greater thanm as before. Here, m is defined as
Equations (4) and (5) represent the buckling solution in Timo-shenko [12] for a beam with an attached elastic foundation.Consideringm as a real number as in Ali et al. [9], vPim=vm ¼ 0 gives
Table 3Buckling modes, loads, and strains for the component sheets in the middle portion
W.-J. Lai et al. / Journal of Power Sources 245 (2014) 609e623 617
m ¼�
kE0I
�14 Lp
(6)
of the cell RVE specimen with k ¼ 9.2 � 107 N m�2 and buckling loads and stressesfor the cell RVE specimen.
Cell buckling stress scell (MPa)at the componentbuckling strain 3im
2.80 (NA) 9.90 5.47 2.91
Table 4Buckling modes, loads, and strains for the component sheets near the sides of thecell RVE specimen with k ¼ 4.6 � 107 N m�2 and buckling loads and stresses for thecell RVE specimen.
Cell buckling stress scell (MPa)at the componentbuckling strain 3in
3.33 11.7 6.47 3.56
i i
The critical buckling load Pic can be determined as
Pic ¼ 2ðkEIÞ12 (7)Equation (6) can be rewritten for the half wavelength L m�1 as
Lm
¼�E0iIik
�14
p (8)
As indicated in Equations (7) and (8), the critical buckling load Picand the half wavelength L m�1 are independent of the specimenlength.
The cover sheets have only one unattached elastic foundationand are free to buckle to the unconstrained side due to the smallclearances in the die for the cell RVE specimen. However, the smallclearances will limit the cover sheets to fully develop a lower orderbuckling mode. For the anode, cathode and separator sheets nearthe cover sheets, they can start to buckle in a lower order mode butwill also be constrained by the rigid walls through the cover sheets.The results of the finite element analysis [9] indicate that the coversheets are constrained by the rigid walls and buckle in a high ordermode. For a beam with one unattached elastic foundation on oneside and a small clearance to a rigid wall on the other side, theelastic buckling solution is approximated by the elastic bucklingsolution for a beam with an unattached elastic foundation on oneside and a rigid wall on the other side as discussed in Ali et al. [9].For the cover sheets and the neighbor sheets, the buckling load ofthe i-th component can approximately be expressed as
Pin ¼ 4n2p2E0iIiL2
þ 3kL2
4n2p2 (9)
where n represents the number of waves in which the componentbuckles and is equal to the lowest integer greater than n: Here, n isdefined as
Considering n as a real number as in Ali et al. [9], vPin=vn ¼ 0gives
n ¼�
3k16E0iIi
�14 Lp
(11)
The critical buckling load Pic can be determined as
Pic ¼ 2ffiffiffi3
p �kE0iIi
�12 (12)
Equation (11) can be rewritten for the wavelength L/n as
Ln
¼�16E0iIi3k
�14
p (13)
As indicated in Equations (12) and (13), the critical buckling loadPic and the wavelength L/n are independent of the specimen length.
The elastic compressive modulus E of the cell obtained from theout-of-plane compression tests of the cell RVE specimens is 8.5 MPa.The spring constantk canbeestimatedas4.6�107Nm�2 for the coversheets and neighbor sheets near the diewalls, and 9.2�107Nm�2 forthe component sheets in the middle portion of the cell specimen. Forthe sheets in the middle portion of the cell specimen, the originalsolutiongivenbyTimoshenko [12] inEquations (4) and (5) canbeused
to estimate the bucklingmodes and loads of the component sheets inthemiddle portion of the specimen as listed in Table 3. The results forthe cover sheets are not applicable (NA) but are listed in Table 3 forreference only. As listed in Table 3, the values form are 21.3, 22.2, 16.3and 124.6 based on Equation (5) which give the bucklingmodes of 22,23,17 and 125 that give the lowest buckling loadswith the constraintsfor the cover sheet, anode, cathode and separator sheets in themiddleportion of the cell specimen, respectively.
For the cover sheets and the neighbor sheets near the die walls,the buckling modes and loads can be estimated based on Equations(9) and (10) for a beamwith an unattached elastic foundation on oneside and a rigid boundary on the other side as listed in Table 4. Notethat one wave of the cover sheets and neighbor sheets correspondsto two half waves of the component sheets in the middle portion ofthe cell RVE specimen. Therefore, the values for 2n are listed inTable 4 for comparison. As listed in Table 4, the values for 2n are 23.1,24.1, 17.6 and 137.4, which give the buckling mode number 2n of 24,26, 18 and 138 that give the lowest buckling loads with the con-straints for the cover sheet, anode, cathode and separator sheets nearthe sides of the cell RVE specimen, respectively. The correspondingbuckling loads for the component sheets are listed in Tables 3 and 4.
The corresponding compressive strains at these buckling loadscan be calculated by
3im ¼ Pim
E0iAior 3
in ¼ Pin
E0iAi(14)
for the component sheets in the middle portion or near the sides ofthe cell specimen. Here, is the cross sectional area of the i-thcomponent. Equation (14) gives the strains at these buckling loadsfor the i-th components. The values are also listed in Tables 3 and 4.As listed in the tables, the strains for all the cell componentscalculated in both buckling analyses are comparable to those ob-tained from the experiments and from the results of the finiteelement analysis [9].
W.-J. Lai et al. / Journal of Power Sources 245 (2014) 609e623618
The buckling loads of the cell RVE specimen when the cell com-ponents buckle can be obtained by summing over the loads of the cellcomponents at the strains when the cell components buckle as
Pcell ¼ 3im
XniE
0iAi or Pcell ¼ 3
in
XniE
0iAi (15)
where ni is the number of the i-th component in the cell RVE spec-imen according to the composite rule of mixture. The nominalbuckling stress of the cell RVE specimen can be obtained by dividingthe load by the cross sectional area of the cell RVE specimen as
scell ¼PcellA
(16)
The buckling stresses for the cell RVE specimen based on thebuckling loads of the cover sheets, anode, cathode and separatorsheets near the sides of the cell RVE specimen are 3.33, 11.7, 6.47,and 3.56 MPa as listed in Table 4. It should be noted that the resultsof the finite element analysis in Ref. [9] suggest that the coversheets actually buckle first. The buckling stress of 3.33 MPa basedon the buckling load of the cover sheets near the sides of the cellRVE specimen in Table 4 in general agrees with the critical stress of4.0 MPa obtained from the experiments. The buckling stresses forthe cell RVE specimen based on the buckling loads of the anode,cathode and separator sheets in the middle portion of the cell RVEspecimen are 9.90, 5.47, and 2.91 MPa as listed in Table 3. Thebuckling stresses listed in Tables 3 and 4 in general agree with thecritical stress of 4.0 MPa obtained from the experiments.
It should be noted again that the results of the finite elementanalysis in Ref. [9] suggest that the cover sheets actually buckle first.Based on Equation (10), n ¼ 11:62 and n ¼ 12for the cover sheets.This corresponds to 24 half waves for the cell RVE specimen. Notethat 7 half waves were observed in the experiment whereas 10 halfwaves are obtained from the corresponding finite element analysis[9]. However, the in-plane constrained compression test conductedin this investigation has a total clearance of 0.358 mm between thecell RVE specimen and the die walls. This can reduce the springconstants for the unattached elastic foundations. The computationalresults indicate that when the clearance is reduced to 0, 15 halfwaves appear which is reasonably in agreement with about 20 halfwaves obtained by both elastic buckling analyses. It should be notedthat the analytical results based on Equations (5) and (10) areapproximate in nature and the analytical results are in reasonableagreement with the experimental and computational results.
As indicated in Equations (8) and (13), the half wavelength Lm�1
for the component sheets in the middle portion of the cell RVEspecimens and the wavelength L/n for the component sheets nearthe sides of the cell RVE specimens are independent of the spec-imen length. As indicated in Equations (7) and (12), the bucklingloads are functions of the elastic bending rigidity and the out-of-plane elastic modulus of the cell RVE specimens, and they are in-dependent of the specimen length. The results suggest that thelength of the cell RVE specimens is appropriately selected since thecell RVE specimens buckle with multiple half waves under in-planeconstrained compression. Therefore, the constrained compressivebehavior of the cell RVE specimens obtained in this investigationcan in general represent that of battery cells with a full length. Afterthe buckling mode is settled, plastic hinges or kinks will developand the shear band mechanism will kick in to efficiently compactthe cell RVE specimens as the compression continues.
5. Kink and shear band formation under in-planeconstrained compression
Based on the experimental observations of the cell RVE speci-mens under in-plane constrained compression, the physical
mechanism to accommodate the compression can be summarizedin the following. First, the elastic buckling of the cell RVE compo-nents takes place. Next, kinks of the components are initiated andconsequently shear band regions across the specimen are formed.As the compression continues, the shear band regions are com-pressed, sheared and rotated. Also, the regions outside the shearbands are under compression. Once the shear band regions reachtheir shear and rotational limits, compaction takes place in bothregions inside and outside of the shear bands.
Fig. 10(a)e(f) shows an idealized deformation process in a cellRVE specimen under in-plane constrained compression withoutany clearance between the specimen and the die walls to explainthe kink and shear band formationmechanism in the specimen andestimate the strains inside and outside of the shear band region interms of the kink length, kink angle and shear band angle.Fig. 10(a)e(c) shows schematics of a cell RVE specimen before,during, and after the formation of shear band regions under in-plane constrained compression, respectively. Fig. 10(d)e(f) showsthe detailed schematics of one unit cell of the specimen corre-sponding to Fig. 10(a)e(c), respectively. Fig. 10(a) and (d) shows theoriginal configuration of the specimen before the kinks and shearband regions are formed. In Fig. 10(a), region I between two paralleldashed lines as marked represents the shear band region. Since noshear bands are formed, the initial kinked angle a (as marked inFig. 10(e) is 90�. Fig. 10(b) and (e) shows the configuration wherethe kinks are formed and the shear band regions are compressed,sheared and rotated. During the deformation process, the kinkedangle a decreases from the original kink angle of a¼ 90� to the finalkink angle of a¼ 0�. Fig. 10(c) and (f) shows the configurationwhenthe shear band region has reached its shear and rotational limit.
Fig.10(d)e(f) shows the deformation history of one unit cell of thespecimen. In Fig. 10(d), the global Y and Z coordinates are shown. InFig. 10(d)e(f), the local material Y0 and Z0 coordinates represent thecoordinates that rotate or move with the material during the defor-mation. In Fig.10(d)e(f),w represents the cell thickness, d representsthe kink length (which is assumed to be constant in this idealizedmodel), q represents the shear band angle, and qi and qf represent theinitial andfinal shear band angles, respectively. As shown inFig.10(d),shear bands (between two parallel dashed lines) are to be formedacross the cell RVE specimen (shown in gray) to accommodate thecompression. During the deformation, the kink angleadeceases from90�toward 0� while the shear band angle changes due to the rotationof the shear band region and the deformation in the regions insideandoutside the shear band. As shown in Fig.10(d)e(f), the shear bandregion I can be represented by the parallelogram ABCD which isdeformed into A0B0C0D0 and then A00B00C00D00. Therefore, in region Iinside the shear band, thematerial has the compressive strains in theY0 andZ0 directions and the shear strain in theY0eZ0 plane.As shown inFig. 10(d)e(f), region II outside the shear band can be represented bythe triangle CDE which is deformed into C0D0E0 and then C00D00E00.Therefore, in region II outside the shear band, the material is underbiaxial compressive strains in theY0andZ0 directions. After reaches0�,q decreases as the compression continues. It should be noted thatFig. 10(a)e(f) are idealized. In reality, the shear bands do not form atthe same time and the shear band angles are different for differentparts of the specimens.
Based on the idealized shear band deformation process, the localmaterial strains inside and outside the shear band regions can beestimated in terms of the compressive strain of the cell RVE spec-imen. The shear band mechanism appears to optimize the totalcompressive strain in the Y direction. It should be mentioned thatthe cell can be thought of a unidirectional composite where theload carrying capacity is high in the Y or Y0 direction and low in theZ or Z0 direction under compression. Therefore, the strain in the Y0
direction is assumed to be zero in the shear band region for this
Fig. 10. Schematics of a cell RVE specimen (a) before, (b) during, and (c) after the shear band formation. (d)e(f) are detailed schematics corresponding to (a)e(c), respectively. The Yand Z coordinates are the global coordinates and the Y0 and Z0 coordinates are the local material coordinates in (d)e(f).
W.-J. Lai et al. / Journal of Power Sources 245 (2014) 609e623 619
idealized model. The nominal strains in region I inside the shearband with respect to the local material coordinate system are
3Y 0 ¼ 0 (17)
3Z 0 ¼�w�dcos a
cos q
�sinðaþ qÞ �w
w(18)
gY 0Z 0 ¼ p2� a� qþ tan�1
�ðw� d cos aÞtan q
w
�(19)
Here, the engineering shear strain gY 0Z 0 is defined according tothe definition of the engineering shear strain of the small straintheory. The nominal strains in region II outside the shear band withrespect to the local coordinate system can be expressed as
3Y 0 ¼ ðw� dcos aÞtan q�w tan qiw tan qi
(20)
3Z 0 ¼ ðw� d cos aÞ �ww
¼ �d cos aw
(21)
The total nominal strain 3TY for one unit cell of the specimen canbe written as
3TY ¼ Dhs
hs¼ ½ðw� d cos aÞtan qþ d sin a� � ðw tan qi þ dÞ
w tan qi þ d
(22)
where hs is the shear band height. The nominal strains inside andoutside the shear band can be estimated for a given set of w, d, qi,and q.
When the compressive strain in the Y0 direction in region II in-creases uniformly, the shear band angle remain unchanged. Sincethe change of the shear band angle q was found to be small as a
decreases, the shear band angle is assumed to be constant. Withthis assumption, the equations for the nominal strains in both re-gions can be simplified. For region I inside the shear band region,Equation (18) can be simplified to
3Z ’ ¼�w�d cos a
cos qi
�sinðaþ qiÞ �w
w(23)
W.-J. Lai et al. / Journal of Power Sources 245 (2014) 609e623620
In region II outside of the shear band region, Equation (20) canbe simplified to
3Y 0 ¼ �d cos aw
(24)
Equations (21) and (24) indicate that region II is now sub-jected to equal biaxial compression. The total nominal strain forone unit cell of the specimen in Equation (22) can be simplifiedto
3TY ¼ �d cos a tan qi þ d sin a� d
w tan qi þ d(25)
The nominal strains inside and outside the shear band regioncan be estimated for a ¼ 0 when the shear band reaches its shearand rotational limit. The total nominal strain in Equation (25)becomes
3TY ¼ �d tan qi � d
w tan qi þ d¼ �d
w ðtan qi þ 1Þtan qi þ d
w
(26)
As indicated in Equation (26), the shear band compactionmechanism is quite efficient to produce compaction with the extracontribution due to the kink length d. After a reaches the limit of 0,the shear band angle q decreases as the compression increases inboth regions I and II.
Another idealization can also be made with the assumption thatthe cell components are rigid in the Y or Y0 direction but plastichinges or kinks can be formed whereas the components arecompliant in the Z or Z0 direction. In this case, the nominal strain inthe Y or Y0 direction in region II becomes
3Y 0 ¼ 0 (27)
The additional term due to the compressive strain in the Y or Y0
direction in region II in Equation (26) disappears and the total strainof one unit cell of the specimen becomes
3TY ¼ �d
w tan qi þ d¼ �d
w
tan qi þ dw
(28)
As indicated in Equation (28), the total compressive strain of thespecimen can be estimated easily from the normalized kinkedlength d/w. Finally, it should be mentioned that the deformationmechanism as discussed here is purely kinematic and it gives somephysical insight on the deformation mechanism of the cell RVEspecimens under in-plane constrained compression as observed inexperiments and as obtained from the results of the finite elementanalysis [9].
It should be mentioned that the physical mechanism of the kinkand shear band formation appears in different types of battery cellssuch as the lithium iron phosphate battery RVE specimens underin-plane constrained compression as investigated in this paper andthe lithium cobalt dioxide battery cells under in-plane constrainedcompression as reported in Ref. [5]. The physical mechanism alsoappears in cover sheet, anode, cathode and separator specimens asshown in Figs. A1eA4. Note that the anode, cathode and separatorare compressible porous sheets while the cover sheet is made ofnearly incompressible polyamide, polypropylene and adhesives. Itseems that the physical mechanism of the kink and shear bandformation is a general deformation mechanism that can appear inunattached sheets under in-plane constrained compression.
6. Conclusions
In this study, themechanical behavior of cell RVE specimens wasinvestigated under both in-plane constrained and out-of-plane
compressive loading conditions. The designs of the cell RVE spec-imens and the in-plane constrained compression test setup are forcells in the middle portion of a module with the lateral constraintsin the out-of-plane direction. For this investigation, conclusions canbe made in the following.
1. Quasi-static in-plane constrained compression tests of cell RVEspecimens were conducted. The deformation process is corre-lated to the nominal stressestrain curve by carefully examiningthe recorded deformation patterns and the stressestraincurves concurrently. The results indicate the load carryingbehavior of cell RVE specimens is characterized by the bucklingof cells with a wavelength approximately in the order of thethickness of the cells, kink and shear band formation, and thefinal densification of the cell components.
2. The nominal compressive stressestrain curves of cell RVEspecimens under in-plane constrained and out-of-planecompression are different. The different nominal compressivestressestrain curves in the in-plane and out-of-plane di-rections suggest that the cells can be modeled as anisotropicfoams or cellular materials. The in-plane and out-of-planenominal compressive stressestrain curves presented in thispaper can be used to develop macro homogenized anisotropicmaterial models for crashworthiness analyses.
3. The initial elastic buckling mode of the cell RVE specimen un-der in-plane constrained compression can be correlated to theelastic buckling solution of a beamwith lateral constraints. Thedevelopment of the higher order buckling modes of thecomponent sheets and the critical stresses observed in exper-iments are in agreement with the results of the analyticalbuckling solutions and the corresponding finite element ana-lyses. The elastic buckling analyses also justify the length se-lection of the cell RVE specimens.
4. An idealized kinematic model is developed to explain the kinkand shear band formation in the cell RVE specimens under in-plane constrained compression. The nominal strains in theregions inside and outside of the shear band can be estimatedby the idealized model and the results give some insight on thephysical deformation process observed in experiments. Thekinematic model appears to be valid in general for unattachedsheets under in-plane constrained compression.
Acknowledgment
The support of this work by the Crash Safety Working Group(CSWG) of the United States Council on Automotive Research(USCAR) and Ford Motor Company is appreciated. Helpful discus-sions with Yibing Shi, Guy Nusholtz, and Ronald Elder of Chrysler,Saeed Barbat, Bill Stanko, andMark Mehall of Ford, Jenne-Tai Wang,Ravi Nayak, Kris Yalamanchili and Stephen Harris of GM, Christo-pher Orendorff of Sandia National Laboratory, Seung-Hoon Hong ofUniversity of Michigan, and Natalie Olds of USCAR are greatlyappreciated.
Appendix A. Effective compressive elastic moduli of cellcomponents under in-plane constrained compression
In-plane constrained compression tests were conducted forthe component sheets to examine the deformation patterns andto estimate the effective compressive elastic moduli of thecomponent sheets. These effective compressive elastic moduliare then used to estimate the effective compressive elasticmodulus of the cell RVE specimens based on the composite ROMand compared to the value obtained from the test results of thecell RVE specimens under in-plane constrained compression
W.-J. Lai et al. / Journal of Power Sources 245 (2014) 609e623 621
tests. The specimens of cell components were made by stackingdifferent numbers of sheets of cell components to a total thick-ness of 5 mm. The specimens have the in-plane dimensions of25 mm � 25 mm. The numbers of sheets for the cover sheet,anode, cathode, and separator specimens are 45, 25, 25, and 250,respectively, to make the total specimen thickness of 5 mm. Thetest procedure is the same as stated in Section 3.1.
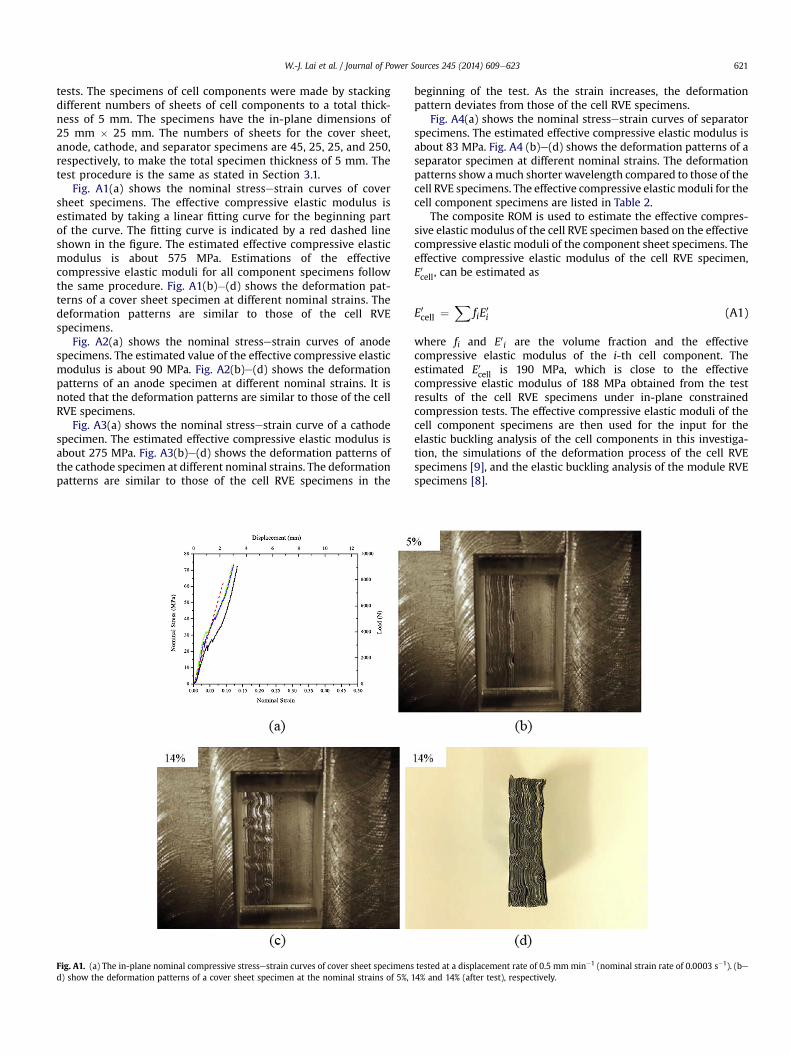
Fig. A1(a) shows the nominal stressestrain curves of coversheet specimens. The effective compressive elastic modulus isestimated by taking a linear fitting curve for the beginning partof the curve. The fitting curve is indicated by a red dashed lineshown in the figure. The estimated effective compressive elasticmodulus is about 575 MPa. Estimations of the effectivecompressive elastic moduli for all component specimens followthe same procedure. Fig. A1(b)�(d) shows the deformation pat-terns of a cover sheet specimen at different nominal strains. Thedeformation patterns are similar to those of the cell RVEspecimens.
Fig. A2(a) shows the nominal stressestrain curves of anodespecimens. The estimated value of the effective compressive elasticmodulus is about 90 MPa. Fig. A2(b)e(d) shows the deformationpatterns of an anode specimen at different nominal strains. It isnoted that the deformation patterns are similar to those of the cellRVE specimens.
Fig. A3(a) shows the nominal stressestrain curve of a cathodespecimen. The estimated effective compressive elastic modulus isabout 275 MPa. Fig. A3(b)e(d) shows the deformation patterns ofthe cathode specimen at different nominal strains. The deformationpatterns are similar to those of the cell RVE specimens in the
Fig. A1. (a) The in-plane nominal compressive stressestrain curves of cover sheet specimensd) show the deformation patterns of a cover sheet specimen at the nominal strains of 5%, 1
beginning of the test. As the strain increases, the deformationpattern deviates from those of the cell RVE specimens.
Fig. A4(a) shows the nominal stressestrain curves of separatorspecimens. The estimated effective compressive elastic modulus isabout 83 MPa. Fig. A4 (b)e(d) shows the deformation patterns of aseparator specimen at different nominal strains. The deformationpatterns show amuch shorter wavelength compared to those of thecell RVE specimens. The effective compressive elastic moduli for thecell component specimens are listed in Table 2.
The composite ROM is used to estimate the effective compres-sive elastic modulus of the cell RVE specimen based on the effectivecompressive elastic moduli of the component sheet specimens. Theeffective compressive elastic modulus of the cell RVE specimen,E0cell, can be estimated as
E0cell ¼X
fiE0i (A1)
where fi and E0 i are the volume fraction and the effectivecompressive elastic modulus of the i-th cell component. Theestimated E0cell is 190 MPa, which is close to the effectivecompressive elastic modulus of 188 MPa obtained from the testresults of the cell RVE specimens under in-plane constrainedcompression tests. The effective compressive elastic moduli of thecell component specimens are then used for the input for theelastic buckling analysis of the cell components in this investiga-tion, the simulations of the deformation process of the cell RVEspecimens [9], and the elastic buckling analysis of the module RVEspecimens [8].
tested at a displacement rate of 0.5 mm min�1 (nominal strain rate of 0.0003 s�1). (be4% and 14% (after test), respectively.
Fig. A2. (a) The in-plane nominal compressive stressestrain curves of anode specimens tested at a displacement rate of 0.5 mm min�1 (nominal strain rate of 0.0003 s�1). (bed)show the deformation patterns of an anode specimen at the nominal strains of 5%, 25%, and 40% (after test), respectively.
Fig. A3. (a) The in-plane nominal compressive stressestrain curve of a cathode specimen tested at a displacement rate of 0.5 mm min�1 (nominal strain rate of 0.0003 s�1). (bed)show the deformation patterns of the cathode specimen at the nominal strains of 3%, 15%, and 24% (after test), respectively.
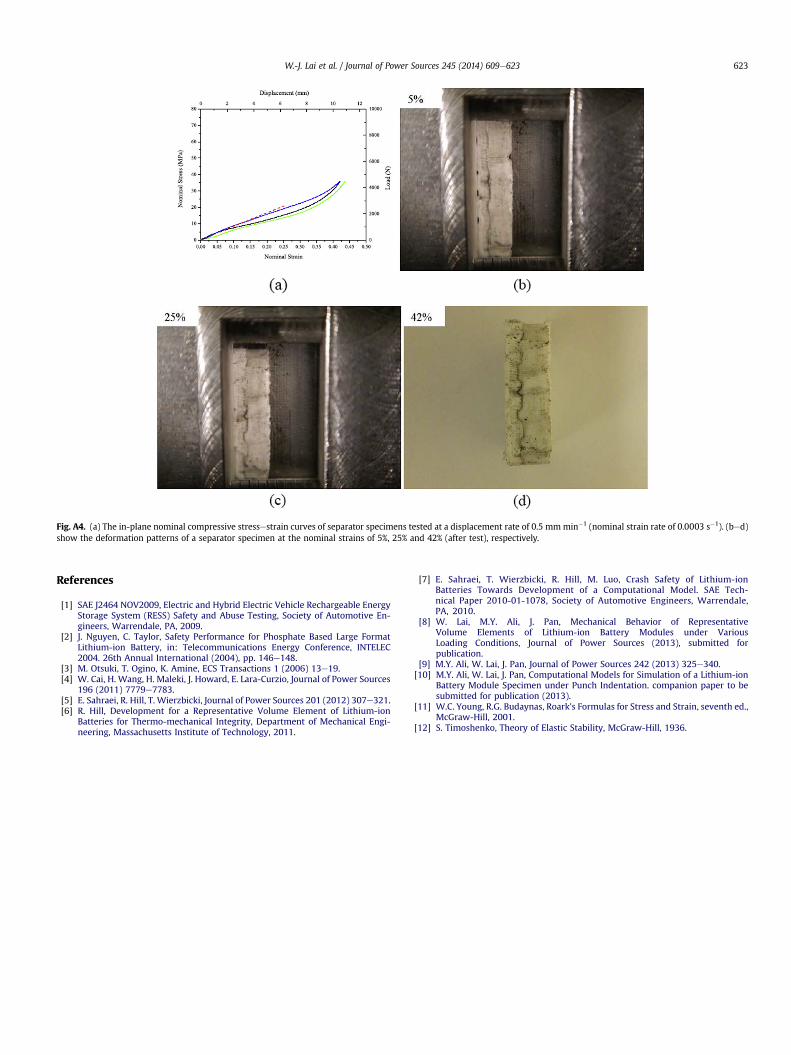
Fig. A4. (a) The in-plane nominal compressive stressestrain curves of separator specimens tested at a displacement rate of 0.5 mmmin�1 (nominal strain rate of 0.0003 s�1). (bed)show the deformation patterns of a separator specimen at the nominal strains of 5%, 25% and 42% (after test), respectively.
W.-J. Lai et al. / Journal of Power Sources 245 (2014) 609e623 623
References
[1] SAE J2464 NOV2009, Electric and Hybrid Electric Vehicle Rechargeable EnergyStorage System (RESS) Safety and Abuse Testing, Society of Automotive En-gineers, Warrendale, PA, 2009.
[2] J. Nguyen, C. Taylor, Safety Performance for Phosphate Based Large FormatLithium-ion Battery, in: Telecommunications Energy Conference, INTELEC2004. 26th Annual International (2004), pp. 146e148.
[3] M. Otsuki, T. Ogino, K. Amine, ECS Transactions 1 (2006) 13e19.[4] W. Cai, H. Wang, H. Maleki, J. Howard, E. Lara-Curzio, Journal of Power Sources
196 (2011) 7779e7783.[5] E. Sahraei, R. Hill, T. Wierzbicki, Journal of Power Sources 201 (2012) 307e321.[6] R. Hill, Development for a Representative Volume Element of Lithium-ion
Batteries for Thermo-mechanical Integrity, Department of Mechanical Engi-neering, Massachusetts Institute of Technology, 2011.
[7] E. Sahraei, T. Wierzbicki, R. Hill, M. Luo, Crash Safety of Lithium-ionBatteries Towards Development of a Computational Model. SAE Tech-nical Paper 2010-01-1078, Society of Automotive Engineers, Warrendale,PA, 2010.
[8] W. Lai, M.Y. Ali, J. Pan, Mechanical Behavior of RepresentativeVolume Elements of Lithium-ion Battery Modules under VariousLoading Conditions, Journal of Power Sources (2013), submitted forpublication.
[9] M.Y. Ali, W. Lai, J. Pan, Journal of Power Sources 242 (2013) 325e340.[10] M.Y. Ali, W. Lai, J. Pan, Computational Models for Simulation of a Lithium-ion
Battery Module Specimen under Punch Indentation. companion paper to besubmitted for publication (2013).
[11] W.C. Young, R.G. Budaynas, Roark’s Formulas for Stress and Strain, seventh ed.,McGraw-Hill, 2001.
[12] S. Timoshenko, Theory of Elastic Stability, McGraw-Hill, 1936.


![[Engelberg] Compressive Sensing](https://static.documents.pub/doc/80x56/55cf9985550346d0339dc8ee/engelberg-compressive-sensing.jpg)


