Accepted Manuscript Mechanical properties of pultruded GFRP WF, channel and angle profiles for limit state/permissible stress design Geoffrey John Turvey, Yingshun Zhang PII: S1359-8368(17)34267-1 DOI: 10.1016/j.compositesb.2018.04.010 Reference: JCOMB 5618 To appear in: Composites Part B Received Date: 18 December 2017 Revised Date: 7 March 2018 Accepted Date: 5 April 2018 Please cite this article as: Turvey GJ, Zhang Y, Mechanical properties of pultruded GFRP WF, channel and angle profiles for limit state/permissible stress design, Composites Part B (2018), doi: 10.1016/ j.compositesb.2018.04.010. This is a PDF file of an unedited manuscript that has been accepted for publication. As a service to our customers we are providing this early version of the manuscript. The manuscript will undergo copyediting, typesetting, and review of the resulting proof before it is published in its final form. Please note that during the production process errors may be discovered which could affect the content, and all legal disclaimers that apply to the journal pertain.
Transcript
Accepted Manuscript
Mechanical properties of pultruded GFRP WF, channel and angle profiles for limitstate/permissible stress design
Geoffrey John Turvey, Yingshun Zhang
PII: S1359-8368(17)34267-1
DOI: 10.1016/j.compositesb.2018.04.010
Reference: JCOMB 5618
To appear in: Composites Part B
Received Date: 18 December 2017
Revised Date: 7 March 2018
Accepted Date: 5 April 2018
Please cite this article as: Turvey GJ, Zhang Y, Mechanical properties of pultruded GFRP WF, channeland angle profiles for limit state/permissible stress design, Composites Part B (2018), doi: 10.1016/j.compositesb.2018.04.010.
This is a PDF file of an unedited manuscript that has been accepted for publication. As a service toour customers we are providing this early version of the manuscript. The manuscript will undergocopyediting, typesetting, and review of the resulting proof before it is published in its final form. Pleasenote that during the production process errors may be discovered which could affect the content, and alllegal disclaimers that apply to the journal pertain.
ACCEPTED MANUSCRIPTRevised Manuscript without figures.docx
1
Mechanical Properties of Pultruded GFRP WF, Channel and Angle Profiles for Limit State/Permissible Stress Design
by
Geoffrey John Turveya and Yingshun Zhanga,b
aEngineering Department, Lancaster University, Bailrigg, Lancaster, LA1 4YW, UK bDoosan Babcock, Porterfield Road, Renfrewshire, PA4 8DJ, UK
(aCorresponding Author’s Email Address: [email protected]) Abstract Coupon test data from five pultruded GFRP profiles is used to generate longitudinal/transverse, tensile/compressive ultimate stresses, elastic moduli, minor/major Poisson’s ratios and ultimate strains (some of which are not in the pultruders’ design manuals). Characteristic ultimate stresses/elastic moduli are compared to design manual minimum values. The former depend on profile size/shape, whereas the latter are shape-/size-independent. Limit state design stresses are shown to be larger than permissible stress design stresses. However, most of the limit state longitudinal design elastic moduli are smaller and all of the transverse design elastic moduli are larger than the permissible stress values. Keywords: A. Polymer-matrix composites (PMCs); B. Mechanical properties; D. Mechanical testing; E. Pultrusion 1. Introduction Pultruded GFRP structural grade profiles have been used for many years in a wide variety of secondary structures such as staircases, walkways and raised platforms. Their use in these and other applications continues to grow as awareness of their potential amongst the structural engineering community increases. In order to promote the use of their GFRP profiles and assist structural engineers engaged in the design of GFRP structures, several pultruders began to publish design manuals about 40 years ago. During the intervening years they have continued to update the manuals and have made them accessible online [1 – 3]. In 1996 these manuals were supplemented with the EUROCOMP Design Code and Handbook [4], which was the first limit state design guidance for Fibre-Reinforced Polymer (FRP) composite materials/structures used in infrastructure. More recently, limit state design guides have been published in Europe and Japan (see for example, [5 – 8]). Perhaps the most up-to-date design guides for FRP composite structures are those published under the auspices of the ASCE [9] and the EU’s CEN Technical Committee 250 [10]. The aforementioned pultruders’ manuals and design guides provide useful and reasonably comprehensive information for the design of pultruded GFRP structures. In the pultruders’ manuals there is a particular focus on the ultimate stress and elastic modulus properties of their standard structural profiles, whereas in the design guides the focus is on how ultimate stress and elastic modulus data are used in the design of FRP components and structures so that they comply with the specified serviceability and ultimate limit state criteria. However, it is important to appreciate that the basic mechanical properties (ultimate stress, elastic modulus etc.) of the GFRP standard structural profiles, given in the pultruders’ manuals, are described as typical or minimum values of these properties and, therefore, are not applicable to limit state design, even though they were established by tests carried out in accordance with early versions of the relevant ASTM standards. They are, however, frequently used in permissible stress design in conjunction with relatively large factors of safety. Because the pultruders have not disclosed full details of the mechanical properties of the pultruded GFRP standard structural profiles their typical/minimum status remains to be independently and rigorously verified. In the light of the foregoing comments and the fact that the pultruders manufacture standard structural profiles which are deemed to comply with the E17 and E23 requirements, i.e. have flexural elastic moduli of 17 and 23GPa, given in [11], it would be useful to undertake (independent of the pultruders) more comprehensive mechanical testing of pultruded GFRP standard structural profiles to verify the status of the minimum properties, particularly ultimate stress and elastic modulus, and obtain characteristic values which may be used in limit state design.
MANUSCRIP
T
ACCEPTED
ACCEPTED MANUSCRIPTRevised Manuscript without figures.docx
2
It is also worth pointing out that a number of important mechanical properties of the standard pultruded GFRP structural profiles are incomplete or absent from the pultruders’ design manuals. In particular, ultimate strains are not included in [1 – 3]. Furthermore, it appears that, except for flat plate, the mechanical properties are assumed to be independent of the shape, wall thickness and fibre architecture of the profiles, and only marginally dependent on the type of polymer matrix. The justification for these assumptions is not articulated in [1 - 3] and, therefore, would also appear to merit further investigation. Since the appearance of the early editions of [1 – 3] a number investigations of the tensile and compressive properties of pultruded GFRP composites have been reported and several of them are reviewed briefly in the succeeding paragraphs. However, it appears that they have had little impact, since the basic mechanical (ultimate stress, elastic modulus etc) properties remain unchanged in later online versions of [1 – 3]. In 1992, as part of an extensive investigation of the notched strength of 6.4 mm thick pultruded GFRP plate [12], tension and compression tests were carried out on unnotched coupons to determine the effects on ultimate stress of width and roving orientation relative to their longitudinal axis. Three widths, 15, 25 and 35 mm, and three orientations, 0o, 45o and 90o, were investigated. For the tension coupons, the scatter in the ultimate stress of the 0o coupons increased significantly as the width decreased, due to variations in the lateral spacing of the rovings. However, the mean ultimate tensile stress was not significantly affected by coupon width. Tension tests on rectangular coupons cut longitudinally out of the web and flanges of 254 x 254 x 9.5 mm and 305 x 305 x 12.7 mm pultruded GFRP Wide Flange (WF) profiles were reported in [13]. The tests indicated that similar mean longitudinal ultimate tensile stresses and elastic moduli could be obtained provided five coupons from all parts of the cross-section at any position along the profile were tested. Tension tests on aluminium tabbed rectangular coupons cut out of a 203 x 203 x 9.5 mm vinyl ester pultruded GFRP WF profile have also been carried out and mean longitudinal/transverse elastic moduli, ultimate stresses and major/minor Poisson’s ratios obtained [14]. Unfortunately, standard deviations were not recorded and so characteristic values could not be determined. However, the principal objectives of the tests were to provide data to verify analytical procedures for calculating the ultimate stress and elastic modulus properties of the WF profile. Aluminium tabbed longitudinal tension tests on coupons cut out of the web and flanges of a pultruded GFRP 102 x 51 x 6.4 mm I-beam have also been reported [15]. The full-width flange coupons included a central zone of residual web material along one face. This feature may have affected the coupons’ overall tensile strengths. Test work, similar to that outlined above, was carried out, during roughly the same time period, on compression coupons cut out of pultruded GFRP flat plate [12, 16 & 17] and WF profiles [18] to determine the material’s longitudinal stiffness and ultimate stress properties. The present investigation seeks to complement and broaden the aforementioned experimental investigations, via a series of approximately 100 tension/compression tests on coupons cut out of several sizes/shapes of pultruded GFRP profile, namely WF, channel and angle. The principal objectives of the investigation are to: (1) confirm, for these particular profiles, that their mechanical properties are not independent of shape/size, as suggested in the pultruders’ manuals, and to quantify their differences/values, (2) provide values for tension/compression properties not given in the manuals, (3) quantify characteristic tension/compression ultimate stresses and (4) quantify and compare limit state design ultimate stresses and elastic moduli with permissible stress design stresses and elastic moduli for these pultruded GFRP profiles. Although the aforementioned objectives will enhance the knowledge base of mechanical properties used in the design of pultruded GFRP components and structures, designers should be mindful of the fact that these properties have been determined from coupon dimensions prescribed in test standards and it is tacitly assumed that they relate directly to full-size profiles. This may not necessarily be so in all design situations, particularly where local and/or torsional buckling may arise. It is well known that wrinkling of the fibre architecture (CFM) may be present at flange edges and web-flange junctions. Consequently, additional test methods need to be standardised, and included in design manuals/guidance, for quantifying the stiffness and strength of web-flange junctions and enhancing the design of GFRP profiles, particularly for local and torsional situations. Further information on the latter issues may be found in [19 – 21]. First, details are given of the sizes, shapes and fibre architectures of the profiles and the orientations (longitudinal or transverse) and locations (flange, web or leg) where the tension/compression coupons were cut out of them. In the next section, the dimensions of the tension/compression coupons are given together with the reasons why they differ for different profiles. Details of the types and orientations of the strain gauges used to record coupon strains during the tension/compression tests are also given. The procedures adopted for the
MANUSCRIP
T
ACCEPTED
ACCEPTED MANUSCRIPTRevised Manuscript without figures.docx
3
tension/compression tests are then explained. Thereafter, the tensile/compressive properties determined for each profile are discussed and the differences in their modes of failure are illustrated and commented upon. Characteristic ultimate stresses, strains, moduli and Poisson’s ratios of the profiles are presented and discussed and, where applicable, compared with corresponding minimum values given in the pultruder’s design manual [1]. Limit state design ultimate stresses and elastic moduli derived from characteristic values are compared with corresponding permissible stress values and their differences highlighted. Finally, the principal conclusions derived from the tension/compression coupon test data are summarised. 2. Details of the pultruded GFRP standard structural profiles Five sizes of three shapes of EXTREN® 500 series GFRP profiles, manufactured using the same pultrusion process, provided the source material for the tension and compression coupons. The profiles comprised of two WFs, one channel and two angles. Channel and angle profiles were not included in the investigations reported in [12 – 18]. The dimensions of the five profiles (drawn roughly to scale) are shown in Figure 1.Visual inspection of the end cross-sections of the profiles showed that there were two forms of E-glass fibre reinforcement, viz. rovings (bundles of parallel fibres) and continuous filament mat (CFM), in their flanges, webs and legs and that each roving layer was sandwiched between two layers of CFM. The matrix material was a mixture of polyester resin and filler (chalk or clay). For these profiles the glass fibre, polyester resin and chalk/clay filler volume percentages were typically 50, 40 and 10%, respectively. The through-thickness fibre architecture of the 102 x 102 x 6.4 mm WF, 76 x 76 x 6.4 and 76 x 76 x 9.5 mm angle profiles comprised of two roving layers sandwiched between three CFM layers. Likewise, the fibre architecture of the 203 x 203 x 9.5 mm WF profile comprised of four roving layers sandwiched between five CFM layers, whereas the 102 x 28.6 x 6.4 mm channel’s fibre architecture comprised of three roving layers sandwiched between four CFM layers. The smooth resin-rich surfaces of all five profiles incorporated lightweight CFM veils.
Insert Figure 1 3. Tension and compression coupon details It is well known that wrinkling of the CFM occurs along the flange edges of the profiles and also along the junctions between webs and flanges of WF profiles. It is believed that this is due in part to pressure and temperature within the pultrusion die, which causes small transverse movements of the CFM, and to differential residual curing and shrinkage of the matrix after the profile exits the die. Therefore, in order to avoid the effects of non-uniformity of the fibre architecture, the longitudinal coupons were cut out of the central zones of the profiles’ flanges, webs and legs so that each longitudinal edge was at least 10 mm away from a web-flange transition radius and/or a flange edge. Likewise, for the transverse coupons the same criteria were enforced with respect to their ends. Furthermore, in order to minimise damage to the sides and ends of the coupons, a diamond edged wheel saw was used to cut the coupons out of the pultruded GFRP profiles. A total of 97 tension and compression coupons were cut out of the WF, channel and angle profiles. The tension coupons were sub-divided into nine groups. The coupons in seven of the groups were cut lengthwise out of the webs, flanges and legs of the profiles. The other two groups were cut transversely out of the webs of the WF profiles. Similarly, eight groups of compression coupons were cut out of the same profiles, again being sub-divided into six longitudinal and two transverse groups. Details of the numbers of coupons and the locations where they were cut out of each profile are given in Table 1. No longitudinal coupons were cut out of the channel’s flanges because they would be too narrow in order to avoid CFM wrinkling at the web-flange junctions and flange edges. Likewise, no transverse coupons were cut out of the angle legs because they would be too short to avoid wrinkling and provide adequate grip lengths.
MANUSCRIP
T
ACCEPTED
ACCEPTED MANUSCRIPTRevised Manuscript without figures.docx
4
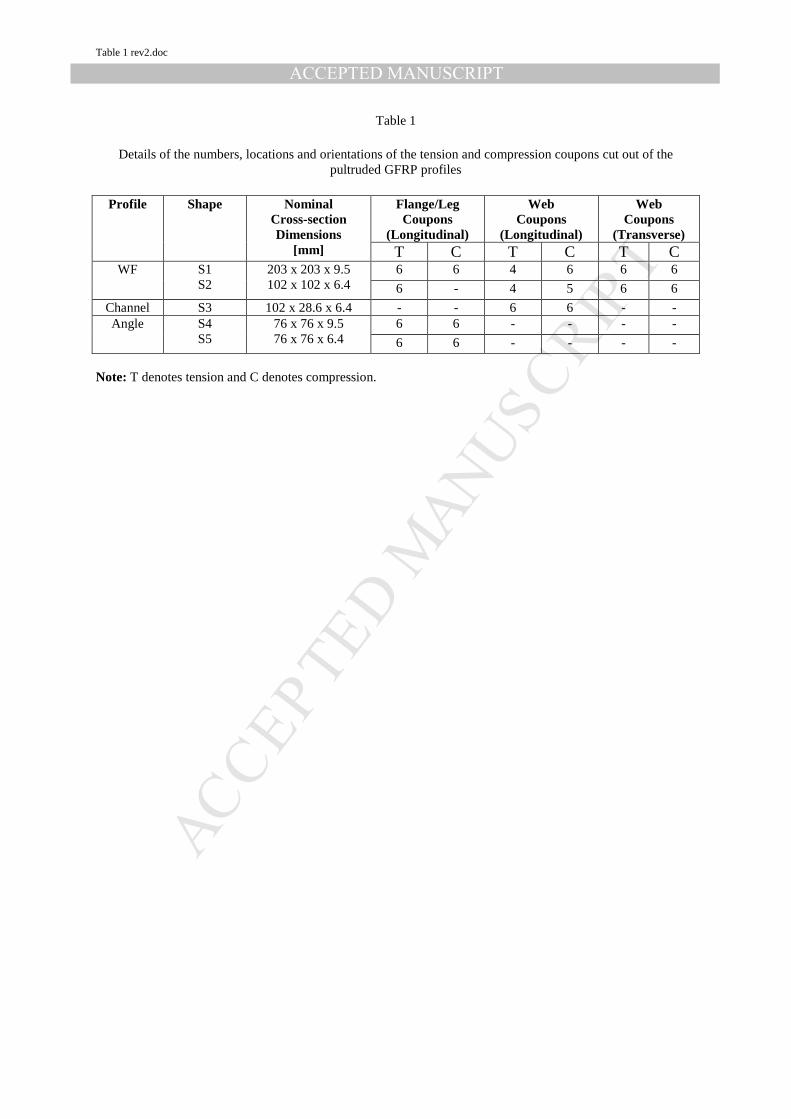
Table 1
Details of the numbers, locations and orientations of the tension and compression coupons cut out of the
pultruded GFRP profiles
Profile Shape
Nominal Cross-section Dimensions
[mm]
Flange/Leg Coupons
(Longitudinal)
Web Coupons
(Longitudinal)
Web Coupons
(Transverse) T C T C T C
WF S1 S2
203 x 203 x 9.5 102 x 102 x 6.4
6 6 4 6 6 6
6 - 4 5 6 6
Channel S3 102 x 28.6 x 6.4 - - 6 6 - - Angle S4
S5 76 x 76 x 9.5 76 x 76 x 6.4
6 6 - - - -
6 6 - - - -
Note: T denotes tension and C denotes compression. The dimensions of the tension coupons were determined with reference to the guidance given in the BS EN ISO 527 [22] and ASTM D3039 [23] test standards. Therefore, the plan dimensions of the longitudinal tension coupons were 300 x 25 mm with grip lengths of 75 mm (see Figure 2(a)). Hence, their gauge length to width ratio was 6:1, i.e. sufficient to give a uniform tensile stress across the central cross-section of the coupon (corroborated by previous experience of tensile testing of similar sized coupons without end tabs). Consequently, the seven sets of longitudinal tension coupons were tested without end tabs. The transverse tension coupons cut out of the web of the 203 x 203 x 9.5 mm WF profile were 170 mm by 25 mm wide with 30 mm grip lengths (see Figure 2(b)). For these coupons the gauge length to width ratio was 4.4:1. Consequently, they were also tested without end tabs. However, the depth of the web of the 102 x 102 x 6.4 mm profile limited the transverse coupons to 86 mm long by 25 mm wide (see Figure 2(c)). For these coupons it was decided to bond 24 x 25 x 1.5 mm aluminium tabs to their ends prior to testing. Because the gauge length to width ratio of the latter coupons was only about 1.5, the tensile stress distribution across the central cross-section may not have been entirely uniform due to lateral restraint effects at the grips. Consequently, the values of the transverse tensile properties determined from these tests may be less accurate than corresponding properties derived from the longer longitudinal and transverse tension coupon tests.
Insert Figure 2
The overall dimensions of the compression coupons, shown in Figure 3, were determined taking into account the guidance given in BS EN ISO 14126 [24] and ASTM D3410 [25]. Five sizes of coupon were chosen with widths of 25 mm, overall lengths of 210 to 86 mm, grip lengths of 80 to 24 mm and gauge lengths of 50 to 38 mm. The longer overall length coupons with longer grip lengths were selected for the longitudinal compression coupons, whereas the overall length of the shortest coupon with short grip lengths was dictated by the web depth of the smaller WF profile (Shape 2). As recommended in BS EN ISO 14126 [24], all of the compression coupons were tested with 1.5 mm or 2 mm thick aluminium end tabs, which were bonded to the abraded coupon ends using Araldite 2015 adhesive. Aluminium was chosen for the end tabs because its elastic modulus is similar to that of GFRP and, therefore, minimises stress concentration effects at the grips. The thicker tabs were used on the coupons cut out of the profiles with 9.5 mm thick flanges/webs/legs. The width of the coupons’ gauge length was chosen to minimise the effects of variations in the coarse fibre architecture and plate effects. Similarly, the gauge lengths were chosen to be short enough to prevent buckling (which was checked by Euler bucking theory assuming simply supported ends) and long enough to minimise the influence of transverse end restraint at the grips on the uniformity of the compressive stress within the gauge section.
Insert Figure 3
Each tension and compression coupon was instrumented with two 120 Ω internal resistance strain gauges (manufactured by Tokyo Sokki Kenkyujo Co. Ltd), i.e. a 10 mm uniaxial PFL-10-11 gauge at the centre of one
MANUSCRIP
T
ACCEPTED
ACCEPTED MANUSCRIPTRevised Manuscript without figures.docx
5
face and a 5 mm biaxial FCA-5-11gauge at the centre of the opposite face. The sensitive axes of the gauges were parallel to the coupon’s longitudinal and/or transverse centrelines. A consistent procedure was used to bond the strain gauges to a coupon’s face. At the gauge location the surface veil was abraded to expose the rovings. The surface was then cleaned with M-Bond neutraliser, after which M-Bond catalyst and adhesive were applied to bond the gauge to the coupon’s face. This procedure has been shown to produce reliable strain gauge readings on pultruded GFRP polymer composites. Other methods of recording full-field coupon strains such Digital Image Correlation (DIC) [26] or Speckle Pattern Interferometry (SPI) [27] were not available to the Authors at the time of undertaking the test work and would probably have been viewed as unnecessarily complicated, though they would have saved the cost of many strain gauges. Indeed DIC and SPI are probably more appropriately used for tracking localised failure progression in a composite, rather than for simply determining its macroscopic mechanical properties (ultimate stress etc) as in the present investigation. 4. Test Procedure and data reduction Prior to testing each group of coupons, the width and thickness of each coupon was measured at three positions along its length, i.e. at the mid-length and adjacent to each end of the gauge length, using a digital vernier caliper, with an accuracy of 0.01 mm. The widths of the coupons were within 0.5 mm of the specified nominal width of 25 mm (thereby confirming the consistency and accuracy of the cutting procedure using the diamond edged wheel saw). The mean width and thicknesses were used to determine each coupon’s mean cross-sectional area. The tension coupon tests were carried out in a 200 kN capacity Amsler universal testing machine using the 20 and 100 kN load scales. The tensile load was applied under load control at a rate of 0.1 – 0.15 kN/second. Each coupon was loaded until it failed and the load and strain data from the Amsler’s load cell and the two strain gauges were recorded at 0.1 second intervals by a StrainSmart data logger. After each test, the coupon was inspected visually to identify its failure mode and then photographed to provide a permanent record thereof. IITRI (Illinois Institute of Technology Research Institute) test fixtures are often used to conduct compression tests on coupons of material [28]. The test fixture applies transverse pressure and shear stresses to the coupon’s end tabs to prevent slip as the coupon shortens axially in compression. The IITRI fixture in the present tests had flat-faced tapered grips in matching pockets in thick steel blocks to accommodate coupons of different thicknesses. The steel blocks were bolted to the upper and lower platens of the test machine, to ensure their correct alignment. Figure 4 shows a schematic drawing of the tapered grips and pockets within the steel blocks and Figure 5 shows a compression coupon under test.
Insert Figure 4
Insert Figure 5
The cross-section dimensions of the compression coupons were measured before they were clamped between the tapered grips and their alignment checked. The upper tapered grip was then inserted and held in place in the matching pocket of the upper steel block bolted to the fixed grip of the test machine. The lower grip and steel block were then slowly raised to allow the lower tapered grips of the test coupon to slide into the matched pocket of the steel block ready for testing in compression. The compression tests were carried out under load control using the same load and data acquisition rates as the tension coupons. After each test the coupon was inspected and photographed to provide a permanent record of its failure mode. The mean of the longitudinal tensile strains recorded at the centre of each coupon face and their corresponding tensile loads were used to plot a graph of load versus mean strain. A straight line was fitted to the data points between the mean strains of 500 and 2500 µε, so that the longitudinal elastic tension modulus could be determined by dividing the line’s slope by the coupon’s mean cross-sectional area. The Poisson’s ratio was determined from the ratio of the biaxial strain gauge readings over the same strain range. The coupon’s ultimate tensile stress was calculated by dividing its peak tensile load (obtained from its load versus strain graph) by its mean cross-sectional area. The ultimate strain was taken as the value of the mean longitudinal strain corresponding to the peak load of the coupon’s load versus mean strain graph. The corresponding quantities were determined in a similar manner for each compression coupon.
MANUSCRIP
T
ACCEPTED
ACCEPTED MANUSCRIPTRevised Manuscript without figures.docx
6
A plot of the tensile load versus mean longitudinal strain is shown in Figure 6 for a typical coupon cut out of the flange of the 203 x 203 x 9.5mm WF profile. It is evident that the response is linear until shortly before failure. A similar load versus strain plot is shown in Figure 7 for a transverse web coupon cut out of the same WF profile. Compared to Figure 6, the response is nonlinear. A potential cause of the nonlinearity is that micro-cracks occurred at a relatively early stage during loading and accumulated as the loading increased to final failure. An additional reason for the difference in responses is due to the fact that the longitudinal response is dominated by the stiffer rovings, whereas the transverse response is governed by the more flexible CFM and the polyester resin. Also, the longitudinal failure load is significantly larger than the transverse failure load. Similar linear load versus strain responses were obtained for the longitudinal tensile flange and web coupons of the smaller WF profile and the longitudinal web/leg coupons of the channel and angle profiles, respectively. The reduction in transverse elastic modulus with increasing strain of the two sizes of WF profile may be a factor which needs to be considered in design.
Insert Figure 6
Insert Figure 7 The load versus mean strain responses of the longitudinal compression coupons of the WF, channel and angle profiles were linear, just as the longitudinal tension coupons of the same profiles. Likewise, the load versus mean strain responses of the transverse compression coupons exhibited slightly less nonlinearity compared to their tension coupon counterparts for the same profiles. Examples of the longitudinal and transverse compression load versus strain responses are shown in Figures 8 and 9, respectively.
Insert Figure 8
Insert Figure 9 5. Tension and compression test results The mean values of the tensile and compressive ultimate stresses etc. are given in Table 2 for the pultruded GFRP WF profiles and Table 3 for the channel and angle profiles. In Table 2 both longitudinal and transverse properties are given, whereas in Table 3 only longitudinal properties are presented. In addition to mean values, standard deviations and coefficients of variation are included in both tables. In the following sub-sections a number of comments/observations are made about the test data for each of the pultruded GFRP profiles.
Insert Table 2 5.1 203 x 203 x 9.5 mm WF profile (Shape S1) In Table 2 longitudinal compressive ultimate load, stress and strain values are given for only one of the six coupons cut out of this profile. The reason is that for the other five nominally identical coupons the aluminium end tabs debonded prior to failure. Despite re-bonding the tabs and re-testing two or three times it was still only possible to fail one of the six coupons. Nevertheless, mean elastic modulus and Poisson’s ratios were able to be derived from their load – strain curves between the 500 to 2500 µε range. It is evident that the mean ultimate tensile stress and elastic modulus of the web are 6 – 7% greater than those of the flange, whereas the mean ultimate tensile strain of the web is about 3.2% lower than that of the flange. Furthermore, ultimate tensile strain is not given in [1 – 3]. Moreover, the mean tensile modulus of the flange is nearly 6% lower than that of the web, whereas the compression moduli of the flange and web are almost equal. The transverse tension and compression data (web only) are also given in Table 2. It is evident that the mean ultimate transverse compression stress is almost exactly twice that of the mean ultimate transverse tensile stress. However, the web’s mean ultimate transverse compressive strain is only about 36% greater than its mean ultimate tensile strain. The difference between the web’s mean transverse tensile and compressive elastic moduli is small with the latter 2.4% greater than the former. Also, the web’s mean compressive minor Poisson’s ratio is 19% greater than the tensile ratio. 5.2 102 x 102 x 6.4 mm WF profile (Shape S2)
MANUSCRIP
T
ACCEPTED
ACCEPTED MANUSCRIPTRevised Manuscript without figures.docx
7
The mean values of the longitudinal tensile and compressive ultimate stresses, strains, elastic moduli and Poisson’s ratios of this profile are also included in Table 2. Tensile mean values were obtained for the web and the flanges, whereas only mean compressive values were obtained for the web. The mean ultimate tensile stress of the web is about 9.2% greater than that of the flange. The web’s mean ultimate compressive stress is 1.4% greater than the corresponding tensile value. However, the mean longitudinal tensile modulus of the web is 7.1% greater than that of the flange. In contrast, the web’s mean compressive and tensile elastic moduli differ by less than 1%. The difference between the mean tensile major Poisson’s ratios of the web and flange is 2.9% with the flange’s value being higher. The web’s mean compressive major Poisson’s ratio is 3.5% greater than its tensile value. The web’s mean transverse tensile and compressive properties are also included in Table 2. The ultimate compressive stress is about 71% greater than the ultimate tensile stress. However, the ultimate compressive strain is 11% greater than the ultimate tensile strain. The mean compressive elastic modulus is 10.5% greater than the tensile modulus and the compressive minor Poisson’s ratio is about 5.4% greater than the tensile ratio.
Insert Table 3 5.3 102 x 28.6 x 6.4 mm Channel, 76 x 76 x 9.5 mm and 76 x 76 x 6.4 mm Angle profiles (Shapes S3 - S5) In Table 3 the longitudinal mean mechanical properties of the web/legs of the channel (Shape S3) and the two angle (Shapes S4 and S5) profiles are presented. Unfortunately, the width of their flanges/legs was too small for transverse coupons to be prepared. The mean ultimate tensile stress of the channel profile is 11.4% greater than its compressive stress. Furthermore, the ultimate tensile strain is about 35% greater than the compressive strain. However, the values of the elastic tensile and compressive moduli are the same, and the compressive major Poisson’s ratio is only 3% greater than its tensile ratio. The compressive ultimate stress value for the thicker angle (Shape S4) is based on a single coupon test. De-bonding of the aluminium tabs prevented (despite re-bonding the tabs and re-testing) the other five nominally identical coupons from being tested to failure. However, elastic moduli and Poisson’s ratios were determined from their load versus strain curves as described in sub-section 5.1. The mean tensile elastic modulus is 1.5% greater than the compressive modulus and the mean compressive major Poisson’s ratio is 3.4% greater than the tensile ratio. No tab de-bonding occurred with the compressive coupons of the thinner angle (Shape S5). Consequently, mean ultimate tensile and compressive stresses could be obtained. The mean ultimate compressive stress is 2.9% greater than the tensile stress. However, the mean ultimate tensile strain is 4.1% greater than the compressive strain. Likewise, the mean elastic tensile modulus is 3.1% greater than the compressive modulus. And, finally, the mean compressive minor Poisson’s ratio is 7% greater than the tensile ratio. From the foregoing comparisons of tensile and compressive coupon elastic moduli/Poisson’s ratios and ultimate stresses, it is evident that, in general, the former quantities differ by less than 10% for a single shape, whereas the latter properties exhibit much larger differences – up to 100% in the case of Shape S1. 6. Coupon failure modes In general, the longitudinal tension coupons failed in a brittle manner. Failure occurred rapidly, often without much prior acoustic emission, and resulted in damage to most of the coupon between its grips. In order to gain a greater appreciation of the initiation/development of coupon failure, additional longitudinal coupon tests were undertaken and recorded with a high speed video camera (NAC 500 Digital High Speed Video System at 500 fps). The edge views of the video images in Figure 10(a) show that failure initiates on the left hand side, followed by delamination between the CFM and roving layers. Failure then progressed on the right hand side of the CFM (as shown in the rightmost image) and culminated in massive debonding/delamination of the whole coupon. Edge views of the extensive delamination in the six longitudinal coupons cut out of the flange of the 203 x 203 x 9.5 mm WF profile (Shape S1) are shown in Figure 10 (b).
Insert Figure 10(a)
MANUSCRIP
T
ACCEPTED
ACCEPTED MANUSCRIPTRevised Manuscript without figures.docx
8
Insert Figure 10(b)
In the case of the transverse tensile coupons, a transverse surface crack triggered failure across the width and through the thickness, as shown in Figure 11(a). Compared to the longitudinal coupons, damage within the transverse coupons was localised, extending over a length of the order of the coupon’s thickness, as shown in Figure 11(b).
Insert Figure 11(a)
Insert Figure 11(b)
The tensile failure modes observed in the longitudinal coupons cut out of the smaller WF profile and the channel and angle profiles were similar to those shown in Figure 10(b). Likewise, the tensile failure modes of the transverse coupons cut out of the smaller WF profile were similar to those shown in Figure 11. The failure mode of the compression coupons was predominantly delamination, as shown in Figure 12 for the longitudinal coupons cut out of the legs of the 76 x 76 x 6.4 mm WF profile (Shape 5).
Insert Figure 12
7. Comparison of characteristic and pultruders’ minimum stresses and elastic moduli for Shapes S1 – S5 Characteristic material properties that are used in limit state design are determined from the 5% fractile of the statistical distribution of the test values, according to the design guides [10], [4] and [9]. In the latter document specific reference is made to the two-parameter Weibull distribution, whereas in the first two guides, the method of determining characteristic values from test data, developed and explained in Annexe D of BS EN 1990:2002+A1:2005 [29], is adopted. The Annexe D and two-parameter Weibull methods of determining characteristic material properties lead to similar characteristic values. The Annexe D characteristic values, are determined using Eq.(1):-
k m sdX X kX= − (1)
In Eq.(1) kX is the characteristic value of the material property, mX its mean value, sdX its standard
deviation and k is a constant, the value of which depends on the number of nominally identical coupons of pultruded GFRP tested. In the majority of material tests reported herein, six nominally identical coupons were tested and the value of k used in Eq.(1) was 1.77. Where fewer coupons were tested the value of k increased
slightly, e.g. for five nominally identical coupons tested the value of k in Eq.(1) was increased to 1.80, i.e. an increase of 1.7%. The test data, reported in Tables 2 and 3, have been processed in accordance with Eq.(1) to determine tensile and compressive characteristic ultimate stresses, elastic moduli, ultimate strains and Poisson’s ratios for each of the pultruded GFRP profiles (Shapes S1 – S5). Their characteristic values are presented in Table 4 along with the pultruder’s minimum values [1]. The latter values (factored) are, of course, used in permissible stress design rather than limit state design. Moreover, they are independent of profile size and shape, whereas the characteristic values depend on both attributes. Furthermore, design guide [9] requires the characteristic ultimate stresses and elastic moduli, determined by testing, to be not less than prescribed values, which appear to be identical with the pultruder’s minimum values [1], except that no value is specified for the minimum characteristic transverse ultimate compression stress.
Insert Table 4 Although characteristic elastic moduli are given in Table 4, only [9] requires their use in limit state ultimate stress design. It appears that mean values of the elastic moduli may be used for limit state serviceability (stiffness) design in [10] and [4]. However, according to [9] and [10] mean values of the elastic moduli may also be used for limit state (stiffness) analysis.
MANUSCRIP
T
ACCEPTED
ACCEPTED MANUSCRIPTRevised Manuscript without figures.docx
9
The bar charts in Figure 13 illustrate the ratios of the characteristic tensile ultimate stresses to the corresponding design manual minimum values [1] for the five pultruded GFRP profiles. As pointed out above, the latter values are independent of profile shape and size. From Figure 13(a) it is clear that the characteristic and minimum longitudinal tensile ultimate stresses are only nearly equal for the larger WF profile (Shape S1). For the other profiles (Shapes S2 – S5) the characteristic longitudinal ultimate stress exceeds the design manual minimum stress by between 19 and 79%. A similar comparison for the transverse tensile ultimate stress is shown for the two WF profiles (Shapes S1 and S2) in Figure 13(b). Again, the characteristic stresses are greater than the corresponding design manual values, exceeding them by 23 to 55%. A similar comparison for the longitudinal ultimate compressive stress is given in Figure 14, but is slightly less comprehensive because debonding of the aluminium end tabs of the thicker coupons prevented them from being tested to failure (though elastic modulus and Poisson’s ratio data were obtained). Furthermore, the characteristic longitudinal compressive ultimate stresses only exceed the corresponding design manual minimum values by between 3 and 52% for profile Shapes S2, S3 and S5. On the other hand, for the corresponding transverse ultimate stresses, the difference is much smaller for profile Shapes S1 and S2, i.e. between 4 and 17%.
Insert Figure 13(a)
Insert Figure 13(b)
Insert Figure 14(a)
Insert Figure 14(b)
Similar plots, quantifying the ratios of the characteristic to design manual longitudinal and transverse tensile and compressive elastic moduli, are presented for pultruded GFRP profiles (Shapes S1 – S5) in Figures 15 and 16, respectively. Again, it is evident that the characteristic moduli are all dependent on size and shape, whereas the design manual moduli given in [1] are independent of these attributes.
Insert Figure 15(a)
Insert Figure 15(b) It is clear from Figure 15(a) that the characteristic and design manual tensile elastic moduli differ only by a small percentage, i.e. about 4%, for the WF profile (Shape S1), whereas for profile Shapes S2 – S5 the characteristic moduli exceed the corresponding design manual moduli by between 15 and 32%. However, as shown in Figure 15(b), the differences between the transverse tensile elastic moduli of the two WF profiles (Shapes S1 and S2) are very large with the characteristic moduli exceeding the design manual moduli by about 65 and 57%, respectively.
Similar plots for the ratios of the characteristic compressive elastic moduli to the design manual compressive elastic moduli are shown in Figure 16. The magnitudes of the ratios for the longitudinal compressive moduli in Figure 16(a) are broadly similar to the ratios for the longitudinal tensile moduli in Figure 15(a), differing at most by about 6%. However, the ratios of the characteristic transverse compressive elastic moduli for the two WF profiles (Shapes S1 and S2) are somewhat greater than the corresponding longitudinal tensile elastic moduli ratios (see Figure 16(a)) and exceed the design manual values [1] by 70 and 68%, respectively.
Insert Figure 16(a)
Insert Figure 16(b) 8. Comparison of design ultimate stress and design elastic modulus values for limit state and permissible stress design of pultruded GFRP composite beams
MANUSCRIP
T
ACCEPTED
ACCEPTED MANUSCRIPTRevised Manuscript without figures.docx
10
For permissible stress design of pultruded GFRP composite beams under ambient temperature conditions, it is recommended that the design permissible stresses and design elastic moduli are equal to their minimum values given in [1] divided by the recommended safety factors. The safety factor for permissible stress design ranges from 2.5 to 4, depending on the dominant function of the profile. For beam flexure the lowest value of 2.5 is recommended. It is also pointed out in [1] that the ultimate stresses of the profiles are typically 20 to 25% greater than the minimum values. The safety factor is unity for the design elastic modulus. However, where temperature is a significant environmental factor it is suggested that the minimum stress and modulus values should be reduced by a maximum of 50 and 15% respectively (corresponding to a temperature of 65.6 oC) before applying the recommended safety factors to obtain design permissible values. On the other hand, design ultimate stresses and elastic moduli for limit state design of pultruded GFRP composite structures are obtained by applying appropriate factors to the characteristic values, i.e. the design values are calculated from Eq.(2):-
kd
m
XX
γ= (2)
In Eq.(2) dX is the required design value of the material property and mγ is a factor, generally greater than
unity, which reduces the characteristic value to take account of specific production and in-service conditions.
In the first limit state design guide for FRP structural composites [4] the factor mγ is expressed as the product
of three sub-factors:-
1 2 3mγ γ γ γ= (3)
For tension/compression tests on coupons cut out of the pultruded GFRP profiles (Shapes S1 – S5) the sub-
factor 1 1.15γ = . Two values, namely 1.1 and 1.7 apply to sub-factor 2γ . The lower value applies when the
pultruded GFRP profile is fully cured at the factory and the higher value applies when it is not. Several values
are given for sub-factor3γ . They depend on: (1) short or long term loading, (2) design operating temperature
and (3) heat distortion temperature. If it is assumed that the operating temperature is in the range, 25 – 50 oC,
and the heat distortion temperature range is 80 – 90 oC, then for short term loading3 1.1γ = . The corresponding
value for long term loading is3 2.8γ = . Hence, the two extreme values of mγ are 1.4 and 5.5 respectively.
However, in [4], it is also stated for building structures that mγ should not be less than 1.5, so that the minimum
value of mγ is 1.5.
In the most recent design guide [10], Eq.(2) includes an additional factor cη , known as a conversion factor, and
a modified gamma-factorMγ . (Note: In some design codes, notably [29], the conversion factor cη and Mγ may
be combined into a single factormγ which is used to reduce the characteristic value dX .). The conversion factor
cη accounts for environmental degradation effects and load duration. Hence, the design value, dX is:-
kd c
M
XX η
γ= (4)
In Eq.(4) Mγ is expressed as the product of two sub-factors so that:-
1 2M M Mγ γ γ= (5)
For material properties derived from tests 1 1.15Mγ = and, depending on the coefficient of variation Rσ of the
test results, ( )2 1.35 0.1M Rγ σ= ≤ or ( )2 1.6 0.1 0.17M Rγ σ= ≤ ≤ . Furthermore, if the material is not
MANUSCRIP
T
ACCEPTED
ACCEPTED MANUSCRIPTRevised Manuscript without figures.docx
11
fully post-cured, 2Mγ has to be multiplied by 1.2. However, for the serviceability design elastic moduli,
1 2 1M Mγ γ= = .
The overall value for the conversion factor cη is determined from the product of conversion sub-factors for
temperature and humidity effects, denoted by ctη and cmη , respectively. According to [10], when040d gT T C= − , 0.9ctη = for characteristic ultimate stress and 1ctη = for elastic modulus. Likewise, when
(0 040 20g d gT C T T C− ≤ ≤ − ) 0.9ctη = for both quantities. dT and gT are the heat distortion and glass
transition temperatures, respectively. Similar conversion sub-factors cmη apply for three classes of humidity
effects on characteristic ultimate stress and elastic modulus. The cmη values range from 1 to 0.8. Hence, the
conversion factor cη ranges from 0.9 to 0.72 for design ultimate stress and 1 to 0.8 for design elastic modulus.
In design guide [9] the characteristic ultimate stress of the pultruded material has to be modified by factors MC
and TC to determine the design ultimate stress. Hence, using the previous notation, the design ultimate stress is
expressed as:-
d M T kX C C X= (6)
For design ultimate stress and elastic modulus, the values of MC are 0.8 and 0.9, respectively, and the values of
TC are 1 and 0.98 for 032T C= and for 060T C= they are 0.5 and 0.58, respectively. Hence, the combined
factors for design ultimate stress and elastic modulus are 0.8 and 0.88 for the lower temperature, and 0.4 and 0.52 for the higher temperature, respectively. Eqs.(2), (4) and (6) have been evaluated using conversion and sub-factors relevant to typical normal conditions (ambient temperature and Class I humidity conditions for fully-cured polyester material) and the characteristic ultimate stresses and elastic moduli given in Table 4 for the pultruded GFRP profiles (Shapes S1 – S5) to determine the corresponding limit state design values. These design values are presented in Table 5 together with the corresponding minimum stress and moduli and the corresponding permissible stress design values (based on dividing the minimum values by a factor equal to 2.5). It is evident that only the Channel (Shape 3) and the Angle (Shape 5) have longitudinal tensile and compressive design ultimate stresses greater than the minimum values given in [1], whereas the design ultimate stresses of all of the profiles exceed the permissible stress design values. On the other hand, the transverse tensile design ultimate stresses are similar to or slightly lower than the minimum value in [1] but they exceed the permissible stress design value. However, the transverse compressive design ultimate stresses are all lower than the minimum value in [1], but again exceed the permissible stress design value. It is also evident that the highest and lowest design ultimate stresses correspond to design guides [4] and [9], respectively.
Insert Table 5 Also in Table 5 it is clear that the transverse tensile and compressive design elastic moduli of the two WF profiles (Shapes 1 and 2) are greater than the minimum and permissible stress design values given in [1], and that the highest values correspond to design guide [9]. However, the longitudinal tensile and compressive design elastic moduli obtained from [9] for Shapes S2 – S5 all exceed the corresponding minimum and permissible stress design values given in [1], but the values obtained from [4] and [10] are lower than those in [9]. According to [9 & 10] mean elastic modulus may be used for structural analysis and according to [10] mean elastic modulus may also be used for limit state serviceability design. Moreover, mean elastic modulus is greater than both factored characteristic elastic modulus and minimum elastic modulus according to [1]. Furthermore, it should be appreciated that for pultruded GFRP components and structures stiffness criteria (maximum deflection or critical buckling load) rather than ultimate stress frequently dominate design. Consequently, the fact that the limit state design stresses are, in some instances in Table 5, larger than the permissible stress design stresses may not necessarily be a major advantage.
MANUSCRIP
T
ACCEPTED
ACCEPTED MANUSCRIPTRevised Manuscript without figures.docx
12
9. Concluding remarks Mean and characteristic values of ultimate stress, elastic modulus etc obtained from 97 axial tension and compression tests on rectangular coupons cut longitudinally and transversely out of five different pultruded GFRP composite standard structural profiles have been presented. Details of the profiles (types and sizes), coupons (orientations and overall dimensions), test procedures, data acquisition and examples of typical coupon failure modes have also been given. Characteristic ultimate stresses have been compared with corresponding minimum stresses given in the pultruder’s design manual [1]. For example, it has been shown that the characteristic longitudinal tensile ultimate stresses of the 6.4 mm thick channel and angle profiles (Shapes S3 and S5) are 79% and 50% greater respectively than the minimum stress given in [1], which is the same for all of the profile shapes considered. Likewise, the characteristic transverse ultimate stresses for the 9.5 mm and 6.4 mm thick WF profiles (Shapes S1 and S2) are 23% and 55% greater than the minimum stress given in [1], which, again, is assumed to be the same for the WF, channel and angle profiles. The same trends are evident for the characteristic longitudinal and transverse compressive ultimate stresses relative to the corresponding minimum stresses in [1], but the percentage differences are smaller. Characteristic longitudinal tensile and compressive elastic moduli for the five types of profile (Shapes S1 – S5) have also been compared with the minimum values in [1]. The characteristic longitudinal tensile and compressive moduli exceed the minimum value by between 4% and 34%. However, much larger differences are evident for the characteristic transverse tensile and compressive elastic moduli of the two WF profiles (Shapes S1 and S2), ranging between 57% and 70%. Again, in [1] single values are given for the longitudinal and transverse elastic moduli for the sizes and shapes of the profiles considered herein. In the light of the preceding two paragraphs, it is concluded that characteristic ultimate stresses and elastic moduli depend on the shape and size of the pultruded GFRP profiles as well the type and direction of the loading. In addition to the stress and modulus data, the tests have provided characteristic ultimate strains and Poisson’s ratios, albeit more comprehensive for tensile than compressive loading. In particular, it is evident that characteristic ultimate tensile strains range from nearly 9000µε to more than 17000µε and the ultimate compressive strains vary between about 11000µε and 16000µε. This type of data is not given in the pultruders’ manuals [1 – 3]. Limit state design ultimate stresses and design elastic moduli have been derived from the corresponding characteristic values using the appropriate conversion and sub-factors, given in [4], [10] and [9], for the design of pultruded GFRP structures, particularly beams under normal conditions, and compared to permissible stress design values derived from factored minimum stresses given in [1]. The limit state design ultimate stresses are dependent on profile size and shape, whereas the permissible stress design stresses are independent of these attributes. It is also evident that the limit state longitudinal and transverse tensile and compressive design stresses are significantly larger than the corresponding permissible stress design stresses. On the other hand the limit state transverse design elastic moduli are larger than the corresponding permissible stress design value, whereas some of the limit state longitudinal design elastic moduli are lower than the corresponding permissible stress design value, especially those determined in accordance with [4 & 10]. Acknowledgements The test work reported herein was completed as part of a three year programme of research funded by EPSRC (Grant GR/R28386). The authors wish to record their appreciation to EPSRC for supporting their research. They would also like to acknowledge the help and assistance given by the Engineering Department’s technician staff throughout the course of this research.
References 1. Anon. EXTREN Design Manual, Strongwell, Bristol, Virginia, USA. (http://www.strongwell.com) [accessed: 7-12-2017] 2. Anon. Creative Pultrusions Design Guide, Creative Pultrusions Incorporated, Alum Bank, Pennsylvania, USA. (http://www.creative.com) [accessed: 7-12-2017].
MANUSCRIP
T
ACCEPTED
ACCEPTED MANUSCRIPTRevised Manuscript without figures.docx
13
3. Anon. Design Guide, Bedford Reinforced Plastics, Bedford Pennsylvania, USA. (http://www.bedfordreinforced.com) [accessed: 7-12-2017] 4. Clarke JL, editor. Structural Design of Polymer Composites – EUROCOMP Design Code and Handbook. London: E & FN Spon, 1996. 5. Anon. (CUR) Recommendation 96, Fiber Reinforced Plastics in Load Bearing Civil Structures 2003, CUR Commission 124, Civil Centre for Research and Design Guidance, Gouda, The Netherlands, 2003. 6. Anon. Guide for the Design and Construction of Structures Made of FRP Pultruded Elements, National Research Council of Italy, 2008. 7. Anon. Tragende Kunststoffbauteile im Bauwesen – Entwurf, Bemessung und Konstruktion BUV-Empfehlung, 08/2010, 2010. 8. Anon. Guidelines for Design & Construction of FRP footbridges, Japan Society of Civil Engineers, 2011. 9. Anon. ASCE Pre-Standard for Load & Resistance Factor Design of Pultruded FRP Structures, ASCE, 2012. 10. Ascione L, Gutierrez E, Dimova S, Pinto A, Denton S, editors. Prospect for New Guidance in the Design of FRP, EUR 27666 EN; doi:10.2788/22306, 2016. 11. BS EN 13706-3:2002. Reinforced plastics composites – Specifications for pultruded profiles – Part 3: Specific requirements, British Standards Institution, 2002. 12. Turvey GJ. Tension/compression strength of unnotched/notched pultruded GFRP plate. In: Hogg PJ, Sims GD, Matthews FL, Bunsell AR and Massiah A, editors. Composites Testing and Standardisation, Bordeaux: 1992. p.167-176. 13. Wang Y, Zureick A-H. Characterisation of the longitudinal tensile behaviour of pultruded I-shape structural members using coupon specimens. Composite Structures 1994; 29 (4):463-472. 14. Sonti SS, Barbero EJ. Material characterization of pultruded laminates and shapes. J. Reinforced Plastics and Composites 1996; 15(7):701-717. 15. Mottram JT. Structural properties of a pultruded E-glass fibre-reinforced polymeric I-beam. In: Marshall IH, editor. Composite Structures 6. Barking: Elsevier Science Publishers Ltd, 1996. p.1-28. 16. Mottram JT. Compression strength of pultruded flat sheet material. Journal of Materials in Civil Engineering 1994;6(2):185-200. 17. Saha M, Prabhakaran R, Waters WA. Compressive properties of pultruded composites. Mechanics of Composite Materials 2000; 36(6): 469-474. 18. Barbero EJ, Tomblin J. Compression strength of pultruded FRP materials. In: Proceedings of the ASCE Conference. San Diego, November, 1994. p.836-843. 19. Turvey G, Zhang Y. A computational and experimental analysis of the buckling, postbuckling and initial failure of pultruded GRP columns. Computers and Structures 2006; 84(22/23):1527-37. 20. Turvey G, Zhang Y. Characterisation of the rotational stiffness and strength of web-flange junctions of pultruded GRP WF-sections via web bending tests. Composites Part A: Applied Science and Manufacturing 2006; 37(2):152-164. 21. Minghini F, Tullini N, Ascione F. Updating Italian design guide CNR DT-205/2007 in view of recent research findings: requirements for pultruded FRP profiles, American Journal of Engineering and Applied Sciences 2016; 9(3):702-712. 22. BS EN ISO 527-4: 1997 Plastics – Determination of tensile properties. Part 4: Test conditions for isotropic and orthotropic fibre-reinforced plastic composites. British Standards Institution, London, 1997. 23. ANSI/ASTM D3039/D3039 M Standard test method for tensile properties of polymer matrix composite materials. 2014. 24. BS EN ISO 14126: 1999 Fibre-reinforced plastic composites – Determination of compressive properties in the in-plane direction. British Standards Institution, London, 1999. 25. ANSI/ASTM D3410/D3410 M Standard test method for compression properties of polymer matrix composite materials with unsupported cage section by shear loading. 2016. 26. Scalici T, Fiore V, Orlando G, Valenza A. A DIC-based study of the flexural behaviour of roving/mat/roving pultruded composites, Composite Structures 2015; 131:82-89. 27. Benfratello S, Fiore V, Palizzolo L, Tabbuso P. Speckle interferometry analysis of full-bending behaviour of GFRP pultruded material. Procedia Engineering 2016; 161:439-444. 28. Hodgkinson JM. Mechanical Testing of Advanced Fibre Composites. Cambridge: Woodhead Publishing, 2000. 29. BS EN 1990:2002+A1:2005 Annexe D – Design assisted by testing. British Standards Institution, London, 101-116.
MANUSCRIP
T
ACCEPTED
ACCEPTED MANUSCRIPTList of Figures and Captions.docx
List of Figures and Captions Figure 1: Sketches (approximately to scale) of the cross-sections (Shapes S1 – S5) of the pultruded
GFRP WF, channel and angle profiles out of which longitudinal and transverse rectangular tension and compression coupons were cut [Dimensions in mm].
Figure 2: Three sizes of tension coupon: (a) longitudinal coupon (Shapes S1 – S5), (b) long transverse
coupon (Shape S1) and (c) short transverse coupon (Shape S2) [Dimensions in mm]. Figure 3: Five sizes of compression coupon: (a) longitudinal angle (Shape S4) coupon, (b) longitudinal
channel (Shape S3) and small angle (Shape S5) coupons, (c) longitudinal large WF (Shape S1) web and flange and transverse web coupons, (d) longitudinal small WF (Shape S2) coupon and (e) transverse small WF (Shape S2) coupon [Dimensions in mm].
Figure 4: Schematic diagram of the flat-faced tapered grips and the upper and lower steel blocks of the
IITRI test fixture. Figure 5: Image of the IITRI test fixture bolted to the Amsler test machine with a strain gauged coupon
set up ready for testing in compression. Figure 6: Load versus mean strain for a longitudinal tension coupon cut out of the flange of the 203 x
203 x 9.5 mm WF profile (Shape S1). Figure 7: Load versus mean strain for a transverse tension coupon cut out of the web of a 203 x 203 x
9.5 mm WF profile (Shape S1). Figure 8: Load versus mean strain for a longitudinal compression coupon cut out of the web of a 102 x
102 x 6.4 mm WF profile (Shape S2). Figure 9: Load versus mean strain for a transverse compression coupon cut out of the web of a 102 x
102 x 6.4 mm WF profile (Shape S2). Figure 10: (a) Failure initiation and progression of a longitudinal tension coupon cut out of the flange of
a 203 x 203 x 9.5 mm WF profile (Shape S1) and (b) Edge views of the failure modes of the six nominally identical coupons.
Figure 11: Failure modes of transverse tension coupons cut out of the web of a 203 x 203 x 9.5 mm WF
profile (Shape 1): (a) face view and (b) edge views. Figure 12: Failure modes of longitudinal compression coupons cut out of the legs of a 76 x 76 x 6.4 mm
angle profile (Shape 5). Figure 13: Ratio of characteristic to design manual [1] ultimate tensile stresses: (a) longitudinal (Shapes
S1 – S5) and (b) transverse (Shapes S1 and S2). Figure 14: Ratio of characteristic to design manual [1] ultimate compressive stresses: (a) longitudinal
(Shapes S2, S3 and S5) and (b) transverse (Shapes S1 and S2). Figure 15: Ratio of characteristic to design manual [1] tensile elastic moduli: (a) longitudinal (Shapes S1
– S5) and (b) transverse (Shapes S1 and S2). Figure 16: Ratio of characteristic to design manual [1] compressive elastic moduli: (a) longitudinal
(Shapes S1 – S5) and (b) transverse (Shapes S1 and S2).
MANUSCRIP
T
ACCEPTED
ACCEPTED MANUSCRIPTList of Tables and Titles.doc
List of Tables and Titles Table 1: Details of the numbers, locations and orientations of the tension and compression coupons cut
out of the pultruded GFRP profiles. Table 2: Mean ultimate loads, stresses, strains, elastic moduli and Poisson’s ratios obtained from the
tension and compression tests on coupons cut longitudinally and transversely out of the webs and flanges of 203 x 203 x 9.5mm (Shape S1) and 102 x 102 x6.4 mm (Shape S2) pultruded GFRP WF profiles.
Table 3: Mean ultimate loads, stresses, strains, elastic moduli and major Poisson’s ratios obtained from
tension and compression tests on coupons cut longitudinally out of the web and legs of 102 x 28.6 x 6.4 mm (Shape S3), 76 x 76 x 9.5 mm (Shape S4) and 76 x 76 x 6.4 mm (Shape S5) pultruded GFRP profiles.
Table 4: Characteristic ultimate stresses, strains, elastic moduli and Poisson’s ratios and pultruders’
corresponding minimum values. Table 5: Comparison of limit state and permissible stress design stresses and design elastic moduli for
normal environmental conditions.
MANUSCRIP
T
ACCEPTED
ACCEPTED MANUSCRIPTTable 1 rev2.doc
Table 1
Details of the numbers, locations and orientations of the tension and compression coupons cut out of the pultruded GFRP profiles
Profile Shape
Nominal
Cross-section Dimensions
[mm]
Flange/Leg Coupons
(Longitudinal)
Web Coupons
(Longitudinal)
Web Coupons
(Transverse) T C T C T C
WF S1 S2
203 x 203 x 9.5 102 x 102 x 6.4
6 6 4 6 6 6
6 - 4 5 6 6
Channel S3 102 x 28.6 x 6.4 - - 6 6 - - Angle S4
S5 76 x 76 x 9.5 76 x 76 x 6.4
6 6 - - - -
6 6 - - - -
Note: T denotes tension and C denotes compression.
MANUSCRIP
T
ACCEPTED
ACCEPTED MANUSCRIPT
Table 2 rev2.docx
Table 2
Mean ultimate loads, stresses, strains, elastic moduli and Poisson’s ratios obtained from tension and compression tests on coupons cut longitudinally and transversely out of the webs and flanges of 203 x 203 x 9.5 mm (Shape S1) and 102 x 102 x 6.4 mm (Shape S2) pultruded GFRP WF profiles
Shape
Coupon
Orientation Coupon Location
Coupons Tested
Ultimate Load
[kN]
Ultimate Stress
[MPa]
Ultimate Strain
[µε]
Elastic Modulus
[GPa]
Major Poisson’s Ratio
Minor Poisson’s Ratio
T C T C T C T C T C T C
S1
Long.
F 6(T) 6(C)
57.60 (4.64) [8.05]
54.71 239.9 (18.66) [7.78]
2261 14000 (1085) [7.75]
- 19.76 (1.50) [7.57]
20.78 (1.94) [9.34]
0.317 (0.016) [5.08]
0.311 (0.014) [4.53]
- -
W 4(T) 6(C)
61.60 (3.63) [5.89]
- 256.1 (15.31) [5.98]
- 13550 (287) [2.12]
- 20.99 (0.79) [3.75]
20.91 (1.50) [7.18]
0.280 (0.012) [4.25]
0.313 (0.010) [3.11]
- -
F + W 10 (T) 12(C)
59.2 (4.68) [7.91]
- 246.4 (19.11) [7.76]
- 13820 (887) [6.42]
- 20.25 (1.40) [6.90]
20.84 (1.74) [8.33]
0.302 (0023) [7.73]
0.312 (0.012) [3.90]
- -
Trans. W 6(T) 6(C)
15.38 (0.52) [3.39]
32.64 (2.64) [8.09]
63.19 (2.16) [3.41]
125.9 (10.21) [8.11]
10622 (988) [9.30]
14484 (1984) [13.70]
9.43 (0.22) [2.28]
9.67 (0.19) [1.92]
- - 0.138 (0.007) [5.16]
0.171 (0.016) [9.64]
S2
Long
F 6(T) 41.35 (2.33) [5.63]
- 265.3 (13.29) [5.01]
- 138673 (896) [6.46]
- 20.704 (0.83) [4.00]
- 0.3214 (0.010) [3.03]
- - -
W 4(T) 6(C)
47.23 (1.54) [3.26]
49.813 (3.73) [7.49]
289.9 (10.97) [3.78]
293.93 (44.86) [15.26]
138003 (245) [1.77]
172002
22.17 (0.36) [1.61]
22.38 (0.85) [3.81]
0.312 (0.021) [6.57]
0.3235 (0.015) [4.65]
- -
F + W 10(T) 43.70 (3.53) [8.09]
- 275.2 (17.28) [6.28]
- 138336 (657) [4.75]
- 21.437 (0.97) [4.54]
- 0.3177 (0.017) [5.26]
- - -
Trans. W 6(T) 6(C)
12.92 (0.40) [3.12]
22.13 (1.31) [5.92]
78.86 (2.34) [2.96]
135.1 (8.08) [5.98]
14934 (515) [3.45]
16592 (1755) [10.58]
9.16 (0.31) [3.37]
10.12 (0.49) [4.88]
- - 0.148 (0.009) [5.89]
0.156 (0.008) [5.30]
Notes: F and W denote coupons cut out of the flanges and webs, respectively; T and C denote coupons tested in tension and compression; numbers in curved and square brackets denote standard deviations and coefficients of variation percentages, respectively 1Only one coupon could be failed due to repeated debonding of the aluminium tabs; 2Derived from two coupon tests; 3Derived from three coupon tests; 4Derived from four coupon tests; 5Derived from five coupon tests; 6Derived from six coupon tests; 7Derived from eight coupon tests
MANUSCRIP
T
ACCEPTED
ACCEPTED MANUSCRIPT
Table 3 rev2.docx
Table 3
Mean ultimate loads, stresses, strains, elastic moduli and major Poisson’s ratios obtained from tension and compression tests on coupons cut longitudinally out of the web and legs of 102 x 28.6 x 6.4 mm (Shape S3), 76 x 76 x 9.5 mm (Shape S4) and 76 x 76 x 6.4 mm (Shape S5) pultruded GFRP profiles
Shape
Coupon
Orientation Coupon Location
Coupons Tested
Ultimate Load
[kN]
Ultimate Stress
[MPa]
Ultimate Strain
[µε]
Elastic Modulus
[GPa]
Major Poisson’s Ratio
T C T C T C T C T C S3
Long.
W
6(T) 6(C)
61.95 (2.39) [3.85]
55.01 (2.16) [3.93]
392.6 (13.19) [3.36]
344.7 (17.26) [5.01]
195772 (1243) [6.35]
14504 (823) [5.67]
23.39 (0.44) [1.86]
23.40 (0.18) [0.75]
0.298 (0.027) [8.96]
0.307 (0.021) [6.96]
S4 L
64.66 (3.13) [4.84]
82.601 271.5 (11.34) [4.18]
351.51 12726 (1672) [13.14]
- 22.02 (0.91) [4.14]
21.70 (0.87) [4.02]
0.327 (0.024 [7.22])
0.337 (0.015) [4.43]
S5 53.03 (1.99) [3.75]
55.28 (3.10) [5.60]
332.0 (12.82) [3.86]
341.6 (19.10) [5.59]
15010 (704) [4.69]
14419 (564) [3.91]
24.80 (1.23) [4.96]
24.04 (1.22) [5.07]
0.302 (0.023) [7.51]
0.323 (0.005) [1.46]
Notes: L and W denote legs and web of the profile, respectively; C and T denote coupons tested in compression and tension, respectively Numbers in curved and square brackets denote standard deviations and coefficients of variation percentages, respectively 1Only one coupon could be failed due to repeated debonding of the aluminium tabs; 2Derived from four coupon tests
MANUSCRIP
T
ACCEPTED
ACCEPTED MANUSCRIPT
Table 4 rev2.docx
Table 4
Characteristic ultimate stresses, strains, elastic moduli and Poisson’s ratios and pultruders’ corresponding minimum values


![GFRP [Resin Infusion]](https://static.documents.pub/doc/80x56/546e67d4af795971298b5642/gfrp-resin-infusion.jpg)